1. Introduction
Because electronic signal processing systems have a bottleneck of low bandwidth, the use of photonic approaches to realize real time signal processing is becoming increasingly popular [
1,
2,
3,
4,
5]. In addition, it is desirable in many practical applications that sophisticated signal processing tasks are done remotely and well away from the source of the signal, e.g., an antenna. However, traditional approaches to implement a photonic signal processing unit do not isolate the transmitter from the receiver [
2,
6] as a Mach-Zehnder modulator (MZM) is typically used to perform the multiplication required for the correlation function.
In recent days, nonlinear optical mixing like FWM is becoming a key interest of research as it can be used to overcome the current limitations. The aim of this paper is to report recent investigations on the use of nonlinear FWM in Highly Nonlinear Fibre (HNLF) to achieve the desired signal processing. Furthermore, the use of FWM is extended to employ it to realize negative accumulation optically and thus remove the need for the use of electronic processing even when subtraction between optical signals is required. The preference of FWM over other fibre based nonlinear effects like self-phase modulation (SPM) or cross-phase modulation (XPM) is also discussed as it is an instantaneous phenomenon and is therefore transparent to bit rate and data format of the signal [
7].
Section 2 contains an insight on FWM. This paper heavily covers the utilization of FWM phenomenon and a detailed analytical explanation as well as inherent properties of FWM are provided and discussed in this section.
Section 3.1 presents a practical implementation of a pattern recognition technique utilizing FWM. Optical mixing of template wavelengths with a pump wavelength, which has been modulated by an input bit stream, in order to produce copies of the input signal at the output idler wavelengths, is done in a length of HNLF [
8]. The results show that a correlation function is achieved optically.
Section 3.2 illustrates a useful extension of the concept of
Section 3.1 by selecting the template with a software controlled optical processor instead of physically turning on/off the laser diodes as was done in the experiment of
Section 3.1. This approach allows a true remoting of the transmitter.
Section 3.3 discusses an optical technique for the concept of negative accumulation of optical power optically. The FWM property is exploited to achieve subtraction between two optical signals. When the relative phase difference between two pump wavelengths is π/2 radians, in the mixing process the generated idler has a phase difference of π radians with respect to other idlers at the same frequency and this π radians phase shift leads to negative accumulation of the signal optically.
Section 4 summarizes the work undertaken in the research, draws some conclusions and mentions possible future work.
2. Four Wave Mixing
FWM is a nonlinear effect arising from a third-order optical nonlinearity, as is described by a χ
(3) coefficient. The concept of three electromagnetic fields interacting to produce a fourth field is central to the description of all FWM processes. It is a nonlinear phenomenon which allows optical wavelength conversion. It can occur if at least two different frequency components propagate together in a nonlinear medium such as a HNLF or a semiconductor optical amplifier (SOA). In the area of signal processing, optical FWM has been used to perform frequency conversion [
9], spatial information processing [
10] and frequency measurement [
11]. The origin of the FWM process lies in the nonlinear response of bound electrons of a material to an applied optical field. To understand the FWM effect, let us consider a WDM signal, which is a sum of “
n” monochromatic plane waves. Following the approach described in [
12], we can consider the total electric field of a signal as a summation of “
n” plane waves as in Equation (1);
where
Ep is the amplitude, ω
p is the frequency and
kp is the propagation constant of the optical fields. The nonlinear polarization is given by
As in [
12], by considering the total electric field as that expressed by Equation (1), Equation (2) becomes,
By expansion of Equation (3) we get,
The first term in Equation (4) includes intensity dependent refractive index terms which represent the effect of SPM and XPM. The second, third and fourth terms can be neglected because of a phase mismatch which evolves between the optical fields as they propagate along the fibre. The reason behind this phase mismatch is that in an optical fibre the propagation constant is frequency dependent so that k(3ω) ≠ 3k(ω). When there is a varying phase mismatch between the propagating waves the coupling of energy between waves with distance averages to zero. The phase mismatch can also be understood as the mismatch in phase between different signals travelling within the fibre at different group velocities. These terms can be neglected because they contribute little effect. The last term In Equation (4) represents the phenomenon of FWM [
13]. If the wavelengths in the WDM system are closely spaced so that the relative fibre dispersion is small, or they are located near the zero dispersion wavelength of the fibre, then the propagation constants of the wavelength channels are nearly constant and the phase-matching condition is nearly satisfied. When this is so, the power generated at these sum and difference frequencies can be quite significant [
14].
FWM is often used for wavelength conversion in photonic signal processing applications. Among the various nonlinear phenomena exploited for fibre-based wavelength conversion, FWM is regarded as advantageous due to its transparency both in terms of modulation format and bit rate [
15]. FWM-based wavelength converters have been demonstrated in a range of optical fibres including W-type soft glass fibre [
16], highly nonlinear photonic crystal fibre [
17] and HNLF [
18].
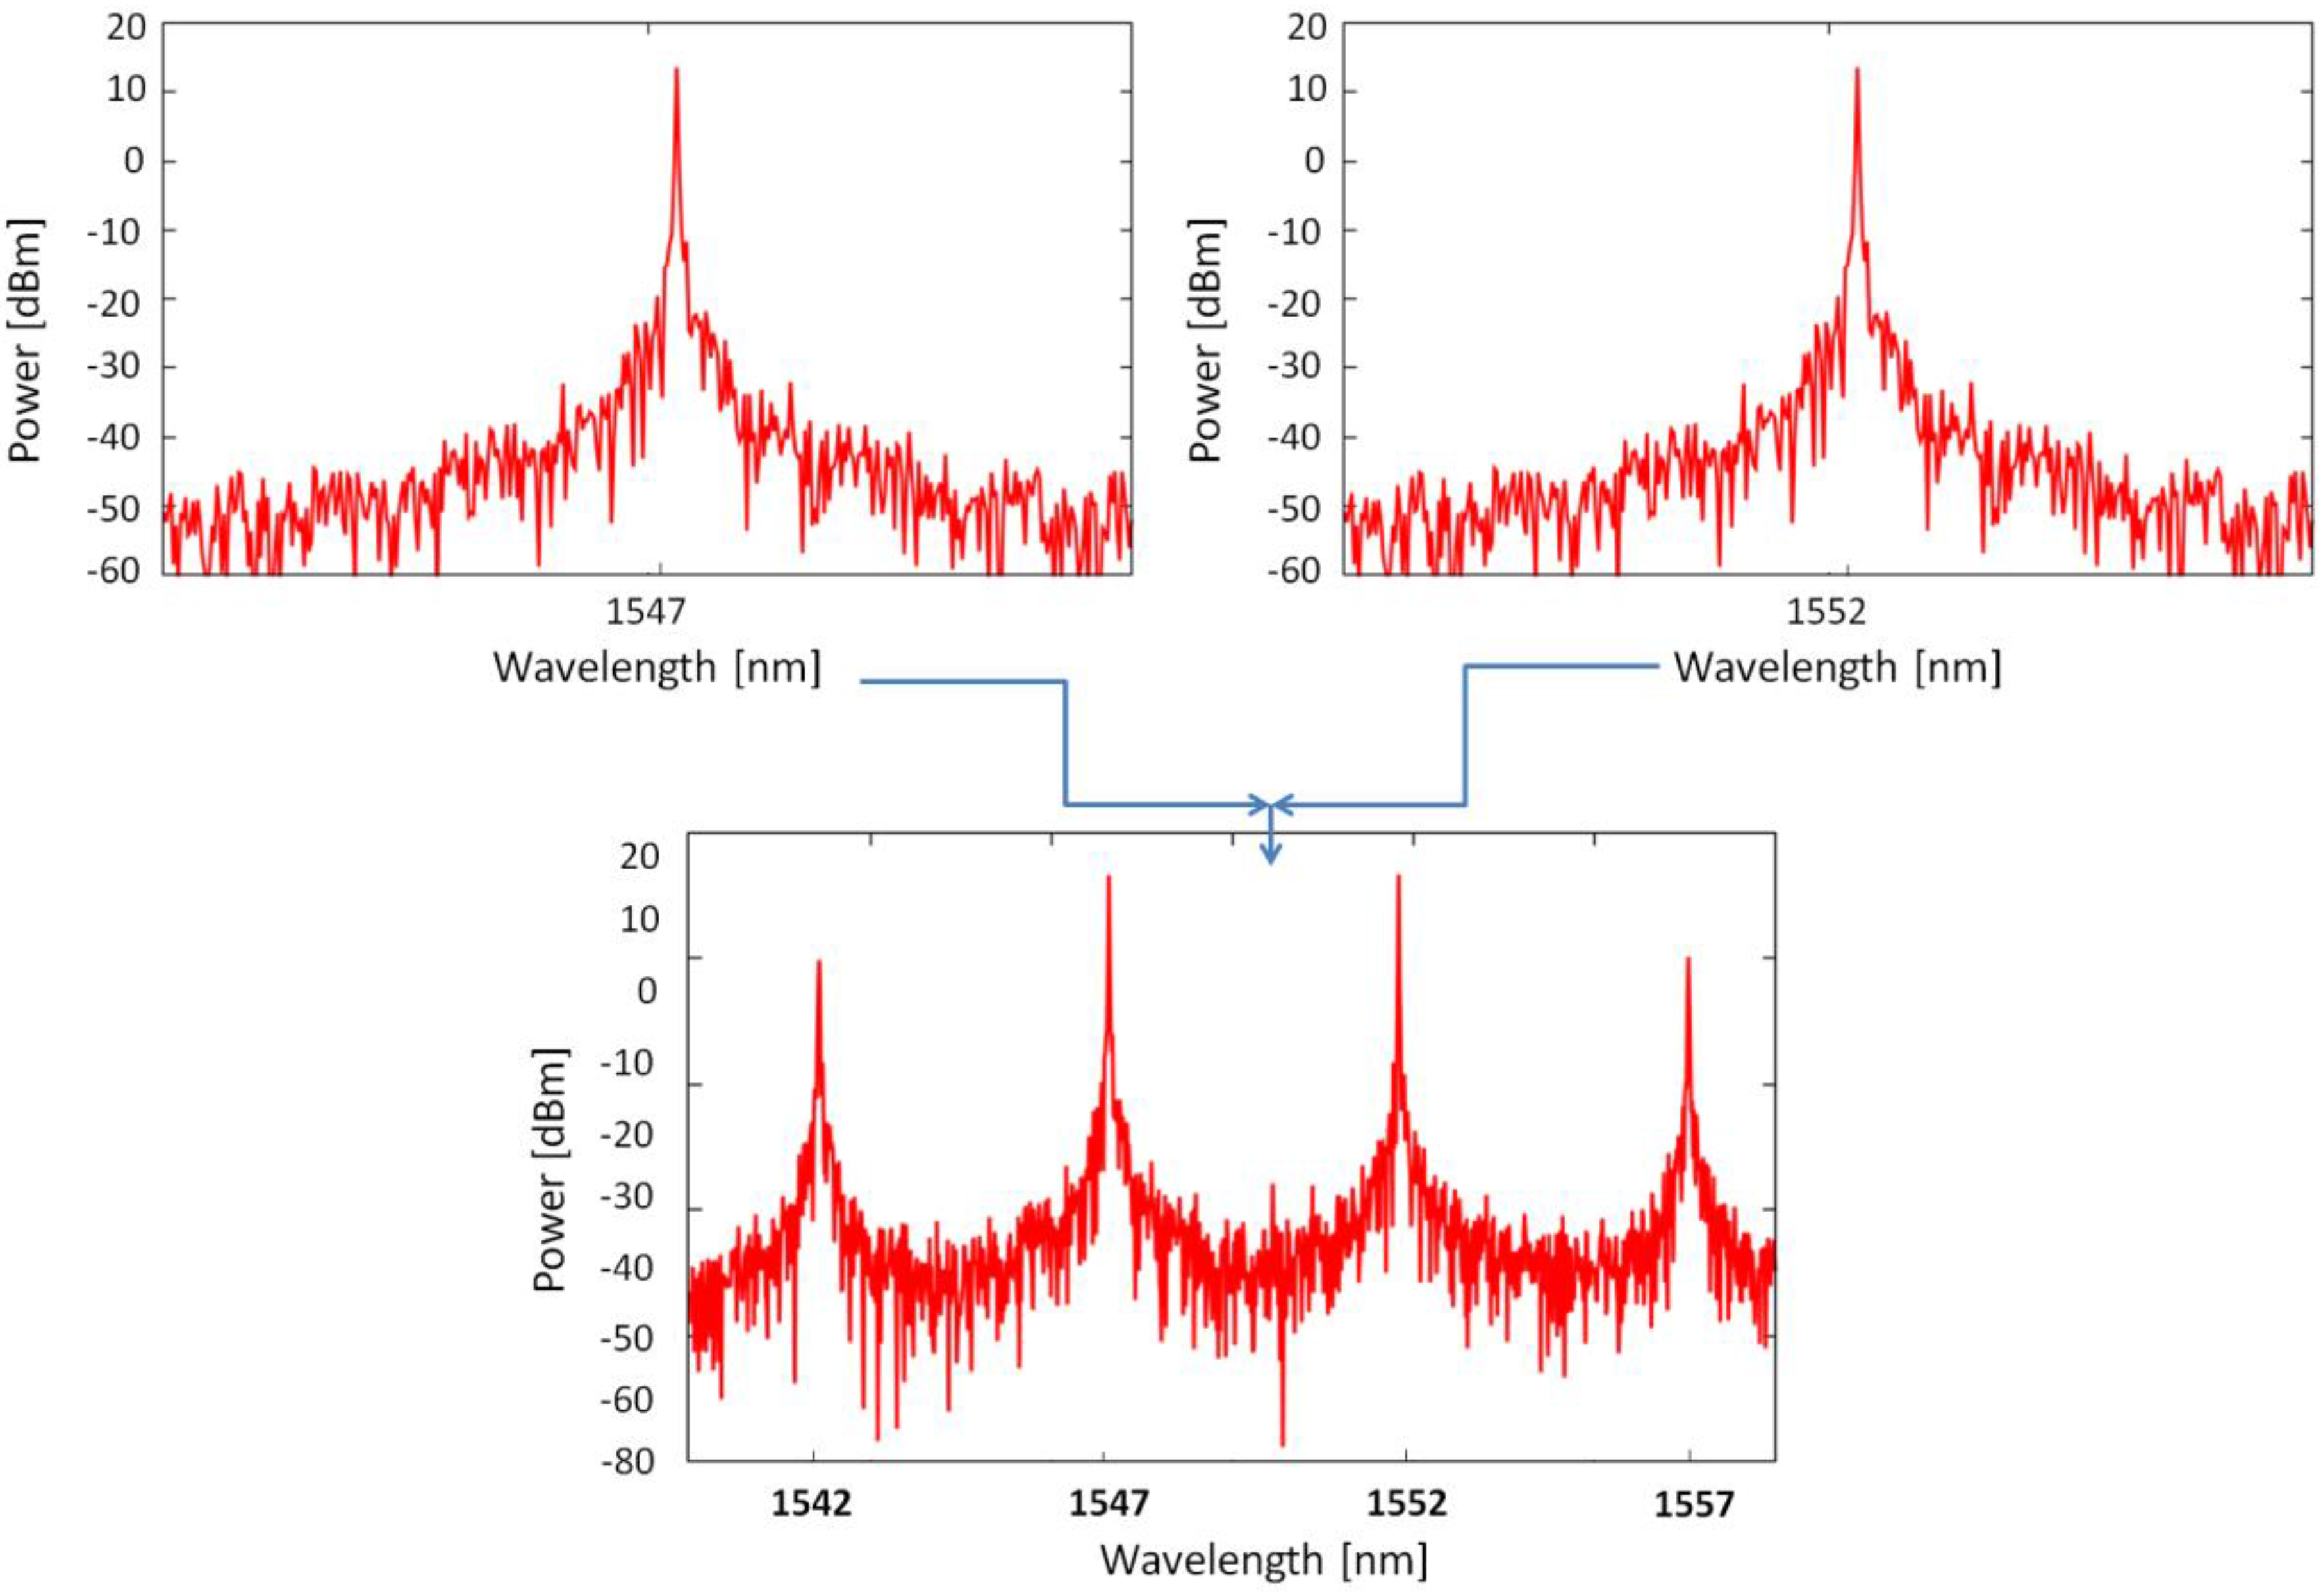
Figure 1 below is a demonstration of FWM effect in a HNLF. In basic terms, FWM is the mixing of three wavelengths to produce a fourth wavelength such that ω
4 = ω
1 + ω
2 − ω
3. Note that for the special case when ω
1 = ω
2, two frequencies can produce a third such that ω
4 = 2ω
1 − ω
3. Commonly, a high power pump laser at ω
p can be used to convert a signal frequency ω
s to a new frequency at 2ω
p − ω
s, which is often known as the idler frequency, ω
i. In terms of wavelength, λ
i ≈ 2λ
p − λ
s. Similarly, an idler can be produced at 2λ
s − λ
p.
Figure 1.
Illustration of the Four Wave Mixing (FWM) process in a Highly Nonlinear Fibre (HNLF).
Figure 1.
Illustration of the Four Wave Mixing (FWM) process in a Highly Nonlinear Fibre (HNLF).
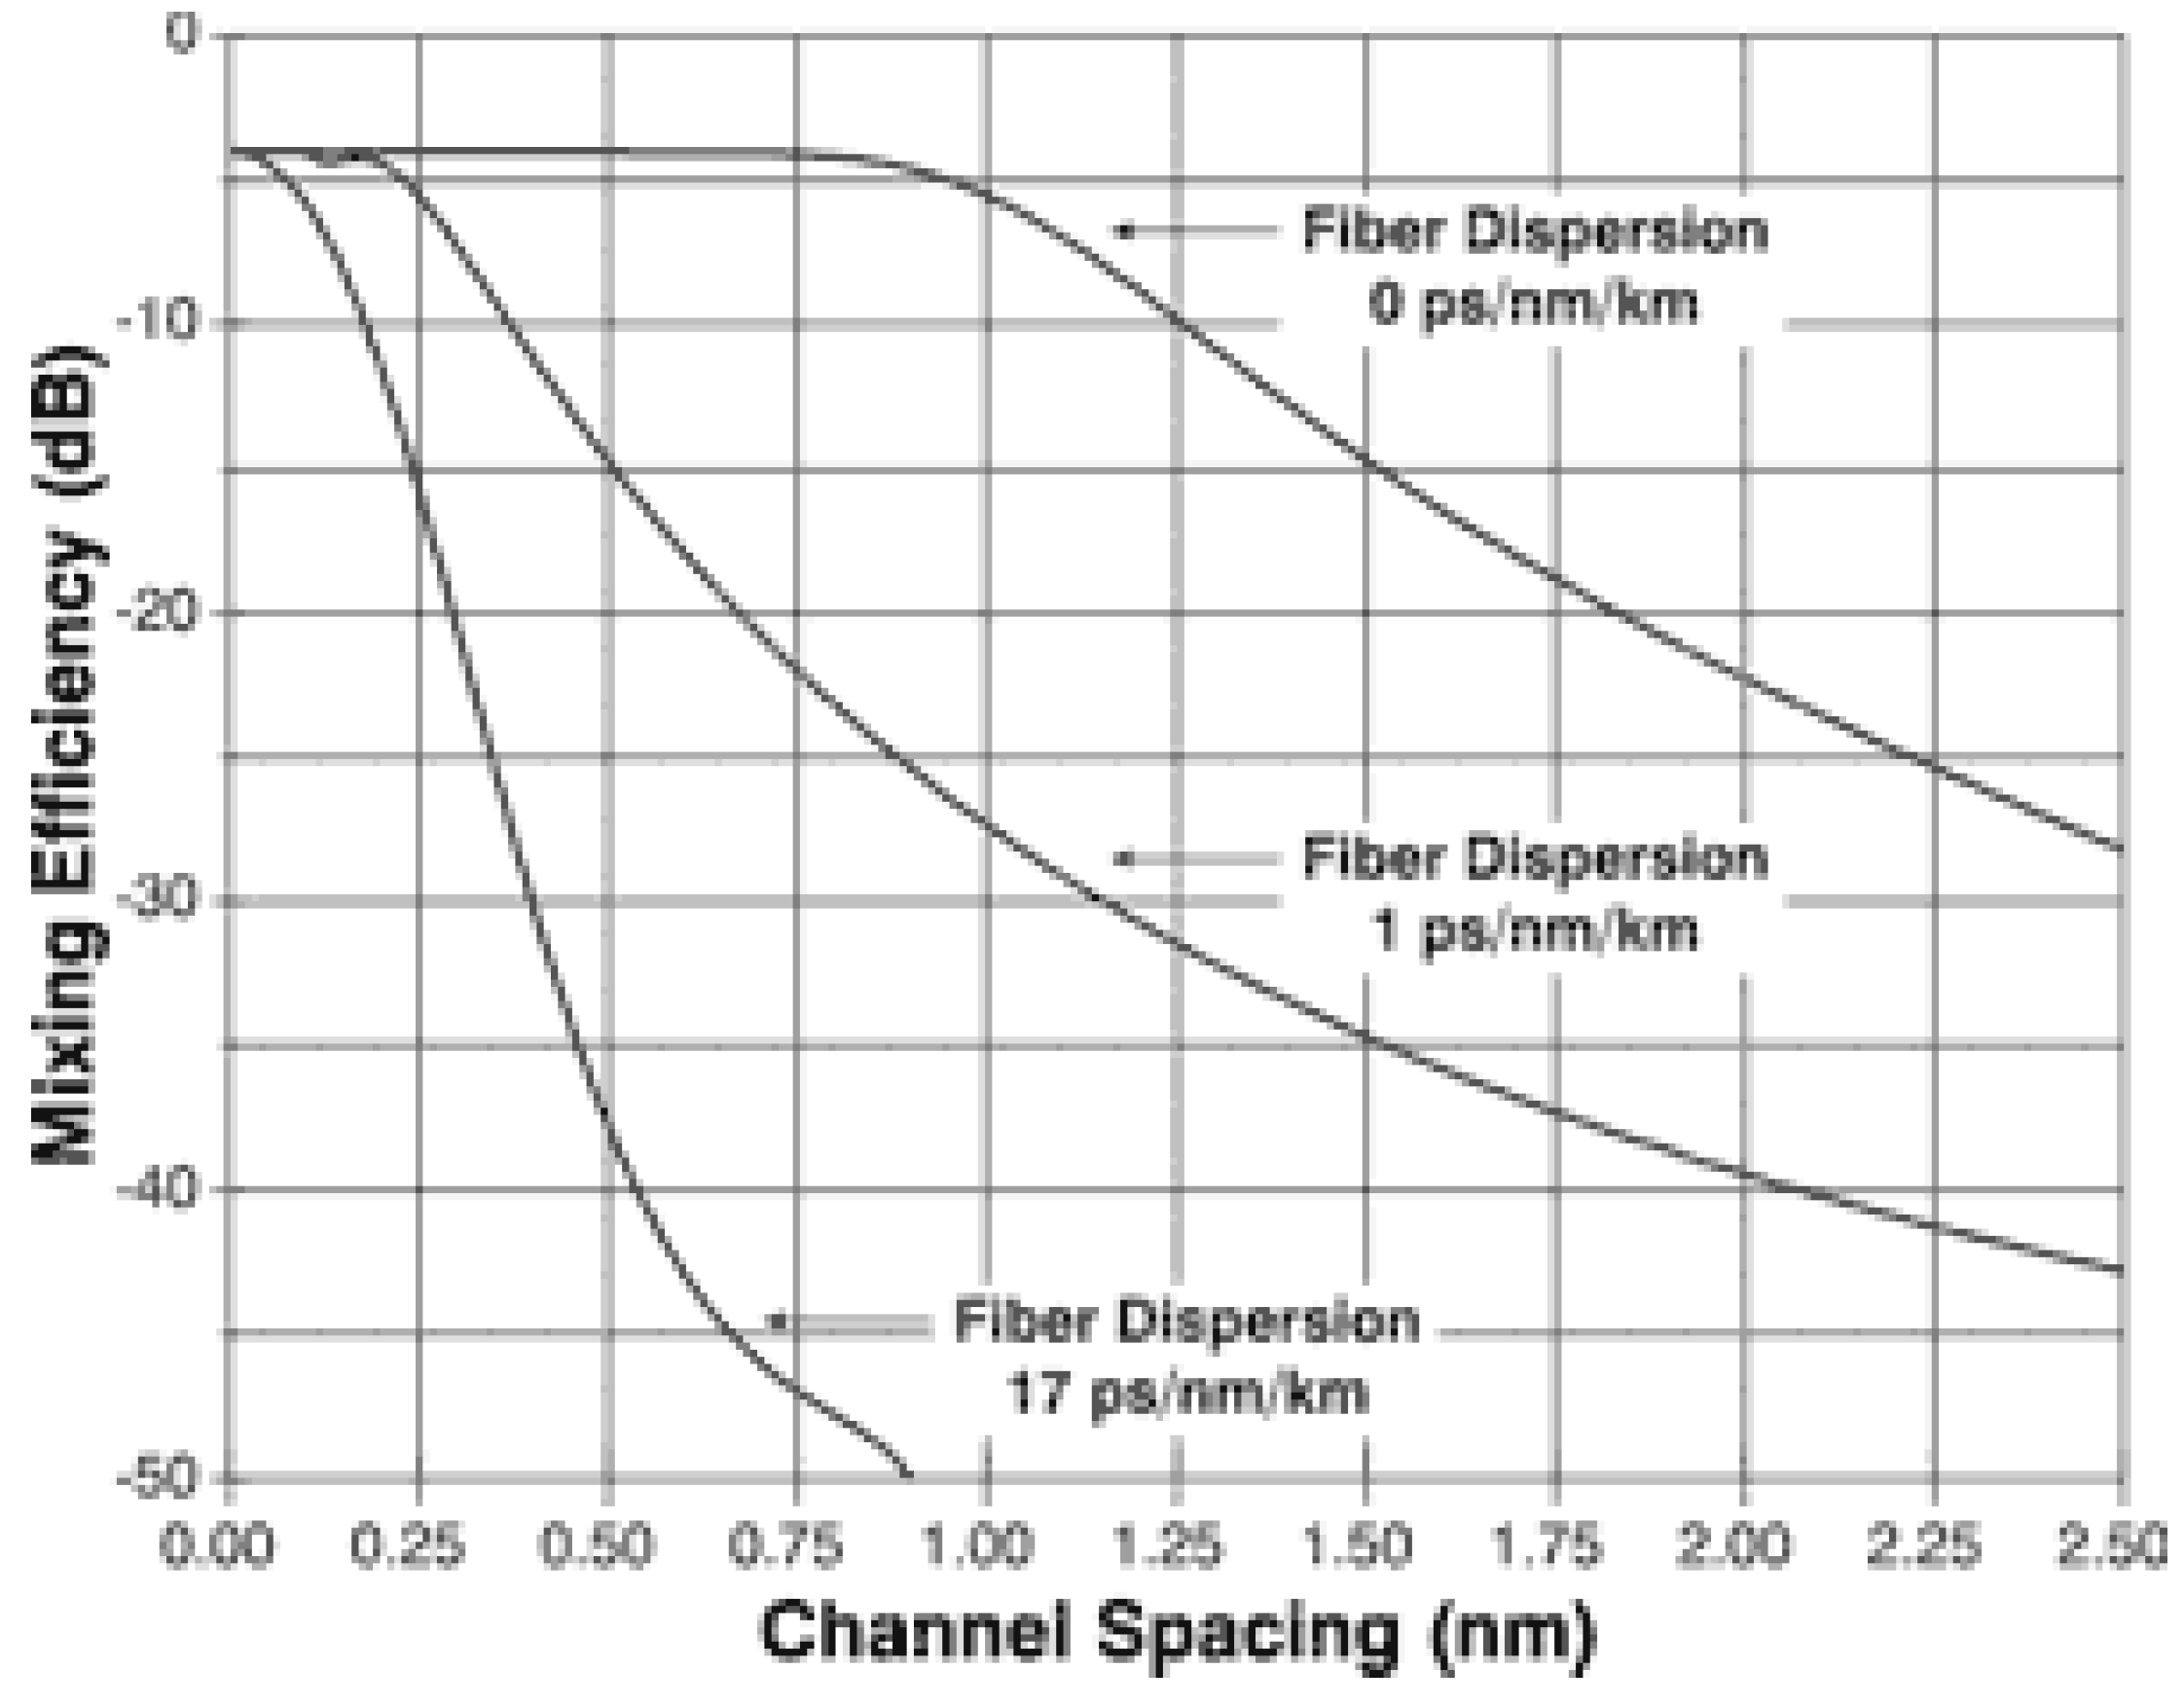
As discussed above, FWM requires phase matching of the propagating waves. This requires small chromatic dispersion in the fibre and/or small wavelength spacing between the propagating waves. FWM mixing efficiency scales inversely with wavelength or channel spacing when the fibre dispersion is non-zero. The wavelength spacing must decrease as the fibre dispersion increases in order to maintain a given mixing efficiency.
Figure 2 is a plot of calculated FWM mixing efficiency as a function of channel spacing for various values of fibre dispersion. It can be proven in theory and is evident in
Figure 2 that the smaller the dispersion or the smaller the wavelength spacing, the larger the FWM mixing efficiency.
Figure 2.
Variation in mixing efficiency with wavelength spacing [
19].
Figure 2.
Variation in mixing efficiency with wavelength spacing [
19].
3. Utilization of FWM
This section discusses photonic wavelength conversion and pattern recognition techniques using FWM in a length of HNLF. FWM has been used to mix wavelength channels with a pump wavelength which has been modulated by an input bit stream in order to produce copies of the input signal at the output idler wavelengths [
8,
20]. These idler wavelengths are differentially delayed and summed at a photoreceiver to produce the required correlation function.
3.1. Time Spectral Convolution Based Pattern Recognition
A microwave photonics based approach to realize ultrafast correlation is becoming popular considering the potential very broad bandwidth of photonic technologies. In recent years, numerous research groups have worked in this particular area. One approach which uses FWM for this purpose is discussed in detail here.
The concept of obtaining a correlation from a time-spectral convolution was first proposed by Park and Azana in [
2]. The convolution process is defined by the Equation (5).
For correlation of bit patterns, the discrete form of the correlation function is more appropriate. Below is the equation which was presented as Equation (5) to represent correlation for discrete signals.
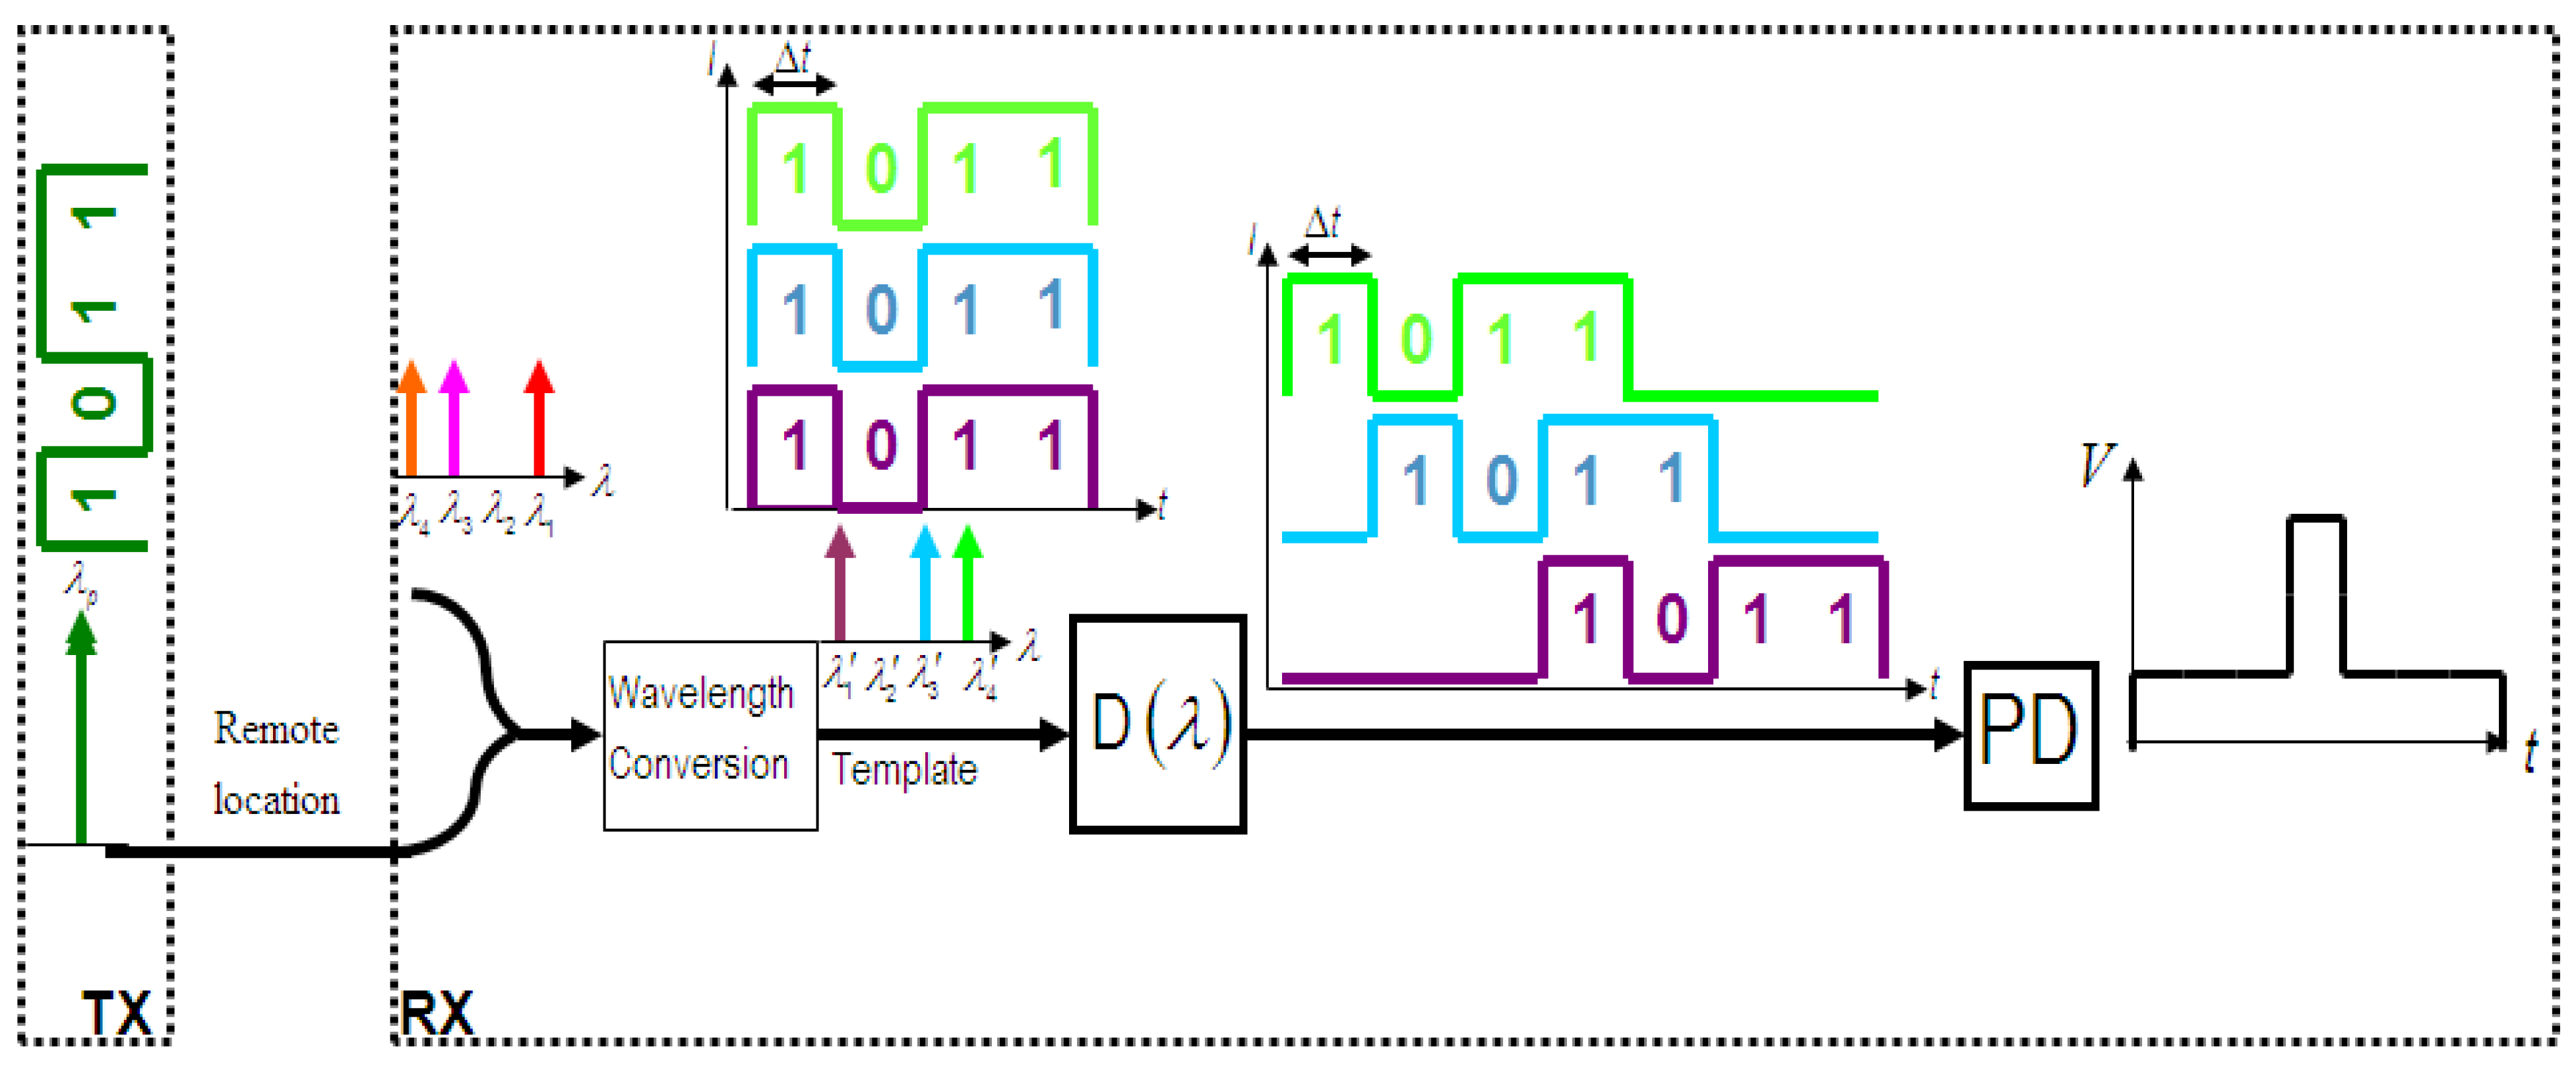
In this new system, the bit pattern on one wavelength is copied onto several other wavelengths using wavelength conversion; in particular, FWM wavelength conversion is used. The proposed method is shown in
Figure 3. A pump wavelength is first modulated by the unknown input bit stream. This part of the system is called the transmitter (TX) and can be done at a remote location. The modulated pump is then sent to the receiver (RX) where it is mixed with a number of CW wavelength channels in a length of HNLF. FWM in the HNLF creates numerous idler wavelengths, each with a copy of the input bit stream. The reference bit pattern or template is represented by the idler wavelengths which are created during the FWM process. These are determined by the choice of the CW wavelength channels which are mixed with the pump wavelength. The idler wavelengths are filtered and differentially delayed with delays corresponding to multiples of a bit period and then summed at a photoreceiver to provide the correlation function.
Figure 3.
Illustration of the working principle of the proposed HNLF based correlation scheme.
Figure 3.
Illustration of the working principle of the proposed HNLF based correlation scheme.
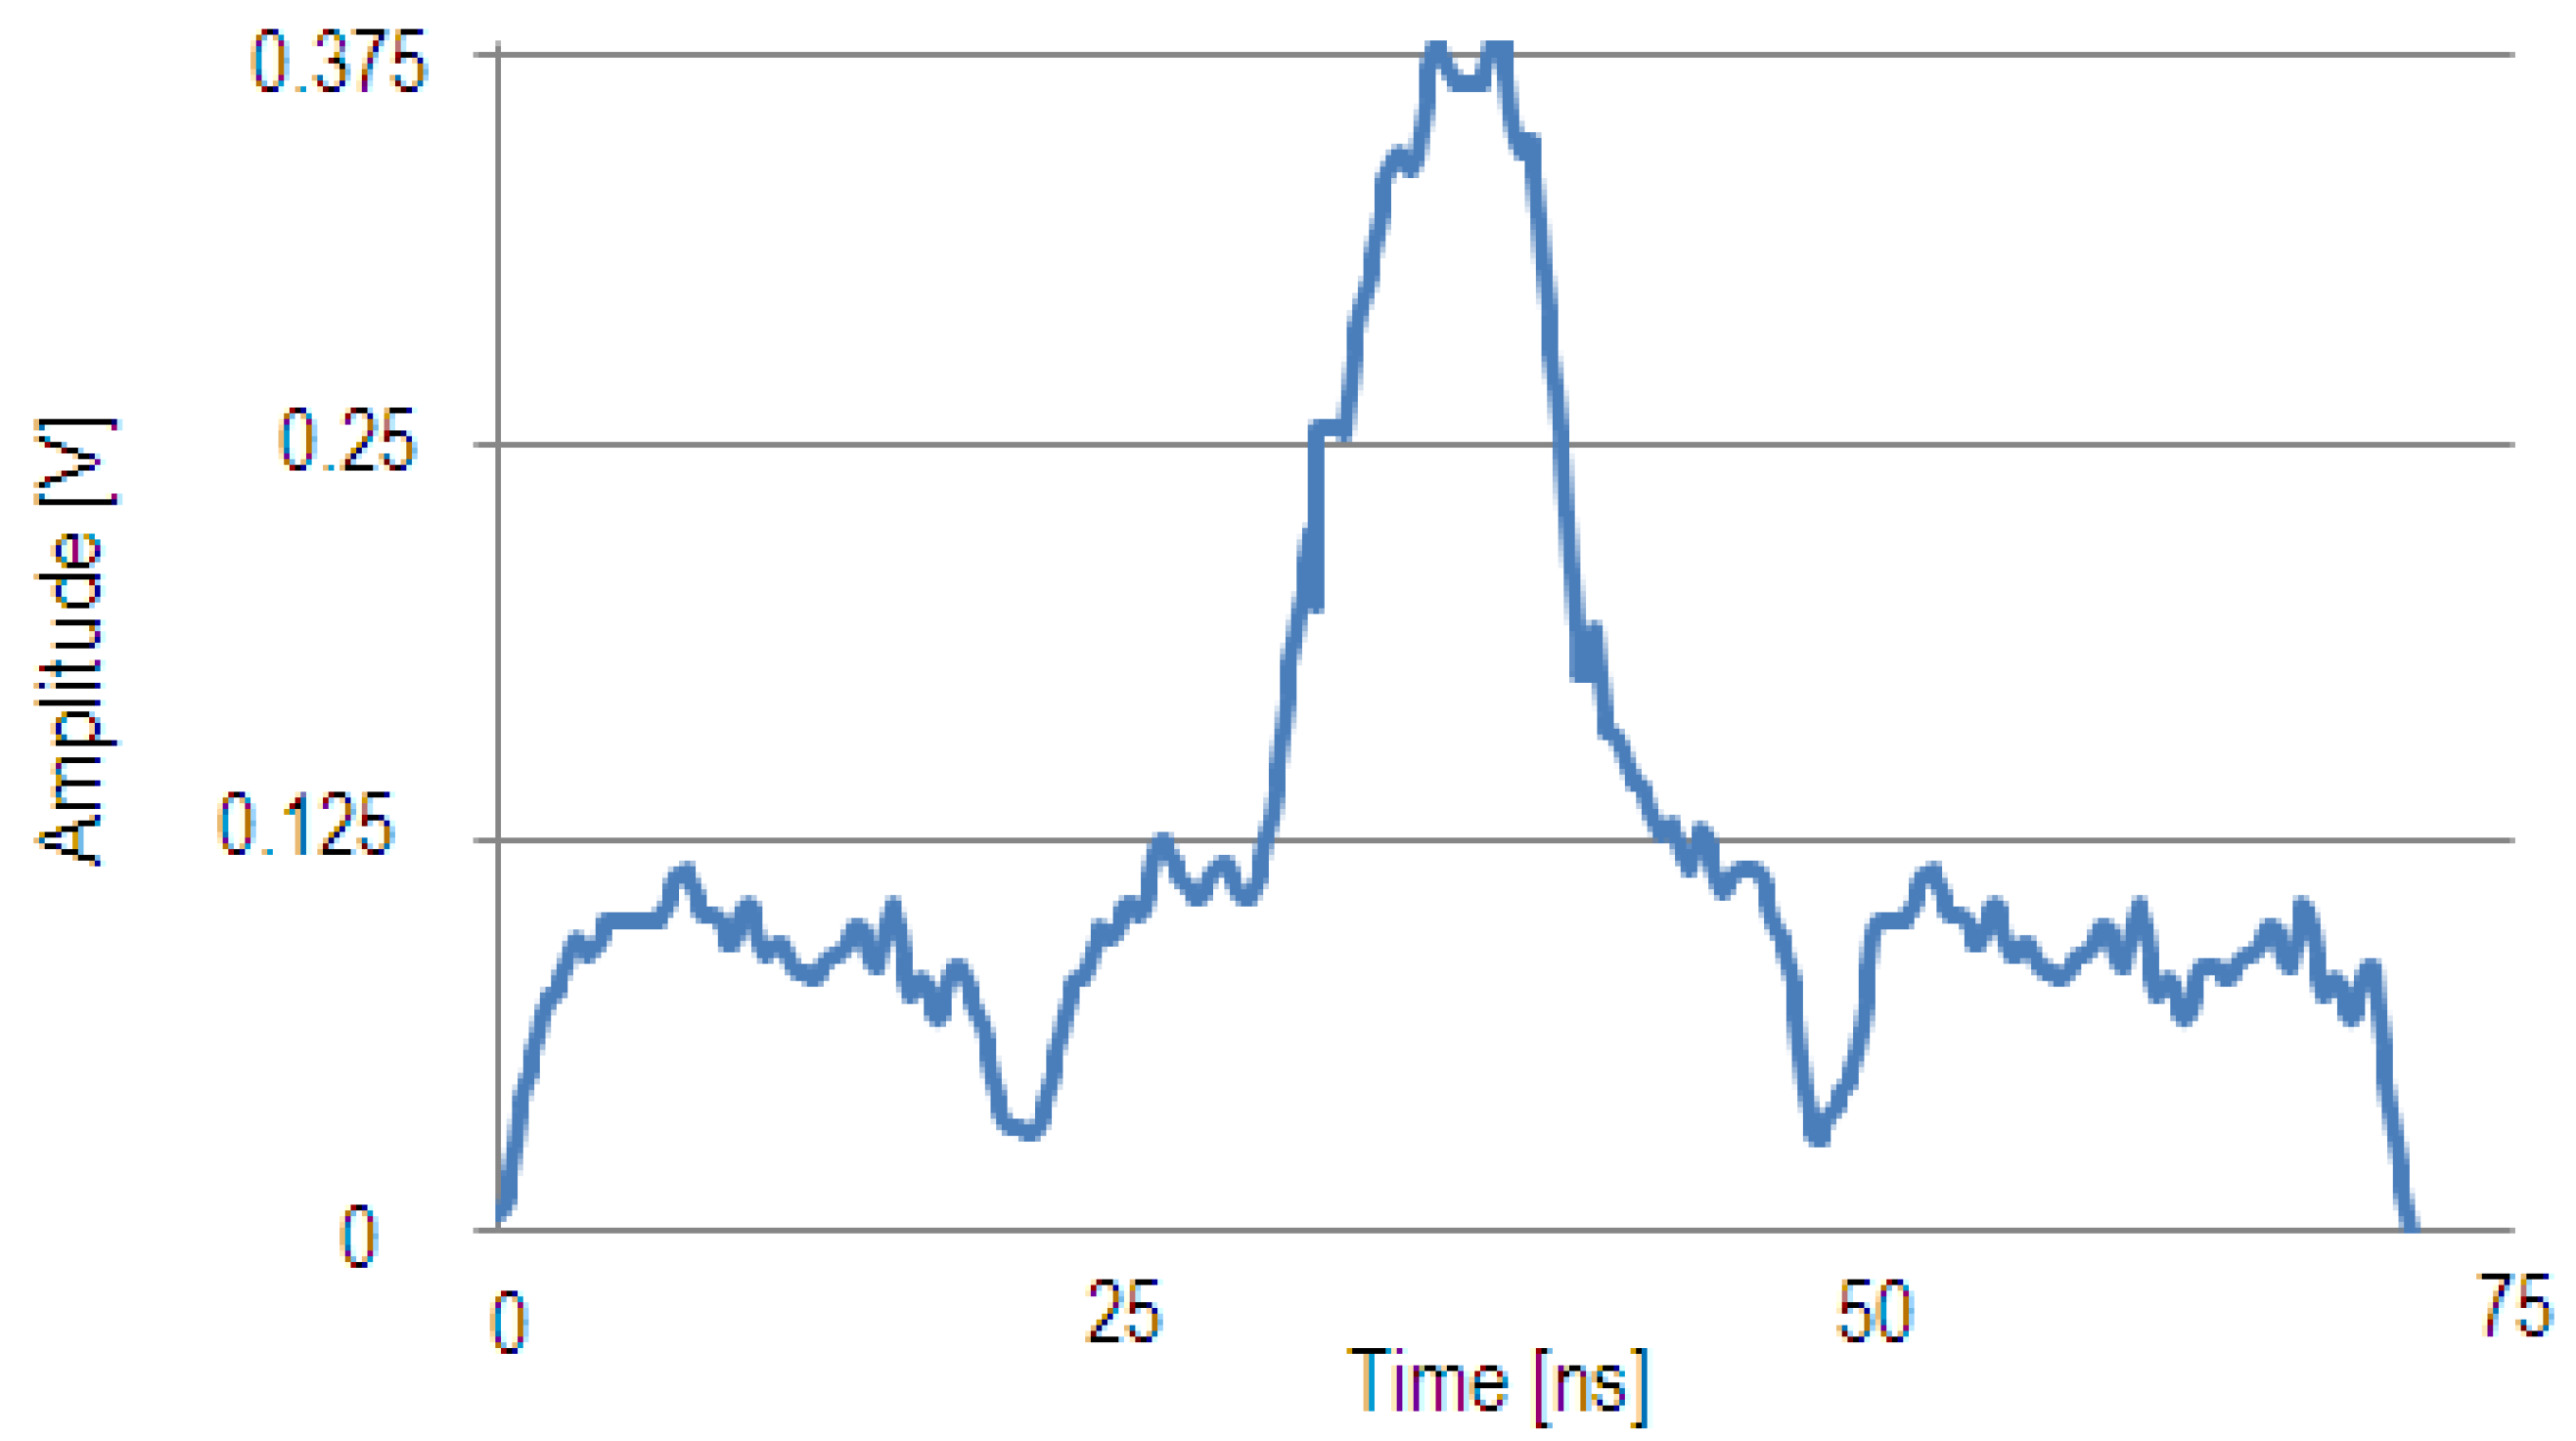
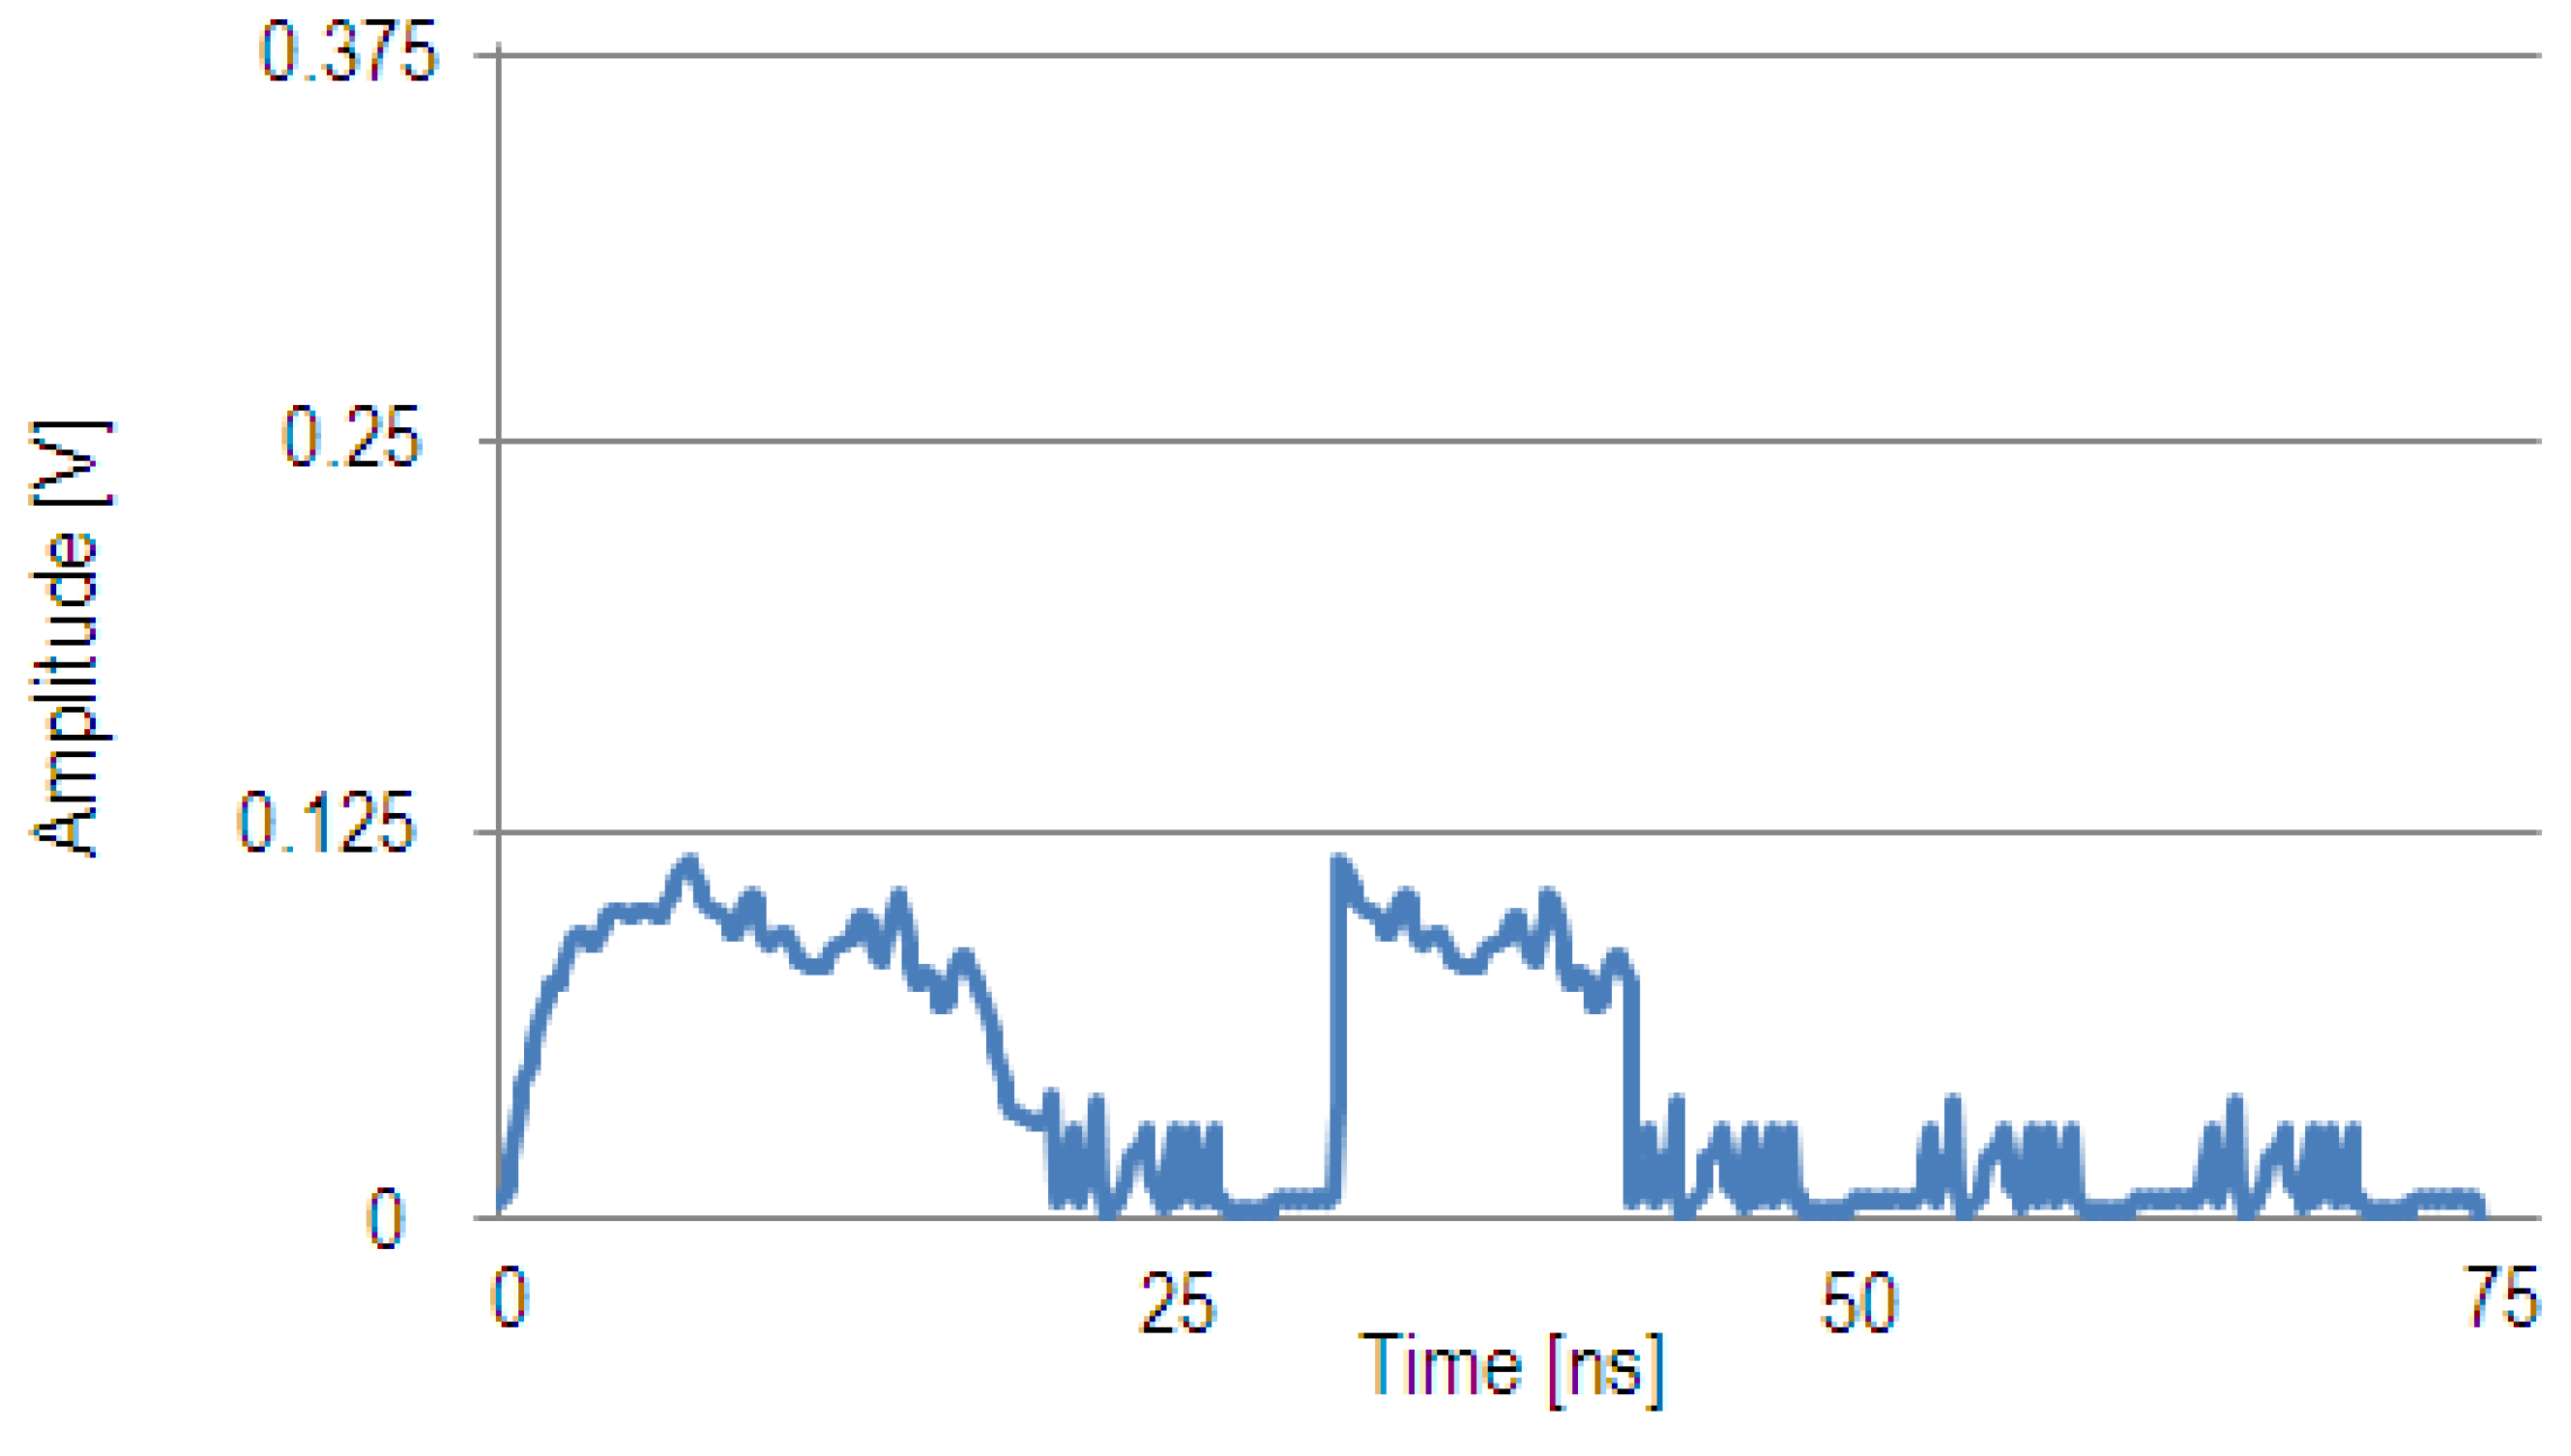
The correlation function for matched and mismatched input bit patterns is demonstrated. In
Figure 4, the solid blue line shows the measured correlation function at the photoreceiver output when all three idler wavelengths are present and the input bit pattern (1011) matches the reference bit pattern. When there is a match between the input bit pattern and the reference bit pattern, a correlation peak occurs at the middle of the correlation function, which is at the end of the original bit pattern (bit 4). The height of the correlation peak is equal to the height of a detected “1” multiplied by the number of “1”s in the template, which in this case is 3 (3 × 0.125 V = 0.375 V).
Figure 5 demonstrates the output correlation function with a mismatched input pattern. Here the input pattern is 1000 which is different from the reference pattern 1011. It is a large mismatch case and the peak of the output correlation function for the mismatched pattern is only “1” unit which is equal to the amplitude of only one “1” of the system. In this case this is 1 × 0.125 V = 0.125 V.
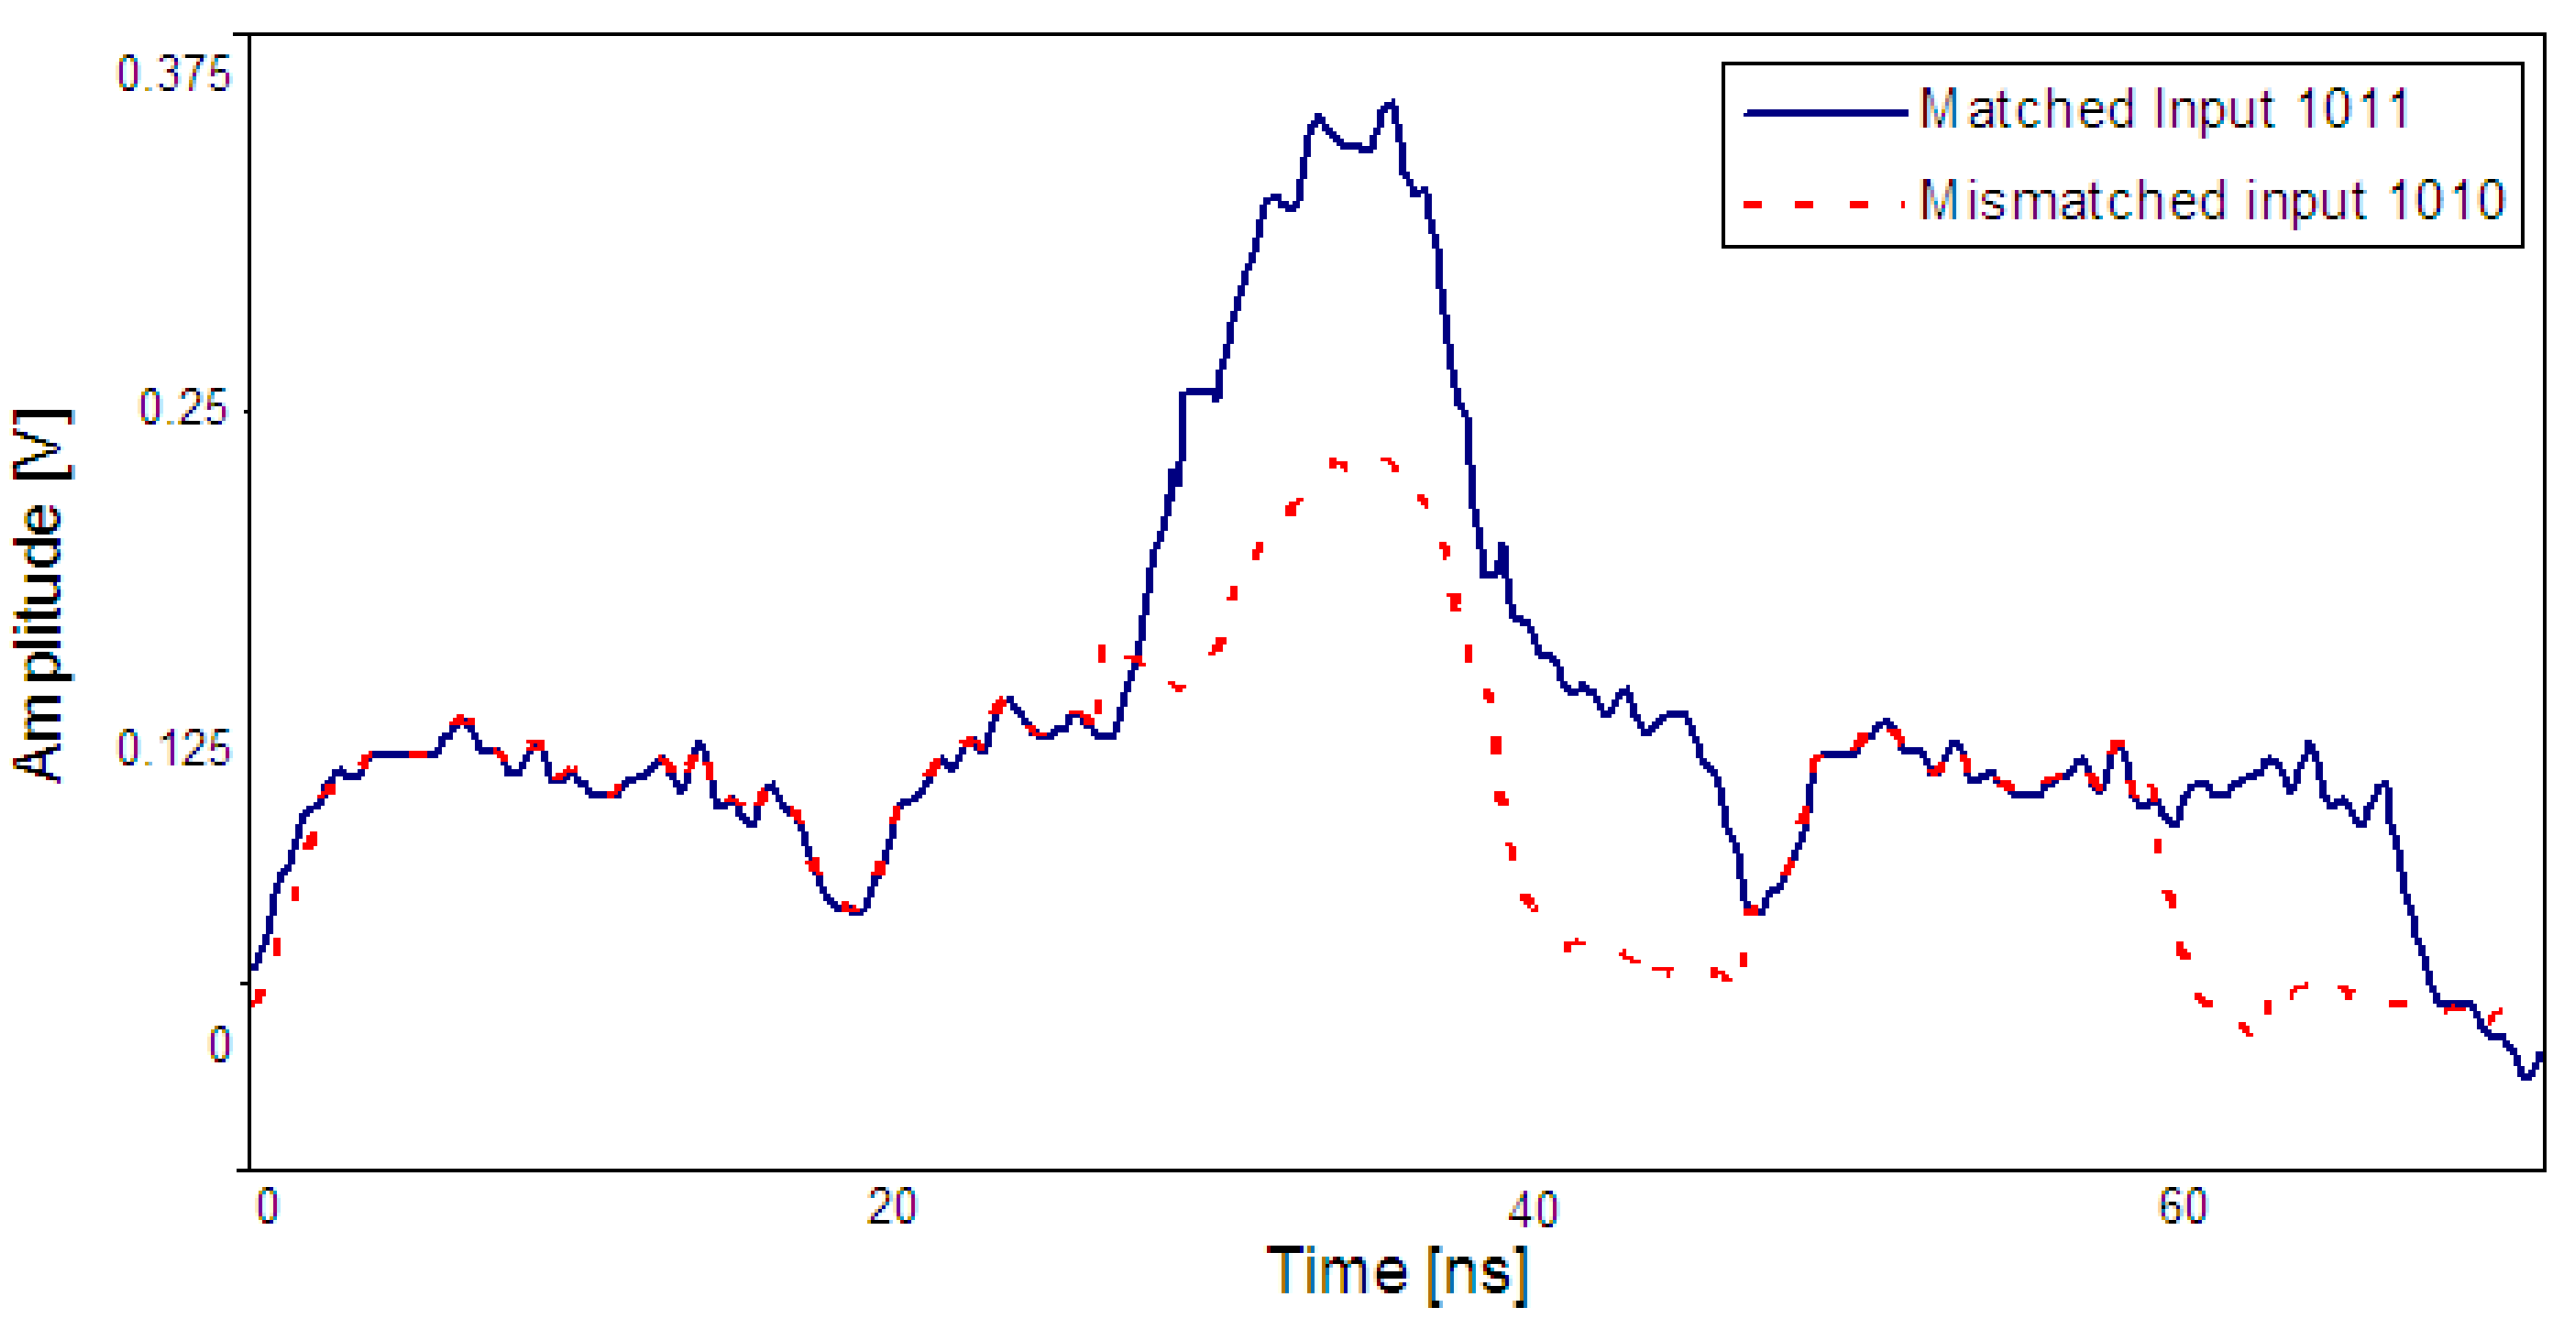
Figure 6 compares the measured output for the matched input matched (input 1011) with a worst-case mismatched input (input 1010). This worst-case input was determined from a truth table exercise. As is visible in the
Figure 6 the correlation peak for the matched case is at least “1” unit larger than that for a mismatched signal.
Figure 4.
Correlation output with matched input signal 1011.
Figure 4.
Correlation output with matched input signal 1011.
Figure 5.
Correlation output with a mismatched input signal 1000.
Figure 5.
Correlation output with a mismatched input signal 1000.
Figure 6.
Correlation output with matched input 1011 and worst-case mismatched input signal 1010.
Figure 6.
Correlation output with matched input 1011 and worst-case mismatched input signal 1010.
3.2. Remote Transmitter Correlation Using FWM
In
Section 3.1 a correlation technique based on FWM was discussed. In that technique, the template, represented by wavelengths λ
1 − λ
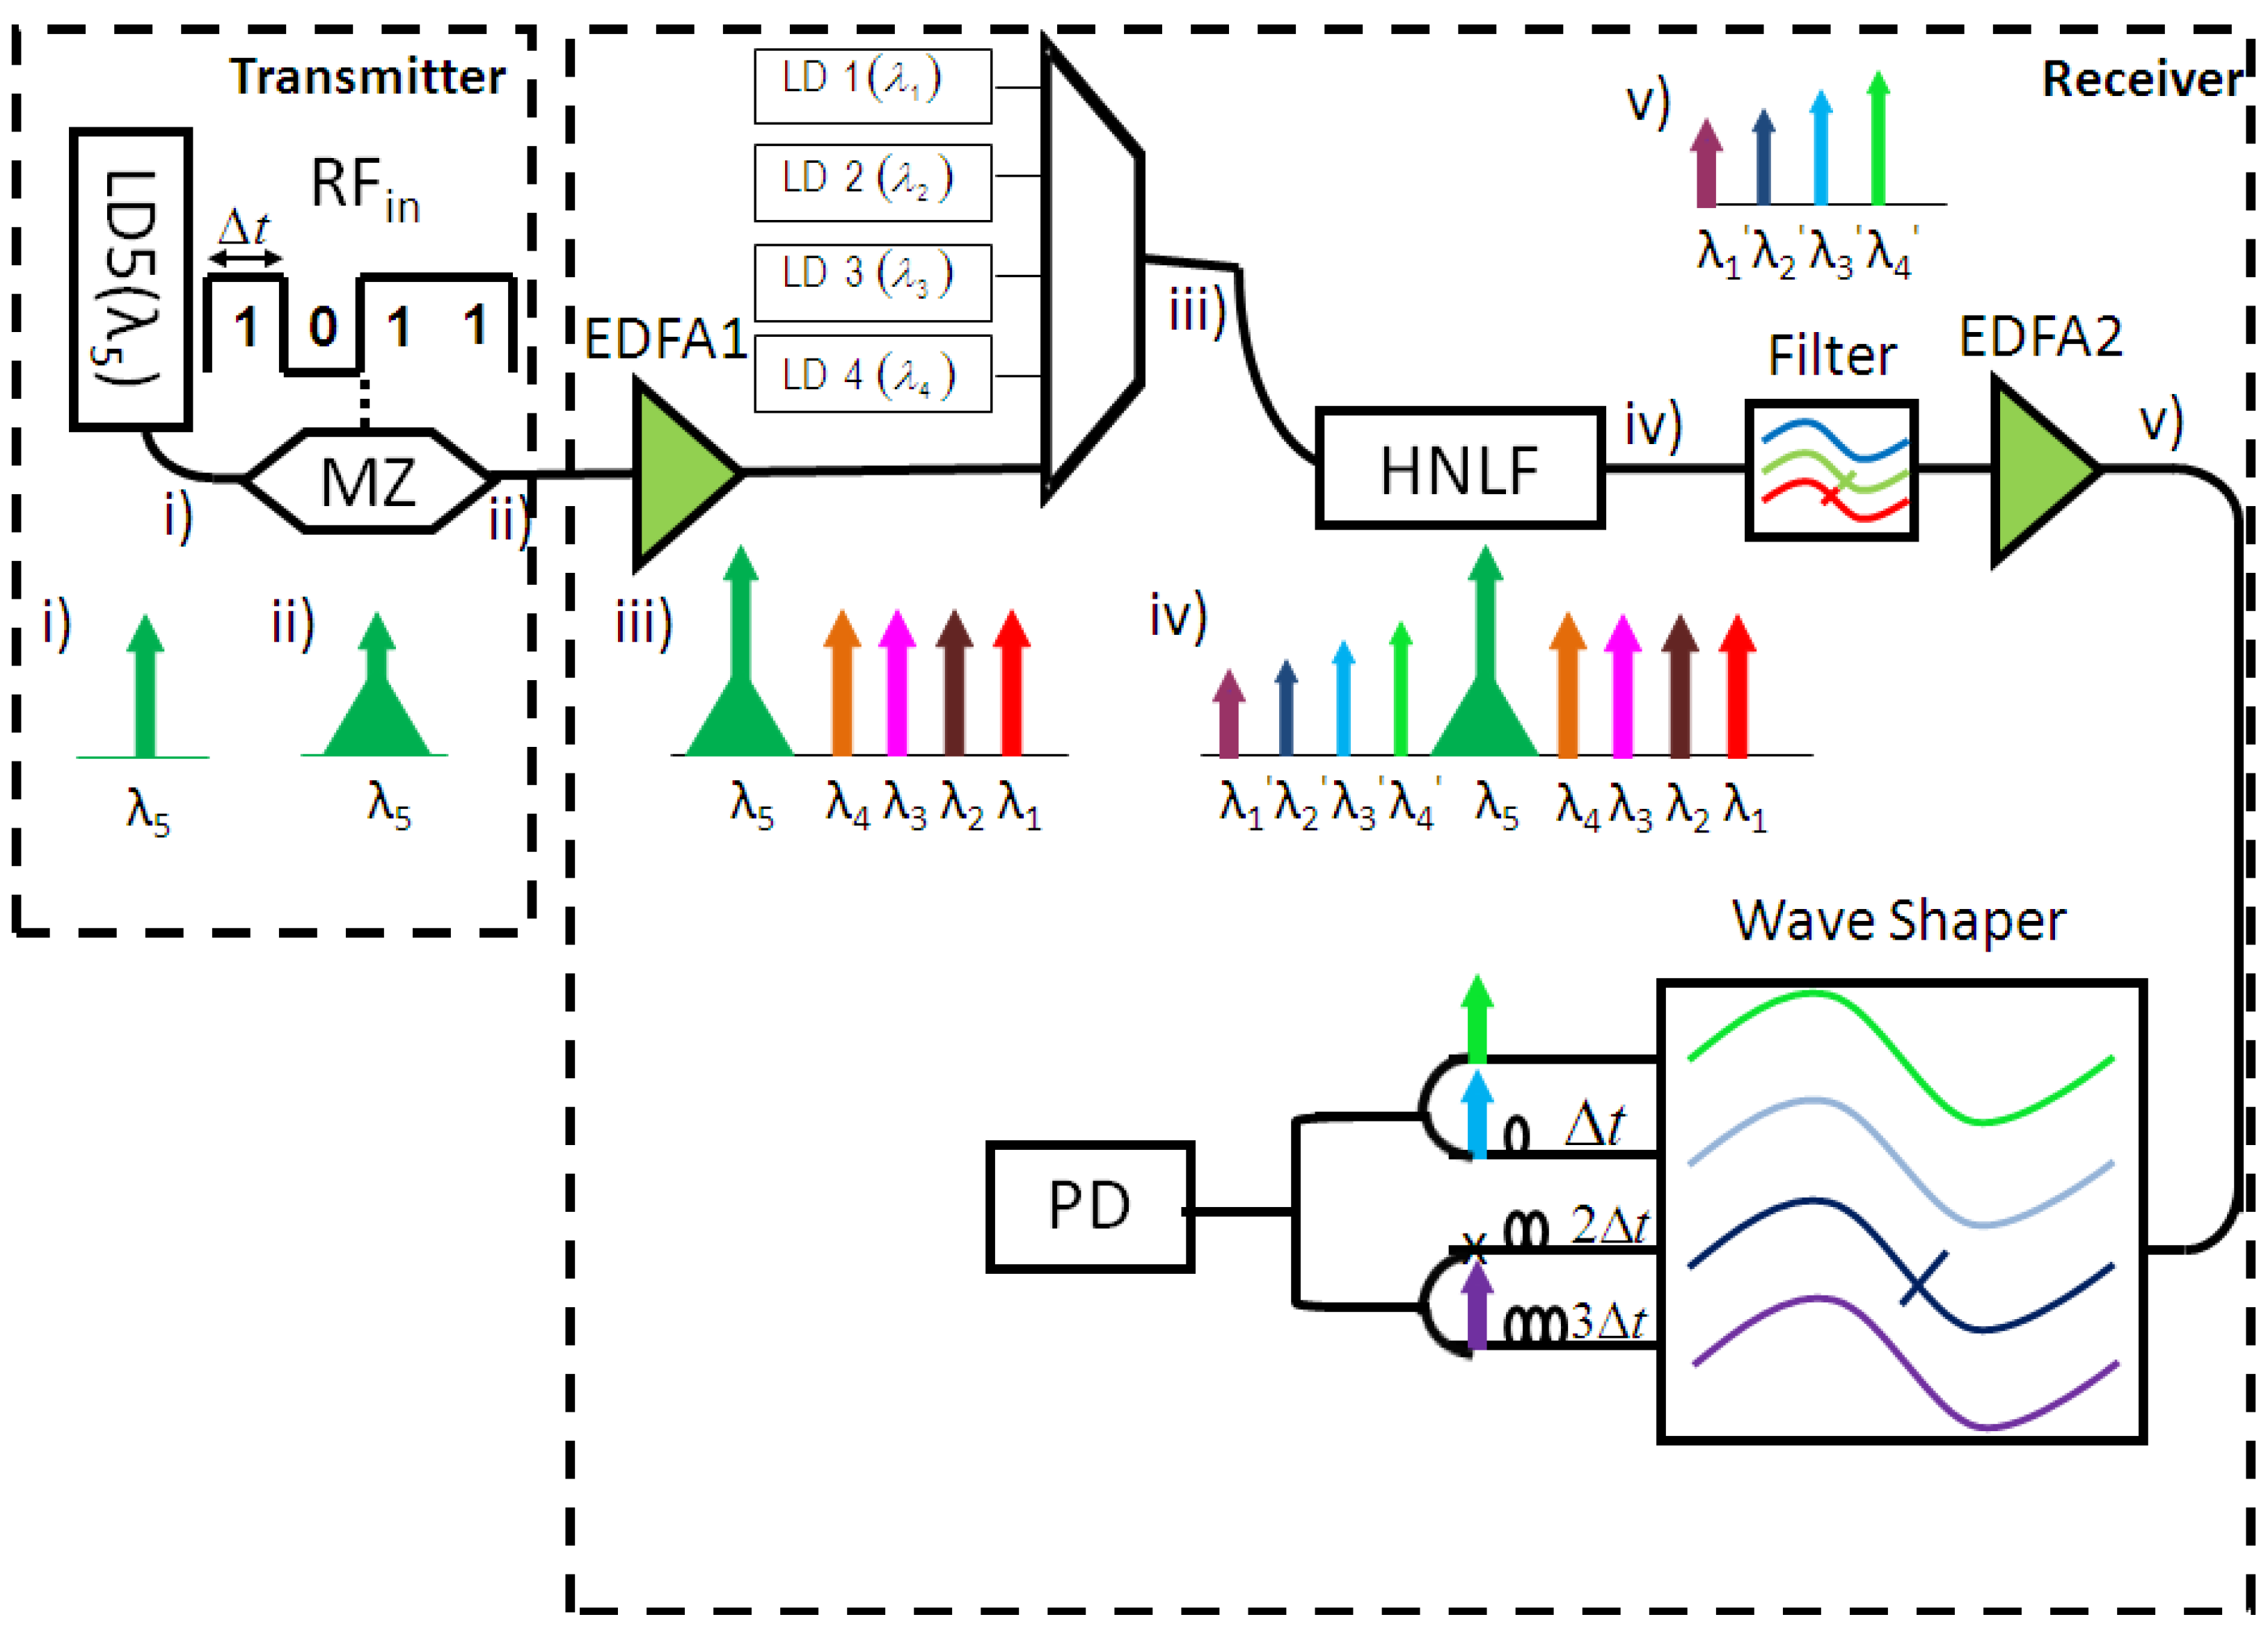
4, was selected by physically turning laser diodes on or off. In this section, a nonlinear mixing based correlation scheme is discussed where the template is selected using software control of an optical processor. This is a key difference. Because of the software controlled filtering of wavelengths, changing and controlling the template pattern can be done from a remote location as shown in
Figure 7. As in 3.1, this scheme uses FWM in a length of HNLF to mix a number of CW laser wavelengths with a pump wavelength which has been modulated by an input bit stream in order to produce copies of the input signal at the output idler wavelengths [
21].
The MZM was biased such that the drive voltage produced a maximum on-off contrast or “eye-opening” for the modulated signal. The modulated pump wavelength is then transmitted to the receiver. The transmitter could be located several km from the receiver if the fibre losses are small and the received signal can be amplified to a useful power level.
Figure 7.
Characterization and experimental set-up.
Figure 7.
Characterization and experimental set-up.
In
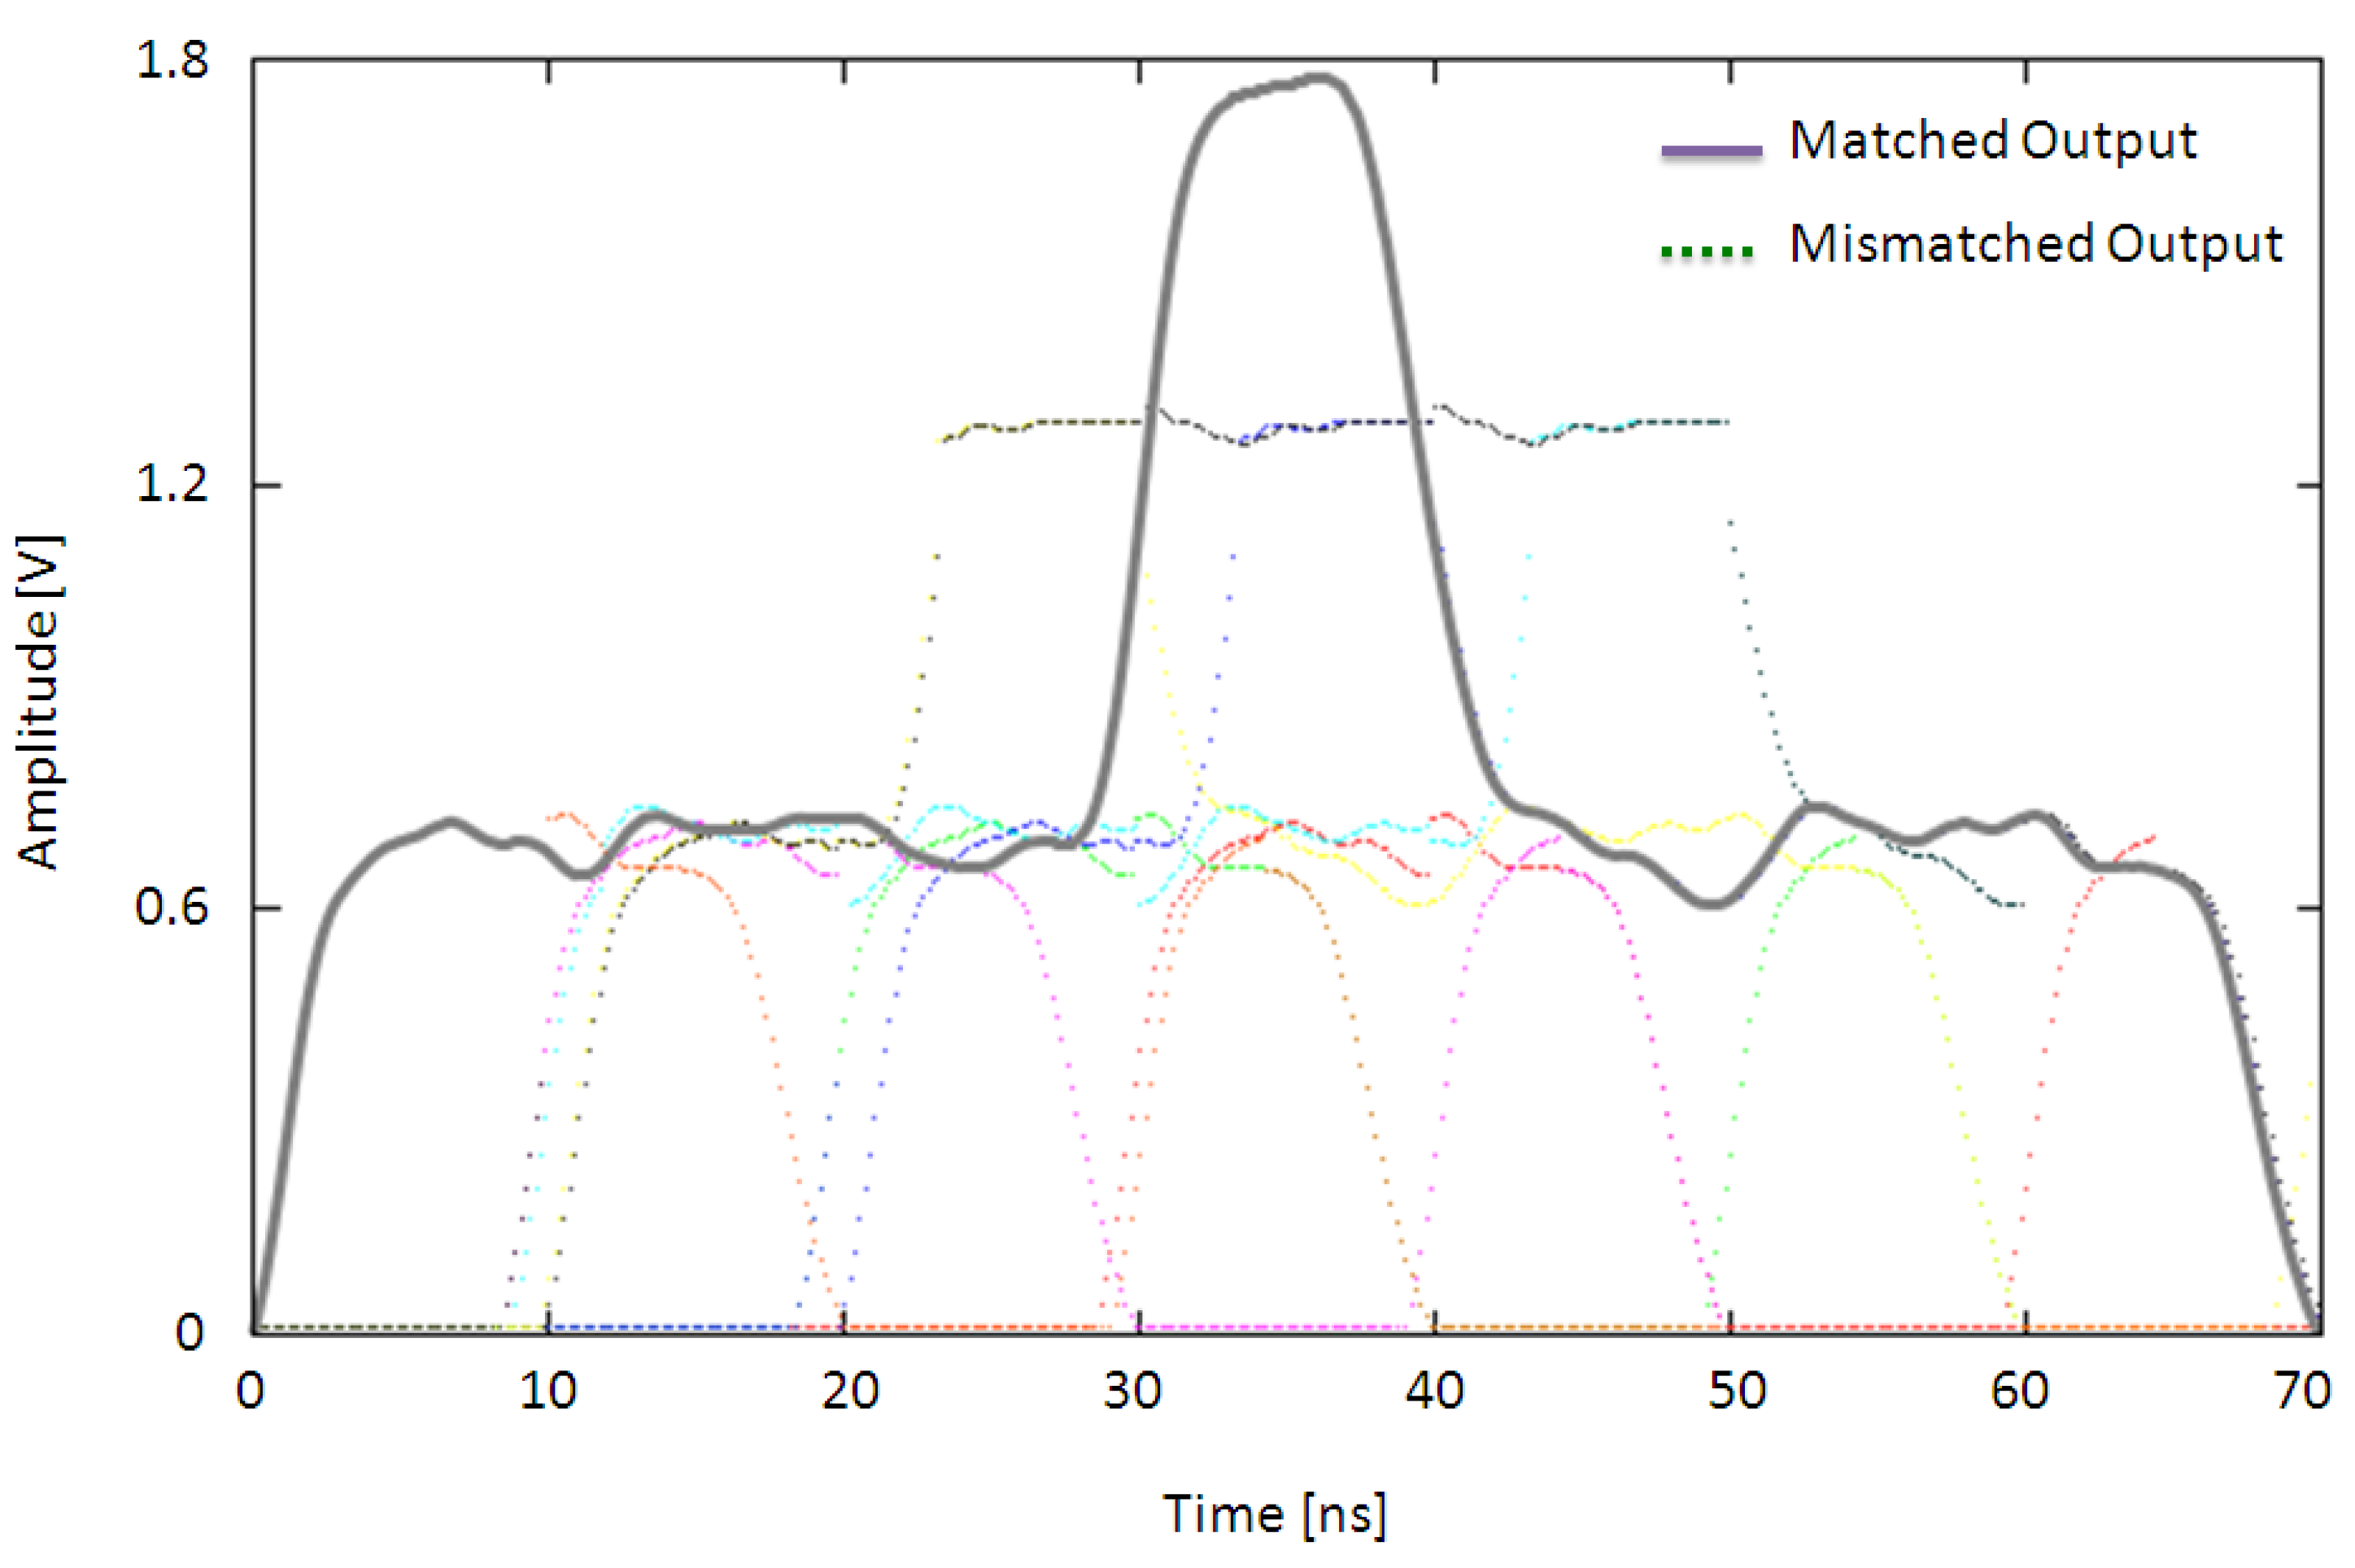
Figure 8, the thick solid line shows the measured correlation function at the photoreceiver output when all three idler wavelengths are present and the input bit pattern (1011) matches the reference bit pattern. When there is a match between the input bit pattern and the reference bit pattern, a correlation peak occurs at the middle of the correlation function, which occurs at the end of the original bit pattern. The height of the measured correlation peak is equal to the height of a “1” detected for each wavelength (0.6 V) multiplied by the number of “1”s in the template, which in this case is 3 (3 × 0.6 V = 1.8 V).
The dotted plots in
Figure 8 show the measured correlation functions for all possible mismatched conditions. The height of the correlation peak is always smaller than that for the matched case. The maximum output for a mismatched signal is 2 × 0.6 = 1.2 V. The results achieved here are similar to those obtained using the scheme in [
2,
20].
Figure 8.
Measured correlation outputs for all possible combinations of input bit patterns. The solid line indicates the output for a matched bit pattern whilst the dotted lines are for mismatched bit patterns.
Figure 8.
Measured correlation outputs for all possible combinations of input bit patterns. The solid line indicates the output for a matched bit pattern whilst the dotted lines are for mismatched bit patterns.
3.3. Optical Subtraction Using FWM
Subtraction is a widely used phenomenon required for various signal processing tasks. In photonic correlation schemes such as [
21,
22], a high speed balanced photoreceiver is typically used to obtain the difference between two optical signals. The signal processing to achieve a correlation is then done in the electronic domain. However, an inherent bottleneck of electronic systems is their limited bandwidth.
Optical wavelengths for the mixing process are selected carefully following the principle of [
23], so that the mixing product for several pump and signal wavelengths produces idlers at the same wavelength. Changing the phase of pump wavelengths produces a subtraction of power at the idler wavelngth.
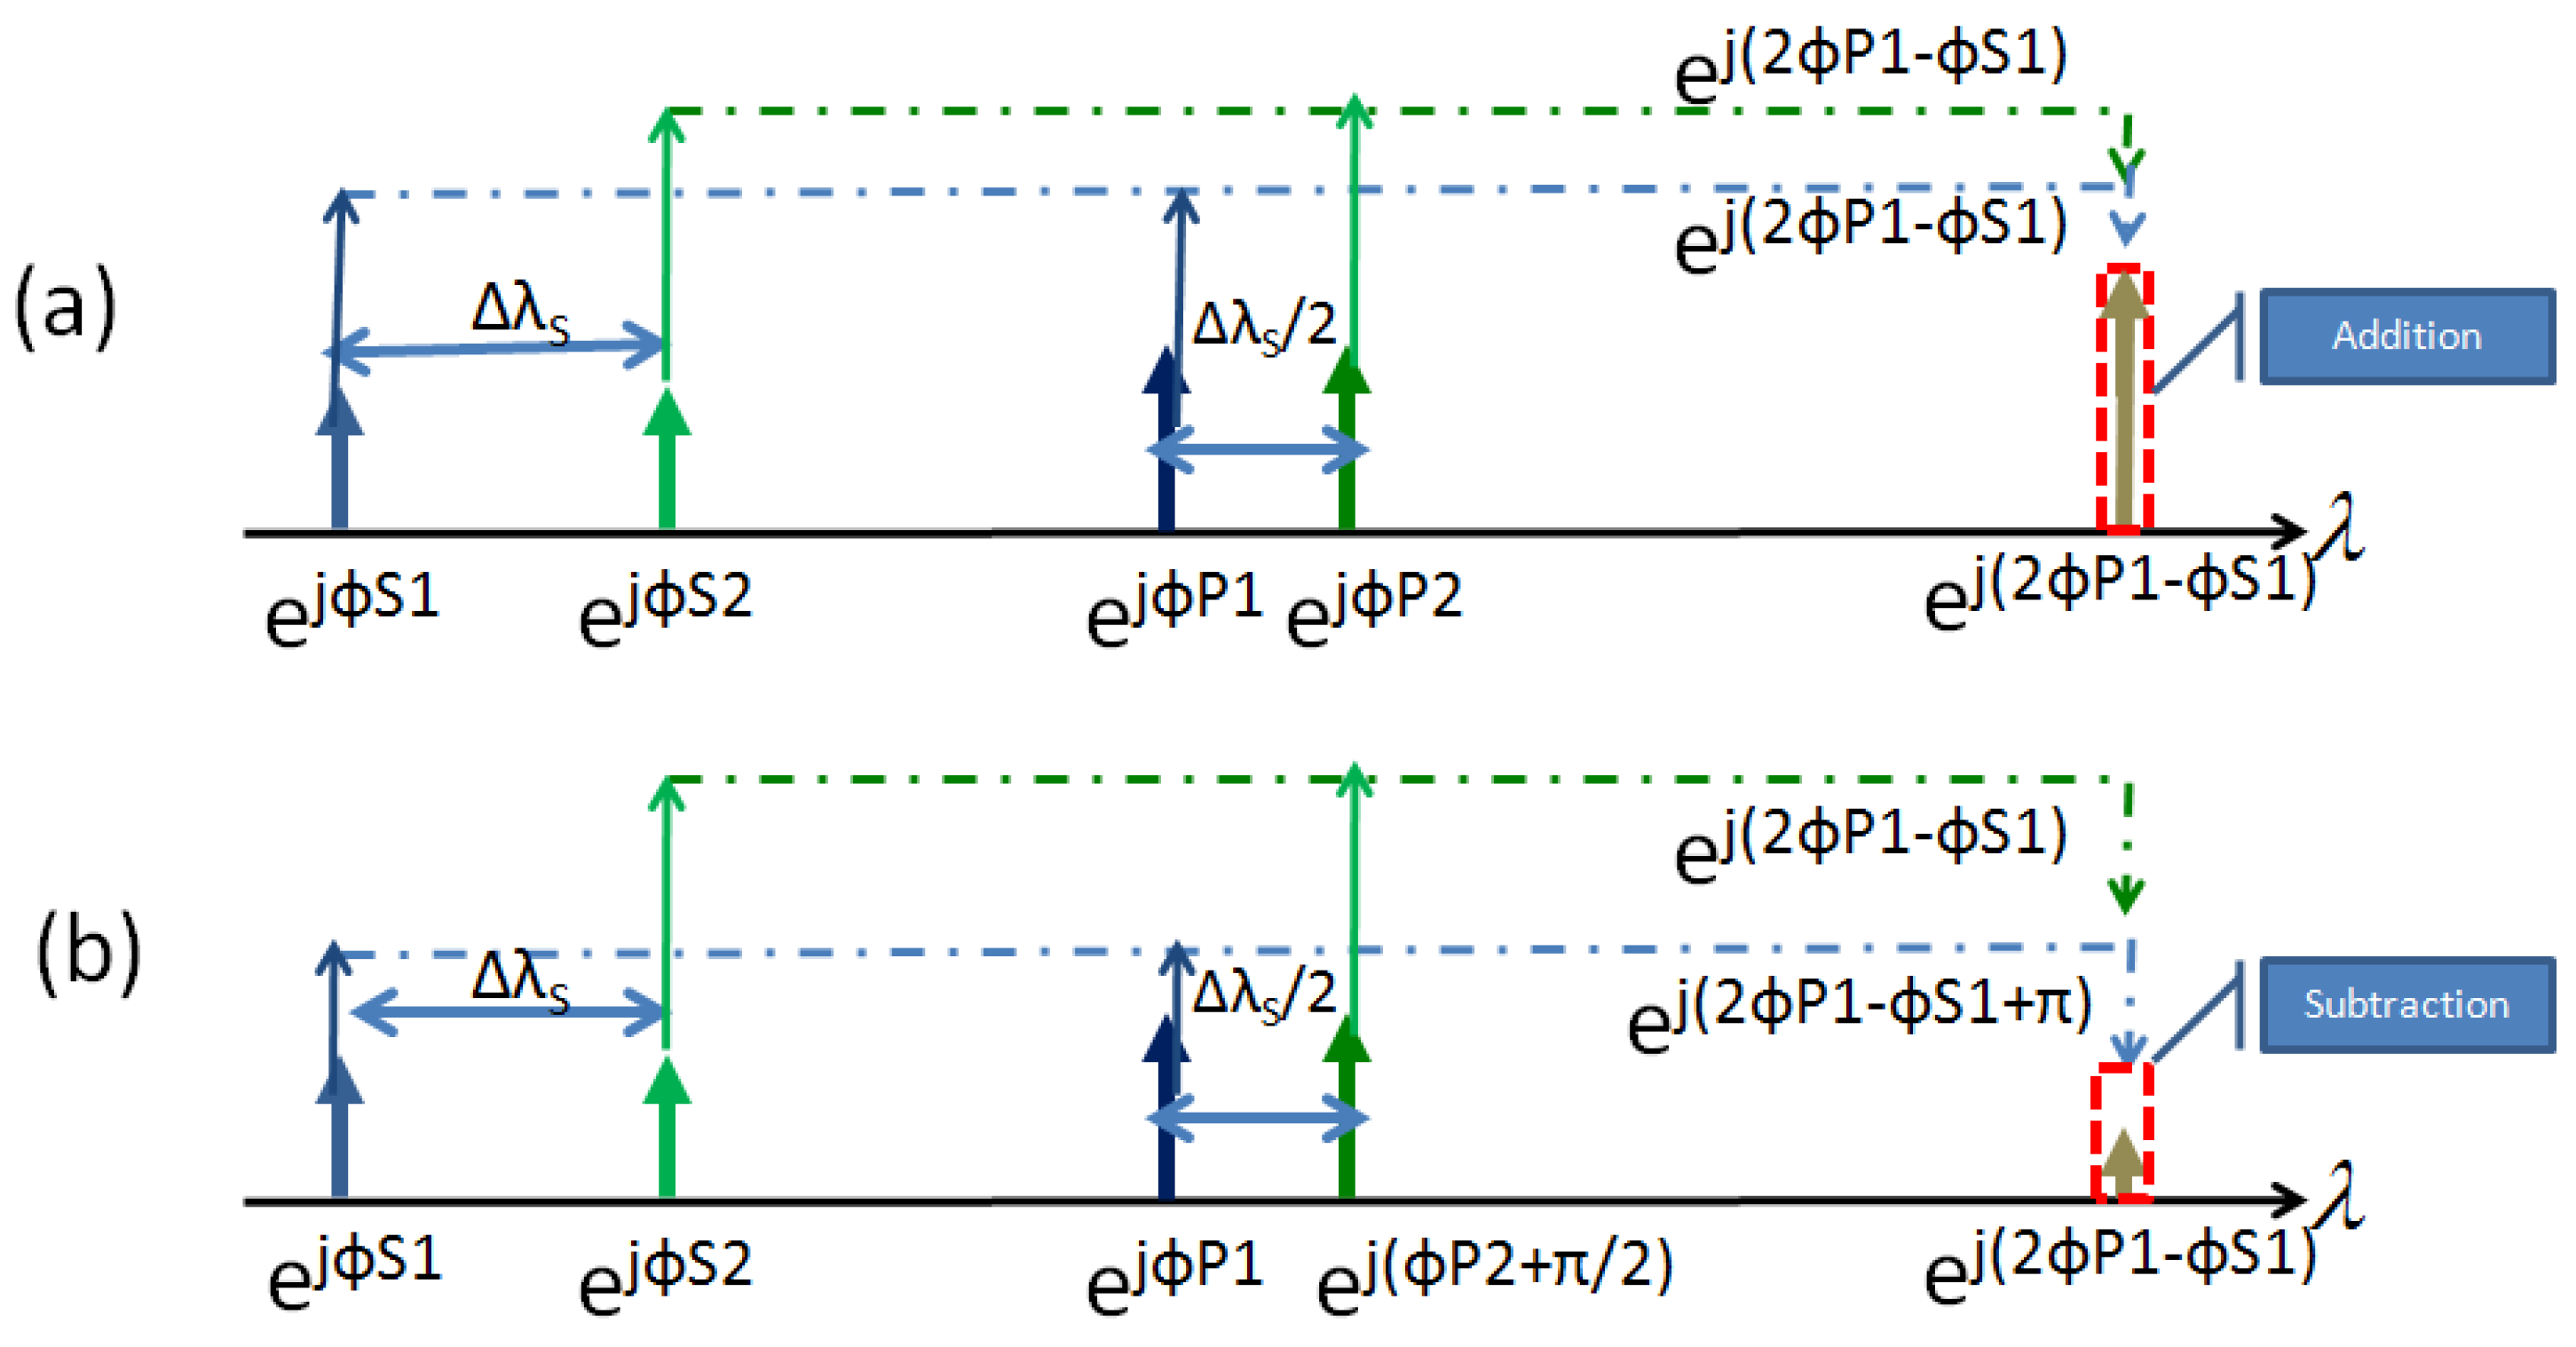
The key concept of achieving optical negative accumulation in this work, is to utilize the inherent property of four wave mixing to achieve the subtraction of two optical signals optically. FWM of signal and pump wavelengths creates idlers at sum and difference wavelengths which carry information from the original wavelengths. If a number of signal and pump wavelengths are selected such that the signal wavelengths have a separation of twice that of the pump wavelengths, then FWM of each signal and pump will create idlers at a common target wavelength, as shown in
Figure 9. The optical power at this target idler wavelength depends on the relative phase of each mixing term at that wavelength. Subtraction of an idler can be achieved if the pump of that mixing product has a π/2 radians phase shift with respect to the other pumps. The resultant idler for that particular mixing term will have a π radians phase difference with respect to the other idlers and their sum will be a subtraction between two optical signals by subtraction of electric fields.
Figure 9.
Principle of operation. (
a) Selection of wavelengths based on the scheme in [
23] for addition; (
b) Illustration of the subtraction process by applying a π/2 relative phase shift to one pump wavelength.
Figure 9.
Principle of operation. (
a) Selection of wavelengths based on the scheme in [
23] for addition; (
b) Illustration of the subtraction process by applying a π/2 relative phase shift to one pump wavelength.
In
Figure 9, the signal wavelengths are λ
S1 and λ
S2 (= λ
S1 + Δλ
S) and the pump wavelengths are λ
P1 and λ
P2 (= λ
P1 + Δλ
S/2). In terms of frequency, the signal frequencies are ω
S1 and ω
S2, where ω
S2 = ω
S1 + Δω
S, and the pump frequencies are ω
P1 and ω
P, where ω
P2 = ω
P1 + Δω
S/2. Four wave mixing of ω
P1 and ω
S1 produces an idler frequency at 2ω
P1 − ω
S1 (≈ 2λ
P1 − λ
S1). Likewise, FWM of ω
P2 and ω
S2 produces an idler at 2(ω
P1 + Δω
S/2) − (ω
S1 + Δω
S) = 2ω
P1 + Δω
S − ω
S1 − Δω
S = 2ω
P1 − ω
S1 (≈ 2λ
P1 − λ
S1). If the pump wavelengths are in phase (
Figure 9a), the resultant idlers add at the common wavelength. If λ
P2 has a phase shift of π/2 radians compared to λ
P1 (
Figure 9b), the mixing product due to λ
P2 has a phase shift of π radians compared to the mixing product due to λ
P1 resulting in subtraction of the optical fields.
3.3.1. Simulation Verification of the Proposed Concept
A simulation of this proposed concept was performed using
VPItransmissionMaker 9.0 software (
Figure 10). A WDM comb generator is used as an optical source to obtain wavelengths with a deterministic phase relationship. A Waveshaper (optical processor or filter) was designed to pass signal wavelengths in one arm and pump wavelengths in the other arm. The Waveshaper can also change the phase of a pump wavelength as required. The pump and signal wavelengths are then combined and fed into a length of HNLF. The output of the HNLF contains the nonlinear FWM products. The comb generator is a mode locked laser with all the wavelengths locked in phase.
A bandpass filter is used to pass only the mixing products at the required idler wavelength and eliminate all other wavelength components. The power level at the target idler is monitored using an Optical Spectrum Analyzer (OSA) to observe the addition and subtraction processes.
Figure 10.
Simulation schematic to achieve optical subtraction.
Figure 10.
Simulation schematic to achieve optical subtraction.
3.3.2. Simulation Results
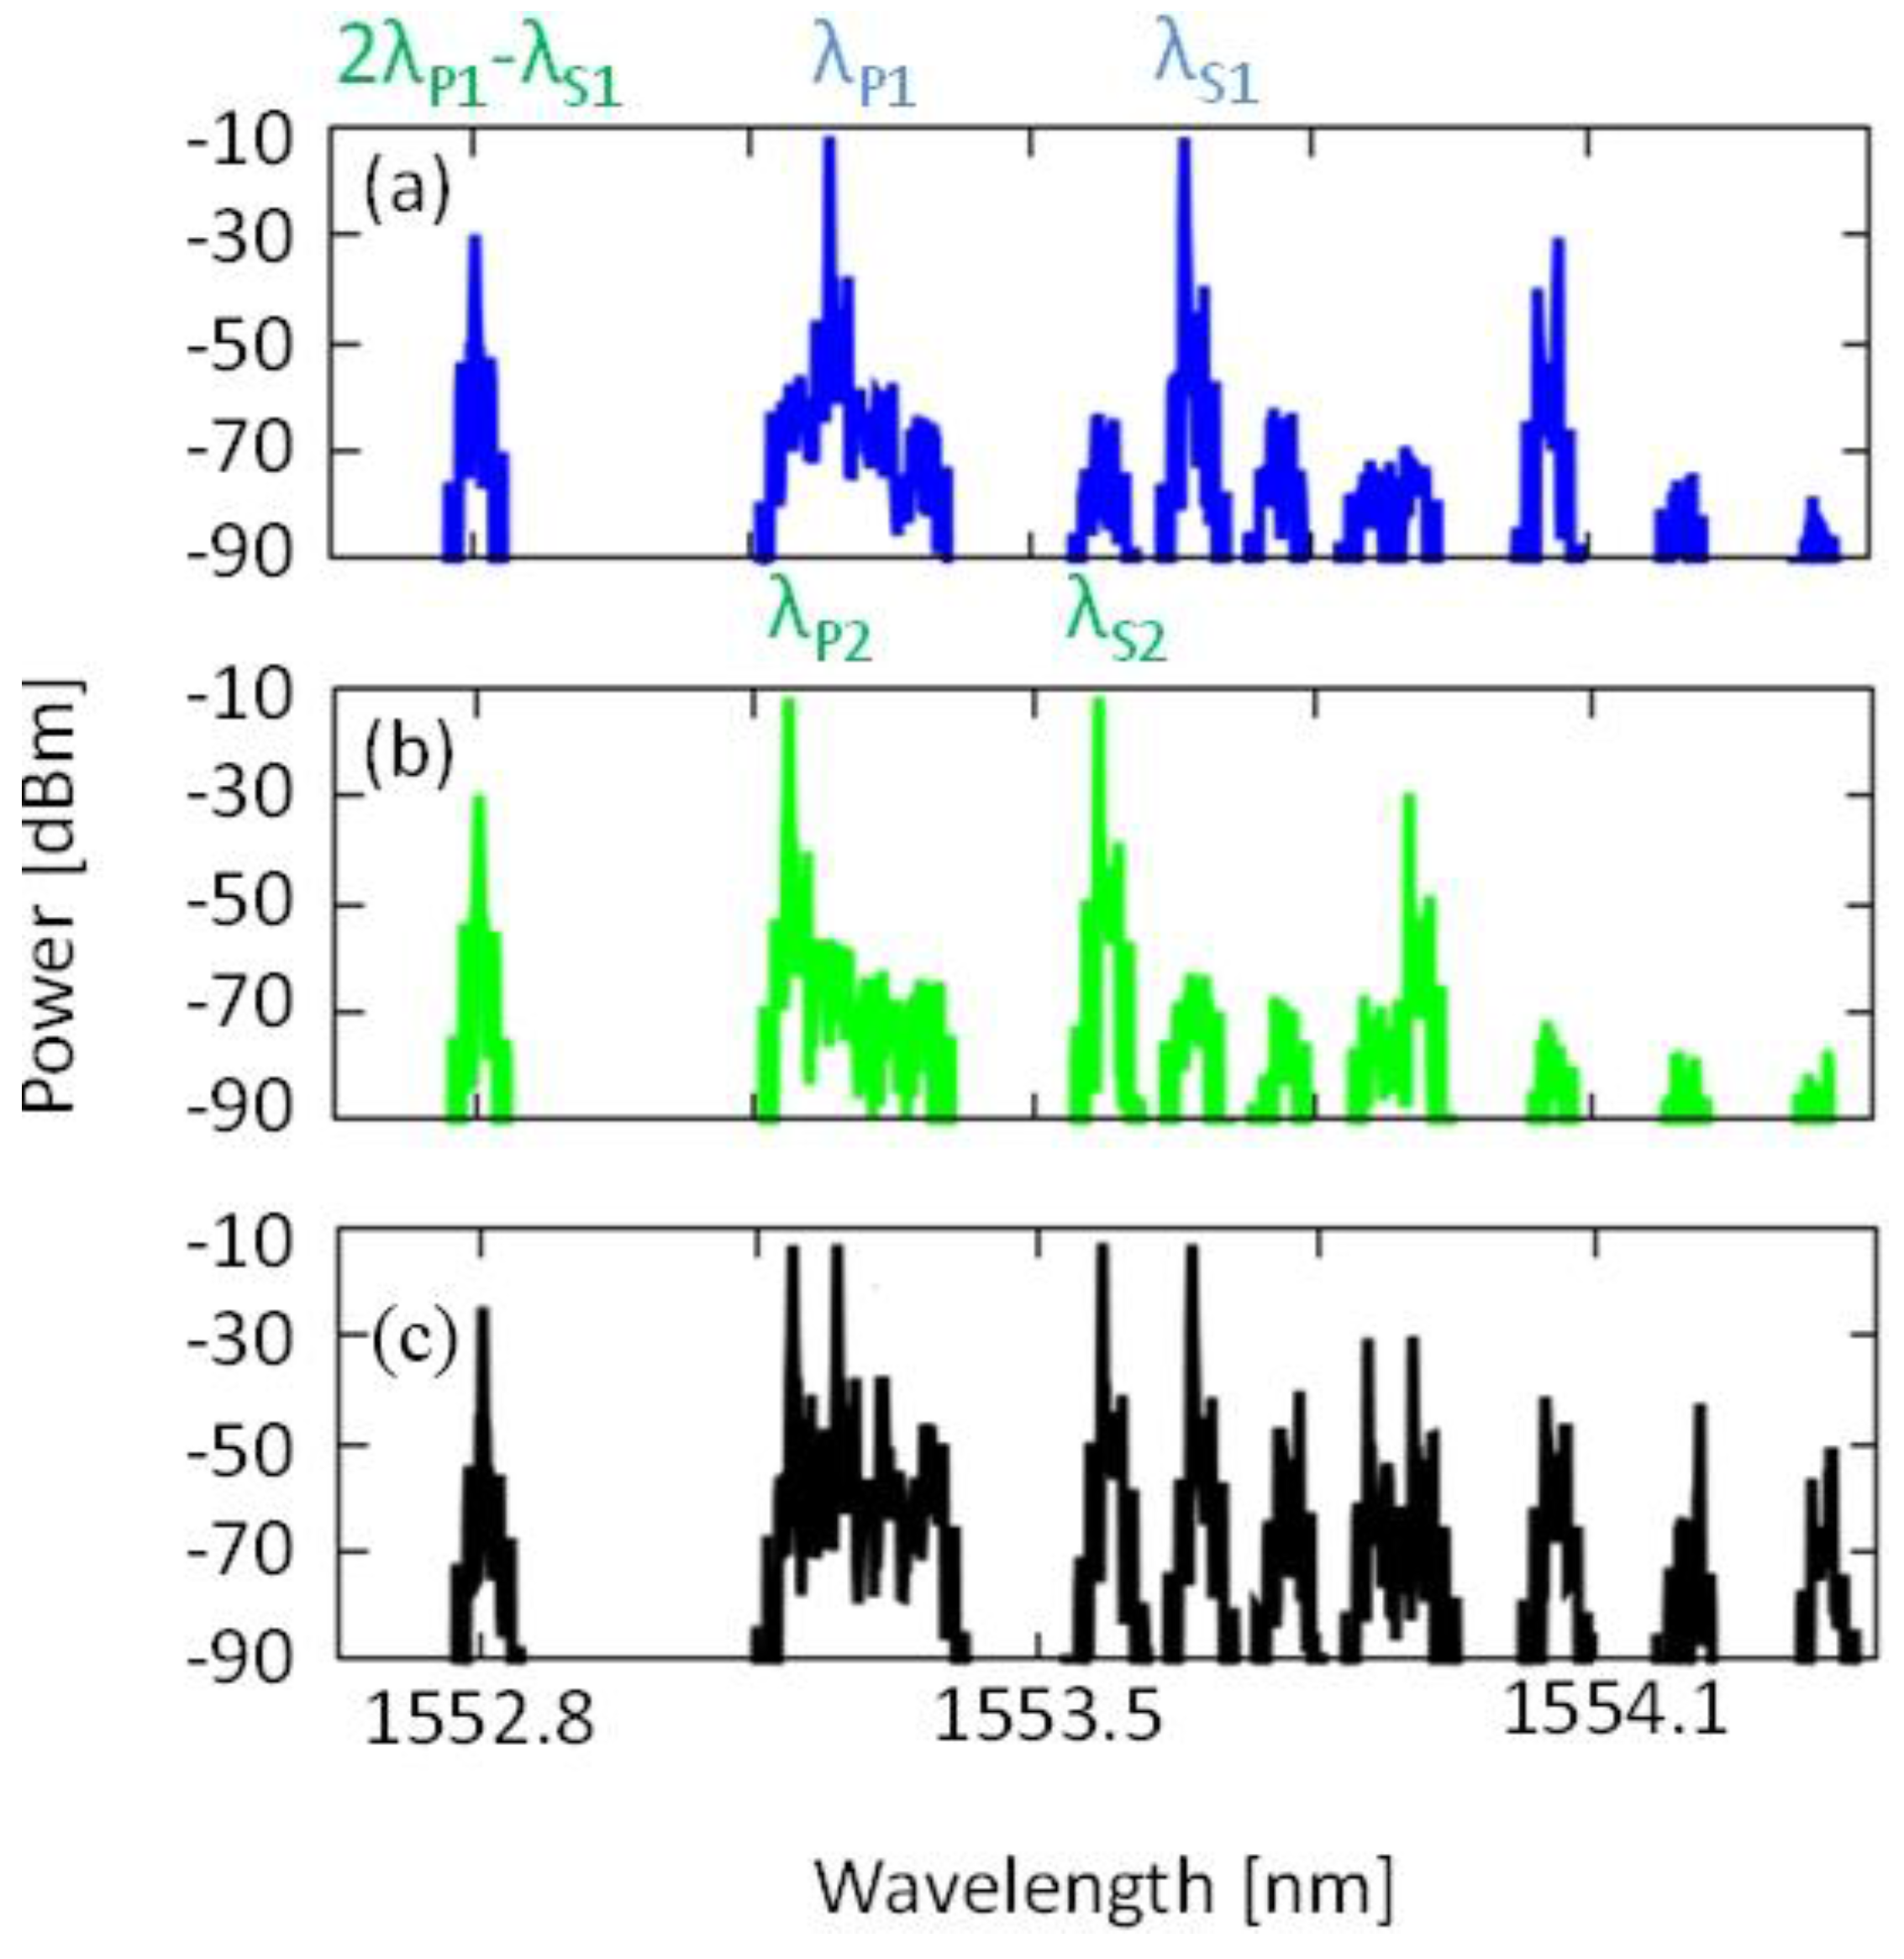
Figure 11 shows the simulation results when the signal and pump wavelengths are all in phase. In
Figure 11a signal λ
S1 and pump λ
P1 mix and generate an idler at 2λ
P1 − λ
S1 with a power level of −30 dBm. Likewise in
Figure 11b, λ
S2 and λ
P2 generate an idler at the same wavelength with the same power level of −30 dBm. When λ
S1, λ
S2, λ
P1 and λ
P2 are all present, the optical fields of the two idlers add in phase, resulting in a power level of −24 dBm, a 6 dB power increase caused by a doubling of the optical field.
Figure 11.
Simulation results illustrating the optical addition process. (a) Signal wavelength λS1 and pump wavelength λP1 generate an idler at 2λP1 − λS1; (b) λS2 and λP2 mix and generate an idler at the same wavelength 2λP1 − λS1; (c) λS1, λS2, λP1 and λP2 generate two idlers at the same wavelength which add in phase, producing a 6 dB increase in optical power.
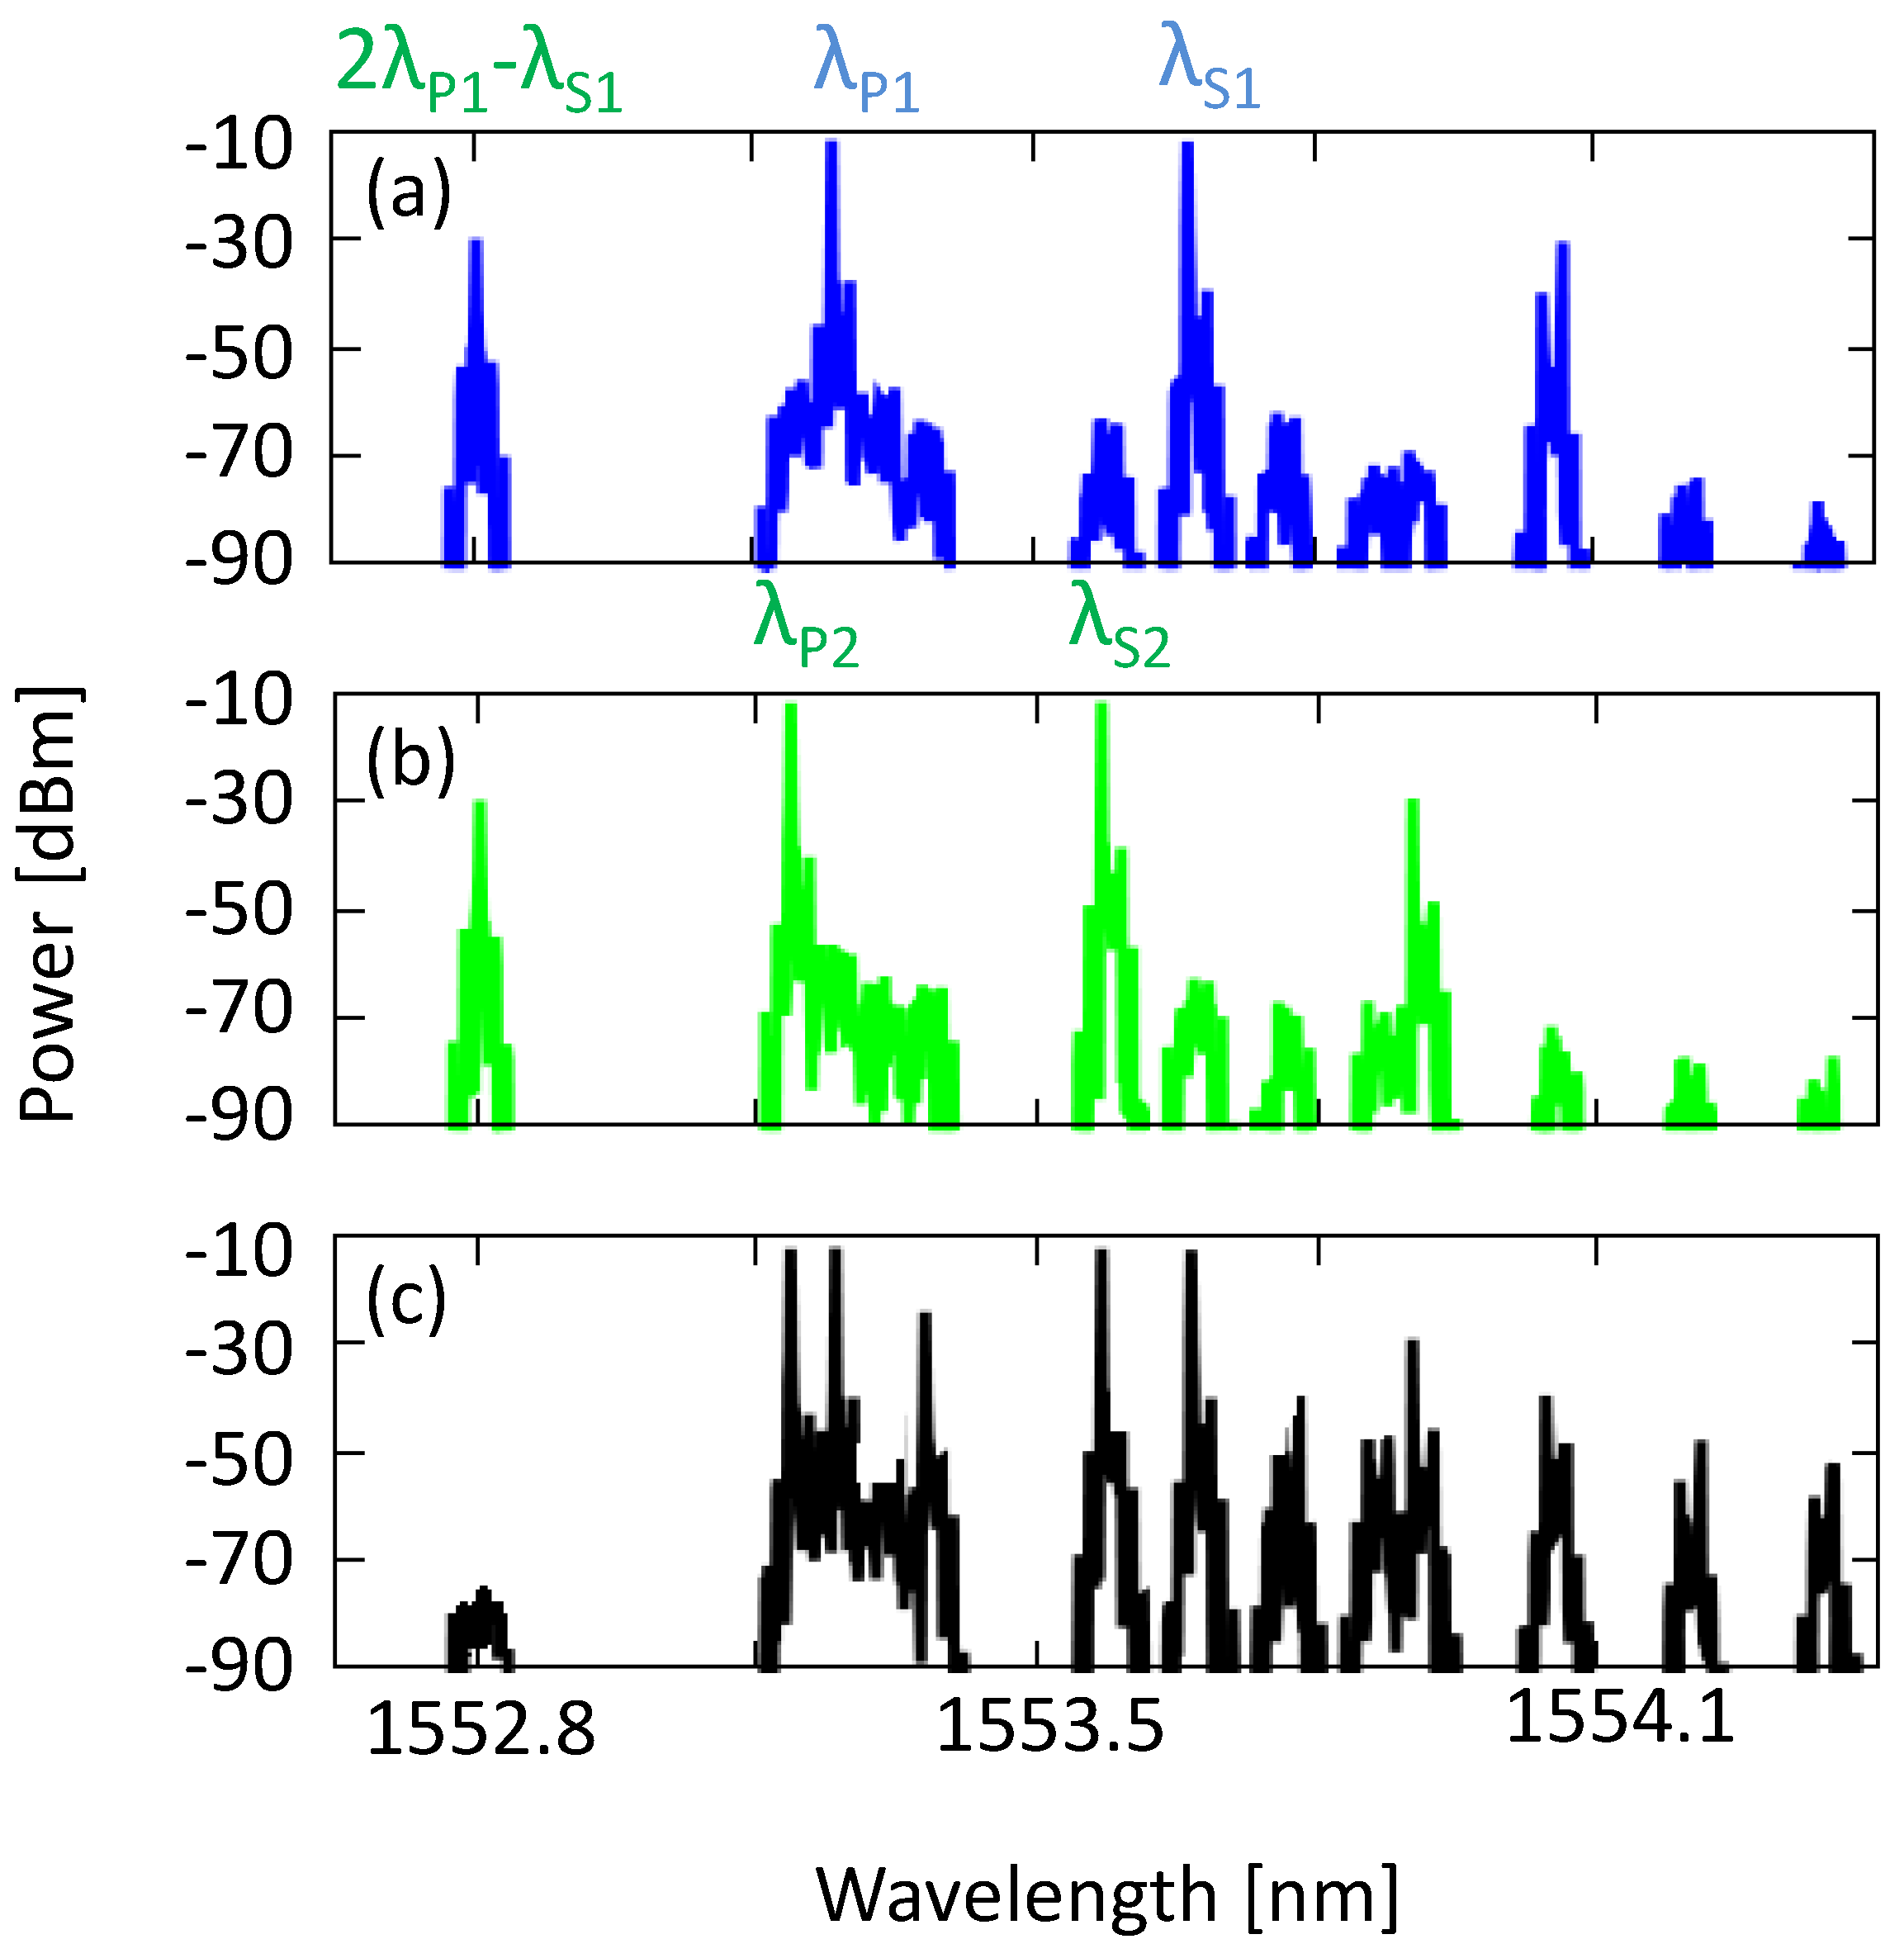
Figure 12 shows the simulation results when the phase of pump λ
P2 is phase shifted by 90° (π/2 radians) with respect to λ
P1. As before, the mixing of λ
S1 and λ
P1 produces an idler at 2λ
P1 − λ
S1 with a power level of −30 dBm, as does the mixing of λ
S2 and λ
P2. However, the two idlers are now 180° (π radians) out of phase. When λ
S1, λ
S2, λ
P1 and λ
P2 are all present, the optical fields of the idlers subtract and produce a power level of −80 dBm.
Figure 12.
Simulation results illustrating the optical subtraction process. (a) Signal wavelength λS1 and pump wavelength λP1 generate an idler at 2λP1 − λS1; (b) λS2 and λP2, which is 90° phase shifted with respect to λP1, generate an idler at the same wavelength as in a) but with a 180° phase shift; (c) λS1, λS2, λP1 and λP2 mix and generate two idlers at the same wavelength which are 180° out of phase, producing a subtraction.
