Article

Acceptance Mode Dependent Transfer of Non-Common Path Aberrations to Null Leakage in Mid-Infrared Nulling Interferometry

1
College of Advanced Interdisciplinary Studies, National University of Defense Technology, No. 109 Deya Road, Changsha 410011, China
2
Nanhu Laser Laboratory, National University of Defense Technology, No. 207 Middle Furong Road, Section 3, Changsha 410011, China
*
Author to whom correspondence should be addressed.
Photonics 2026, 13(9), 881; https://doi.org/10.3390/photonics13090881 (registering DOI)
Submission received: 16 August 2026 / Revised: 11 September 2026 / Accepted: 16 September 2026 / Published: 18 September 2026
(This article belongs to the Special Issue State-of-the-Art Optical Systems for Astronomy)

Abstract

Mid-infrared nulling interferometry enables thermal characterization of warm exoplanets, but non-common path aberrations (NCPA) degrade starlight suppression by creating complex amplitude mismatch between interferometer arms. We investigate how architecture and NCPA spatial structure jointly determine null leakage and stability at λ = 10.6   μ m . A unified statistical framework combines free-space propagation, a Houizot chalcogenide fiber, and a Labadie-type waveguide with extended Sauvage-type NCPA screens and adaptive optics (AO) residuals in nested Monte Carlo simulations. The mean raw null is governed mainly by the combined aberration amplitude of the two arms and depends only weakly on its allocation between them. AO residuals set leakage floors that depend on the reception configuration. Cases with similar mean raw nulls can still have different dispersions. Compared with free space, the single-mode spatial filters lower the mean leakage and reduce fluctuations, and they are less sensitive to the allocation of amplitude error between the arms. Their performance depends on modal selectivity: larger energy fractions in azimuthally symmetric radial modes are associated with poorer mean nulls and greater AO-driven fluctuations. These results show that NCPA tolerances cannot be specified by global wavefront error amplitude alone. They should also account for aberration spatial content and the modal projection imposed by the transmission architecture.

1. Introduction

Transit and radial velocity surveys have greatly expanded the known exoplanet population, shifting part of the field from detection and occurrence rates toward the direct characterization of planetary thermal emission, orbital environments, and atmospheric composition [1,2]. For warm rocky planets and targets near the habitable zone, direct detection remains limited by the high star-to-planet contrast and the small angular separation from the host star [3,4]. Mid-infrared Nulling Interferometry (NI) provides a complementary route to this problem [5,6]. By coherently combining multiple apertures, NI suppresses the on-axis stellar field through destructive interference while transmitting off-axis planetary light through the interferometric transmission pattern. Its inner working angle is set mainly by the interferometric baseline rather than by the diffraction scale of a single aperture [7]. In the mid-infrared, thermal emission from warm planets is stronger, the star-to-planet contrast is more favorable than at shorter wavelengths, and molecules such as H2O, CO2, O3, and CH4 have diagnostic spectral features. For these reasons, mid-infrared NI remains a candidate technique for thermal emission spectroscopy of terrestrial exoplanets [8]. These advantages are accompanied by a substantial thermal background in ground-based observations near 10 μm. Emission from the atmosphere and warm optics introduces photon noise, while imperfect background subtraction leaves residual structures that can further limit sensitivity. Spatial filtering therefore affects more than wavefront matching. Its mode of acceptance influences both the background admitted and the throughput for off-axis planetary light. The choice of architecture must account for these effects alongside stellar suppression.
Several transmission and beam combination architectures are relevant to NI. Free-space or bulk optics combination is the most direct implementation and has been demonstrated in astronomical nulling instruments [9]. Single-mode spatial filtering may be implemented either in the individual input arms before beam combination or as a common filter at an output of the beam combiner, as in Ref. [10]. For the linear modal projection considered here, these two placements yield the same accepted coherent field. Integrated waveguides and photonic beam combiners offer compact and mechanically stable routes for coherent combination [11,12]. Earlier work on single-mode filtering showed that fibers or waveguides can improve modal matching and reduce the effect of some wavefront corrugations on rejection ratio [13,14]. Mid-infrared device studies have also demonstrated possible implementations, including single-mode waveguides near 10 μm, chalcogenide single-mode fibers, Te2As3Se5 rib waveguides, and three-dimensional chalcogenide photonic circuits [14,15,16,17]. The remaining question is how each device’s acceptance field converts phase error into the arm coupling mismatch.
Traditional NI error budgets commonly treat phase errors, intensity mismatch, polarization, dispersion, fringe tracking errors, and photometric imbalance as independent contributions [18,19,20]. With a single-mode spatial filter, however, the incident field is projected onto the device acceptance mode before entering the downstream beam combiner. The modulus of this complex overlap determines the coupling amplitude, its squared modulus gives the coupling efficiency, and its argument determines the coupling phase.AO(adaptive optics) residuals and non-common path aberrations (NCPA) are both spatially varying phase perturbations that alter the same complex projection. Their effects on coupling amplitude and phase are therefore linked and depend on the type of spatial filter. Consequently, representing AO residuals and NCPA only as spatial-filter-independent Root Mean Square(RMS) quantities does not fully describe the resulting null leakage. This motivates the complex field propagation and Monte Carlo analysis used in this work. Studies of AO-assisted fiber injection and interferometric phase estimation have already shown the close connection between injection efficiency and Strehl ratio [21,22]. Recent roadmap work has further highlighted the increasing integration of extreme adaptive optics and nulling interferometry as a promising direction for exoplanet high-contrast imaging [23]. This convergence motivates a closer examination of how residual AO phase errors and quasi-static aberrations propagate into the downstream nulling response.
NCPA makes this propagation problem particularly important. NCPA is usually introduced downstream of the wavefront sensor, or along an optical path that is not fully common with the sensing channel, and appears as a quasi-static or slowly varying phase error. A conventional AO loop may not directly measure or fully correct it. In free-space nulling, NCPA enters the destructive output as a pupil field mismatch. In a single-mode fiber or waveguide, the same pupil plane phase screen is first projected onto the acceptance mode and then appears as a coupled amplitude and phase perturbation. As a result, Optical Path Difference (OPD) RMS alone is not enough to describe NCPA-induced null leakage. The leakage can depend on the spatial structure of the NCPA, the RMS allocation between the two arms, and the type of spatial filter. Although single-mode filtering has been studied as a way to reduce wavefront defects in NI [13,14], less attention has been given to the forward statistical mapping from NCPA screens, through specific free-space or single-mode acceptance kernels, to null leakage.
Here we compare NCPA transfer to null leakage through free space, a Houizot chalcogenide fiber [14], and a Labadie-type waveguide at λ = 10.6 μm [15], extended Sauvage-type NCPA screens [24] and Fétick-type AO residual phase screens [25] are used within a common model. Nested Monte Carlo analysis is then used to separate the effects of NCPA spatial structure from those of AO residual realizations.

2. Materials and Methods

2.1. Transmission Architectures

We compare three N-band transmission architectures: free-space propagation through a fixed circular focal-plane aperture, the Houizot chalcogenide single-mode fiber [14], and a Labadie-type mid-infrared waveguide [15]. The two single-mode devices are modeled using the material compositions, geometries, and single-mode operating conditions reported in the cited studies. The Houizot fiber supports an approximately circular linearly polarized fundamental mode (LP01), whereas the Labadie waveguide supports a strongly noncircular transverse electric-like (TE-like) fundamental mode. Together with the finite circular aperture, these devices provide three physically distinct acceptance fields with different symmetries and numbers of accepted spatial channels. This comparison allows us to examine how the acceptance field determines the transfer of NCPA into null leakage.
A common wavelength of λ = 10.6 µm is used throughout this work. The Houizot fiber model uses the Te20.2As30Se49.8/Te20As30Se50 cladding step-index fiber parameters reported in Ref. [14]: core radius a = 11 µm, ncore = 2.927, nclad = 2.924, a numerical aperture of approximately 0.132, and V = 0.864. Its LP01 fundamental mode is solved using ofiber [26]. The Labadie waveguide model uses the mid-infrared single-mode waveguide parameters reported in Ref. [15]: an As2S3 substrate thickness of 4.5 μm with refractive index 2.38, an As2Se3 guiding film thickness of 3.8 μm with base refractive index 2.78, a laser-written stripe width of 6.5 μm, an index increase of Δn = 0.05, and an air cladding index of 1.0. The fundamental TE-like guided mode is computed with the semi-vectorial finite-difference mode solver in modesolverpy [27]. All three reception configurations use the same uniformly illuminated, unobscured circular pupil, without spiders, segmentation, apodization, or vignetting, and the two interferometric arms have identical pupils.
For the free-space architecture, we adopt a circular focal plane acceptance aperture with radius R a p   =   0.514 λ r e f / D . This value corresponds to the half-width at half-maximum of the single-aperture PSF and follows the circular photometric aperture used in the nulling data reduction [28]. For the two single-mode devices, the physical acceptance modes were centered on the unaberrated Airy pattern, and their injection scales s , expressed as the physical focal plane length per λ / D , were independently optimized by maximizing the normalized squared overlap. Using s   =   λ r e f F # , the optimized scales at λ r e f   =   10.6   μ m are 178.215   μ m / λ / D ( F # = 16.813 ) for the Houizot fiber and 5.801   μ m / λ / D ( F # = 0.547 ) for the Labadie waveguide. The corresponding ideal unaberrated throughputs are 69.73%, 54.08%, and 47.26% for the Houizot fiber, Labadie waveguide, and free space through a circular aperture, respectively.
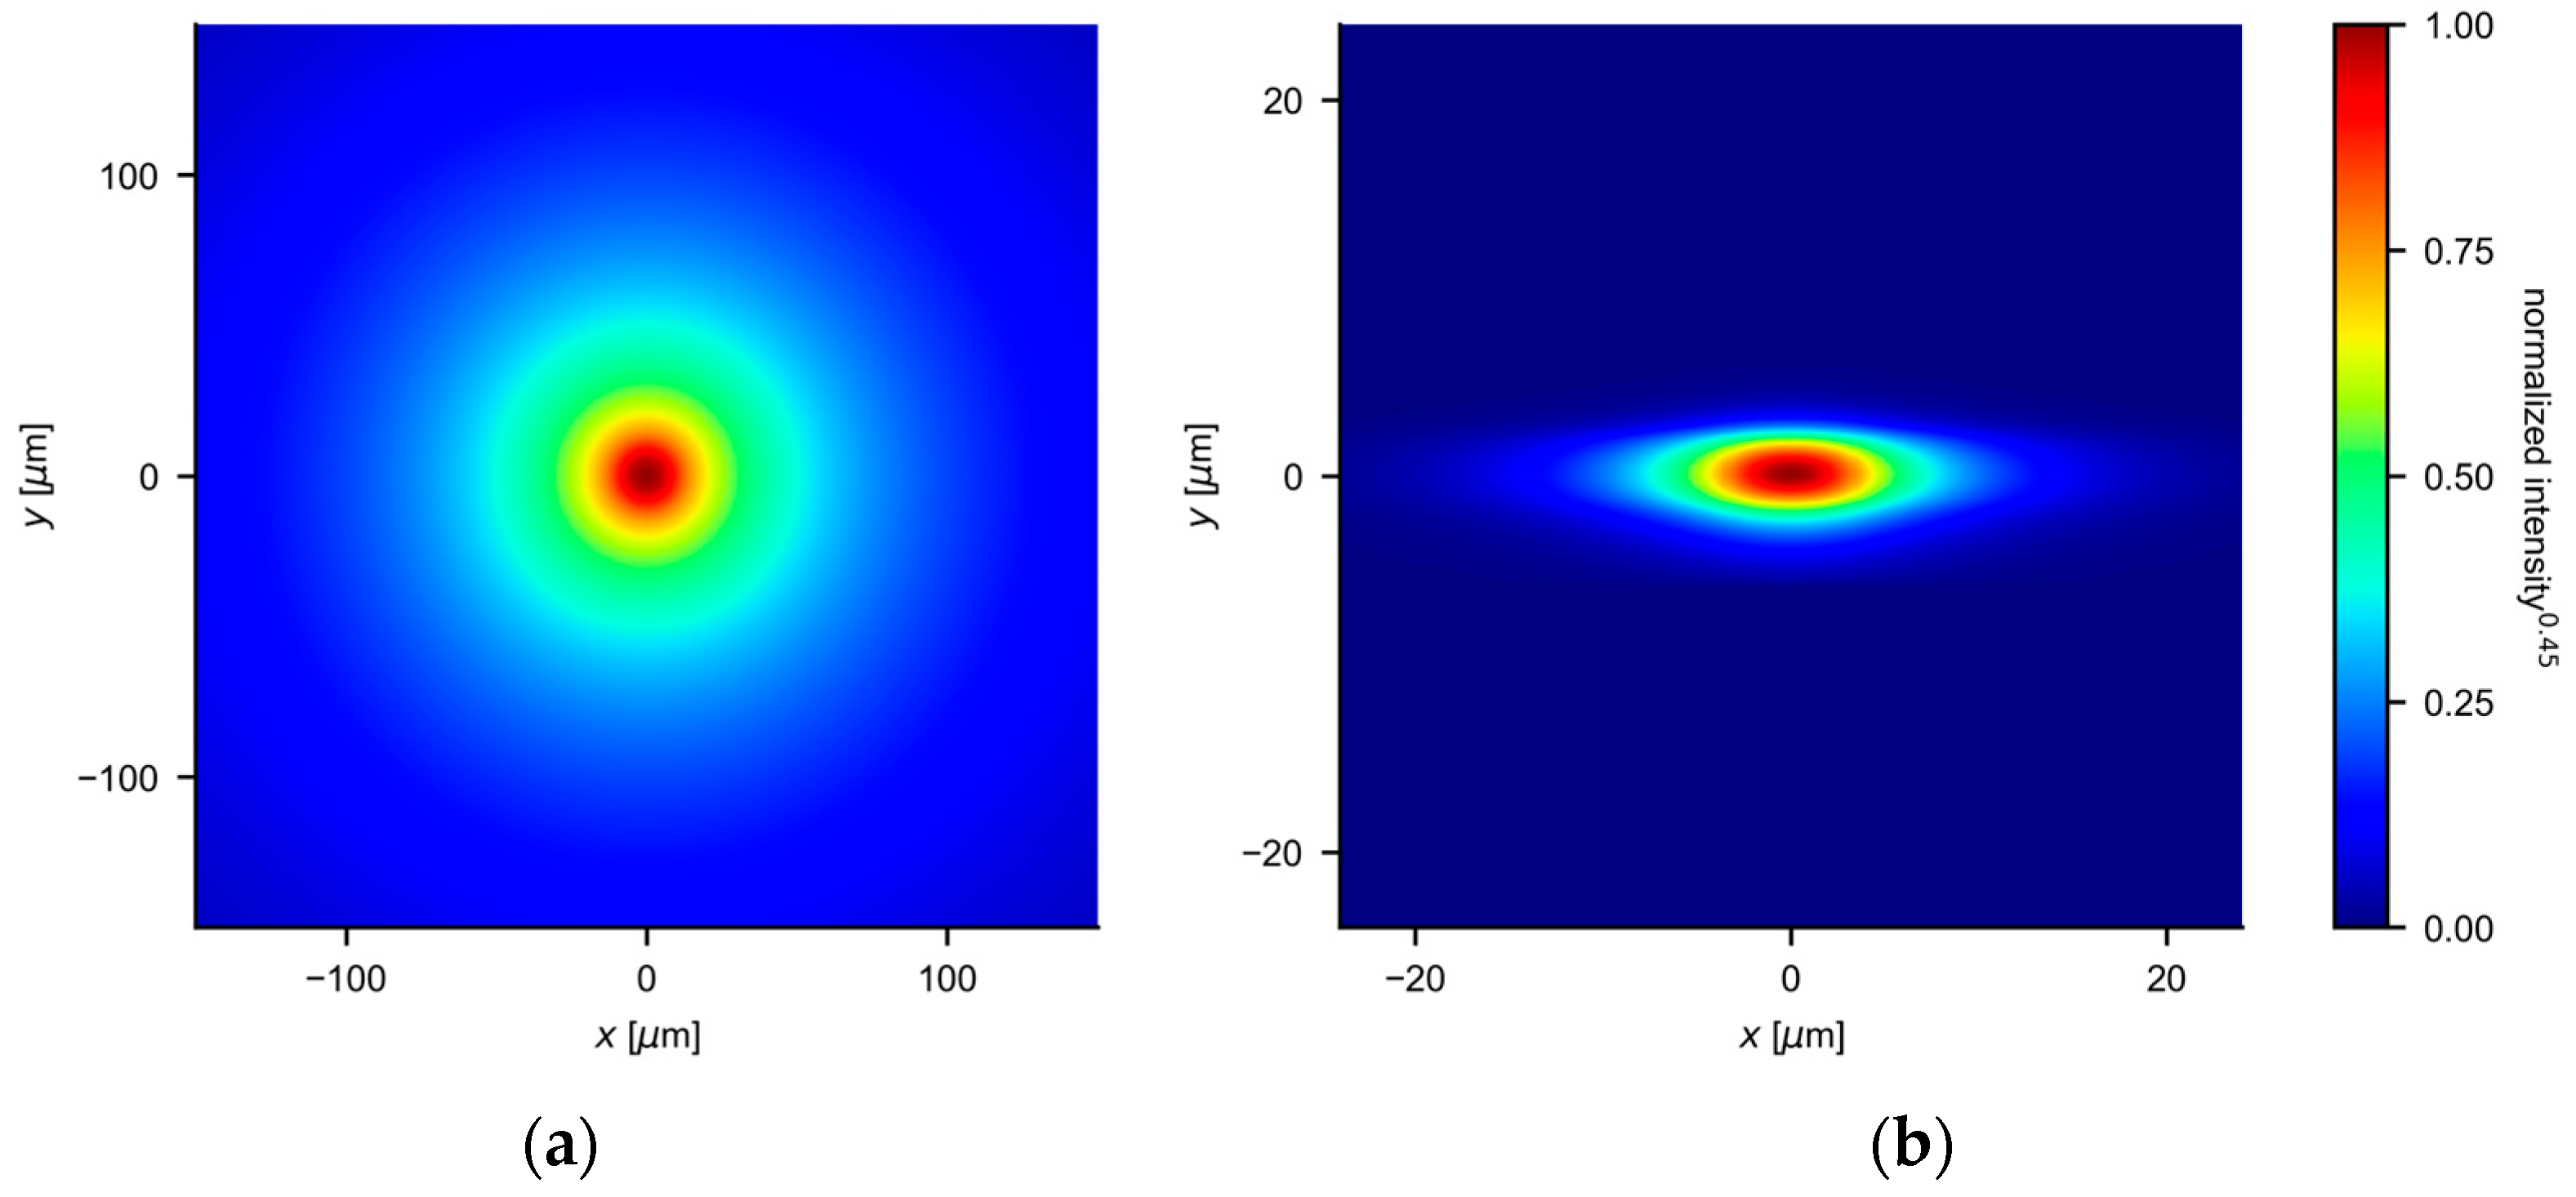
These throughput values describe the ideal aberration-free acceptance of the three reception configurations. In the normalized raw null, the common unaberrated coupling factor of each reception configuration appears in both the dark port and bright port powers and therefore cancels. However, the device-specific acceptance-mode shape and the fixed optimized injection scale remain in the complex coupling coefficients when aberrations are introduced. The present comparison therefore isolates the normalized stellar leakage induced by aberrations. It is not an end-to-end sensitivity comparison and does not include planet throughput, thermal background, or device transmission losses. Figure 1 shows the normalized focal plane acceptance fields of the two single-mode devices. Their corresponding backpropagated pupil-plane weightings are examined in Section 3.1.

2.2. NCPA to Null Transfer

2.2.1. Free-Space Beam Combination

The complex pupil fields in the two interferometric arms are
E l ρ = P ρ exp   i Φ l ρ ,     l = 1 , 2 ,
where ρ is the pupil plane coordinate, P is the pupil amplitude transmission, Φ l is the phase error in arm l. We define the differential phase as Δ Φ   =   Φ 1     Φ 2 .
For a finite circular focal-plane aperture, let A a x denote its amplitude transmission, where x is the focal-plane coordinate. The dark port and bright port powers are obtained by integrating the focal-plane intensity over this aperture. The raw null is therefore
N F S   =   A a F   P e i Φ 1     e i Φ 2 2 A a F   P e i Φ 1   +   e i Φ 2 2 ,
the free-space raw null represents the detector-collected destructive-output power normalized by the corresponding constructive-output power, and is used here as a measure of coherent stellar leakage induced by differential phase errors between the two arms. where F denotes the Fourier transform and 2 denotes focal plane intensity integration. For small phase errors, Equation (2) becomes
N F S     1 4 A a F P Δ Φ 2 A a F P 2 ,
when A a     1 , the detector collects the complete focal plane. Parseval’s relation then gives N F S     1 4 Δ Φ 2 P 2 , where P 2 denotes a pupil average weighted by P 2 . A finite aperture rejects the field outside the aperture but retains multiple spatial degrees of freedom within it. It therefore changes the transmission of individual aberration modes without reducing the accepted field to a single complex amplitude.

2.2.2. Single-Mode Spatial Filtering

Let M S M be the normalized focal plane acceptance mode of a single-mode device. Its backpropagated pupil-plane weighting is W S M   =   F 1 M S M . A single-mode device retains only the complex projection of the incident field onto this mode. The corresponding raw null is
N S M   =   P e i Φ 1     e i Φ 2 , W S M P e i Φ 1   +   e i Φ 2 , W S M 2 . .
For any pupil function f , we define the normalized weighted projection as f W S M   =   P f , W S M P , W S M .
For small phase errors, Equation (4) reduces to
N S M     1 4 Δ Φ W S M 2 .
A finite aperture sums the powers carried by several accepted spatial channels, whereas a single-mode device retains one complex projection. The modulus and argument of this projection determine the coupled amplitude and phase. If the acceptance weighting has a particular spatial symmetry, the first-order projection of some phase modes can vanish, reducing their leading leakage contribution from O Φ 2 to O Φ 4 .
Equation (4) assumes identical normalized acceptance modes and equal unaberrated coupling in the two arms. It does not require the aberrated coupling coefficients to remain equal after independent NCPA screens are introduced; differential acceptance modes or coupling efficiencies can produce zeroth-order leakage and give the two NCPA screens different modal weights. Differential amplitude and polarization mismatches are examined in Supplementary Section S3.

2.2.3. Propagation of Statistical Parameters

For the random NCPA ensemble, the phase in arm l is written as
Φ l ρ   =   2 π λ r l Φ ^ l ρ , R N C P A   =   r 1 2   +   r 2 2 ,
where r l is the NCPA OPD RMS in arm l, and Φ ^ l is a zero-mean, piston-free spatial realization normalized by Φ ^ l 2 P 2 = 1 .
For two arms drawn from the same zero-mean ensemble, with zero cross-covariance between the relevant acceptance-weighted projections, the lowest-order ensemble means are
E N F S     1 4 2 π λ 2 K F S R N C P A 2 , E N S M     1 4 2 π λ 2 σ W 2 R N C P A 2 ,
where K F S and σ W 2 describe the responses of the finite aperture and single-mode spatial filters, respectively, to a unit-RMS phase screen. Their full definitions are given in Supplementary Section S1. Statistical independence is sufficient for the cross-covariance to vanish, but it is not necessary. If the two NCPA screens are correlated, the cross term remains and the mean leakage is no longer determined by R N C P A 2 alone. A controlled analysis of nonzero inter-arm correlation is presented in Supplementary Section S3.
The baseline model considers a symmetric, phase-only interferometer with piston removed from the NCPA screens. A residual piston OPD p l can be included through Φ l   =   2 π p l / λ   +   Φ ~ l , where Φ ~ l is the non-piston phase component. Substitution into Equations (2) and (4) propagates the piston and the calculated non-piston coupling response jointly to the dark output. The finite aperture channel expansion, the single-mode perturbation expansion, the ensemble-average derivation, and the correlated arm extension are provided in Supplementary Section S1.

2.3. Stochastic Phase Models

The AO residual is generated from an AO-corrected phase Power Spectral Density (PSD) parameterization following Fétick et al. in Ref. [25]:
W ϕ ( f )   =   AM ( f , α x , α y , θ , β )   +   C , f     f AO W ϕ , VK ( f ) , f   >   f AO ,
Within the corrected band, M is the normalized elliptical Moffat component used in the Fétick model. The parameters α x and α y set its spatial-frequency widths, θ gives its orientation, and β controls its shape. Because M is normalized over the corrected band, A is its integrated phase-variance contribution, while C is the constant PSD floor. Outside the corrected band, the residual follows the von Kármán atmospheric spectrum W ϕ , V K .
Here, f x and f y are the two-dimensional pupil-plane spatial-frequency components, and the radial spatial frequency is
f   =   f x 2   +   f y 2 .
AO correction cutoff is
f AO   =   N act 2 D ,
where D is the telescope diameter and N a c t is the effective number of actuators across the pupil.
The reference AO residual phase PSD W ϕ , 0 f is constructed at λ 0   =   500   n m using the Fétick et al. parameterization and the values set listed in Table 1 [25]. These parameters define a fixed, reproducible benchmark rather than a reconstruction of a specific AO observation. The reference phase PSD is first converted into a wavelength-independent OPD PSD:
W O P D f   =   λ 0 2 π 2 W ϕ , 0 f .
Each OPD realization is then generated and converted to phase at the science wavelength λ s c i   =   10.6   μ m :
δ A O k r   =   F 1 W O P D f Δ f x Δ f y   ξ k f ,     ϕ A O k   =   2 π λ s c i δ A O k ,
Here, Δ f x and Δ f y are the spatial-frequency sampling intervals, and ξ k is the normalized complex Gaussian spectrum used to generate the k-th realization. The resulting δ A O k r and ϕ A O k r , λ s c i are, respectively, the AO residual OPD screen and its phase representation at the science wavelength, with r denoting the pupil-plane coordinate. This conversion preserves the same OPD residual; the physical spatial-frequency grid and f A O are not rescaled.
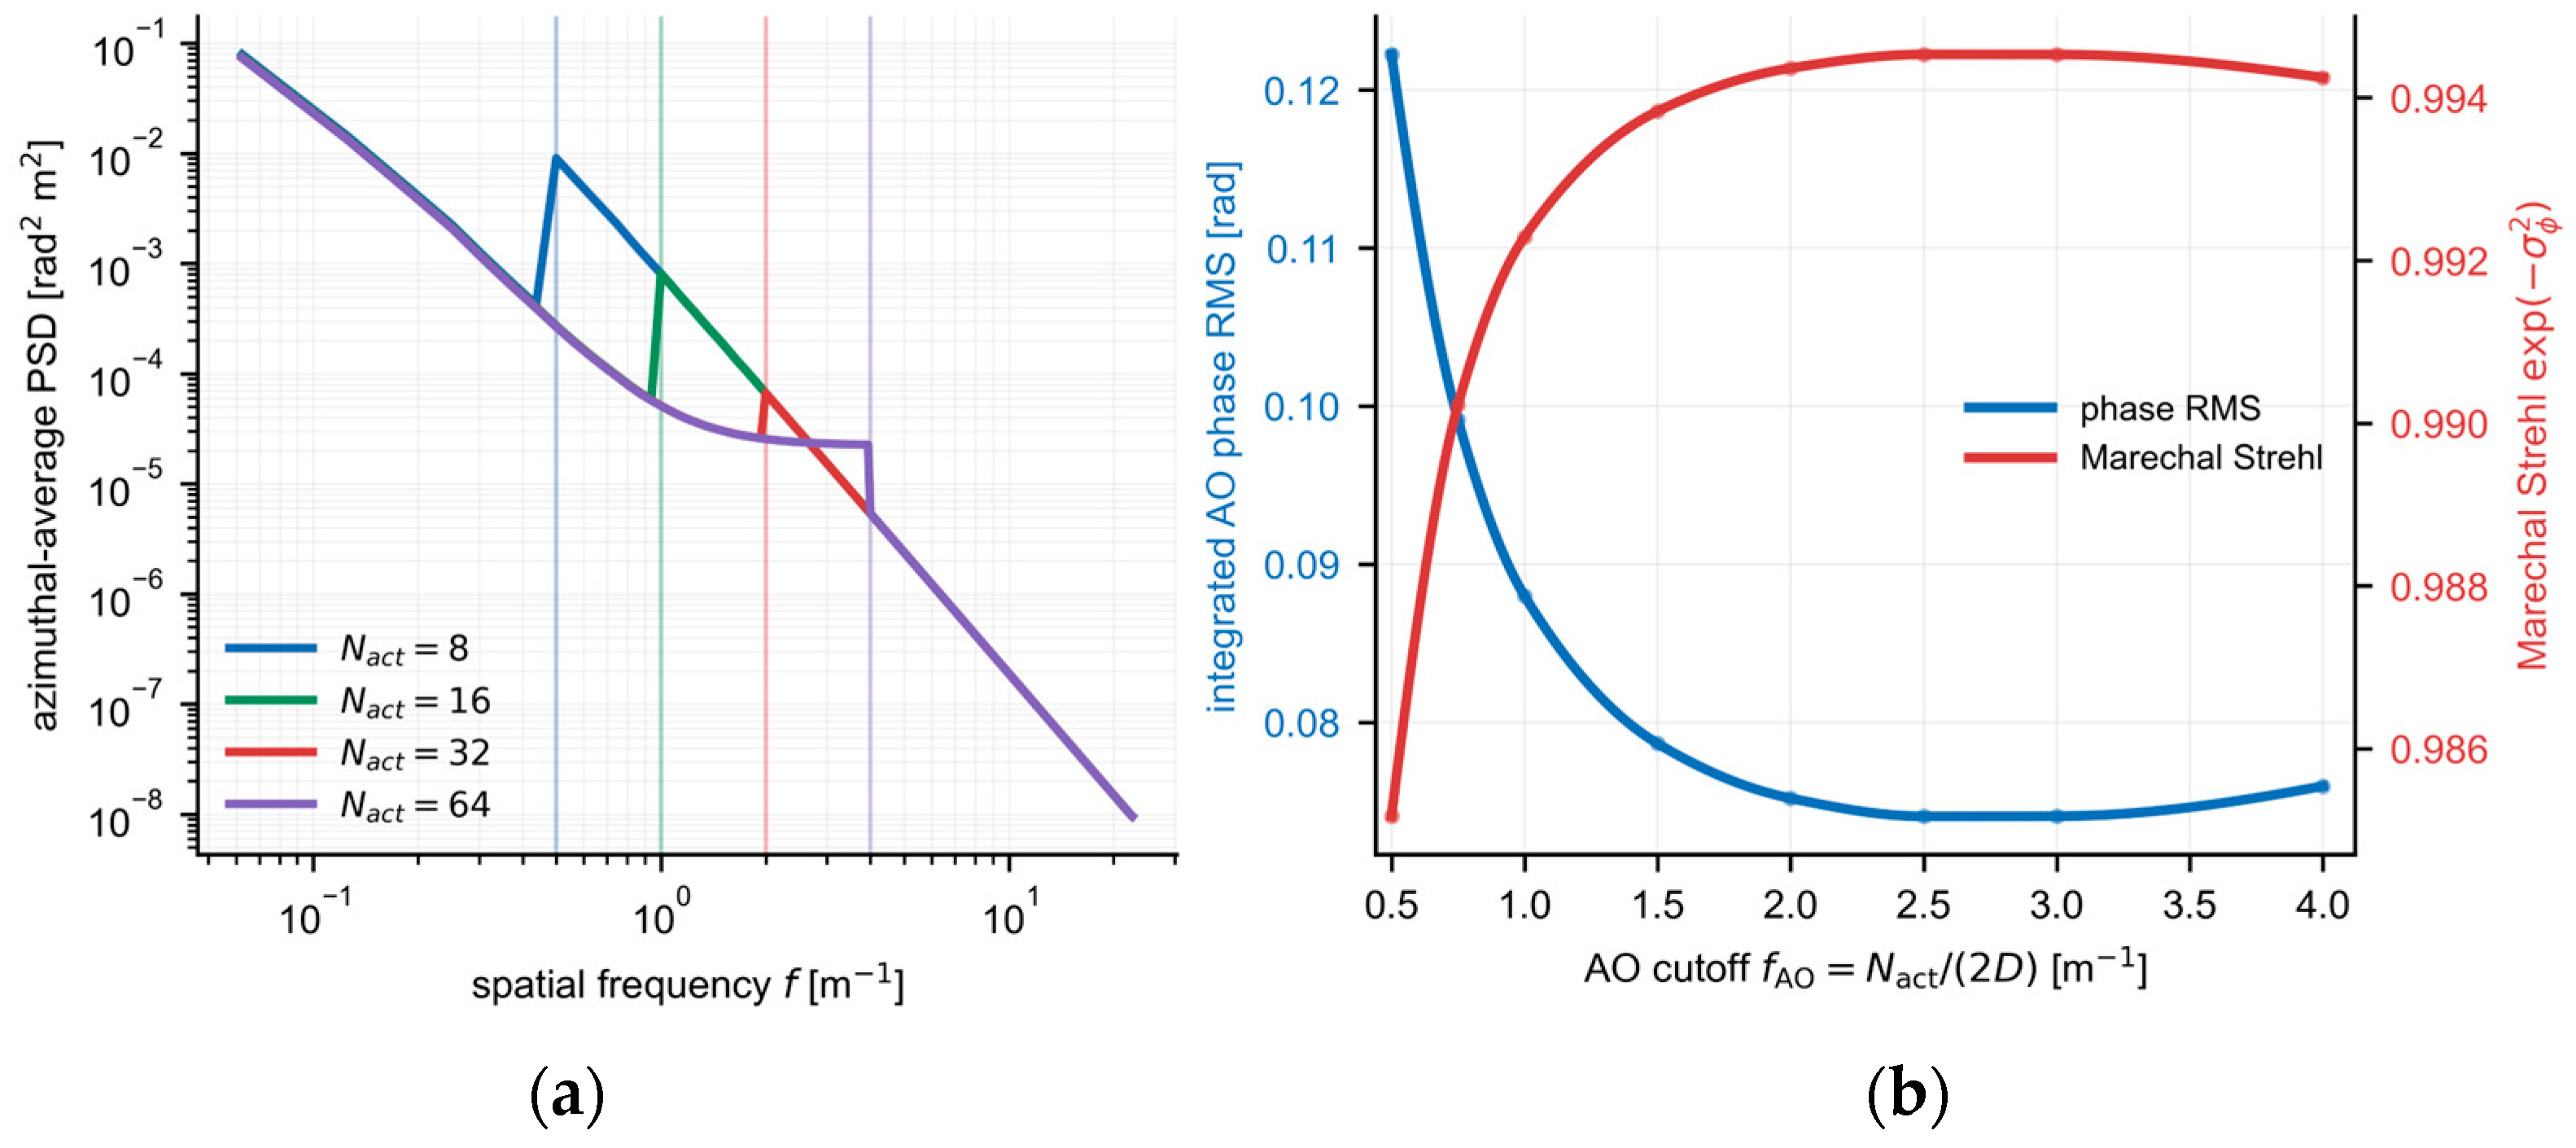
Figure 2 shows the residual PSD for different Nact values and the corresponding integrated phase RMS and Maréchal Strehl at λ   =   10.6   μ m . The effect of N a c t = 20, 32, 40, 41, and 48 on the AO residual and its propagation into null leakage is examined in Supplementary Section S3.
The static NCPA is represented by an extended Sauvage-type ensemble following the radial-order-weighted Zernike construction of Paul, Sauvage, and Mugnier [24]. Real-valued Zernike modes Z j     Z n j m j , with j   =   2 , , 200 , are used. Piston ( j   =   1 ) is excluded, whereas tip/tilt ( j   =   2 , 3 ) is included. Each mode is sampled on the same binary circular pupil; its pupil mean is removed, and it is normalized to unit pupil-weighted RMS. The unnormalized realization and the prescribed-RMS NCPA screen are
w ~   =   j = 2 200 ξ j n j Z j ,     ξ j     N 0 , 1 ,
and
w   =   σ N C P A w ~     w ~ P w ~     w ~ P 2 P ,
Here, w ~ is the unnormalized dimensionless NCPA realization, and the ξ j are mutually independent standard Gaussian variables. The factor n j 1 specifies the radial-order weighting. The notation P denotes the pupil-weighted average; w is the final NCPA OPD screen, and σ N C P A is its prescribed pupil-weighted OPD RMS. Thus, before the realization-dependent fixed RMS normalization, the modal coefficient variances are proportional to n j 2 . The complete index convention and discrete pupil normalization are provided in Supplementary Section S2.
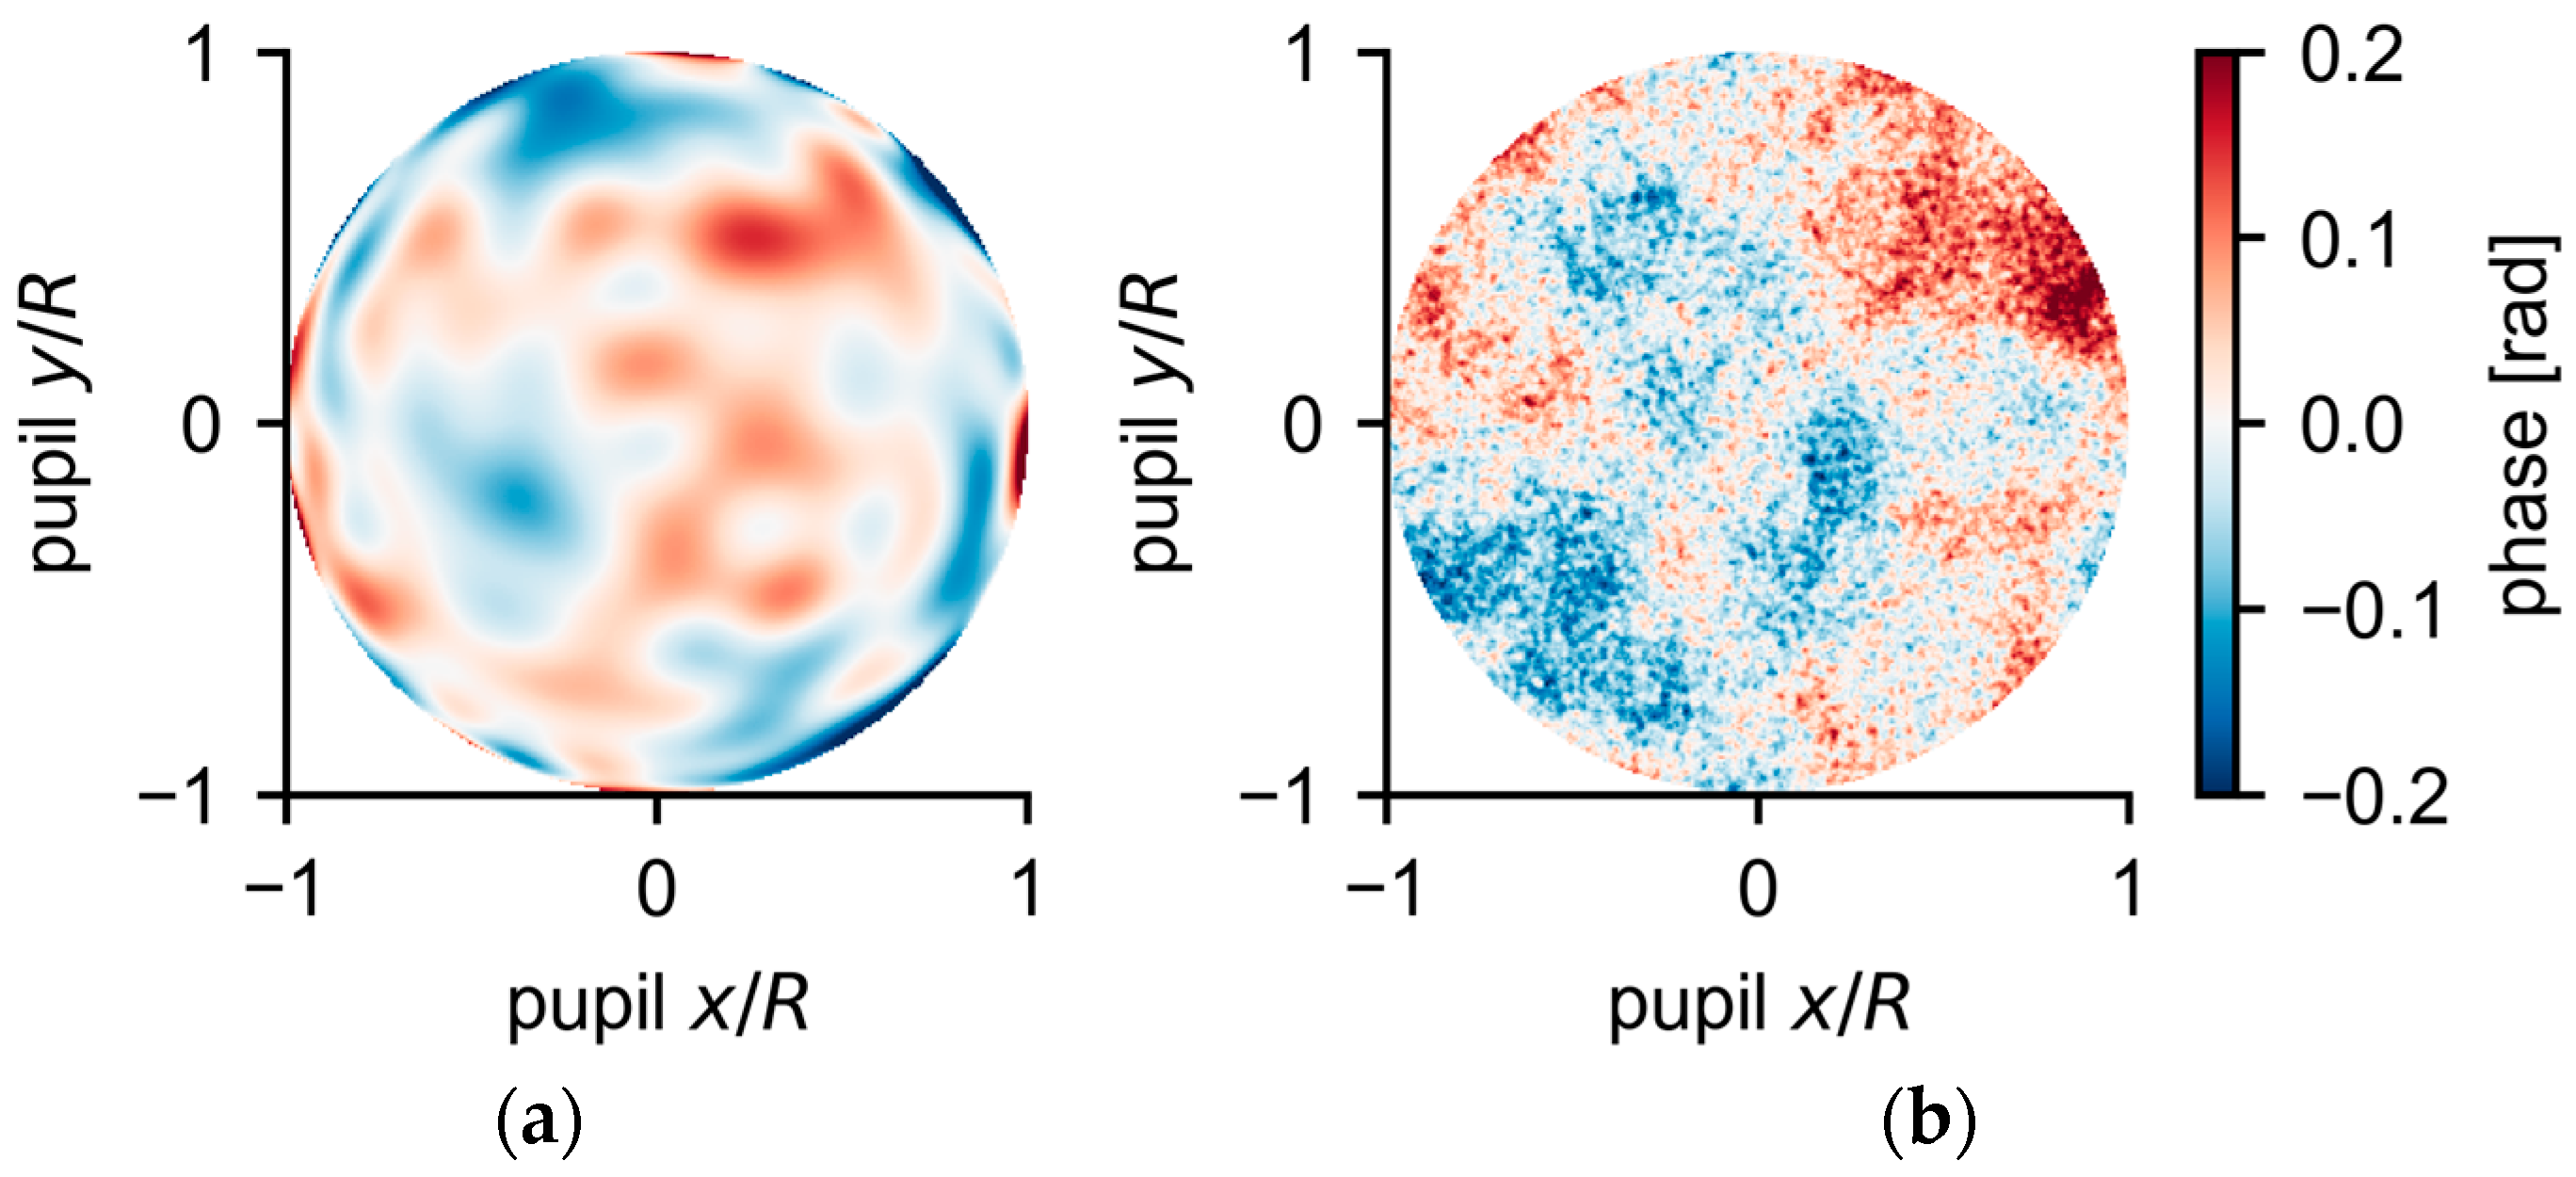
Figure 3 shows one representative extended Sauvage-type NCPA screen in panel (a) and one N act   =   40 AO residual phase screen in panel (b).

3. Results

3.1. Spatial-Filter Dependent Modal Selectivity

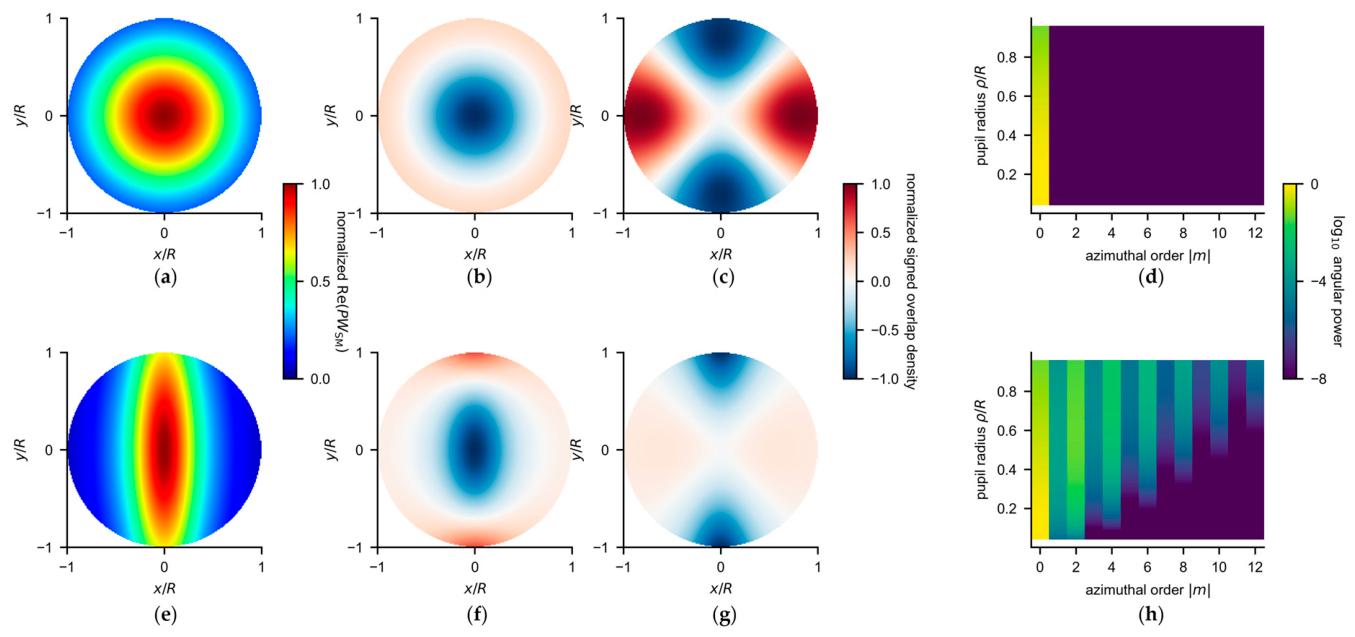
Equation (5) shows that the leading single-mode leakage is determined by the squared modulus of the first-order weighted phase projection, rather than by the total NCPA RMS alone. Figure 4a,e shows the normalized pupil plane weights obtained by back-propagating the focal-plane acceptance fields introduced in Section 2.1. The Houizot fiber produces a nearly rotationally symmetric pupil weight, whereas the Labadie waveguide produces a strongly elongated weight.
For a unit RMS aberration mode Z n m , we quantify its normalized first-order projection by
β n , m     P Z n m , W S M P , W S M .
Figure 4b,c,f,g shows the corresponding signed overlap densities P Z n m W S M * for defocus and astigmatism. Defocus is the n = 2, m = 0 radial mode and produces similar projections for the two devices, with β 2 , 0   =   0.441 for the Houizot fiber and 0.421 for the Labadie waveguide. For the n = 2, m = 2 astigmatism mode, the positive and negative lobes cancel under the nearly circular Houizot weighting, giving β 2 , 2     5.6   ×   10 17 . The elongated Labadie weighting breaks this cancellation and retains a substantial astigmatism projection of β 2 , 2   =   0.379 . The overlap density maps are normalized separately for display, while β n , m provides the quantitative comparison.
To characterize the full angular selectivity, we expand the complex pupil kernel at each pupil radius as
K ρ , θ   =   P ρ , θ W S M ρ , θ   =   m = c m ρ e i m θ ,
where c m ρ   =   1 2 π 0 2 π K ρ , θ e i m θ   d θ . The angular power is defined as
P 0 ρ   =   c 0 ρ 2 , P m ρ   =   c m ρ 2   +   c m ρ 2 , m 1 .
Figure 4d,h shows that the Houizot fiber is concentrated almost entirely in the m = 0 channel. In contrast, the Labadie waveguide retains several low-order components. Figure 4a,e displays the globally phase-aligned real part of each pupil weighting for visualization only. The overlap coefficients and angular power distributions are calculated from the full complex kernel. Together, the explicit defocus and astigmatism projections show how this angular selectivity enters the first-order complex coupling coefficient.
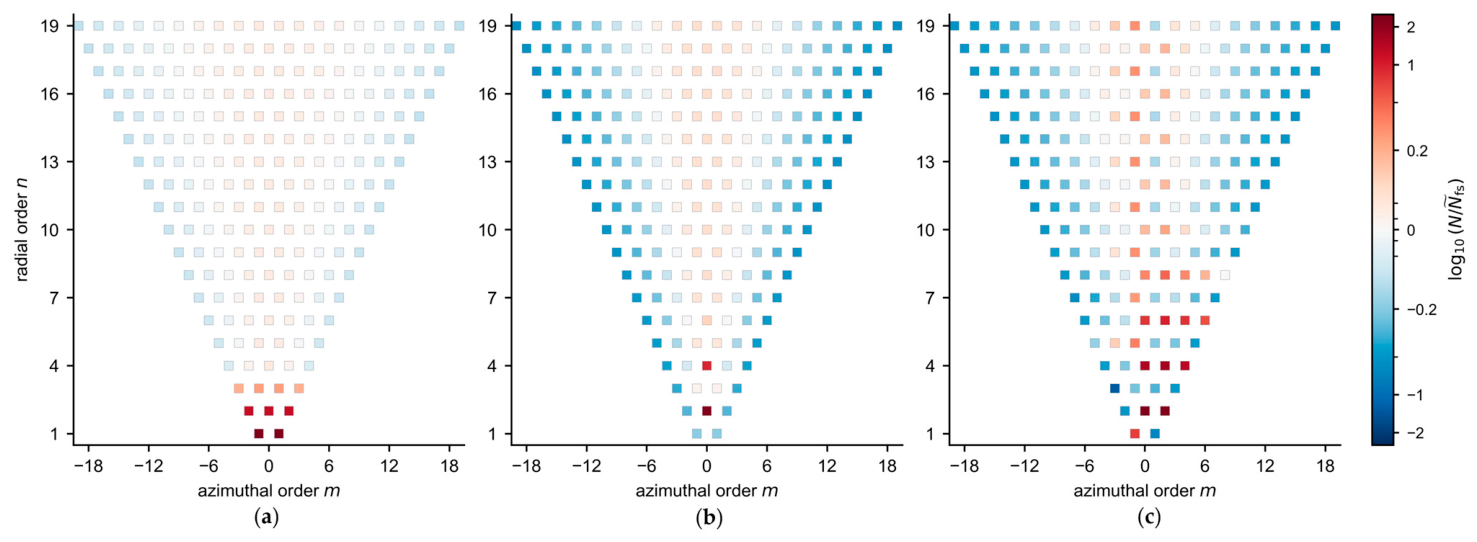
To quantify the leakage, Figure 5 compares the modal raw null responses of the three reception configurations. Each piston-free Zernike-like mode is applied to one arm with an OPD RMS of 100 nm, while the other arm remains aberration-free. The plotted quantity is log 10 N / N ~ FS , where N is the raw null obtained for the specified reception configuration and mode, and N ~ FS is the mean free-space raw null over all displayed modes. The finite aperture free-space responses are distributed around this reference level, whereas most responses of the two single-mode devices fall below it. Single-mode projection therefore changes how individual two-dimensional phase modes contribute to the destructive output.
The suppression depends strongly on angular order. Radial modes with m = 0, together with some low m modes, are generally less strongly suppressed. Higher-order angular modes usually produce lower leakage, particularly for the nearly circular Houizot acceptance field. This trend agrees with the angular channel analysis in Figure 4. The Houizot fiber mainly retains the radial channel, while the noncircular Labadie acceptance field also couples to several low-order angular channels. The three reception configurations therefore respond differently to NCPA modes with the same OPD RMS.
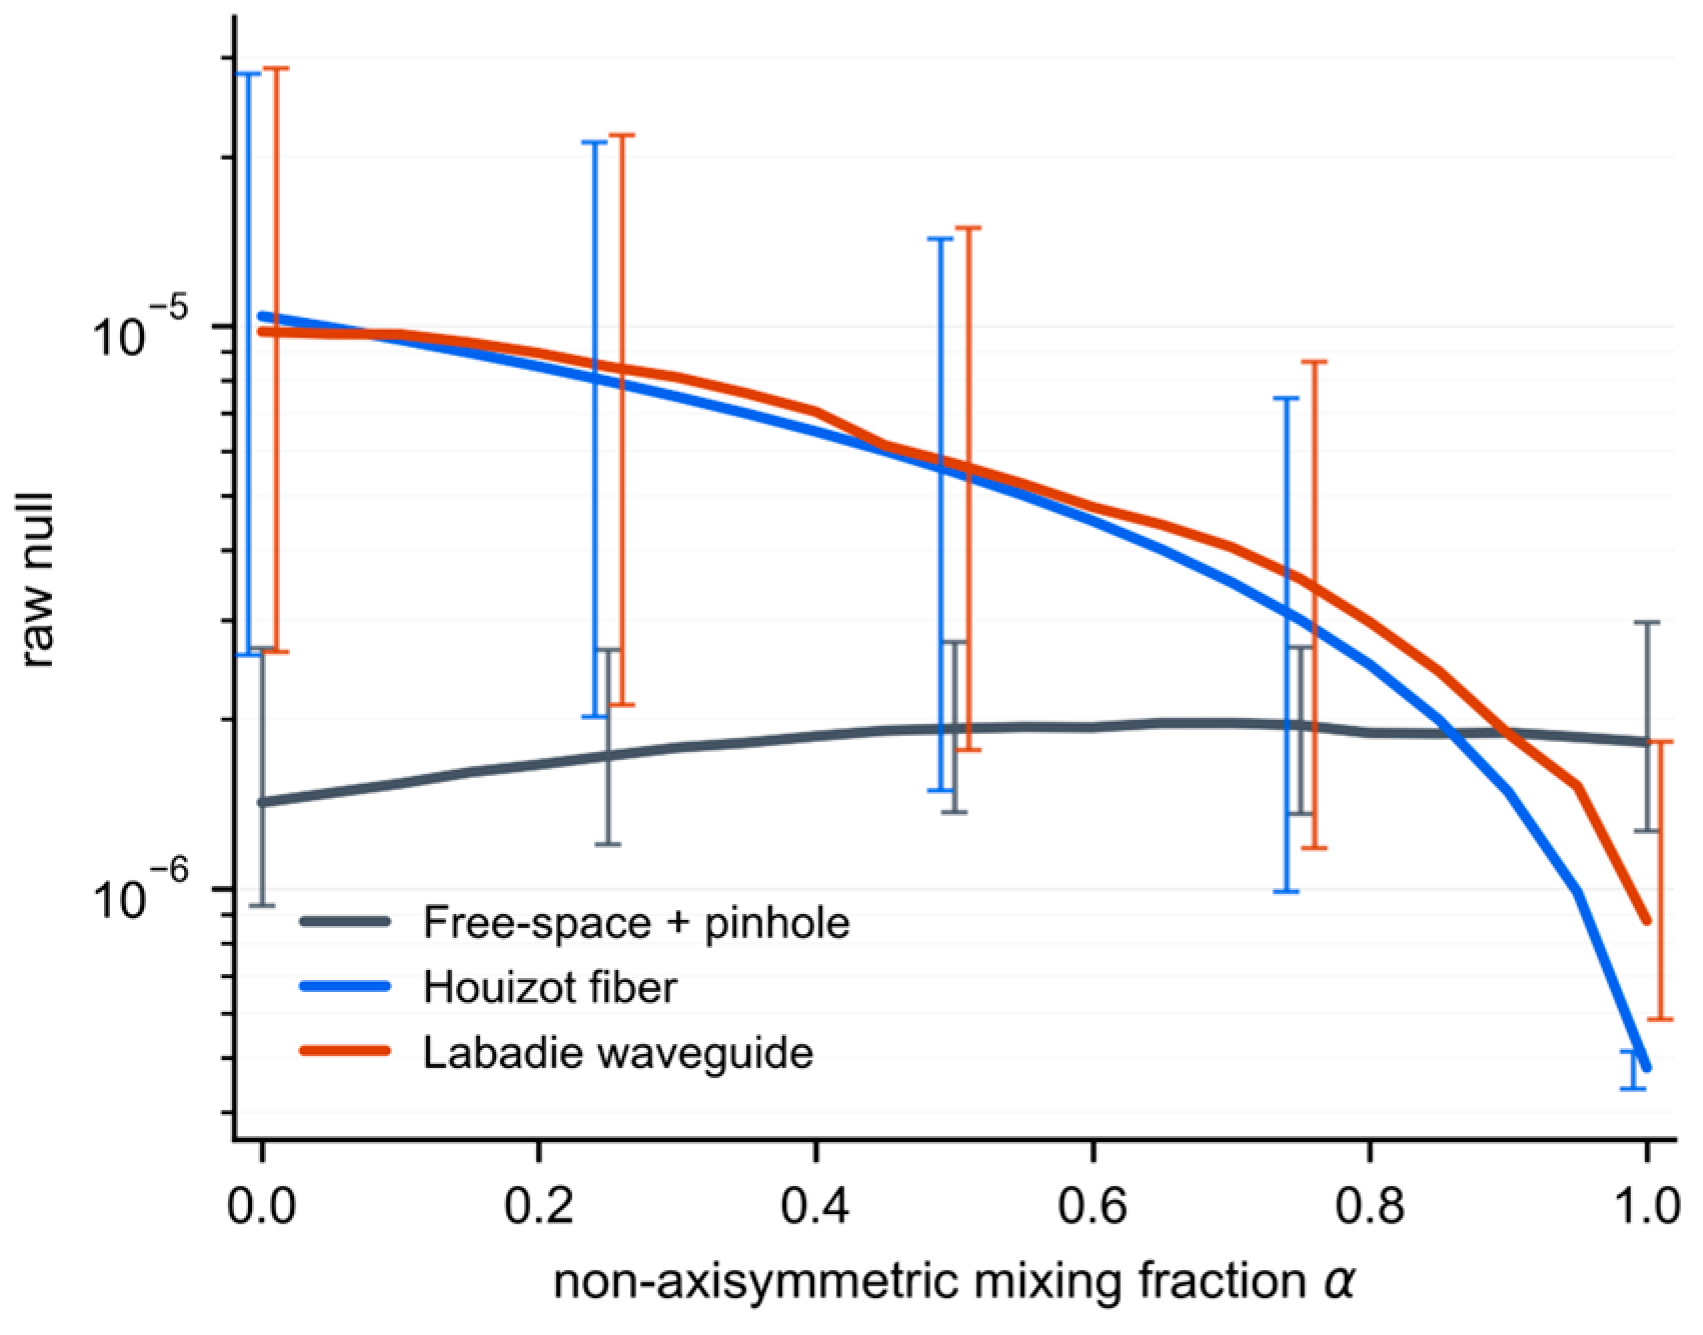
A single-mode calculation for one modal basis element does not represent a realistic mixed NCPA screen. Figure 6 tests whether the modal selectivity in Figure 5 remains visible in random mixed screens. For each screen, the total OPD RMS is fixed at σ N C P A   =   100   n m and the phase is constructed as w α   =   σ N C P A α   Φ ^ m 0   +   1 α   Φ ^ m = 0 , where α is the angular mode energy fraction. where Φ ^ m   =   0 and Φ ^ m     0 are unit RMS components drawn from the radial and azimuthal Zernike subspaces, respectively. For each realization, the same two normalized components are retained at every value of α and only their relative weights are changed. Thus, α   =   0 gives a purely radial screen and α   =   1 gives a purely azimuthal screen.
The free-space configuration shows a much weaker dependence on α than the two single-mode devices. Its modest variation is consistent with the weaker angular selectivity of a multichannel aperture and its sensitivity to low-order azimuthal modes, including tip and tilt. In contrast, the median raw null decreases markedly with increasing α for both single-mode spatial filters. Their interquartile ranges also narrow, showing that single-mode suppression depends on the angular composition of the NCPA ensemble.
The two single-mode devices respond differently. As α approaches one, the Houizot fiber produces a lower median leakage and a narrower interquartile range. The Labadie waveguide also suppresses the leakage, but its median remains higher, and its interquartile range remains broader. This difference agrees with the modal analysis in Figure 4: the nearly circular Houizot weighting is dominated by the radial channel, whereas the noncircular Labadie weighting retains additional low-order angular channels.

3.2. Two-Arm NCPA Statistical Baseline Without AO

We now extend the one-arm modal analysis to two independently aberrated interferometric arms. For NCPA OPD RMS values r1 and r2, let N ij r 1 , r 2 denote the raw null obtained from NCPA screen pair i and AO residual pair j. In the present AO-free analysis, the AO residual is set to zero, so the mean raw null is calculated only over the independently generated NCPA pairs. The index j is retained for the AO-inclusive analysis in the following sections.
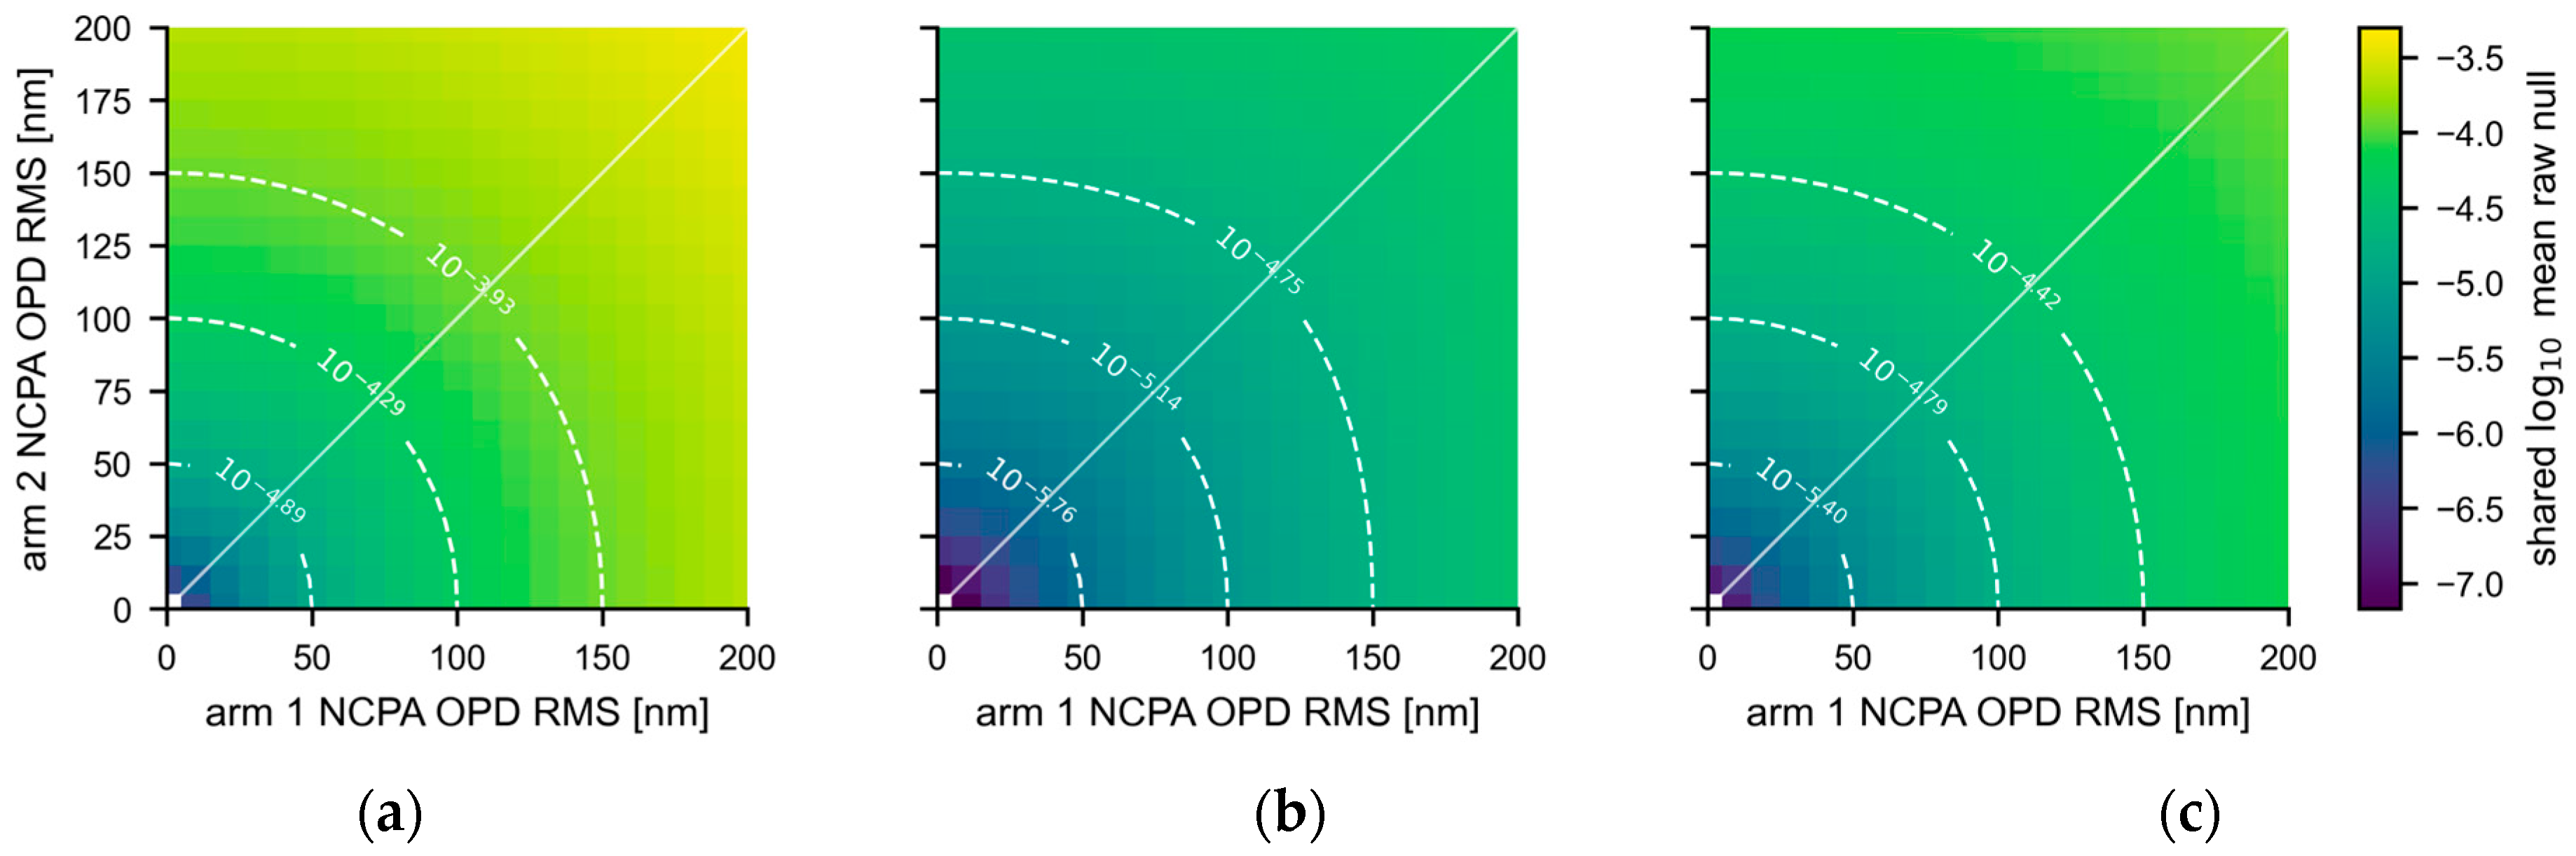
Figure 7 shows the mean raw null as a function of r1 and r2 for the three reception configurations under the AO-free, phase-only condition. In all three cases, the leakage varies approximately along quarter-circular paths of constant combined NCPA RMS, R N C P A   =   r 1 2   +   r 2 2 . The mean leakage is therefore governed mainly by R N C P A and is less sensitive to how the total NCPA variance is divided between the two arms. The absolute leakage level, however, remains strongly dependent on the reception configuration.

3.3. Persistence Under AO Residual

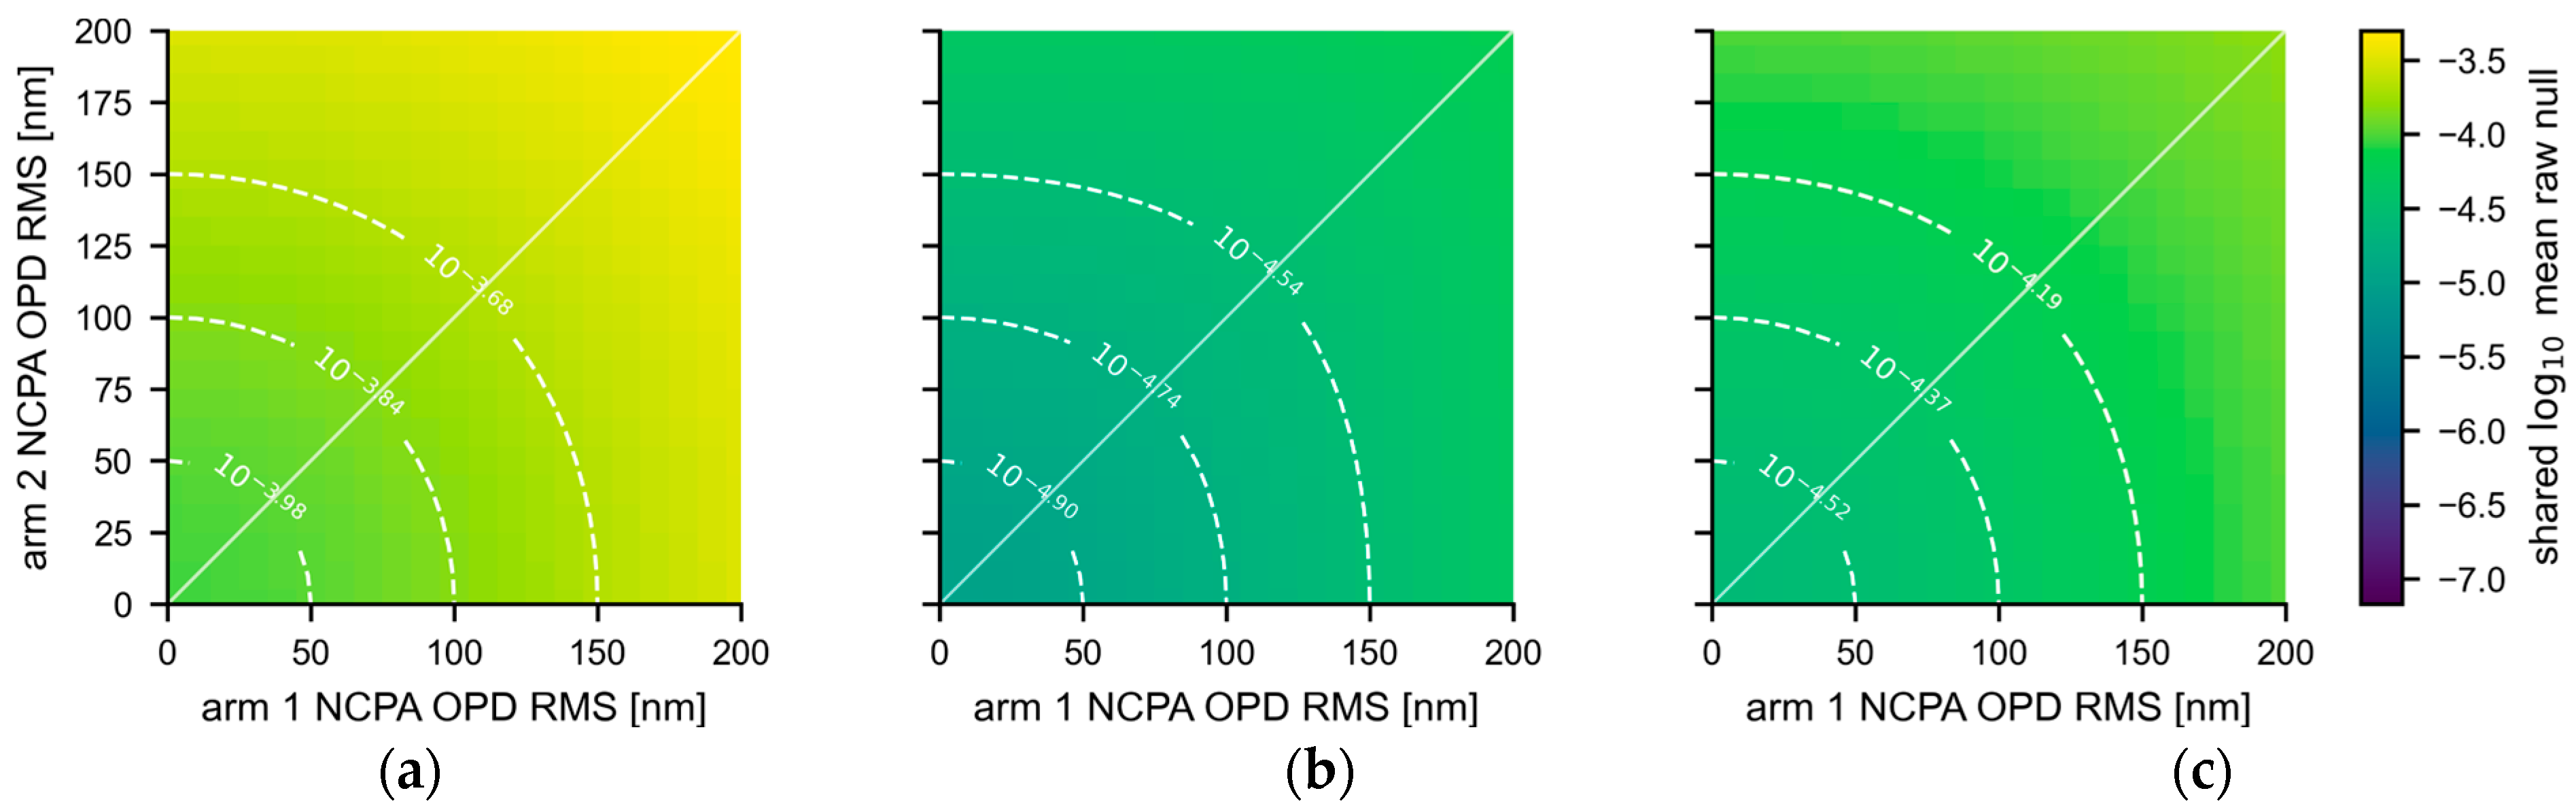
When AO residuals are included, the raw null at a given pair of NCPA OPD RMS values depends on both the NCPA screen pair and the AO residual pair. Figure 8 shows the mean raw null surfaces for the three reception configurations with AO residuals generated from the N a c t   =   40 PSD model. The averages are taken over both sets of random realizations.
Compared with the AO-free results in Figure 7, the leakage increases for all three reception configurations. The change is most apparent at small R N C P A , where the AO residual establishes a reception configuration-dependent leakage floor. Nevertheless, the mean leakage still varies primarily along paths of constant combined NCPA RMS. The AO residual therefore changes the absolute leakage level without removing the dominant dependence on R N C P A .
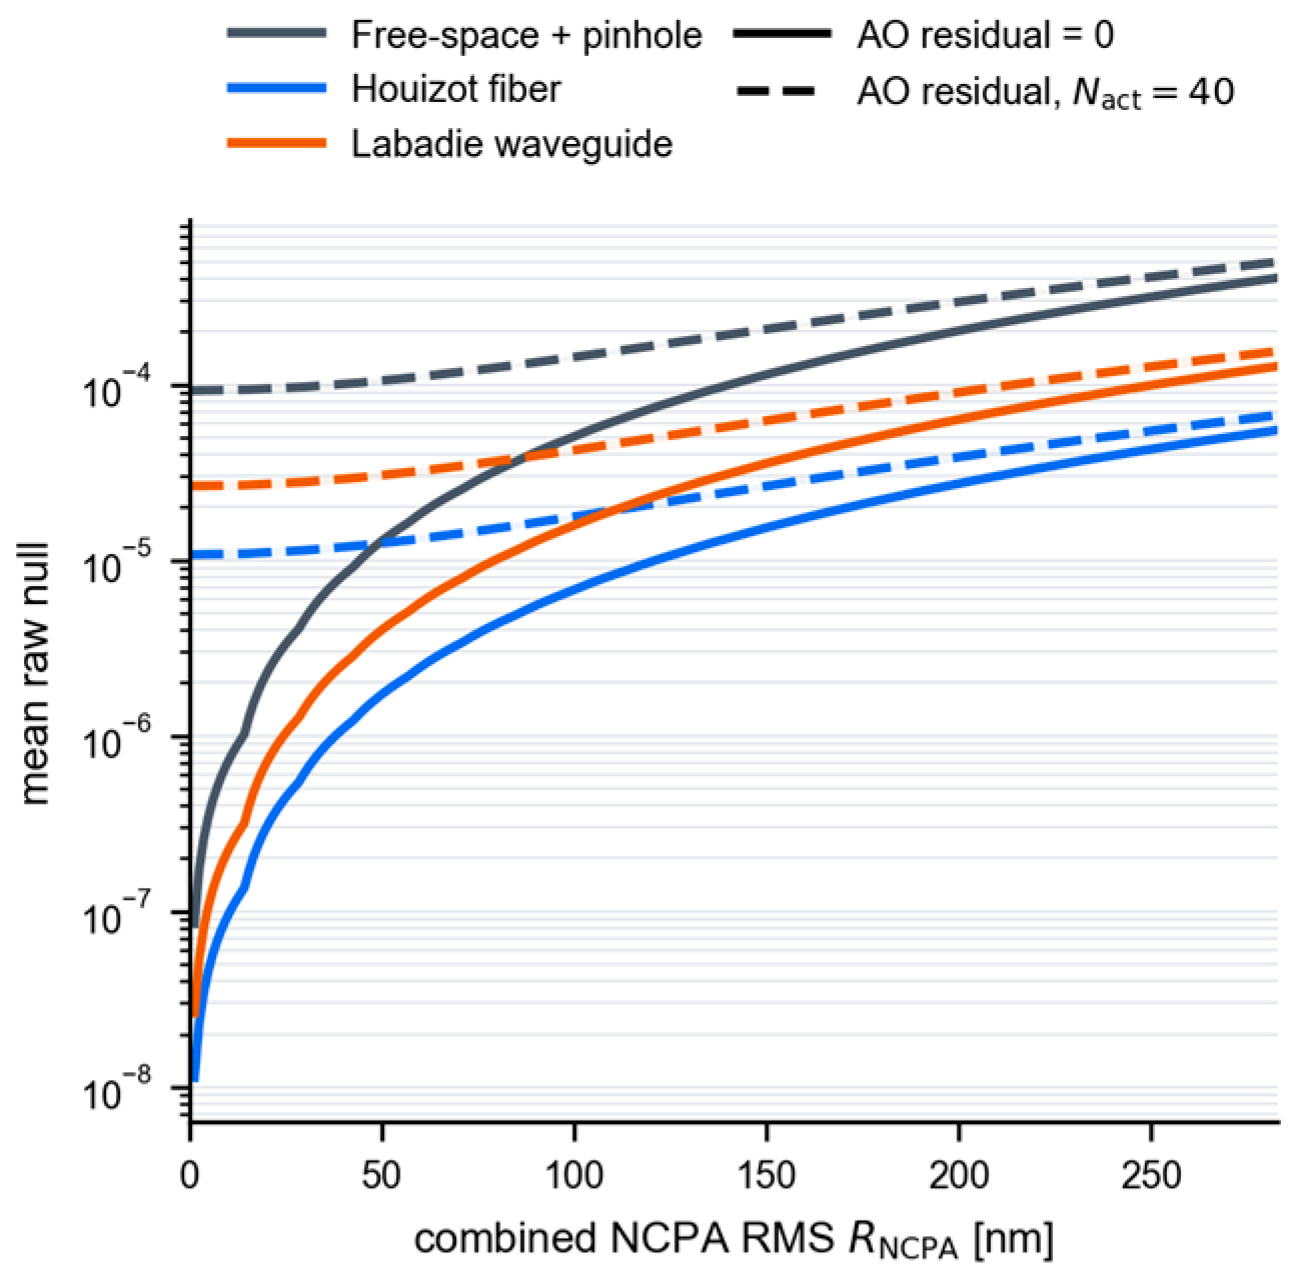
To compare the NCPA contribution directly with the AO residual floor, Figure 9 extracts the equal-arm direction, r 1   =   r 2 , from Figure 7 and Figure 8 and plots the mean raw null against R N C P A . Without AO residuals, the mean raw null increases monotonically with R N C P A , as expected for a static two-arm phase mismatch. All three AO-free curves reach N = 0 at R N C P A   =   0 ; these exact zero points are omitted because they cannot be displayed on the logarithmic axis. With the AO residual included, each reception configuration approaches a nonzero leakage floor at small R N C P A . The floor is highest for free-space propagation through the finite aperture and lower for the two single-mode devices. At larger R N C P A , the increase caused by NCPA remains visible. Thus, even at this high Strehl working point, the AO residual can raise the mean raw null by several orders of magnitude above the AO free prediction when the NCPA RMS is small.
To test whether R N C P A captures the dominant organization of the two-dimensional mean raw-null surface, we define μ N r 1 , r 2   =   E N r 1 , r 2 , y r 1 , r 2   =   log 10 μ N r 1 , r 2 , and approximate y using a fourth-order polynomial f R N C P A that depends only on the combined NCPA RMS. This polynomial is a numerical approximation of the radial trend, not a physical scaling law. Its order affects only how accurately that trend is represented. Because all points with the same R N C P A receive the same fitted value, the model cannot absorb differences caused by the allocation of RMS between the two arms.
The coefficient of determination is
R 2   =   1   r 1 , r 2 y r 1 , r 2 f R NCPA 2 r 1 , r 2 y r 1 , r 2 y ¯ 2 ,
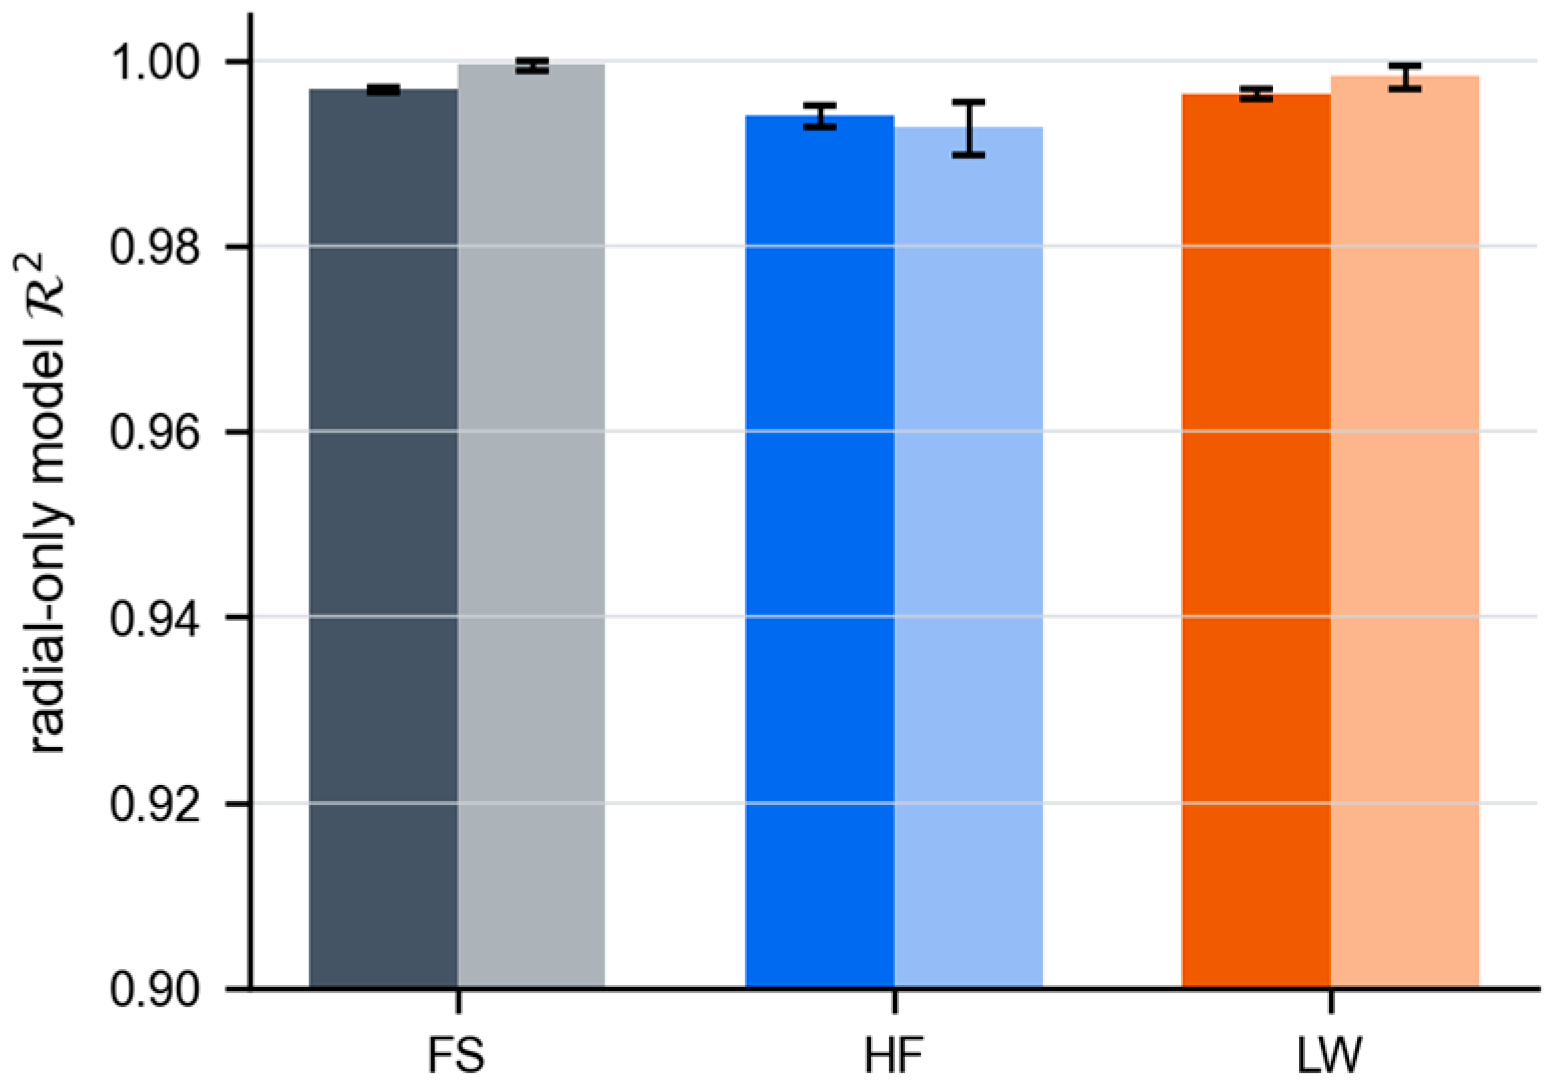
where y ¯ is the mean of all points on the surface. Figure 10 shows high R 2 values for all three reception configurations, both with and without AO residuals. Thus, for the NCPA ensemble considered here, R N C P A captures most of the variation in the mean raw-null surface as r 1 and r 2 change. This result does not imply that different NCPA structures with the same RMS produce identical leakage or that their spatial structure can be ignored. The remaining structural dispersion and modal dependence at fixed RMS are quantified by V s t r u c t and η r a d in Section 3.4 and Section 3.5.

3.4. Variance Decomposition of Null Fluctuations

Equal mean raw nulls do not imply equal statistical dispersions. We therefore use the law of total variance to decompose the second-order statistics of N ij r 1 , r 2
V a r i , j [ N i j ( r 1 , r 2 ) ]   =   V a r i [ E j ( N i j     i ) ] + E i [ V a r j ( N i j     i ) ] ,
here, i indexes the NCPA screen pairs, and j indexes the AO residual pairs. The structural component V s t r u c t   =   V a r i [ E j ( N i j     i ) ] measures how the AO-averaged leakage changes among NCPA screen pairs. The component V A O   =   E i [ V a r j ( N i j     i ) measures the typical fluctuation caused by AO residual realizations for a fixed NCPA pair, averaged over the NCPA ensemble.
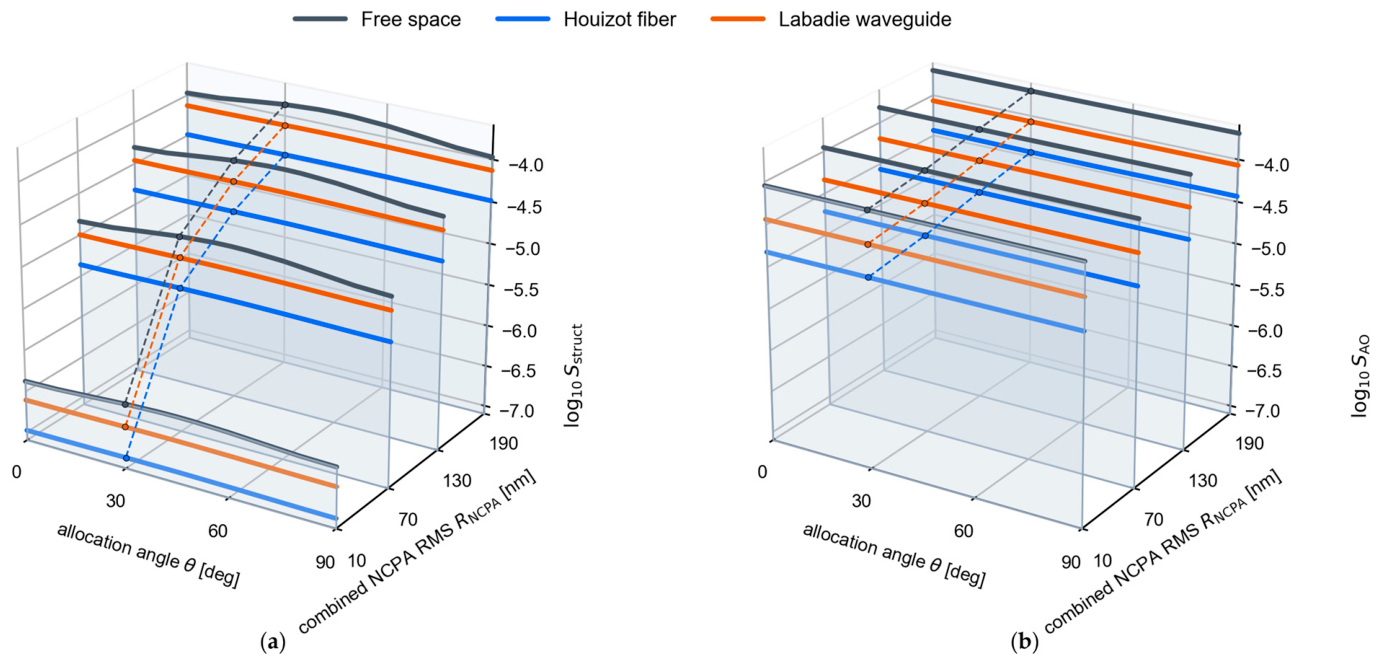
For comparison with the raw null, we use the corresponding standard-deviation scales, S s t r u c t   =   V s t r u c t , S A O   =   V A O . At fixed R N C P A , the division of OPD RMS between the two arms is parameterized as r 1   =   R N C P A cos θ , r 2   =   R N C P A sin θ , 0     θ     90 , where θ denotes the arm allocation angle in this section.
Figure 11a shows that S s t r u c t increases with R N C P A , but its dependence on the arm allocation differs among the reception configurations. For finite-aperture free-space propagation, changing θ at fixed R N C P A produces a substantial change in S s t r u c t , particularly at larger NCPA RMS. The two single-mode devices have lower S s t r u c t and a weaker dependence on θ .
Figure 11b shows a different behavior for S A O . Its magnitude depends on the reception configuration, with the finite-aperture free-space case giving the largest values and the two single-mode devices giving lower values. In all three cases, S A O varies only weakly with the arm allocation angle.

3.5. Association with Native Radial Content

Section 3.1 showed that radial and angular modal content are transmitted differently by the three reception configurations. We therefore examine whether the radial content that occurs naturally in the extended Sauvage-type NCPA ensemble is associated with the two-arm raw null statistics. For each NCPA screen pair, η r a d denotes the fraction of the combined squared Zernike coefficient carried by the axisymmetric modes with m = 0, weighted by the NCPA OPD variance in the two arms. Following the decomposition used in Figure 6, let α 1 and α 2 denote the fractions of azimuthal modal energy in the two-arm NCPA screens. Their radial fractions are therefore 1     α 1 and 1     α 2 . Since the NCPA variances in the two arms are r 1 2 and r 2 2 , the combined radial fraction is
η r a d   =   r 1 2 1     α 1   +   r 2 2 1     α 2 r 1 2   +   r 2 2 .
Unlike the prescribed α in Figure 6, α 1 and α 2 are measured from each random NCPA pair rather than controlled during its generation. The following results therefore describe statistical associations rather than controlled responses.
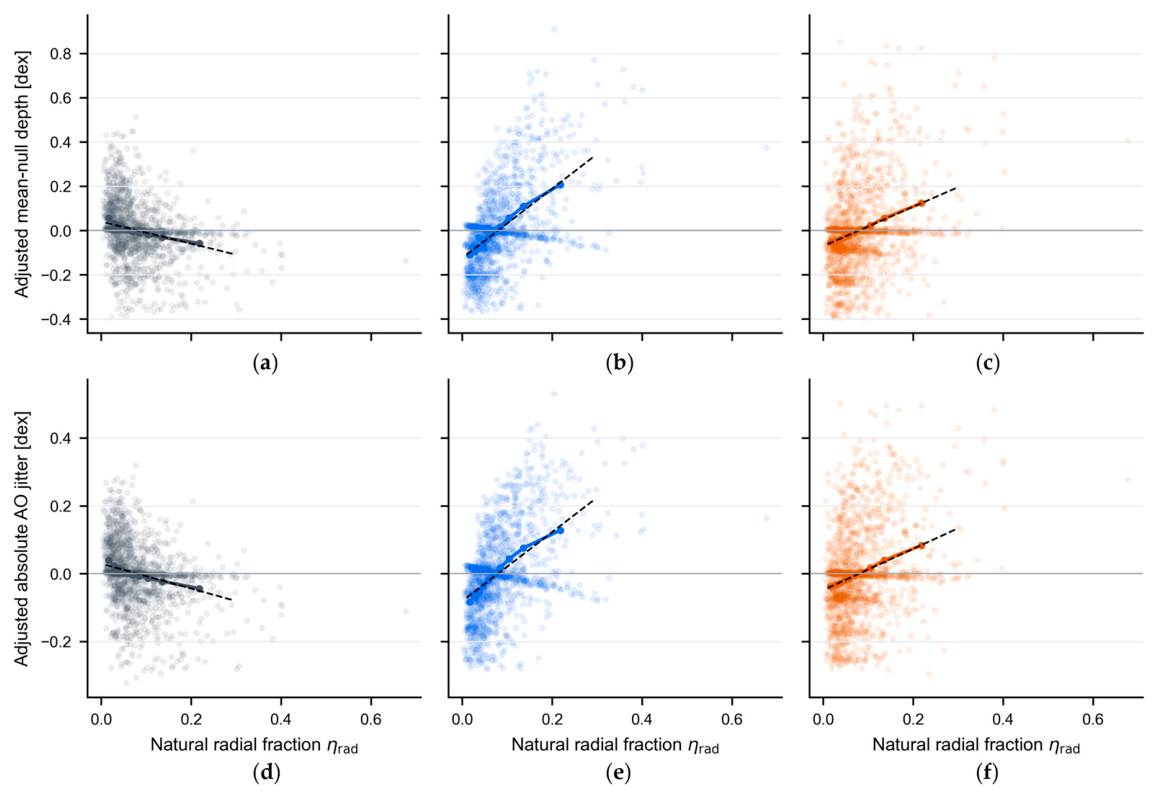
We then fit a linear model in each independent library and report the slope associated with the total radial fraction. Figure 12a–c shows that, in free space, the mean raw null has only a weak association with η r a d and may even show a negative trend. This behavior is caused by the sensitivity of free space to tip and tilt in the azimuthal component. When the tip and tilt modes are removed, the trend approaches zero correlation. In contrast, both single-mode spatial filters show positive trends. NCPA samples with a larger natural radial fraction tend to produce shallower nulls after averaging over the AO realizations, σ A O , i   =   Var j N i j     i , as shown in Figure 12d–f. A larger η r a d is associated with a larger σ A O , i , most clearly for the Houizot fiber and also for the Labadie waveguide. Free space still shows a weak or even negative association for the same reason described above. Thus, in the two single-mode spatial filters, the natural radial content of the NCPA is associated with both the mean leakage level and the fluctuation scale caused by AO residuals at the sample level.
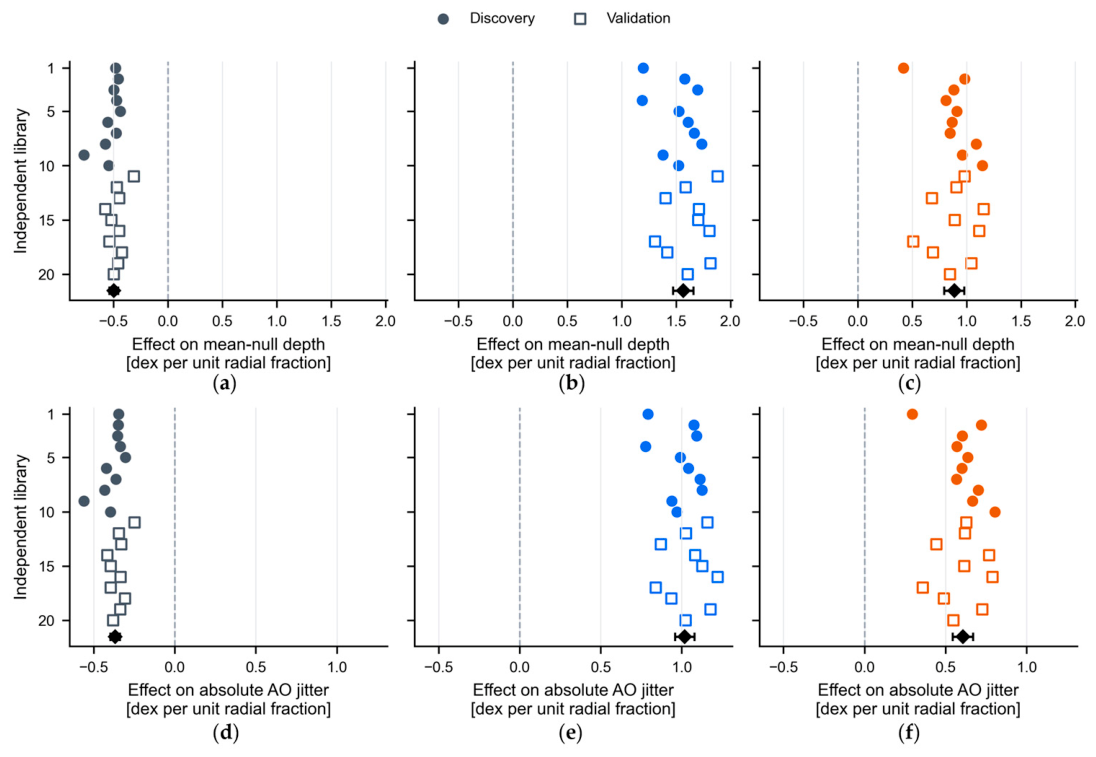
Figure 13 shows the slope estimate from each of the 20 independent libraries, allowing the reproducibility of the associations to be assessed across separate Monte Carlo batches. For the Houizot fiber and Labadie waveguide, the slopes for both the mean raw null and the absolute AO jitter remain positive in the discovery and validation libraries. The two sets therefore give consistent directions of association. Free space shows weaker negative slopes for both quantities, consistent with its sensitivity to tip and tilt discussed above. Although the slope magnitudes vary among independent libraries, their signs and relative differences between the reception configurations remain consistent. Within the extended Sauvage-type ensemble, the association of the natural radial fraction with larger mean leakage and stronger AO-induced fluctuations is therefore reproducible for the two devices with single-mode filtering.

3.6. Numerical Stability and Reproducibility

Figure 7, Figure 8, Figure 9, Figure 10, Figure 11, Figure 12 and Figure 13 are based on the same nested Monte Carlo data set. We generated B = 20 independent libraries, comprising 10 discovery libraries and 10 validation libraries. Each library contains I = 1000 independently generated two-arm NCPA screen pairs and J = 1000 independently generated two-arm AO residual pairs. Every NCPA pair is combined with every AO pair.
Samples that share the same NCPA or AO realization are not mutually independent. The complete I   ×   J array from each library is therefore treated as one independent statistical block. The reported quantities are the mean raw null μ N and the structural and AO fluctuation scales S s t r u c t and S A O defined in Section 3.4.
Numerical stability is assessed using a paired-block bootstrap, a comparison between 16 and 20 libraries, an independent seed validation, and a variance closure test. Table 2 summarizes the results. The finite sample estimators and the confidence intervals for differences between reception configurations are provided in Supplementary Section S4.
Table 2 shows that the main statistics have largely converged when the number of libraries increases from 16 to 20. Repeating the analysis with independent random seeds preserves the magnitude and trends of the results, as well as the performance ranking of the three reception configurations. The paired-block bootstrap intervals for the differences in log 10 μ N , log 10 S s t r u c t , and log 10 S A O between reception configurations do not cross zero over the analyzed R N C P A range. The conclusions are therefore not altered by the finite Monte Carlo sampling. The quantities S s t r u c t and S A O describe physical dispersion within the adopted stochastic model. They are not confidence intervals. The bootstrap intervals quantify only the uncertainty caused by finite Monte Carlo sampling. Uncertainty associated with the AO residual PSD, the NCPA covariance model, and the optical assumptions is not included in these intervals. Its scope is examined through the sensitivity analyses in Supplementary Section S3 and discussed in Section 4.

4. Discussion

Under the conditions adopted in this study, namely a wavelength of λ   =   10.6   μ m , phase aberrations only, and symmetric interferometric arms, the three reception configurations transmit NCPA differently. The nearly rotationally symmetric Houizot weighting mainly retains the radial projection channel, while the noncircular Labadie weighting also retains several low-order angular channels. The finite aperture accepts multiple orthogonal channels within the aperture. The resulting performance differences therefore reflect the modal selectivity between the acceptance field and the phase screen, rather than a general measure of spatial filtering strength. Because both the conversion from OPD to phase and the device acceptance modes depend on wavelength, the quantitative results apply to the monochromatic wavelength of 10.6   μ m and should not be interpreted as averages over the full N band.
For a fixed reception configuration and the zero correlation baseline between the two arms, R N C P A captures the dominant variation in the mean raw null. It does not, however, describe all of the sample variation. The spatial match between the acceptance field and the phase screen determines how efficiently a given NCPA amplitude is transferred into leakage. Correlation between the two arms changes the differential phase variance through the cross-covariance term. Positive correlation reduces the mean leakage, while negative correlation increases it. Differential amplitude and polarization mismatch introduce additional leakage floors, as examined in Supplementary Section S3. The AO residual also produces a reception configuration-dependent leakage floor and fluctuations between realizations. Thus, R N C P A describes the overall aberration amplitude, while the spatial structure and AO residual determine how that amplitude is transmitted by each reception configuration. The statistical association with η r a d is specific to the NCPA ensemble used here.
The extended Sauvage-type NCPA ensemble includes tip, tilt, and higher-order spatial aberrations but excludes piston. Piston is not assumed to be negligible. Instead, it is treated as a separate residual scale determined by the fringe tracking performance. After fringe tracking, the residual piston can be applied to the complex coupling coefficient in each arm through the phase factor e i 2 π p l / λ . It then combines coherently with the nonpiston response calculated here at the destructive output. This separation preserves the distinct physical meanings of the fringe tracking error budget and the spatial wavefront control error budget.
The present model calculates coherent stellar leakage caused by phase aberrations. It does not include thermal emission from the sky and warm optical components, detector noise, or residual errors from background subtraction. A complete comparison of overall planet detection sensitivity must also include the off-axis planet throughput and the thermal background accepted by each reception configuration. For the finite aperture, the aperture radius determines the accepted background étendue, while the acceptance mode plays the corresponding role in the two single-mode devices. A lower normalized raw null therefore does not necessarily imply better overall planet detection sensitivity.

5. Conclusions

At λ = 10.6   μ m , under monochromatic, phase-only, and symmetric two-arm conditions, we developed a complex coupling framework for propagating NCPA into null leakage. We used this framework to compare free-space propagation through a finite circular aperture, the nearly circular Houizot single-mode fiber, and the noncircular Labadie single-mode waveguide. The calculation retains the aberration-induced changes in both coupling amplitude and coupling phase. It shows that the NCPA response of a single-mode device is governed by the complex modal projection between its acceptance field and the phase screen, rather than by a generic low-pass filtering effect of different strength.
For the symmetric two-arm ensemble with zero correlation between the arms, R N C P A captures the main amplitude dependence of the ensemble-mean leakage. The acceptance mode and the spatial structure of the NCPA nevertheless determine the leakage transfer coefficient, the sample dispersion due to NCPA structure, and the fluctuations driven by AO residuals. The mean raw null, S s t r u c t , and S A O therefore provide separate measures of the average stellar leakage, sensitivity to NCPA structure, and AO-induced fluctuations. Within the phase-screen ensemble considered here, a larger radial modal fraction is associated with greater mean leakage and stronger AO-induced fluctuations in the two single-mode spatial filters. Until this association is tested under other NCPA covariance models, wavelengths, AO conditions, and amplitude or coupling mismatches, η r a d should be treated as a candidate predictor rather than a universal NCPA tolerance metric.
These results apply to nonpiston wavefront errors that include tip, tilt, and higher-order NCPA. They can inform receiver selection, modal correction priorities, and the allocation of wavefront-control tolerances. Residual piston after fringe tracking should be assigned a separate error budget and then combined coherently with the nonpiston response through the full complex coupling relation. The framework thus provides a common basis for layered error budgets covering fringe tracking, injection control, and higher-order wavefront correction.

Supplementary Materials

The following supporting information can be downloaded at: https://www.mdpi.com/article/10.3390/photonics13090881/s1, Figure S1: Effect of inter-arm NCPA correlation on the mean raw null. The shaded regions denote the 95% paired-bootstrap confidence intervals; Figure S2: Sensitivity of the mean raw null to differential complex-field mismatch. (a) Differential amplitude mismatch. (b) Differential linear-polarization mismatch. Shaded regions denote the 95% confidence intervals; Figure S3: Sensitivity of the AO-only mean raw null to Nact. (a) Unfiltered free space, showing a variation of approximately 30%; (b) finite-aperture free space; (c) Houizot fiber; (d) Labadie waveguide; Figure S4: Paired-block bootstrap results for differences in the statistical metrics among the three acceptance architectures. (a) Mean raw null; (b) Sstruct; (c) SAO. Error bars indicate the central 90% intervals defined by the P5–P95 percentiles. The horizontal zero line indicates equal values of the corresponding statistical metric for the two architectures being compared; Table S1. AO-only mean raw nulls for different Nact values. Values in parentheses indicate the relative changes with respect to Nact = 40; Table S2. Numerical verification of the finite-sample variance decomposition.

Author Contributions

Conceptualization, Y.H.; methodology, Y.H. and J.F.; software, T.Z.; validation, H.Y.; formal analysis, Y.H.; investigation, J.Z.; resources, Y.L.; data curation, Y.H.; writing—original draft preparation, Y.H.; writing—review and editing, J.Z.; visualization, J.F.; supervision, Y.L.; project administration, Y.L.; funding acquisition, Y.L. All authors have read and agreed to the published version of the manuscript.

Funding

This work was supported by the National Natural Science Foundation of China (Grant No. 62005314).

Institutional Review Board Statement

Not applicable.

Informed Consent Statement

Not applicable.

Data Availability Statement

The simulation code and processed data supporting the findings of this study are openly available in the GitHub repository at https://github.com/PlanetYH/Acceptance-mode-dependent (commit :ebed554; accessed on 12 September 2026).

Acknowledgments

During the preparation of this manuscript, the authors used DeepSeek-V4-Flash for the purposes of English language polishing throughout the text, as well as archiving and checking the code prior to submission. The authors have reviewed and edited the output and take full responsibility for the content of this publication.

Conflicts of Interest

The authors declare no conflicts of interest. The funders had no role in the design of the study; in the collection, analyses, or interpretation of data; in the writing of the manuscript; or in the decision to publish the results.

Abbreviations

The following abbreviations are used in this manuscript:
NINulling Interferometry
RMSRoot Mean Square
AOAdaptive Optics
NCPANon-Common Path Aberrations
OPDOptical Path Difference
LP01Fundamental Linearly Polarized Mode
TE-likeTransverse Electric-like
PSDPower Spectral Density

References

  1. Borucki, W.J.; Koch, D.; Basri, G.; Batalha, N.; Brown, T.; Caldwell, D.; Caldwell, J.; Christensen-Dalsgaard, J.; Cochran, W.D.; DeVore, E.; et al. Kepler planet-detection mission: Introduction and first results. Science 2010, 327, 977–980. [Google Scholar] [CrossRef] [Scilit] [PubMed]
  2. Fischer, D.A.; Anglada-Escudé, G.; Arriagada, P.; Baluev, R.V.; Bean, J.L.; Bouchy, F.; Buchhave, L.A.; Carroll, T.; Chakraborty, A.; Crepp, J.R.; et al. State of the field: Extreme precision radial velocities. Publ. Astron. Soc. Pac. 2016, 128, 066001. [Google Scholar] [CrossRef] [Scilit]
  3. Bowler, B.P. Imaging extrasolar giant planets. Publ. Astron. Soc. Pac. 2016, 128, 102001. [Google Scholar] [CrossRef] [Scilit]
  4. Traub, W.A.; Oppenheimer, B.R. Direct imaging of exoplanets. In Exoplanets; Seager, S., Ed.; University of Arizona Press: Tucson, AZ, USA, 2010; pp. 111–156. [Google Scholar]
  5. Bracewell, R.N. Detecting nonsolar planets by spinning infrared interferometer. Nature 1978, 274, 780–781. [Google Scholar] [CrossRef] [Scilit]
  6. Quanz, S.P.; Ottiger, M.; Fontanet, E.; Kammerer, J.; Menti, F.; Dannert, F.; Gheorghe, A.; Absil, O.; Airapetian, V.S.; Alei, E.; et al. Large Interferometer For Exoplanets (LIFE). I. Improved exoplanet detection yield estimates for a large mid-infrared space-interferometer mission. Astron. Astrophys. 2022, 664, A21. [Google Scholar] [CrossRef] [Scilit]
  7. Ruane, G.; Riggs, A.J.E.; Mazoyer, J.; Por, E.H.; N’Diaye, M.; Huby, E.; Baudoz, P.; Galicher, R.; Douglas, E.S.; Knight, J.; et al. Review of high-contrast imaging systems for current and future ground- and space-based telescopes I: Coronagraph design methods and optical performance metrics. In Proceedings of the Space Telescopes and Instrumentation 2018: Optical, Infrared, and Millimeter Wave, Austin, TX, USA, 10–15 June 2018; Lystrup, M., MacEwen, H.A., Fazio, G.G., Batalha, N., Siegler, N., Tong, E.C., Eds.; SPIE: Bellingham, WA, USA, 2018; Volume 10698, p. 106982S. [Google Scholar] [CrossRef] [Scilit]
  8. Alei, E.; Quanz, S.P.; Konrad, B.S.; Garvin, E.O.; Kofman, V.; Mandell, A.; Angerhausen, D.; Mollière, P.; Meyer, M.R.; Robinson, T.; et al. Large Interferometer For Exoplanets (LIFE). XIII. The value of combining thermal emission and reflected light for the characterization of Earth twins. Astron. Astrophys. 2024, 689, A245. [Google Scholar] [CrossRef] [Scilit]
  9. Isbell, J.W.; Ertel, S.; Wagner, K.; Rousseau, H.; Power, J.; Carlson, J.; Becker, A.; Rupert, J.; Hinz, P.; Hoffmann, W.F.; et al. The LBTI: Pioneering the ELT era. In Proceedings of the Optical and Infrared Interferometry and Imaging IX, Yokohama, Japan, 16–22 June 2024; Kammerer, J., Sallum, S., Sanchez-Bermudez, J., Eds.; SPIE: Bellingham, WA, USA, 2024; Volume 13095, p. 1309506. [Google Scholar] [CrossRef] [Scilit]
  10. Glauser, A.M.; Quanz, S.P.; Hansen, J.; Dannert, F.; Ireland, M.J.; Linz, H.; Absil, O.; Alei, E.; Angerhausen, D.; Birbacher, T.; et al. The Large Interferometer For Exoplanets (LIFE): A space mission for mid-infrared nulling interferometry. In Proceedings of the Optical and Infrared Interferometry and Imaging IX, Yokohama, Japan, 16–22 June 2024; Kammerer, J., Sallum, S., Sanchez-Bermudez, J., Eds.; SPIE: Bellingham, WA, USA, 2024; Volume 13095, p. 130951D. [Google Scholar] [CrossRef] [Scilit]
  11. Spalding, E.A.; Arcadi, E.; Douglas, G.; Gross, S.; Guyon, O.; Martinod, M.-A.; Norris, B.; Rossini-Bryson, S.A.; Taras, A.; Tuthill, P.G.; et al. The GLINT nulling interferometer: Improving nulls for high-contrast imaging. In Proceedings of the Optical and Infrared Interferometry and Imaging IX, Yokohama, Japan, 16–22 June 2024; Kammerer, J., Sallum, S., Sanchez-Bermudez, J., Eds.; SPIE: Bellingham, WA, USA, 2024; Volume 13095, p. 1309507. [Google Scholar] [CrossRef] [Scilit]
  12. Garreau, G.; Bigioli, A.; Laugier, R.; Raskin, G.; Morren, J.; Berger, J.-P.; Dandumont, C.; Goldsmith, H.-D.K.; Gross, S.; Ireland, M.; et al. Asgard/NOTT: L-band nulling interferometry at the VLTI. II. Warm optical design and injection system. J. Astron. Telesc. Instrum. Syst. 2024, 10, 015002. [Google Scholar] [CrossRef] [Scilit]
  13. Mennesson, B.; Ollivier, M.; Ruilier, C. Use of single-mode waveguides to correct the optical defects of a nulling interferometer. J. Opt. Soc. Am. A 2002, 19, 596–602. [Google Scholar] [CrossRef] [Scilit] [PubMed]
  14. Houizot, P.; Boussard-Plédel, C.; Faber, A.J.; Cheng, L.K.; Bureau, B.; van Nijnatten, P.A.; Gielesen, W.L.M.; Pereira do Carmo, J.; Lucas, J. Infrared single mode chalcogenide glass fiber for space. Opt. Express 2007, 15, 12529–12538. [Google Scholar] [CrossRef] [Scilit] [PubMed]
  15. Labadie, L.; Martin, G.; Anheier, N.C.; Arezki, B.; Qiao, H.A.; Bernacki, B.; Kern, P. First fringes with an integrated-optics beam combiner at 10 μm: A new step towards instrument miniaturization for mid-infrared interferometry. Astron. Astrophys. 2011, 531, A48. [Google Scholar] [CrossRef] [Scilit]
  16. Vigreux-Bercovici, C.; Bonhomme, E.; Pradel, A.; Broquin, J.-E.; Labadie, L.; Kern, P. Transmission measurement at 10.6 μm of Te2As3Se5 rib waveguides on As2S3 substrate. Appl. Phys. Lett. 2007, 90, 011110. [Google Scholar] [CrossRef] [Scilit]
  17. Ródenas, A.; Martin, G.; Arezki, B.; Psaila, N.; Jose, G.; Jha, A.; Labadie, L.; Kern, P.; Kar, A.; Thomson, R. Three-dimensional mid-infrared photonic circuits in chalcogenide glass. Opt. Lett. 2012, 37, 392–394. [Google Scholar] [CrossRef] [Scilit] [PubMed]
  18. Laugier, R.; Defrère, D.; Woillez, J.; Courtney-Barrer, B.; Dannert, F.A.; Matter, A.; Dandumont, C.; Gross, S.; Absil, O.; Bigioli, A.; et al. Asgard/NOTT: L-band nulling interferometry at the VLTI. I. Simulating the expected high-contrast performance. Astron. Astrophys. 2023, 671, A110. [Google Scholar] [CrossRef] [Scilit]
  19. Lay, O.P. Systematic errors in nulling interferometers. Appl. Opt. 2004, 43, 6100–6123. [Google Scholar] [CrossRef] [Scilit] [PubMed]
  20. Chazelas, B.; Brachet, F.; Bordé, P.; Mennesson, B.; Ollivier, M.; Absil, O.; Labèque, A.; Valette, C.; Léger, A. Instrumental stability requirements for exoplanet detection with a nulling interferometer: Variability noise as a central issue. Appl. Opt. 2006, 45, 984–992. [Google Scholar] [CrossRef] [Scilit] [PubMed]
  21. Delorme, J.-R.; Jovanovic, N.; Echeverri, D.; Mawet, D.; Wallace, J.K.; Bartos, R.D.; Cetre, S.; Wizinowich, P.; Ragland, S.; Lilley, S.; et al. Keck Planet Imager and Characterizer: A dedicated single-mode fiber injection unit for high-resolution exoplanet spectroscopy. J. Astron. Telesc. Instrum. Syst. 2021, 7, 035006. [Google Scholar] [CrossRef] [Scilit]
  22. Tatulli, E.; Mège, P.; Chelli, A. Single-mode versus multimode interferometry: A performance study. Astron. Astrophys. 2004, 418, 1179–1186. [Google Scholar] [CrossRef] [Scilit]
  23. Guo, Z.; An, Q.; Yang, C.; Hu, J.; Li, X.; Wang, L. Roadmap for exoplanet high-contrast imaging: Nulling interferometry, coronagraph, and extreme adaptive optics. Photonics 2025, 12, 1030. [Google Scholar] [CrossRef] [Scilit]
  24. Paul, B.; Sauvage, J.-F.; Mugnier, L.M. Coronagraphic phase diversity: Performance study and laboratory demonstration. Astron. Astrophys. 2013, 552, A48. [Google Scholar] [CrossRef] [Scilit]
  25. Fétick, R.J.L.; Fusco, T.; Neichel, B.; Mugnier, L.M.; Beltramo-Martin, O.; Bonnefois, A.; Petit, C.; Milli, J.; Vernet, J.; Oberti, S.; et al. Physics-based model of the adaptive-optics-corrected point spread function: Applications to the SPHERE/ZIMPOL and MUSE instruments. Astron. Astrophys. 2019, 628, A99. [Google Scholar] [CrossRef] [Scilit]
  26. Prahl, S. ofiber: A Python Module for Light Propagation in Optical Fibers, Version 0.9.1; Zenodo: Geneva, Switzerland, 2026. [Google Scholar] [CrossRef]
  27. Tambasco, J.-L. modesolverpy: Photonic Mode Solver with Semi-Vectorial and Fully Vectorial Options, Version 0.4.4. 2019. Available online: https://github.com/jtambasco/modesolverpy (accessed on 7 August 2026).
  28. Defrère, D.; Hinz, P.M.; Mennesson, B.; Hoffmann, W.F.; Millan-Gabet, R.; Skemer, A.J.; Bailey, V.; Danchi, W.C.; Downey, E.C.; Durney, O.; et al. Nulling data reduction and on-sky performance of the Large Binocular Telescope Interferometer. Astrophys. J. 2016, 824, 66. [Google Scholar] [CrossRef] [Scilit]
Figure 1. Single-mode acceptance fields. (a) Houizot fiber; (b) Labadie waveguide. The color scale shows normalized intensity raised to the power of 0.45.
Photonics 13 00881 g001
Figure 2. AO residual phase screen model and working point calibration. (a) AO-corrected residual PSD for different Nact values; vertical lines mark the AO cutoff; (b) Integrated AO phase RMS and the corresponding Maréchal Strehl ratio at λ = 10.6 µm.
Photonics 13 00881 g002
Figure 3. Representative pupil plane phase screens at λ   =   10.6   μ m . (a) Extended Sauvage-type NCPA phase screen. (b) A residual phase screen at the N act   =   40 working point. Both examples are shown in radians.
Photonics 13 00881 g003
Figure 4. Pupil-plane modal selectivity of the single-mode spatial filters. Panels (a) through (d) correspond to the Houizot fiber, and panels (e) through (h) correspond to the Labadie waveguide. Panels (a,e) show the globally phase-aligned real part of the backpropagated pupil weighting. Panels (b,f) and (c,g) show the overlap-density maps for unit-RMS defocus and astigmatism, respectively. Panels (d,h) show the angular power of the full complex pupil kernel.
Photonics 13 00881 g004
Figure 5. Modal raw-null responses to piston-free Zernike-like NCPA modes with an OPD RMS of 100 nm. The colors show log 10 N / N ~ FS . (a) Free space; (b) Houizot fiber; (c) Labadie waveguide.
Photonics 13 00881 g005
Figure 6. Statistical raw null transfer for mixed radial and angular NCPA screens. Error bars show the interquartile range (25th–75th percentiles). All screens are normalized to 100 nm OPD RMS.
Photonics 13 00881 g006
Figure 7. AO-free two-arm NCPA mean raw null in the phase-only limit. (a) Free space. (b) Houizot fiber. (c) Labadie waveguide. The color scale shows log10 mean raw null; the white cell at the origin denotes the ideal zero-aberration value N = 0, which cannot be represented on the logarithmic color scale.
Photonics 13 00881 g007
Figure 8. Two-arm NCPA mean raw null with AO residual. (a) Free space. (b) Houizot fiber. (c) Labadie waveguide.
Photonics 13 00881 g008
Figure 9. Mean raw null curves along the equal arm direction.
Photonics 13 00881 g009
Figure 10. Goodness of fit for the R NCPA only description of the mean raw null surface. Dark and light bars show the AO-free and Nact = 40 AO residual cases, respectively. Bar colors denote the three reception configurations (FS, HF, and LW denote free-space propagation, the Houizot fiber, and the Labadie waveguide, respectively). Error bars show the variation across independent random libraries.
Photonics 13 00881 g010
Figure 11. Standard deviation components of raw null fluctuations. (a) log 10 S struct ; (b) log 10 S AO .
Photonics 13 00881 g011
Figure 12. Association between natural radial fraction in the extended Sauvage-type NCPA screens and raw null statistics. Each point corresponds to one two-arm NCPA realization. The upper row shows the mean raw null, and the lower row shows the absolute AO jitter. Columns correspond to free space (a,d), the Houizot fiber (b,e), and the Labadie waveguide (c,f).
Photonics 13 00881 g012
Figure 13. Discovery and validation of the radial fraction effect across independent random libraries. Each point gives the fitted η rad slope from one independent library. The upper row shows the effect on mean raw null, and the lower row shows the effect on absolute AO jitter. Columns correspond to free space (a,d), the Houizot fiber (b,e), and the Labadie waveguide (c,f). Filled circles denote discovery libraries, and open squares denote validation libraries.
Photonics 13 00881 g013
Table 1. Reference parameters used to construct the Fétick AO residual phase PSD at λ = 500 nm.
ParameterValue at λ = 500 nm
r0  m 0.18
C   r a d 2   m 2 0.01
A   r a d 2 2.0
αx,  α y   m 1 0.05
θ   r a d 0
β1.6
D m 8
Nact40
Table 2. Numerical stability and Monte Carlo reproducibility checks.
CheckQuantityNumerical Result (Unit: dex)
Block bootstrapEqual-arm log 10 μ N curveP5-P95 maximum width 0.0161; median width 0.0126
R NCPA -only model R 2 P5-P95 maximum width 0.0013; median width 0.0004
log 10 S struct P5-P95 maximum width 0.0564; median width 0.0137
log 10 S AO P5-P95 maximum width 0.0222; median width 0.0134
Prefix convergence:
16 vs. 20 libraries
log 10 μ N Maximum difference: 0.0013
R 2 Maximum difference: 0.0001
log 10 S struct Maximum difference: 0.0097
log 10 S AO Maximum difference: 0.0030
Independent
seed validation
log 10 μ N Maximum difference: 0.0021
R 2 Maximum difference: 0.0007
log 10 S struct Maximum difference: 0.0355
log 10 S AO Maximum difference: 0.0120
Variance closure V total   =   V struct   +   V AO Maximum relative error 1.8   ×   10 15
Disclaimer/Publisher’s Note: The statements, opinions and data contained in all publications are solely those of the individual author(s) and contributor(s) and not of MDPI and/or the editor(s). MDPI and/or the editor(s) disclaim responsibility for any injury to people or property resulting from any ideas, methods, instructions or products referred to in the content.