Article

Multipath Interference in a 4 × 4 Mirror-Array Intelligent Reflecting Surface for Free-Space Optical Communication

1
Friedrich-Alexander-Universität Erlangen-Nürnberg, Institute of Microwaves and Photonics, Cauerstr. 9, 91058 Erlangen, Germany
2
Friedrich-Alexander-Universität Erlangen-Nürnberg, Erlangen Graduate School in Advanced Optical Technologies, Konrad-Zuse-Str. 3-5, 91052 Erlangen, Germany
3
Friedrich-Alexander-Universität Erlangen-Nürnberg, Institute for Digital Communications, Cauerstr. 7, 91058 Erlangen, Germany
*
Author to whom correspondence should be addressed.
Photonics 2026, 13(6), 525; https://doi.org/10.3390/photonics13060525
Submission received: 8 May 2026 / Revised: 22 May 2026 / Accepted: 25 May 2026 / Published: 28 May 2026
(This article belongs to the Special Issue Free-Space Optical Communications: Latest Advances and Prospects)

Abstract

We present a flexible, centimeter-scale 4 × 4 macro mirror array serving as an intelligent reflecting surface (IRS) for free-space optical communication (FSOC) links in urban environments. The realized array integrates a compact, high-precision tip-tilt mechanism with a minimum scanning increment of 0.87   μ rad and achieves a fill factor of 86 % , enabling high-power transmission and supporting long-range connectivity. We investigate the multipath interference arising from different optical path lengths between the tiles, which introduce relative time delays at the receiver and can constrain the usable modulation bandwidth. A geometric model is developed to simulate the frequency response of the fabricated mirror array by explicitly accounting for tile-dependent optical path length differences. The simulated responses show excellent agreement with experimental data, validating the theoretical framework. Notably, the measured frequency responses exhibit pronounced minima at specific frequencies, evidencing multipath-induced destructive interference. The results demonstrate that the proposed model can accurately predict the frequency-dependent performance and establish practical bandwidth limits for IRS-assisted FSOC links based on specific array geometries.

1. Introduction

Fiber-optic communication systems are the backbone of contemporary data transmission, with over 95% of all data carried in optical fibers [1]. At the same time, wireless options are gaining importance due to their flexibility, which is vital for emerging technologies such as 6G, digital twins, and connectivity-intensive applications like unmanned aerial vehicles [2]. Radio-frequency (RF) communication remains widely used because of its technological maturity, low cost, and potential for miniaturization [3]. However, RF systems are constrained by limited data rates due to lower carrier frequencies and by high power requirements caused by low directivity [4].
Free-space optical communication (FSOC) offers a promising alternative to RF technologies, providing very high data rates while enabling seamless integration into existing fiber-optic networks [5]. FSOC links further benefit from high directivity and reduced power consumption, and are therefore strong candidates to complement fiber networks in last-mile transmission [6]. Nevertheless, FSOC performance can be impaired by atmospheric attenuation and turbulence, pointing errors, and beam divergence [6]. The most critical constraint remains the line-of-sight (LOS) requirement, which demands an unobstructed path between transmitter and receiver [7]. To address LOS blockages, intelligent reflecting surfaces (IRSs) can be deployed to redirect the optical beam around obstacles; in contrast to active relay nodes, IRSs are less complex and more cost-effective [8]. Beyond simple reflection, IRSs can manipulate the phase, amplitude, or polarization of light [8]. Depending on the link geometry, IRSs may be located between the transmitter and receiver or deployed as transmitter-side beam-steering devices; in the latter case, they are typically installed close to the transmitter rather than midway along the link [9]. Consequently, IRSs can be realized using single mirrors, mirror arrays, phased arrays, or metasurfaces [10,11], with each implementation best suited to specific use cases.
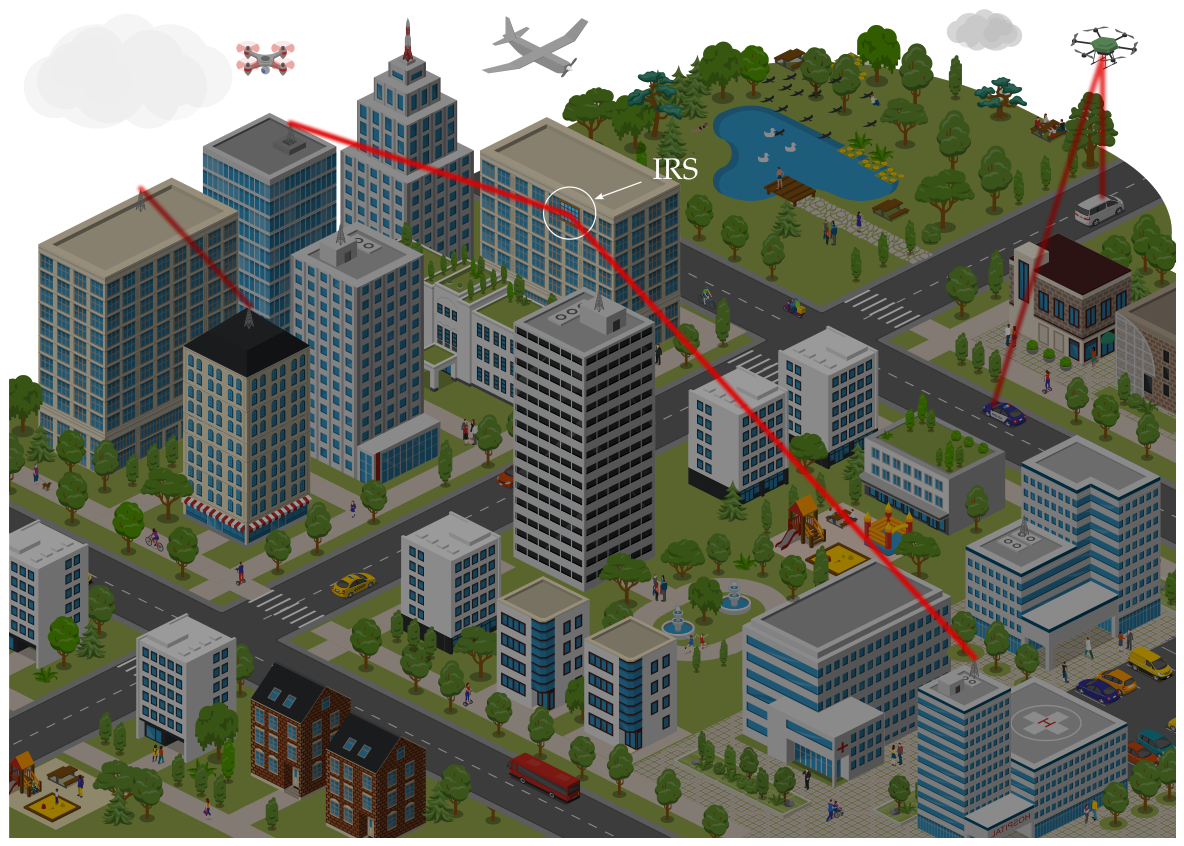
Example scenarios for implementing intelligent reflecting surfaces in FSOC links are outlined in [12,13,14]. Furthermore, the application of IRS technology in indoor wireless communication (VLC) [15], in particular for visible light communication [16], is gaining significant attention and offers immense potential for performance enhancement, driving extensive research in this area. Notably, the emerging field of underwater optical wireless communication is also exploring the deployment of IRSs, as demonstrated in [17]. This publication focuses on IRSs deployed on building facades for urban applications, as illustrated in Figure 1. Accordingly, key requirements include cost-effectiveness, speed, precision, integrability, and robustness to building sway and beam wandering due to atmospheric turbulence. In particular, centimeter-scale IRS elements are desirable to preserve beam collimation over longer propagation distances. Moreover, their larger aperture enables the use of higher transmit power while complying with eye-safety limits. Single mirrors provide high efficiency and rapid implementation and are widely used for beam steering [18]. However, limited scalability and size constraints reduce their suitability, particularly for building facades. Phased arrays and metasurfaces offer greater flexibility and enhanced capabilities for turbulence compensation since they can modulate the phase of the light [19,20]. For example, spatial light modulators (SLMs), discussed in [21,22,23], provide high flexibility and accuracy, but they are often expensive and difficult to scale. Although metasurfaces promise strong integration potential and have already been experimentally demonstrated as prototypes in RF applications [24], their limited commercial availability and size constraints in FSOC currently hinder practical deployment [25,26]. By contrast, mirror arrays offer a favorable balance among cost, performance, flexibility, and scalability. Crucially, centimeter-scale mirror arrays do not require lithographic processes, simplifying analysis and enabling fabrication with standard mechanical techniques. In addition, these devices can be scaled up to accommodate laser beam expansion, which is essential for transmitting higher optical power and achieving a superior signal-to-noise ratio while strictly complying with eye-safety regulations. This expansion is critical because focusing the laser onto a smaller device would concentrate the optical power, thereby exceeding permissible eye-safety thresholds. Consequently, if the physical aperture cannot be increased, both the beam diameter and the transmit power must be reduced.
To date, few affordable, reconfigurable macro mirror arrays meet the combined requirements of fast control, high fill factor, and compact design, despite extensive theoretical investigation and modeling efforts [7,8,10,27]. In [28,29], initial prototypes of macro mirror arrays as IRS are presented; however, their large mirror elements and slow servo motors lead to a low fill factor and limited operational speed, constraining real-world applicability.
Moreover, rigorous channel modeling of such arrays in FSOC systems is essential to identify potential limitations. In particular, multipath propagation introduced by mirror arrays may restrict the usable modulation bandwidth for data transmission, as shown for VLC in [30].
To bridge this gap, we present a flexible, centimeter-scale 4 × 4 macro mirror array that enables high-precision beam steering and beam forming, thereby demonstrating the first IRS prototype tailored for FSOC links in urban environments. Furthermore, we perform an analytical and experimental frequency domain analysis that reveals multipath interference effects on the modulation frequency and, consequently, depicts constraints of this array for optical communication links. The remainder of this publication is organized as follows.
Section 2 presents the concept of the mirror array and its key design parameters. Section 3 details the system design, including the tip-tilt mechanism and the mechanical and electrical implementation. Section 4 defines multipath interference and develops a geometric model of multipath propagation for system-level simulations. Section 5 provides an experimental investigation of the multipath interference model for the designed mirror array, including the measurement setup. The results of the measurements for different configurations are presented and compared to the simulation in Section 6. Section 7 concludes the paper and highlights its main contributions and significance.

2. Design Parameters

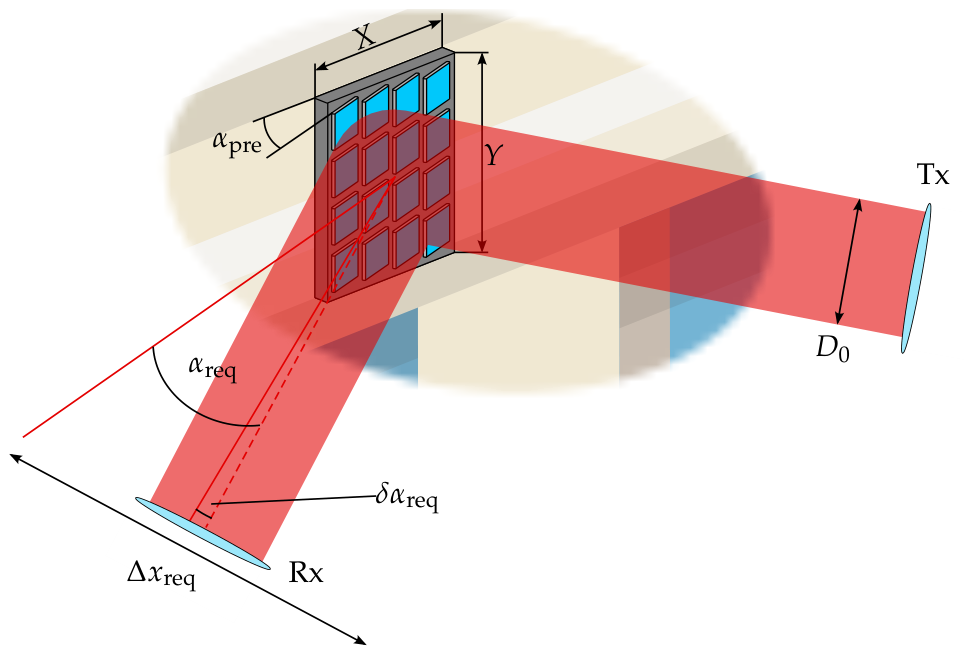
As discussed in Section 1, we consider IRSs deployed on building facades in urban environments, as depicted in Figure 1. Therefore, in this section, we derive the parameters required for such an application, i.e., the dimensions X and Y of the mirror array, the maximum required scanning angle α req , and the minimum scanning increment δ α req . These parameters are specified under the assumption that the entire mirror array is illuminated, offering greater flexibility for applications such as beam forming, as illustrated in Figure 2. The total link length L, which comprises the distance from the IRS to the receiver (Rx), ranges from 40 m to 1000 m, motivated by future deployment scenarios, and is representative of urban FSOC links.

2.1. Array Dimensions

To determine the array dimensions, the transmitted beam diameter D 0 must be specified, as it is constrained by eye-safety requirements. Particularly in urban FSOC systems, the beam waist radius w 0 must exceed a threshold, w 0 > w critical , to ensure safe operation. In this context, both the beam waist radius w 0 and diameter D 0 = 2 w 0 refer to the 1 / e 2 intensity level of a Gaussian beam profile. This critical beam waist radius represents the minimum value required to comply with safety standards and is determined in [31] by
w critical = P trans MPE ( λ ) · π ,
where P trans is the transmit power and MPE ( λ ) is the wavelength-dependent maximum permissible exposure. For this scenario, we specify λ = 1550 nm , as it is compatible with existing fiber-optic infrastructure and offers a significantly higher eye-safety limit than visible wavelengths [31]. Considering a worst-case exposure duration of 1000   s , the MPE ( λ ) is 1000 W m 2 [31]. To calculate w critical , the required transmit power is estimated from the link budget, which is derived from the receiver sensitivity and atmospheric losses. We assume a receiver sensitivity P min of 30 dBm , a typical value for APD-based receivers in non-coherent optical communication systems [32]. The Kim model [33] is used to approximate the atmospheric attenuation. Assuming a visibility range of 0.2 km to 0.3 km to account for severe weather conditions and a visibility threshold of 5 % [34], the attenuation for a 1000 m link is approximately 60 dB. Consequently, a link budget of at least 60 dB is required, excluding other atmospheric effects. Therefore, neglecting additional margins, a transmit power P trans of 30 dBm is required to meet the receiver sensitivity. Inserting P trans in Equation (1) yields a critical beam waist radius w critical of 17.8 mm. Such a substantial beam waist radius is inherently advantageous, as it minimizes Gaussian beam divergence and the resulting path loss due to beam spread at the receiver compared to smaller values of w 0 . Therefore, a careful selection of w 0 is essential to balance eye-safety requirements with link performance for a given design distance L. Including a safety buffer, the beam diameter D 0 is set to 37 mm. Consequently, the overall IRS size must be in the order of several centimeters, i.e., the array length X and height Y must exceed the beam diameter D 0 of 37 mm.

2.2. Maximum Required Scanning Angle

The maximum required scanning angle α req of each tile depends on the transmitter-receiver separation and the receiver’s position within the urban layout. In many urban scenarios, pre-aligning the tiles towards the typically stationary receiver is sufficient. To determine the maximum required scanning angle α req , we first define the maximum required scanning range Δ x req at the receiver plane in both x and y directions. This range must accommodate building sways and beam wander due to atmospheric turbulence. Building sways, which depend on building size and materials, can reach several tens of centimeters [35], while beam wander over 1000 m can extend to several centimeters depending on the wavelength and the turbulence strength [36,37]. We therefore define a maximum scanning range Δ x of three times the beam diameter D 0 at the receiver plane to account for both effects. Using the lower bound of the defined link distance L of 40   m yields a required maximum scanning range α req per tile of approximately 0.08 ° , while shorter distances would result in a larger required angle.

2.3. Minimum Required Angular Increment

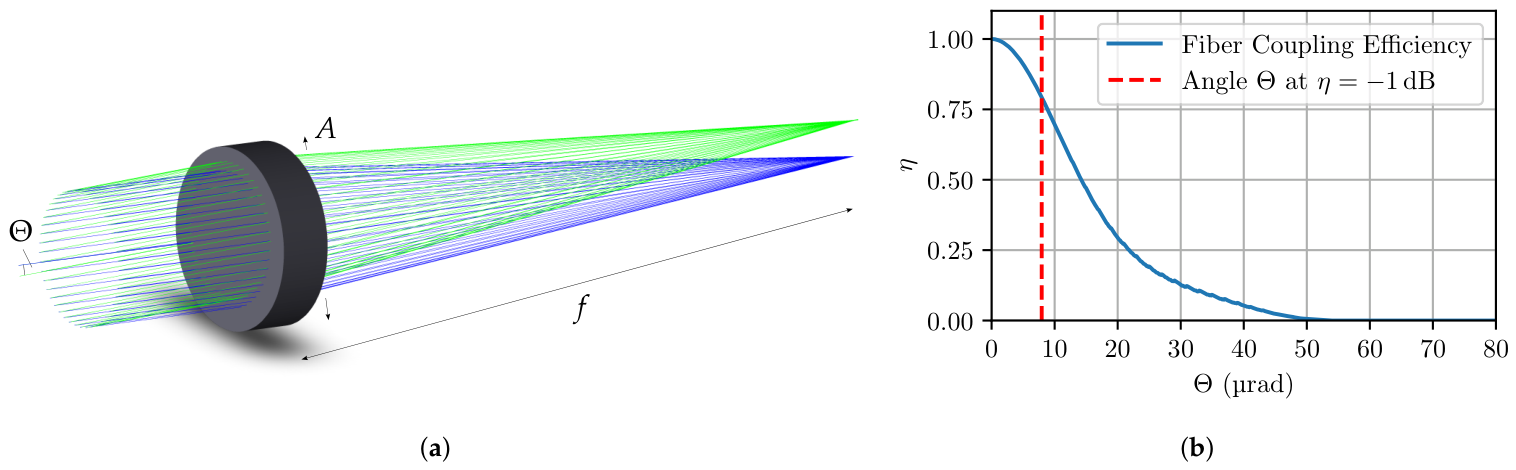
The minimum required scanning increment δ α req is defined as the smallest possible change in scanning angle for each tile (see Figure 2). If the deflected beam does not precisely align with the optical axis of the receiver due to misalignment or turbulence, the detected power is reduced, thereby lowering the effective receiver sensitivity. To approximate δ α req for the FSOC system, we assume single-mode fiber (SMF) coupling at the receiver, although fiber coupling is not strictly required for FSOC links. This motivates a conservative design criterion: If the tile’s δ α req is equal to or smaller than the angle required for efficient SMF coupling, the mirror array will be sufficiently accurate for free-space receivers and will additionally enable fiber-coupled FSOC operation. A ZEMAX simulation (Figure 3) is performed to determine the maximum incidence angle Θ that still allows efficient coupling into the SMF, with the fiber facet positioned at the focal point. The angular misalignment has a more pronounced impact on coupling efficiency than a comparable lateral offset; therefore, we focus on angular misalignment in the simulation. The link length L is set to 1000 m, the mode field diameter MFD to 10.4   μ m (Corning, SMF28). To collimate the light, the large-beam collimator Schaefter&Kirchhoff, 60FC-T-4-M200-37 with a lens aperture of 50 mm and focal length f of 200 mm is used, matching the collimator in Section 5.1.
As shown in Figure 3a, when the incoming beam (green) deviates from the optical axis and hits the lens at a different position, the focal spot shifts, reducing coupling efficiency. The efficiency η is computed with the ZEMAX Single Mode Fiber Coupling tool based on the overlap integral. The incidence angle Θ of the incoming beam is incrementally increased, and the coupling efficiency is recorded, as shown in Figure 3b. The efficiency η decreases rapidly with small angular deviations. The incidence angle Θ that causes a 1 dB reduction in coupling efficiency is equivalent to the minimum required scanning increment δ α req for the mirror tiles, ensuring a coupling efficiency of approximately 79 % . This 1 dB threshold is an established benchmark in photonics packaging to define alignment tolerances [38] and is thus adopted in this work. For this FSOC scenario, Θ and hence δ α req are 7.95   μ rad . Therefore, the mirror array must be designed to achieve a minimum scanning increment δ α req of 7.95   μ rad or smaller to maintain efficient coupling into a single-mode fiber, even in the presence of misalignments or beam wandering due to atmospheric disturbances. This design criterion ensures that the mirror array is not only suitable for free-space optical communication but can also be transferred to fiber-coupled systems, thereby enhancing its versatility and applicability in various FSOC scenarios.
The system should be capable of adjusting the mirror angles within a reasonable time frame to compensate for building sways and beam wandering due to atmospheric turbulence, which are typically in the order of seconds [39] and milliseconds [40,41], respectively. Therefore, the mirror array’s required rise time t req to scan from the zero position to the required maximum scanning angle α req should be less than 10 ms.
The established dimensions X and Y, the maximum required scanning angle α req , the minimum required scanning increment δ α req , and the required rise time t req are summarized in Table 1, where the realized parameters are also shown. We proceed to the detailed design of the mirror array in the following section.

3. Design

In this section, we describe the system design of the mirror array. The used components of a single element are selected to meet the maximum required scanning angle α req . They define the size and thus the amount of single elements that can be integrated into the array. Those elements are then combined to form the array, which is presented in the second part of this section. The array design is driven by the developed size of a single element and the required array dimensions X and Y. It is optimized for a high fill factor, which is essential to maximize the reflected power and thus the link budget of the FSOC system. Additionally, it focuses on simplicity to minimize maintenance over the system lifetime as well as compactness, scaleability, and cost-efficiency to enable large-scale deployment, crucial for practical deployment on building facades. After that, the electrical design to control the piezo actuators is described, with the goal of achieving the required minimum scanning increment δ α req with reliability and low power consumption within the required time frame. Finally, the developed 4 × 4 mirror array is presented, including the specifications compared to the required parameters.

3.1. Single Mirror Element

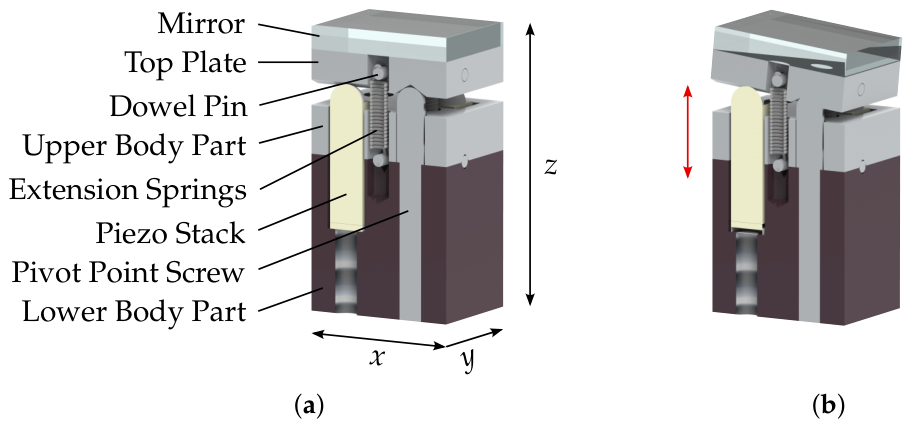
The tip-tilt mechanism is a critical component of the mirror array. To balance simplicity and functionality, we adopt a mechanical layout commonly used in optical mounts, as illustrated in Figure 4. This L-shaped configuration provides a straightforward and robust solution. To achieve a design with a small minimum scanning increment, the actuators must have high precision. In addition, the actuators should be small to allow for a compact layout and cheap to enable large-scale deployment. Therefore, we select the piezo stacks (PK3JMAP1, Thorlabs) with dimensions 3   mm × 3   mm × 12   mm .
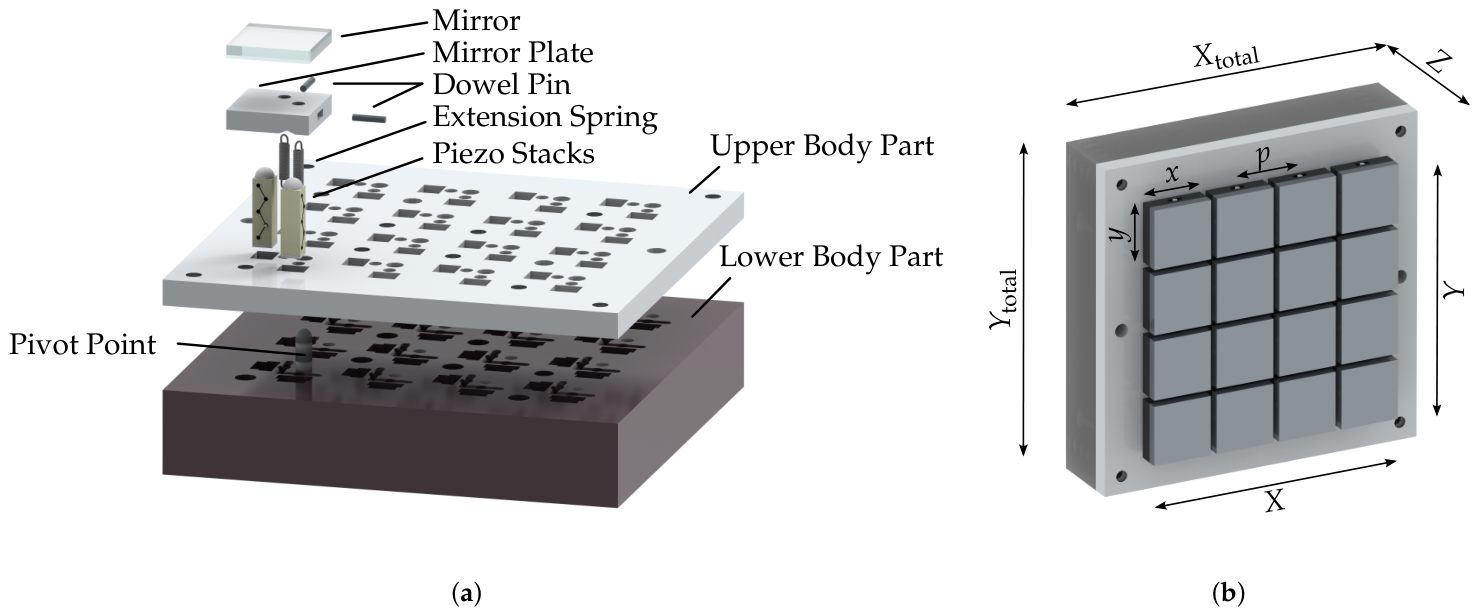
The body of the assembly is divided into lower and upper body parts and incorporates guiding shafts that constrain the piezo stacks, as illustrated in Figure 4a. A pivot point screw is integrated to define the pivot point. The upper body is rigidly bolted to the lower body to ensure mechanical stability and facilitate the assembly of the dowel pins used for anchoring the extension springs. Both body parts incorporate notches to retain the dowel pins and guide shafts for the piezo stacks. Above the upper body, the top plates are attached via extension springs and dowel pins to maintain the alignment, as can be seen in more detail in Figure 5. The springs are designed to be as small as practical while providing adequate force for stable, repeatable operation. The mirrors are bonded to the top plates with adhesive. Prism notches on the rear of the top plates guide the pivot screw and the piezo-driven motions; both the pivot screw and the piezo interfaces have spherical tips, allowing smooth, precise adjustments of each mirror element.
Each mirror is actuated by a pair of piezo stacks arranged orthogonally in the described L-configuration with the pivot at the corner. This arrangement allows for independent control of tip and tilt by adjusting the lengths of the respective piezo stacks. In the static state depicted in Figure 4a, the mirror remains planar. When the piezo stacks expand, and their lengths change, as indicated by the red arrow in Figure 4b, the mirror undergoes a controlled tilting motion about the pivot. The desired displacement is generated by applying a voltage to the piezo actuator. At 90 V the used piezo stacks provide a displacement of approximately 10   μ m ± 15 % . The necessary supply voltage for the piezo stacks is provided by the control electronics described in Section 3.3. The corresponding maximum optical deflection α max is approximately 0.2 ° (the mechanical tilt is half this value). An additional alignment screw at the bottom of each guiding shaft, below the piezo stacks, enables pre-alignment: The piezo stack can be translated vertically to preset the mirror’s tip-tilt. This mechanism provides a coarse tilt, achieving a pre-alignment angle α pre of up to 17 ° for initial alignment of the laser beam with the receiver. After coarse alignment, fine scanning is performed by applying voltage to the piezo stacks. The small size of the piezo stacks and extension springs allows for a close positioning near the pivot, thereby maximizing the achievable tilt for a given actuator stroke. With the selected piezo stacks, the minimum actuator-to-pivot distance is 6 mm, and the footprint of a single element x × y × z is 13   mm × 13   mm × 24   mm .
Consequently, the piezo actuators used and their positioning close to the pivot enable a maximum scanning angle α max of approximately 0.2 ° . This exceeds the required maximum scanning angle α req of 0.08 ° , thereby fulfilling the design criterion α max α req and allowing for link distances L even shorter than 40 m. The small footprint allows the integration of multiple single units with close spacing into an array, enabling a compact and highly scalable architecture, which is shown in the next section.

3.2. Array Design

The resulting compact array design is shown in Figure 5a. The active area (X and Y, see Section 2) must exceed the laser beam diameter D 0 , which is approximately 37 mm. The minimum size of each mirror element x = y , established in Section 3.1, is 13 mm. To prevent tile contact during tip-tilt and pre-alignment, the pitch p is set to 14 mm. Accordingly, the active area dimensions X = Y are 55 mm, and the overall footprint X total = Y total is 65 mm. While three columns would suffice to cover the beam, a fourth column provides margin for larger beam diameters arising from increased distance and associated divergence. The resulting configuration is a 4 × 4 macro mirror array with 16 elements (Figure 5b). In total, the array incorporates 32 piezo actuators and achieves a high fill factor of 86 % . The assembly depth Z is limited to 24 mm, dictated primarily by the piezo stack length. For fabrication, we employed resin-based 3D printing, which yields a lightweight, non-conductive (necessary for the piezo actuators), cost-effective, and precise structure. This approach enables a highly scalable mirror array design with clear potential for future integration of additional elements.
Figure 5. Exploded view illustrating the components of one tip-tilt unit and its connection to the body (a); fully assembled mirror array with all components (b).
Photonics 13 00525 g005
Therefore, the developed array design meets the required dimensions X and Y while achieving a high fill factor and a compact, scalable architecture. Moreover, the additional column provides margin for larger beam diameters, which is beneficial for longer link distances and allows for a more flexible application of the array in various FSOC scenarios, e.g., beam forming and shaping. The next section describes the electrical design to control the piezo actuators, which is essential to achieve the required minimum scanning increment δ α req .

3.3. Design of Electrical Control

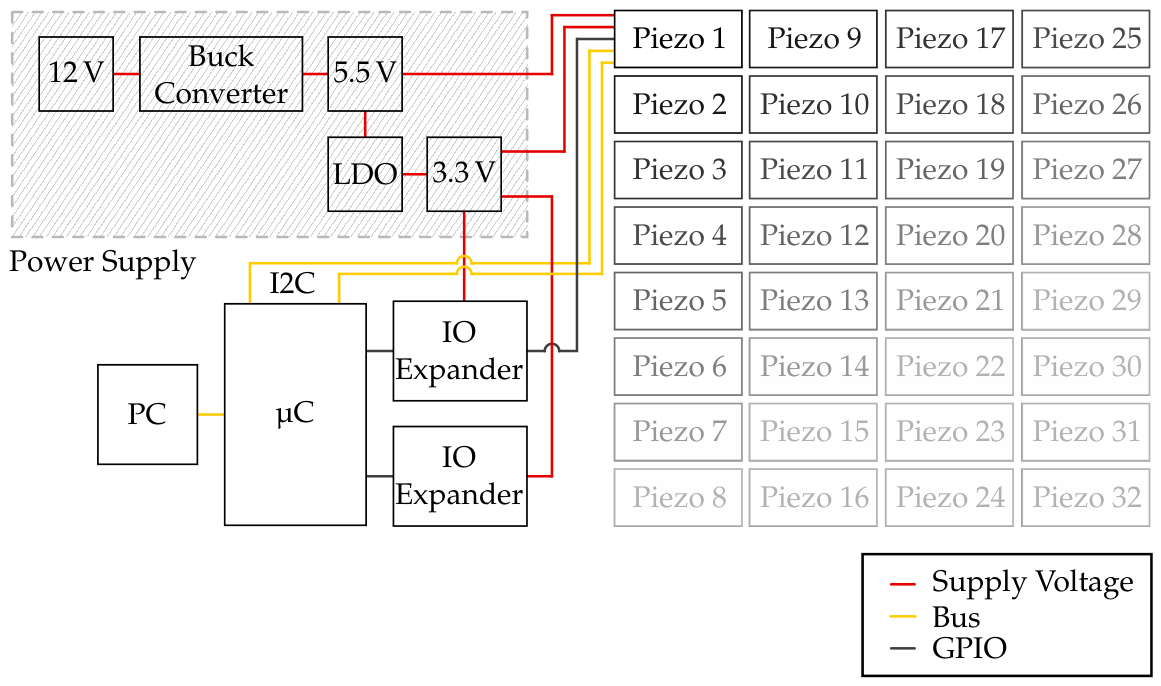
The 32 piezoelectric actuators provide the controlled displacements required for precise tip-tilt motion. They operate over a range of 0 V to 100 V, necessitating a dedicated printed circuit board (PCB) to generate and regulate the drive voltages for all 32 piezo stacks. The schematic of the developed PCB is shown in Figure 6.
The PCB is powered from a 12 V supply. A buck converter (BC) steps the voltage down to 5.5 V to power the piezo drivers, and a low-dropout regulator (LDO) further reduces it to 3.3 V for the input/output (IO) expander. The microcontroller (µC) interfaces with the PCB via a serial link from a PC. An I2C bus handles data communication between the microcontroller and the piezo drivers. An IO expander increases the available general-purpose input/outputs (GPIOs), providing per-driver enable/address lines analogous to chip-select in SPI systems. Each piezo actuator is driven by a dedicated piezo driver (Boréas, BOS1921), a device commonly used in haptic applications. The driver boosts the output up to 90 V from a 5.5 V supply. Consequently, the tip-tilt values reported in Section 3.2 are computed for a 90 V maximum drive. Their low power consumption, high speed, scalability, and cost-effectiveness, together with minimal additional voltage overhead, eliminate the need for external amplifiers or digital-to-analog converters, significantly reducing system cost. With this PCB and the selected drivers, the piezo stacks achieve a full-scale voltage swing from 0 V to 90 V in less than 5 ms. This results in a rise time of t t req , which is sufficient to mitigate beam wandering due to atmospheric turbulence [40,41], as well as building sway [39].
The driver command interface uses a 12-bit format, yielding a minimum voltage step of approximately 0.02 V. This corresponds to a minimum scanning increment δ α of 0.87   μ rad for each mirror element (see Figure 2), i.e., a lateral displacement of 0.87 mm over a link length L of 1 km.
Hence, the achievable scanning increment δ α is smaller than the minimum required scanning increment, δ α δ α req , making it well-suited for this application. Furthermore, the high speed of the drivers allows for rapid adjustments to compensate for beam wandering due to atmospheric turbulence and building sway, which is essential for maintaining a stable FSOC link. The next section presents the finalized mirror array integrated into an enclosure together with the PCB, along with a summary of the specifications compared to the required parameters.

3.4. Prototype and Specifications

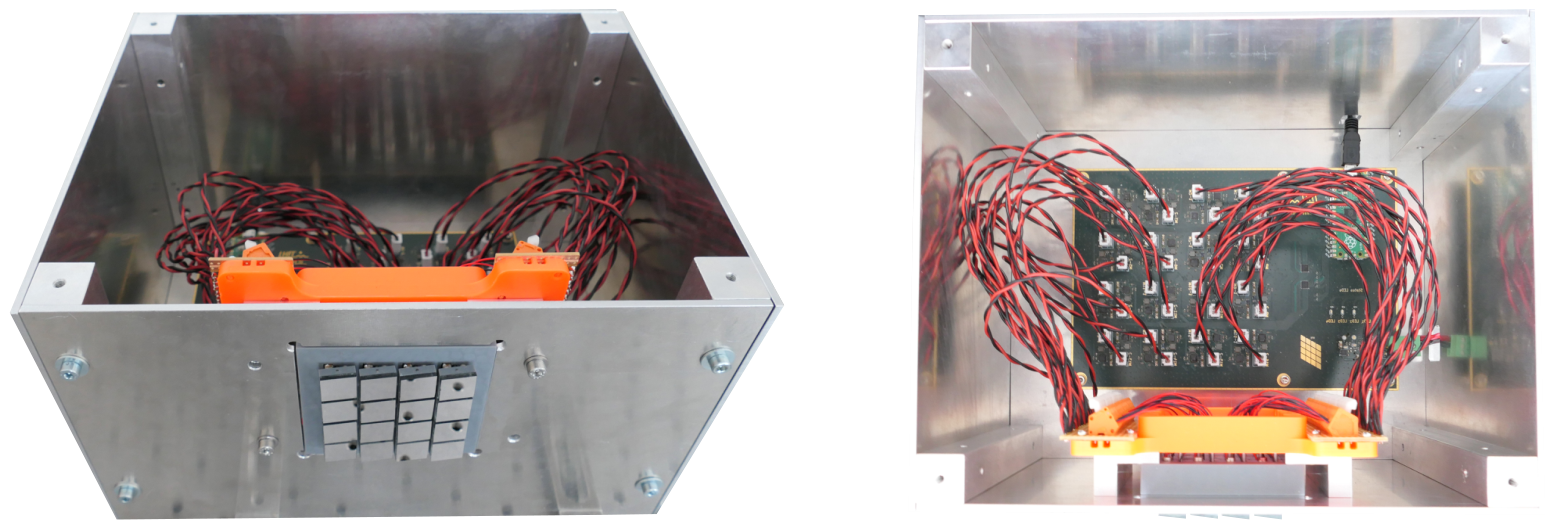
Figure 7 depicts the finalized mirror array and PCB within a protective enclosure, designed to shield components from environmental factors and mechanical damage. While a more compact integration of the array and PCB is feasible for real-world deployment, the presented configuration suffices for the purpose of this prototype.
In Table 1, the key parameters of the mirror array are summarized and compared to the required parameters derived in Section 2. The realized parameters meet or exceed the required specifications, demonstrating that the design successfully fulfills the criteria established for FSOC applications in urban environments. Furthermore, the system supports a wider range of link distances, thereby expanding the operational limits to both shorter and longer link distances than originally specified.
Table 1. Specifications of the 4 × 4 mirror array compared to the required parameters derived in Section 2.
ParameterRealizedRequired
Total mirror size in x-direction X total 65 mm
Total mirror size in y-direction Y total 65 mm
Active mirror size in x-direction X55 mm≥37 mm
Active mirror size in y-direction Y55 mm≥37 mm
Tile size in x-direction a13 mm
Tile size in y-direction b13 mm
Pitch p14 mm
Depth Z24 mm
Fill factor86%
Maximum pre-alignment angle α pre 17°
Maximum tip and tilt angle α max ≈0.2°≥0.08°
Minimum scanning increment δ α 0.87 μrad≤7.95 μrad
Rise time t from 0 V to 90 V≈5 ms≤10 ms [40,41]
Overall, the specifications of the developed mirror array demonstrate its suitability for practical deployment in FSOC systems, particularly in urban environments where precise beam steering and robustness to environmental factors are critical. The design successfully balances performance, scalability, and cost-effectiveness, making it a promising solution for enhancing FSOC links with intelligent reflecting surfaces. In the following sections, the array is further characterized to evaluate its performance for data transmission and to investigate its limitations arising from multipath interference.

4. Multipath Interference

Multipath propagation is a well-known phenomenon in wireless communication, in which multiple replicas of the transmitted signal traverse different paths and arrive at the receiver with different delays. The resulting constructive or destructive interference can lead to signal distortion and thus, degrade signal quality and reduce achievable data rates [42]. In this work, utilizing mirror arrays as an IRS instead of a single mirror, multipath effects arise from the differing optical path lengths (OPLs) of beams reflected by individual mirror elements. Thus, in this section, multipath propagation and the resulting multipath interference associated with mirror arrays are examined. Based on a geometric model of the mirror array, we analyze the OPL differences of the reflected beams to calculate the wavelengths for constructive and destructive interference, noting their correspondence to equivalent frequencies. While interference occurs at both the carrier and modulation frequencies, here, we focus on the latter to investigate its impact on data transmission. Therefore, the frequency response of the mirror array is simulated by comparing input and output sinusoids, allowing us to evaluate how multipath interference affects the modulation frequency and, consequently, signal integrity. The results of the system modeling are shown in Section 6 with the used simulation procedure and parameters described in Section 5.3.

4.1. Multipath Propagation

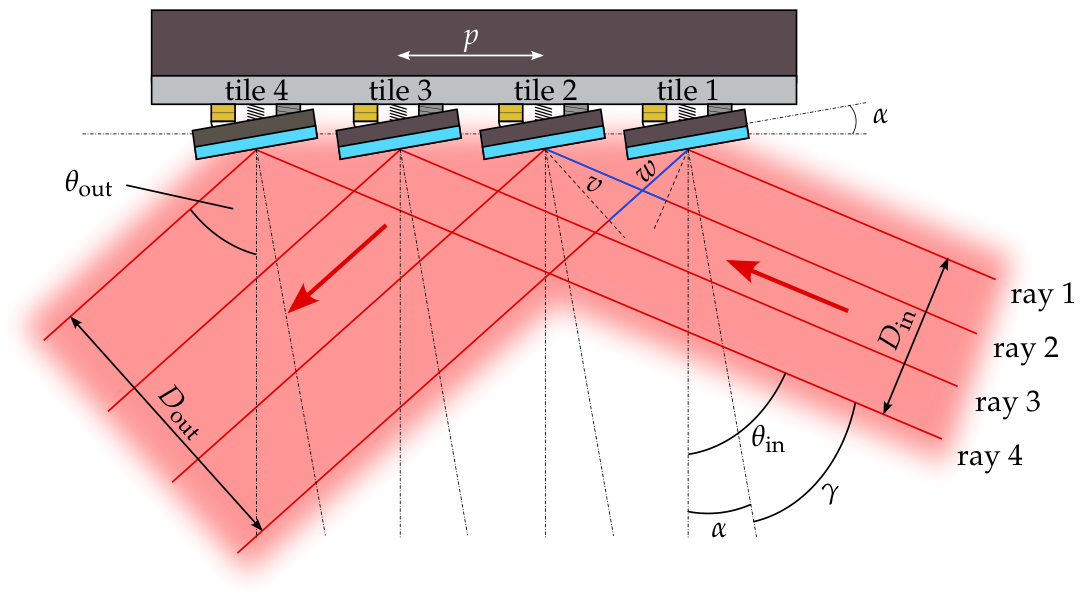
In FSOC systems that employ mirror arrays as IRS instead of a single mirror, multipath can also arise from differing OPLs of the beams reflected by individual mirror elements, as illustrated in Figure 8.
The schematic illustrates a beam with a diameter D in entering the mirror array from the right. All tiles are tilted by the same angle α at an incident angle θ in , both defined with respect to the ground surface. To illustrate the emergence of different OPLs, the beam is decomposed into four rays (1–4) that strike the centers of four tiles under the same angle θ in . Because all tiles lie in the same ground plane and are laterally separated by the pitch p, the OPL traveled by the rays differs. As a consequence, the output beam diameter D out also changes. The optical path length difference ( Δ OPL ) can be obtained from the following simple geometrical calculations. Between rays 1 & 2 it is
Δ OPL = v w ,
where the auxiliary angle
γ = θ in α
yields the output angle
θ out = γ α .
The path projections (blue in Figure 8) are then
v = p · sin ( θ in )
and
w = p · sin ( θ out ) .
With Δ OPL known, the interference conditions can be formulated: for constructive interference
Δ OPL = q · λ con
and for destructive interference
Δ OPL = ( 2 q 1 ) · λ des 2
where q = 1 , 2 , 3 , is the interference order. Hence, the wavelengths λ con and λ des (or equivalently, frequencies) for which constructive or destructive interference occurs can be calculated. For simplicity, analogous expressions for the ray pairs 1 & 3 and 1 & 4 are obtained by varying p with the corresponding lateral separations. Physically, different parts of the beam interfere with one another due to their OPL differences.
These interference effects can be grouped into two categories: interference at the modulation frequency, which is critical for data transmission, and interference at the optical carrier frequency. Modulation frequency interference may introduce intersymbol interference (ISI), degrading signal quality and limiting data rate. By contrast, carrier frequency interference can cause deep fades or even complete signal loss at the receiver under destructive conditions. This is particularly critical because the carrier wavelength is λ = 1550   nm , while the OPL differences are on the order of millimeters for the designed mirror array, so even small wavelength variations can lead to large phase shifts and pronounced fading. Consequently, carrier frequency interference must be mitigated, and modulation frequency interference must be analyzed to assess its impact on data transmission.

4.2. System Modeling

For channel modeling of IRS in FSOC systems, the frequency response of the link is critical because it constrains the maximum achievable data rate. Such analysis quantifies interference effects versus modulation frequency, supports performance evaluation of the FSOC link, and guides mirror array optimization for improved throughput. It also enables validation against measurements. To simulate the frequency response of the FSOC link with the 4 × 4 mirror array for comparison with the measurements in Section 5.1, one may compute it from the impulse response as in [30]. Here, we adopt a more intuitive approach by evaluating the amplitude ratio of sinusoidal signals at the system output and input across modulation frequencies. The ray tracing analysis and the corresponding optical path length difference Δ OPL are incorporated through the sinusoidal phase terms. In addition, variations in ray power are incorporated by adapting the power of each ray incident on the tiles to approximate the Gaussian intensity profile of the laser beam.
In the following, we demonstrate the simulation of the frequency response for the reflections associated with rays 1 & 2 (tiles 1 & 2 in Figure 8). Neglecting carrier interference, the signal corresponding to ray 1 is modeled as
s 1 ( t ) = A 1 · sin ( 2 π · f mod · t ) ,
where A 1 is the field amplitude (set to 1), f mod the modulation frequency, and t the time. Similarly, the signal for ray 2 is
s 2 ( t ) = A 2 · sin ( 2 π · f mod · t + Δ ϕ ) ,
where A 2 is the amplitude of ray 2. The phase shift Δ ϕ accounts for the OPL difference from Equation (2)
Δ ϕ = 2 π f mod c · Δ OPL ,
where c is the speed of light. If the beam’s intensity profile is non-uniform across the tiles, the power of the rays incident on each tile varies. This imbalance can arise from the beam profile itself (e.g., Gaussian) or from a lateral displacement relative to the active tiles. Therefore, sub-rays of ray 2 are defined to account for the power variation across tile 2. Each sub-ray corresponds to a portion of the beam incident on tile 2, and its amplitude is adjusted according to the beam’s intensity profile. The amplitude can be expressed as
A 2 , m = A 2 Δ A · f ( m ) , m = 1 , , M ,
where Δ A denotes the maximum variation in amplitude of ray 2, m is the respective sub-ray index, and M represents the total number of sub-rays, serving as a discretization parameter to control the resolution of the amplitude distribution. The normalized function f ( m ) describes the distribution profile of the amplitude change. While the specific form of f ( m ) can be adapted to match any actual beam profile (such as a Gaussian distribution for a Gaussian beam), a linear variation defined by f ( m ) = m 1 M 1 is implemented here. This ensures the boundary conditions f ( 1 ) = 0 and f ( M ) = 1 are met. Even with this linear approximation, the results show good agreement with the measurements. Incorporating this effect, the average signal s ¯ 2 becomes
s ¯ 2 ( t ) = 1 M m = 1 M A 2 , m · sin 2 π · f mod · t + 2 π f mod c · Δ OPL .
Finally, the magnitude of the frequency response is computed as the amplitude ratio of the composite signals s 1 and s ¯ 2
H ( f mod ) = max s ¯ 2 ( t ) + s 1 ( t ) 2 · max s 1 ( t ) .
Here, the max operator is employed to determine the signal’s peak amplitudes required for the ratio. The factor of 2 in the denominator serves as a normalization constant. It ensures that the amplitude is correctly scaled, resulting in a maximum value of unity when both signals interfere constructively. Because s ¯ 2 ( t ) is a superposition of sinusoids with different phases and amplitudes, constructive and destructive interference occur at different modulation frequencies. Thus, evaluating H ( f mod ) over the modulation frequency reveals the interference-induced degradation profile. The resulting magnitude of the frequency response H ( f mod ) corresponds to the scattering parameter S 21 measured with a vector network analyzer (VNA) (see Section 5.1) and can be directly compared with the experimental data (Section 6). As noted above, the same procedure can be applied to the ray pairs 1 & 3 and 1 & 4 by adjusting the pitch p in v and w. When all tiles are illuminated, all ray contributions with their respective Δ OPL and amplitudes are superimposed. As can be seen in the results in Section 6, this procedure enables a detailed analysis of interference effects.

5. Experimental Validation

In this section, we first describe the measurement setup and its components using the realized 4 × 4 mirror array to determine its frequency response. The setup is designed to reveal modulation frequency interference due to an optical path length difference between the tiles. Subsequently, the measurement and simulation procedure are explained in detail, presenting the configurations used for the experiment.

5.1. Measurement Setup

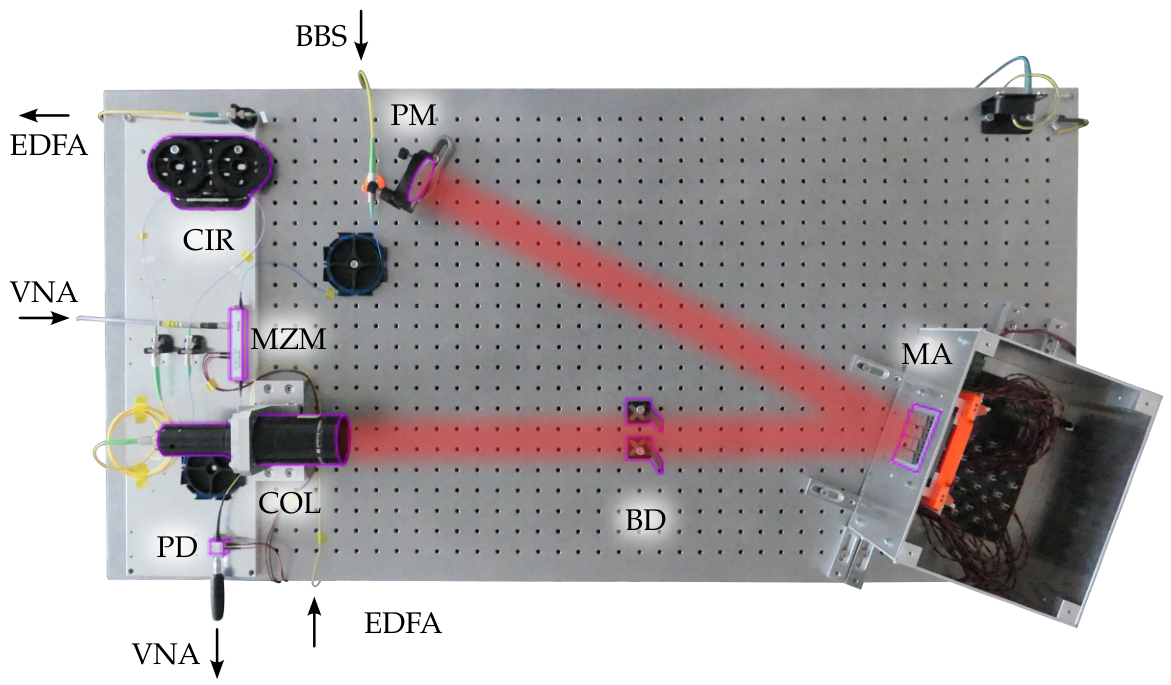
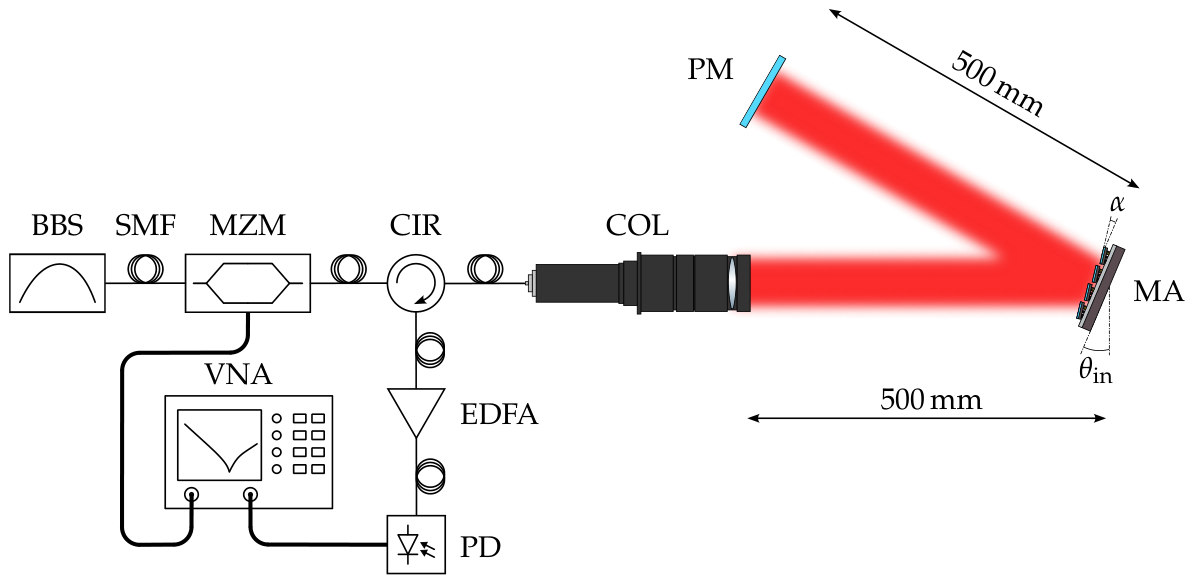
To measure modulation frequency interference when using the mirror array as an intelligent reflecting surface in FSOC systems, we implemented the setup shown in Figure 9. Since the highest destructive interference frequency for the designed mirror array is in the order of tens of gigahertz, computed with Equation (8), high-speed photodetectors and modulators are required. These components are predominantly available as fiber-coupled devices. Thus, fiber-coupled components are employed because commercial fiber-coupled devices typically offer broader electrical bandwidths than their free-space counterparts. Furthermore, a fiber-based architecture improves flexibility and handling. However, coupling light from free space into a single-mode fiber is challenging and requires careful alignment.
A low-coherence source is used to suppress interference at the optical carrier, as discussed in Section 4.1. Specifically, the amplified spontaneous emission (ASE) of an Erbium-doped fiber amplifier serves as a broadband light source (BBS, Oprel, OFP14M-12142S) at λ = 1550   nm with an optical power P of 13.4 dBm. The source is connected via single-mode fiber (SMF, Corning, SMF28) to a Mach-Zehnder modulator (MZM, iXBlue, MXAN-LN-40), which imposes an RF sweep generated by a vector network analyzer (VNA, Keysight, E8363B) from 10 MHz to 40 GHz. The modulated light is routed through an optical circulator (CIR, Thorlabs, 6015-3-APC) to a large-beam collimator (COL, Schaefter&Kirchhoff, 60FC-T-4-M200-37) that launches the beam into free space. The free-space beam has a diameter of D 0 37   mm to ensure adequate illumination of the mirror array (MA). After propagating 500 mm, it impinges on the array at an incident angle θ in = 18 ° , as dictated by the experimental layout. In this configuration, all tiles are set to a uniform tilt of α = 6.5 ° . For practicality, only four tiles of the 4 × 4 array are used (see Figure 11), as precise alignment for SMF recoupling is demanding and will be explained in more detail below. Rather than tilting the beam, the array itself is rotated by 18 ° to achieve the same incidence angle θ in = 18 ° . After reflection from the MA, the beam is directed to a plane mirror (PM), located at a distance of 500 mm, reflected back to the array and to the collimator for recoupling into the fiber. This approach is advantageous because the beam diameter changes after reflection from the array (see Figure 8); without the return path, a different collimator might be required for efficient coupling. In addition, the round trip doubles the optical path length differences Δ OPL . Therefore, the modulation frequency at which destructive interference occurs (see Equation (8)) is halved, which is beneficial to detect the interference with the used VNA. The recoupled light is delivered via SMF to a high-speed photodetector (PD, Coherent, HPDV2120R) with a 3 dB-bandwidth of 50 GHz. Coupling the returned beam back into the SMF is challenging because it requires precise alignment of each tile. Accordingly, each mirror element is adjusted by fine voltage steps to maximize coupling power. The VNA records the scattering parameter S 21 , representing the link frequency response. To ensure sufficient electrical power received, an Erbium-doped fiber amplifier (EDFA, Thorlabs, EDFA100S) with approximately 20 dB gain is inserted before the PD. The optical power at the PD input is approximately 5.4 mW. The corresponding laboratory setup is shown in Figure 10.
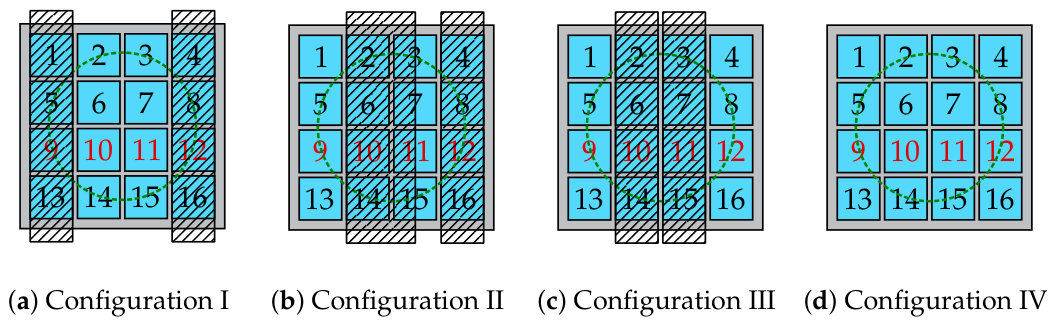
Given the alignment complexity, a single row of tiles is used during measurements to simplify the optical pattern and to permit comparison with the simplified calculations in Section 4.1. Using all tiles would produce a more complex intensity distribution and frequency response due to multiple differing OPLs. For this configuration, a blocking device (BD) is employed (Figure 10) to restrict the active elements to mirrors 9, 10, 11, and 12 (see Figure 11); the remaining tiles are left flat to prevent effective recoupling.

5.2. Measurement Procedure

To visualize Δ OPL and thus the interference between selected tiles, the active tiles must be isolated during measurement. Accordingly, light from specific tiles is blocked as required by the measurement condition. Figure 11a–d show the measurement configurations of the setup with the 4 × 4 mirror array and the indexing of the individual tiles. Tiles 9, 10, 11, and 12 (red) are selected for measurement because their central location ensures more uniform illumination by the laser beam. Depending on the configuration, certain tiles are blocked by the BD (shaded black box), and the remaining unused tiles are left flat, prevented from recoupling into the SMF, and are not used in the measurements.
Figure 11. Measurement configurations (ad) for the 4 × 4 mirror array with tile indexing. Tiles 9, 10, 11, and 12 (red) are used for the measurements. Measurement configurations (I–IV) illustrating shaded black boxes which indicate the blocking device (see Figure 10) and isolate tile pairs to analyze the interference between them. Further tiles that are not used are left in a flat position to prevent recoupling into the SMF. The green dashed circle indicates the beam diameter D 0 .
Photonics 13 00525 g011
The beam diameter D 0 is defined at the 1 / e 2 intensity level and is indicated by the green dashed circle. Because the beam diameter is smaller than the combined footprint of the four tiles and the array is not completely covered by the beam footprint, the outer tiles receive only partial illumination. Even though the beam diameter is only approximately 37 mm and the largest pitch p between tiles 9 & 12 is 42 mm, the Gaussian beam tails extend beyond this diameter. In the simulation, this effect is accounted for by reducing the reflected amplitudes A 2 , m . More generally, the non-uniform power distribution of the Gaussian beam profile and potential lateral displacement of the beam footprint necessitate an adjustment of the amplitude A 2 , m within the model, although lateral displacement is ideally not present under optimal alignment conditions.
The adjacent tiles 10 & 11 in Configuration I are illuminated almost equally, resulting in a balanced power distribution. However, in Configuration II, tile 9 is not completely covered by the beam footprint, while tile 11 receives more power. Therefore, A 2 , m is adjusted accordingly within the simulation. This asymmetry leads to a stronger contribution of tile 11 and thus, a weaker interference effect between tiles 9 & 11. To ensure comparable power, a broader blocking device is used to partially block tile 11 and match the power distribution between both tiles. Nevertheless, the pitch p between both tiles does not change because by reducing the illumination area of tile 11, the tile’s center shifts. In Configuration III, tiles 9 & 12 receive similar illumination; however, due to the larger pitch p, the Gaussian beam intensity at these tiles is significantly lower than in Configuration I, resulting in a reduced amplitude A 2 , m for the reflected ray, incorporated into the model. The different power distribution for Configuration IV between the tiles leads to a more complex interference pattern because the contributions of the tiles differ. This is accounted for in the simulations by a superposition of Configuration I–III.
Four measurement configurations, I–IV, as shown in Figure 11, are employed to analyze interference effects and characterize the frequency response under different conditions:
(I)
Tiles 10 & 11 are unblocked while tiles 9 & 12 are blocked, the pitch p is 14 mm.
(II)
Tiles 9 & 11 are unblocked while tiles 10 & 12 are blocked, the pitch p is 28 mm.
(III)
Tiles 9 & 12 are unblocked while tiles 10 & 11 are blocked, the pitch p is 42 mm.
(IV)
All tiles are unblocked.

5.3. Simulation Procedure

As explained in the measurement setup (Section 5.1), Δ OPL used in the analysis accounts for the round trip of the light, i.e., twice the single pass value. To enable a direct comparison with the experimental data, the magnitude of the frequency response H ( f mod ) from Equation (14) is computed and expressed on a logarithmic scale as 20 · log 10 H ( f mod ) . This yields the simulated scattering parameter S 21 of the system, matching the standard magnitude format of the VNA and thus allowing a direct quantitative comparison with the measured S 21 . To account for setup-induced effects, the reference response of the system in Figure 9 without the mirror array was measured. The resulting system loss across the modulation bandwidth of the VNA was subtracted from the simulation. Moreover, an offset Δ S 21 is applied to the simulated frequency response to match the measured level and include residual system losses not captured by the model.
At the beginning, Equations (2)–(8) are solved for the specific angles θ in and α of the measurement setup and the designed pitch values p. As can be seen from Figure 11, the pitch p varies between the different tile pairs, which leads to different Δ OPL and thus to different interference conditions. The designed pitch values p for Configuration I–III are 14 mm, 28 mm, and 42 mm, respectively. For Configuration IV, a superposition is performed, as explained in Section 6. From Equation (8), the frequencies for destructive interference are calculated, as shown in Table 4. These frequencies are expected to correspond to the minima in the measured frequency response.
Subsequently, the frequency response is simulated using the model described in Section 4.2. The parameters used above are adapted, the amplitude A 2 , m , including an adaptation of the amplitude A 2 and the amplitude variation Δ A , and the offset Δ S 21 are implemented to best match the measurement conditions for Configuration I–IV. The adjustment of A 2 , m considers a nonuniform beam profile and decentered illumination, as described in Section 4.2 and Section 5.2. A total of M = 2 sub-rays is sufficient for the calculation of the amplitude A 2 , m . The resulting frequencies for destructive interference are then compared with the calculated minima to validate the model (see Table 4).

6. Measurement Results

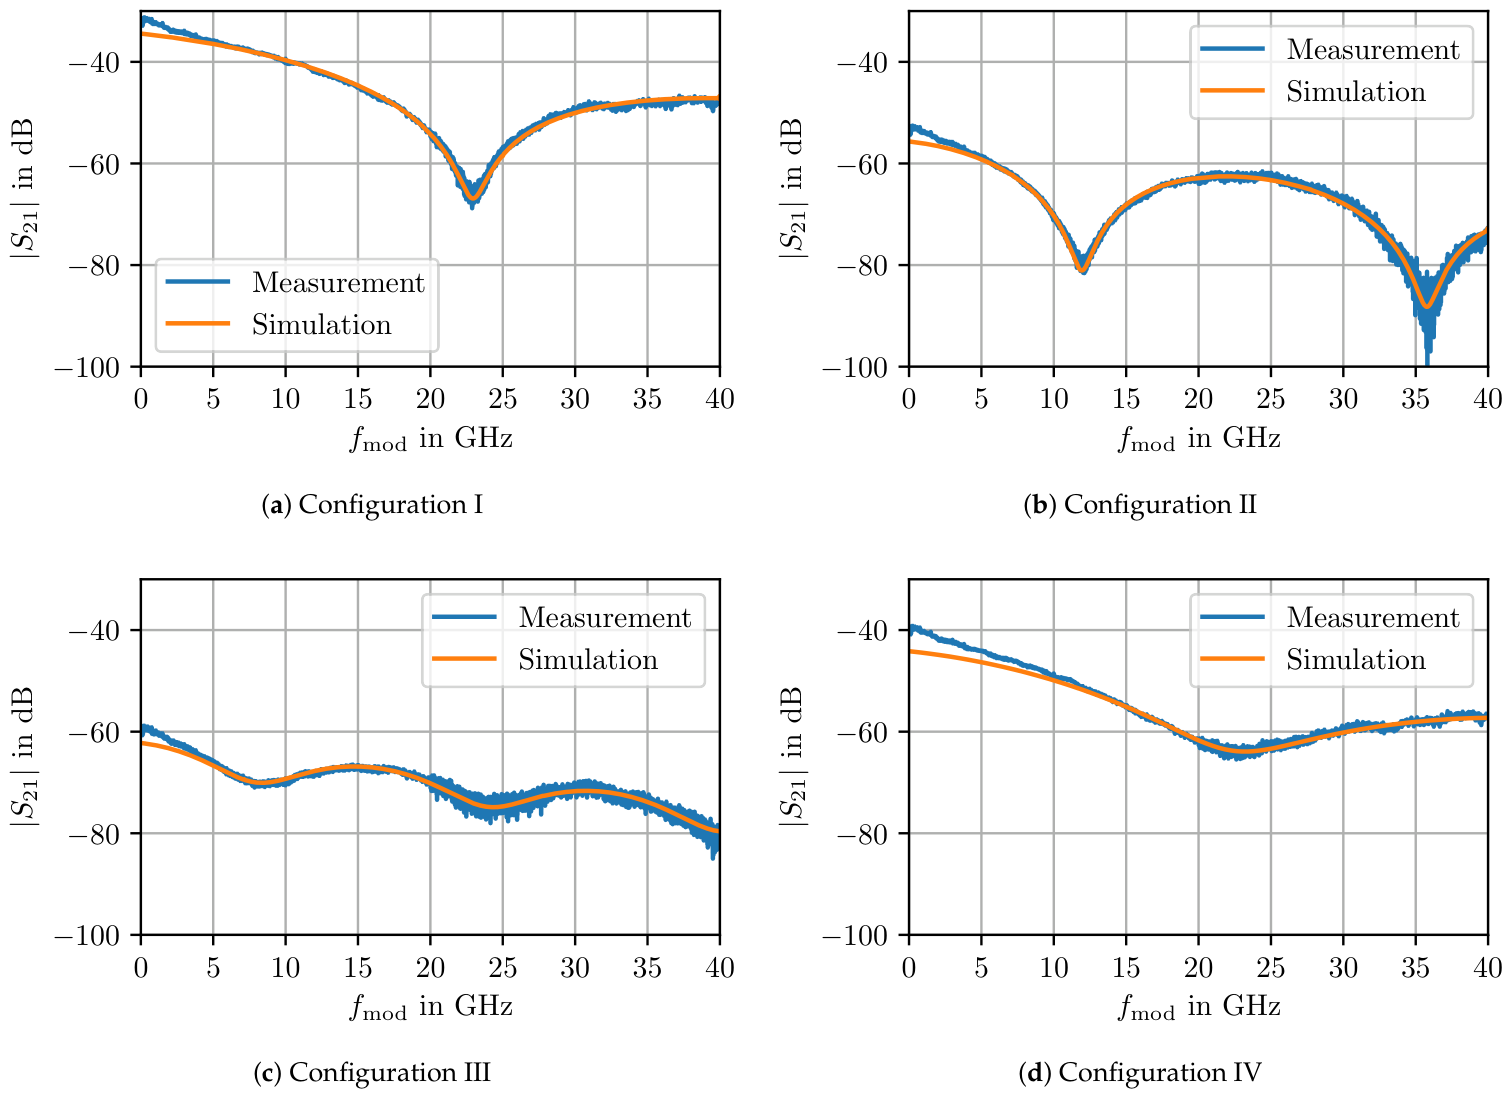
In this section, the results of the measurements and simulations are presented and compared to validate the model and to demonstrate multipath interference in the 4 × 4 mirror array. Thus, their impact on data transmission can be assessed, which is critical for optimizing mirror array designs for FSOC applications. The measurement results for the configurations I–IV are shown in Figure 12.
In these measurements, the scattering parameter S 21 is plotted versus the modulation frequency f mod from 10 MHz to 40 GHz. Each trace (blue) is averaged over 50 sweeps of the VNA to improve the signal-to-noise ratio. The frequency responses clearly exhibit minima at specific modulation frequencies, confirming interference at the modulation frequency induced by differential time delays between rays reflected from different tiles. Moreover, the first minimum corresponds to the fundamental destructive interference frequency; subsequent minima correspond to harmonics. The minimum locations agree well with the calculations in Section 4.2. The simulated responses (orange) match the measurements closely, validating the model and demonstrating that induced modulation frequency interference can be effectively analyzed using the proposed approach.
The simulation parameters for Configuration I, II and III are summarized in Table 2. A change of the input angle θ in , tilt angle α , or pitch p would affect the optical path length difference Δ OPL and thus, the frequency at which destructive interference occurs, equivalent to the position of the minima in the plots. The pitch values p deviate slightly from the designed values 14 mm, 28 mm, and 42 mm for Configuration I-III, respectively. The manual bonding of the mirrors onto the top of the mirror plates may introduce slight positioning errors, leading to a deviation in the effective pitch. In addition, inherent design and assembly tolerances can further contribute to variations in the pitch dimensions.
The differences in insertion loss S 21 across the measurements are caused by the Gaussian intensity distribution and the beam’s small footprint relative to the array size. As can be observed from Figure 11, more optical power is reflected for Configuration I than for Configuration II and III, where the outer tiles receive less power due to the Gaussian beam profile. The higher optical power also leads to a stronger modulation power at the photodetector and thus, a higher level of S 21 for Configuration I. Similarly, just as Configurations II and III exhibit a similar power distribution, the same applies to Configurations I and IV, where the center tiles are utilized. Generally, fiber-coupling efficiency varies between the configurations and tends to decrease as more tiles are illuminated, making the alignment process increasingly challenging. The offsets Δ S 21 are applied to match those different levels of the measured signals. Due to the differences in insertion losses S 21 , the offsets Δ S 21 for the simulation have to vary between the configurations.
The amplitude A 1 represents the amplitude of the first ray (first tile) and is set to 1 for normalization. The amplitude A 2 , m of the second ray, meaning, from the second tile in the pair for each configuration is expressed by A 2 and its variation Δ A , as defined in Equation (12). A 2 and Δ A account for the reduction and variation of the modulation frequency amplitude across the illuminated tiles, respectively. Therefore, both expressions are closely connected and affect the interference contrast of the signal and thus, how profound the minima are. For Configurations I and II, A 2 and Δ A require only minor adjustments, indicating a nearly balanced power distribution. In contrast, the amplitude A 2 for Configuration III is significantly reduced to match the low interference contrast observed in Figure 12c. This is due to the lower intensity at the outer tiles, as explained in Section 5.2, which results in less pronounced minima.
The simulation parameters for Configuration IV are summarized separately in Table 3 since the approach differs from the previous configurations. In Configuration IV, all four tiles are unblocked, so the frequency response is simulated as a superposition of the responses from configurations I–III.
For the simulation of Configuration IV (Figure 12d), a superposition of all four Iterations is employed. Iterations 1, 2, and 3 utilize the simulation parameters of Configuration I, as the pitch p = 14.3   mm appears three times across the illuminated row (see Figure 11). The dominant role of Configuration I and thus, of the center tiles, is demonstrated by the similarity between the frequency responses of Configurations I and IV, as both interference patterns are governed by the same pitch p. Although the pitch associated with Configuration II occurs twice, the optical power returned from these specific tile combinations is significantly lower than that of Configuration I. Consequently, only Iteration 4 is attributed to Configuration II, while Configuration III is omitted entirely due to its negligible power contribution. Furthermore, the amplitude for Iteration 4 is drastically reduced compared to the values listed for Configuration II in Table 2, reflecting its minor contribution to the overall interference effect. If all 16 tiles were illuminated simultaneously without blocking, the resulting frequency response would be expected to exhibit a complex superposition of all possible tile combinations with different pitches p. Therefore, the frequency response would lose its distinct minima, making the interference effects less pronounced. This effect can already be observed for Configuration IV.
To validate the system modeling (Section 4.2), the minima of the measured and simulated frequency responses from Figure 12 are compared with the calculated frequencies for destructive interference, which are derived from the wavelengths calculated in equation Equation (8). The results can be seen in Table 4. The calculated column uses the pitch values p 14 mm, 28 mm, and 42 mm for the configurations I–III, respectively. For Configuration IV, it is assumed that the pitch p 14 mm is dominant; therefore, the calculation is the same as for Configuration I. The angles α and θ in are set to 6.7 ° and 18 ° , respectively, the same values as for the simulation.
The minima extracted from the plots (Figure 12) are in good agreement with the calculated minima, confirming the validity of the theoretical model and demonstrating that the observed minima arise from modulation frequency interference due to Δ OPL between tiles. The slight discrepancies between the calculated and measured/simulated minima can be attributed to the aforementioned variations in parameters such as pitch p and tilt angle α , which affect Δ OPL and thus, the interference conditions. As can be seen, the second minimum cannot be captured for Configurations I and IV since the electrical bandwidth of the VNA is too limited, despite the fact that the measurement setup already employs twice the optical path in free space, as explained above.
Overall, the measurements and simulations show excellent agreement, validating the proposed model and the theoretical analysis of interference arising from optical path length differences. The observed frequency response minima align closely with the calculated destructive interference frequencies, confirming the model’s accuracy. These results establish practical constraints on the usable modulation bandwidth in FSOC links employing mirror arrays. Operating beyond the first minimum would introduce significant ISI and compromise system performance. Furthermore, the interference effects are highly sensitive to design parameters such as tile pitch, incident angle, and tile tilt. For example, a larger array with larger tile pitches p would shift destructive interference to lower frequencies. Consequently, the first minimum would occur at a lower modulation frequency, drastically reducing the usable modulation bandwidth and limiting achievable data rates. The presented model serves as an important tool for predicting these bandwidth limits and mitigating signal degradation across various array designs. Consequently, accounting for such multipath-induced effects is essential for optimizing mirror arrays and maximizing throughput in high-speed FSOC applications.

7. Conclusions

In summary, this paper presented the concept of an IRS for FSOC in urban environments. The proposed highly modular and scalable 4 × 4 mirror array utilizes a compact tip-tilt mechanism, yielding overall dimensions of 55   mm × 55   mm × 24   mm , a high transmit power capability, and a high fill factor of 86 % . The design supports coarse pre-alignment up to 17 ° , which is crucial for initial link acquisition. Equipped with a dedicated PCB and piezoelectric actuators, the mirror elements achieve a maximum tilt of approximately 0.2 ° with a scanning resolution of 0.87   μ rad , enabling precise beam steering and forming. These capabilities are sufficient to mitigate typical building sway and beam wandering due to atmospheric turbulence in FSOC links.
A geometrical model was introduced to analyze interference arising from differential optical path lengths of rays reflected by different tiles, which induce relative time delays at the receiver. While modulation frequency interference can lead to ISI and degrade system performance, optical carrier interference must be suppressed to avoid deep fading or complete signal loss. Accordingly, a low-coherence source was employed to measure the mirror array’s frequency response, isolating modulation frequency interference while suppressing carrier-induced effects. The fiber-coupled setup further demonstrated the feasibility of efficient single-mode fiber recoupling after reflection. Across four configurations, the measured frequency responses exhibited distinct minima attributable to destructive modulation interference caused by tile-dependent optical path length differences. The high agreement between modeled and measured responses validates the proposed approach and confirms that such interference effects can be effectively studied using the developed model.
These measurements serve as a foundation for future work, which will focus on bit error rate characterization and its relationship to the observed interference effects. Consequently, ISI can be investigated and its impact on data transmission performance analyzed. Moreover, the mirror array will be tested under real-world conditions, including atmospheric turbulence and building sway, to evaluate its robustness in practical FSOC scenarios. In this context, mitigation strategies for the observed interference will be explored, with a particular interest in the combined effects of atmospheric turbulence and multipath interference.
This proof-of-concept, based on an initial prototype, underscores the viability of using mirror arrays as an IRS. As a versatile platform, this system architecture offers promising avenues for next-generation FSOC applications, providing the necessary flexibility for advanced beam-steering and signal optimization. The results highlight the necessity of accounting for multipath-induced interference in mirror array designs, as carrier fading and modulation-related ISI can impose significant performance penalties. The developed model provides a framework to bound the usable modulation bandwidth and guide design choices to mitigate these interference effects.


Author Contributions

Conceptualization, A.R. and B.S.; methodology, A.R., J.W., V.P., H.A., R.S. and B.S.; software, A.R. and J.W.; validation, A.R., V.P. and H.A.; formal analysis, A.R. and J.W.; investigation, A.R. and J.W.; resources, R.S. and B.S.; data curation, A.R. and J.W.; writing—original draft preparation, A.R.; writing—review and editing, A.R., J.W., V.P., H.A., R.S. and B.S.; visualization, A.R. and V.P.; supervision, A.R. and B.S.; project administration, R.S. and B.S.; funding acquisition, R.S. and B.S. All authors have read and agreed to the published version of the manuscript.

Funding

This research was funded by the Deutsche Forschungsgemeinschaft (DFG, German Research Foundation)—project number 515937276.

Institutional Review Board Statement

Not applicable.

Informed Consent Statement

Not applicable.

Data Availability Statement

Data is contained within the article.

Acknowledgments

The authors gratefully acknowledge funding of the Erlangen Graduate School in Advanced Optical Technologies (SAOT) by the Bavarian State Ministry for Science and Art.

Conflicts of Interest

The authors declare no conflicts of interest.

References

  1. Xie, Y.; Wang, C.; Huang, J. Structure and Evolution of the Submarine Cable Network of Chinese Mainland. J. Geogr. Sci. 2022, 32, 932–956. [Google Scholar] [CrossRef]
  2. Othman, W.M.; Ateya, A.A.; Nasr, M.E.; Muthanna, A.; ElAffendi, M.; Koucheryavy, A.; Hamdi, A.A. Key Enabling Technologies for 6G: The Role of UAVs, Terahertz Communication, and Intelligent Reconfigurable Surfaces in Shaping the Future of Wireless Networks. J. Sens. Actuator Netw. 2025, 14, 30. [Google Scholar] [CrossRef]
  3. Roseline, A.; Kumar, P.M. Future Prospects of 6G Wireless Communication: Review of Antenna Technologies. Discov. Electron. 2024, 1, 36. [Google Scholar] [CrossRef]
  4. Hassan, M.M. Scope of Potential in FSO Technology as Compared to RF Technology in the Next Generation Networks. J. Netw. Commun. Emerg. Technol. 2017, 7, 39–43. [Google Scholar]
  5. Guiomar, F.P.; Fernandes, M.A.; Nascimento, J.L.; Rodrigues, V.; Monteiro, P.P. Coherent Free-Space Optical Communications: Opportunities and Challenges. J. Light. Technol. 2022, 40, 3173–3186. [Google Scholar] [CrossRef]
  6. Khalighi, M.A.; Uysal, M. Survey on Free Space Optical Communication: A Communication Theory Perspective. IEEE Commun. Surv. Tutor. 2014, 16, 2231–2258. [Google Scholar] [CrossRef]
  7. Ishida, T.; Naila, C.B.; Okada, H.; Katayama, M. Performance Analysis of IRS-Assisted Multi-Link FSO System Under Pointing Errors. IEEE Photonics J. 2024, 16, 7302510. [Google Scholar] [CrossRef]
  8. Najafi, M.; Schmauss, B.; Schober, R. Intelligent Reflecting Surfaces for Free Space Optical Communication Systems. IEEE Trans. Commun. 2021, 69, 6134–6151. [Google Scholar] [CrossRef]
  9. Abumarshoud, H.; Mohjazi, L.; Dobre, O.A.; Di Renzo, M.; Imran, M.A.; Haas, H. LiFi through Reconfigurable Intelligent Surfaces: A New Frontier for 6G? IEEE Veh. Technol. Mag. 2022, 17, 37–46. [Google Scholar] [CrossRef]
  10. Jamali, V.; Ajam, H.; Najafi, M.; Schmauss, B.; Schober, R.; Poor, H.V. Intelligent Reflecting Surface Assisted Free-Space Optical Communications. IEEE Commun. Mag. 2021, 59, 57–63. [Google Scholar] [CrossRef]
  11. Schulz, S.A.; Oulton, R.F.; Kenney, M.; Alù, A.; Staude, I.; Bashiri, A.; Fedorova, Z.; Kolkowski, R.; Koenderink, A.F.; Xiao, X.; et al. Roadmap on Photonic Metasurfaces. Appl. Phys. Lett. 2024, 124, 260701. [Google Scholar] [CrossRef]
  12. Long, W.; Chen, R.; Moretti, M.; Zhang, W.; Li, J. A Promising Technology for 6G Wireless Networks: Intelligent Reflecting Surface. J. Commun. Inf. Netw. 2021, 6, 1–16. [Google Scholar] [CrossRef]
  13. Fang, C.; Li, S.; Wang, Y.; Wang, K. Survey on Optical Wireless Communication with Intelligent Reflecting Surfaces. Photonics 2024, 11, 830. [Google Scholar] [CrossRef]
  14. Hamid, H.; Begh, G.R. IRS Assisted UAV Communications for 6G Networks: A Systematic Literature Review. Wirel. Netw. 2025, 31, 779–807. [Google Scholar] [CrossRef]
  15. Wu, Z.Y.; Ismail, M.; Zhang, J.; Zhang, J. Tidal-Like Concept Drift in RIS-Covered Buildings: When Programmable Wireless Environments Meet Human Behaviors. IEEE Wirel. Commun. 2025, 32, 133–140. [Google Scholar] [CrossRef]
  16. Palitharathna, K.W.S.; Maria Vegni, A.; Suraweera, H.A. SLIVER: A SLIPT-enabled IRS-assisted VLC System for Energy Optimization. In Proceedings of the 2023 IEEE 20th International Conference on Mobile Ad Hoc and Smart Systems (MASS), Toronto, ON, Canada, 25–27 September 2023; pp. 143–151. [Google Scholar] [CrossRef]
  17. Ata, Y.; Abumarshoud, H.; Bariah, L.; Muhaidat, S.; Imran, M.A. Intelligent Reflecting Surfaces for Underwater Visible Light Communications. IEEE Photonics J. 2023, 15, 7300609. [Google Scholar] [CrossRef]
  18. Kim, J.G. System Integration Design of High-Performance Piezo-Actuated Fast-Steering Mirror for Laser Beam Steering System. Sensors 2024, 24, 6775. [Google Scholar] [CrossRef] [PubMed]
  19. Song, Y.; Panas, R.M.; Hopkins, J.B. A Review of Micromirror Arrays. Precis. Eng. 2018, 51, 729–761. [Google Scholar] [CrossRef]
  20. Wang, H.; Zhang, Z.; Zhu, B.; Dang, J.; Wu, L.; Zhang, Y. Approaches to Array-Type Optical IRSs: Schemes and Comparative Analysis. J. Light. Technol. 2022, 40, 3576–3591. [Google Scholar] [CrossRef]
  21. Djordjevic, I.B.; Rojas, I.A. On the Degenerate Entanglement-Assisted Free-Space Optical Communication With SLM-Based Beam Steering Using Dual-Pump Lasers. IEEE Access 2025, 13, 156839–156842. [Google Scholar] [CrossRef]
  22. Zhang, G.; Schreier, A.; Wang, X.; Matthews, W.; Farmer, J.; Faulkner, G.; Elston, S.J.; Morris, S.M.; O’Brien, D. Free-Space Optical Communication Link With Liquid Crystal Beam-Steering. IEEE Photonics Technol. Lett. 2023, 35, 1199–1202. [Google Scholar] [CrossRef]
  23. Ahmad, F.; Raghunathan, V. Reconfigurable Multi-Beam Steering Using Segmented Spatial Light Modulator for Indoor Optical Wireless Communication. In Proceedings of the Next-Generation Optical Communication: Components, Sub-Systems, and Systems XII; Li, G., Nakajima, K., Srivastava, A.K., Eds.; SPIE: San Francisco, CA, USA, 2023; p. 32. [Google Scholar] [CrossRef]
  24. Di, B.; Zhang, Y.; Deng, R.; Wang, M.; Sun, S.; Song, L. Holographic Metasurfaces for Extremely Large-Scale MIMO Communications: Design, Implementation, and Experiment Results. IEEE Wirel. Commun. 2025. [Google Scholar] [CrossRef]
  25. Wang, K.; Fang, C.; Ali, M.O.; Chen, X.; Alghadi, S.; Li, S.; He, J.; Kandeepan, S. Optical Wireless Communications with Metasurfaces: Current Status and Potential for Intelligent Communications. Adv. Photonics Res. 2025, 6, 2500015. [Google Scholar] [CrossRef]
  26. Yang, Y.; Lee, E.; Park, Y.; Seong, J.; Kim, H.; Kang, H.; Kang, D.; Han, D.; Rho, J. The Road to Commercializing Optical Metasurfaces: Current Challenges and Future Directions. ACS Nano 2025, 19, 3008–3018. [Google Scholar] [CrossRef]
  27. Ajam, H.; Najafi, M.; Jamali, V.; Schmauss, B.; Schober, R. Modeling and Design of IRS-Assisted Multilink FSO Systems. IEEE Trans. Commun. 2022, 70, 3333–3349. [Google Scholar] [CrossRef]
  28. Zhang, Q.; Yang, F.; Liu, Z.; Sun, S.; Zhang, H.; Song, J. Hardware Implementation of a Mirror Array-Based Optical Intelligent Reflecting Surface for VLC: Prototype and Experimental Results. Opt. Express 2024, 32, 19252. [Google Scholar] [CrossRef]
  29. Xu, B.; Lin, B.; Chen, J.; Zheng, B.; Pang, G.; Luo, J.; Ghassemlooy, Z. OIRS-Assisted NLOS Visible Light Communication Systems: Modeling, Optimization, and Experimental Validation. IEEE Internet Things J. 2025, 12, 40458–40469. [Google Scholar] [CrossRef]
  30. Chen, C.; Huang, S.; Abumarshoud, H.; Tavakkolnia, I.; Safari, M.; Haas, H. Frequency-Domain Channel Characteristics of Intelligent Reflecting Surface Assisted Visible Light Communication. J. Light. Technol. 2023, 41, 7355–7369. [Google Scholar] [CrossRef]
  31. ICNIRP. ICNIRP Guidelines on Limits of Exposure to Laser Radiation of Wavelengths Between 180 nm and 1000 μm. Health Phys. 2013, 105, 271–295. [Google Scholar] [CrossRef]
  32. Veitch, J.; Chen, D.; Petticrew, J.; Ng, J.S.; Tan, C.H. Sensitivity Improvement of 2.5 Gb/s Receivers Using AlGaAsSb Avalanche Photodiodes. Appl. Sci. 2025, 15, 12056. [Google Scholar] [CrossRef]
  33. Kim, I.I.; McArthur, B.; Korevaar, E.J. Comparison of Laser Beam Propagation at 785 nm and 1550 nm in Fog and Haze for Optical Wireless Communications. In Proceedings of the Optical Wireless Communications III; Korevaar, E.J., Ed.; SPIE: Boston, MA, USA, 2001; pp. 26–37. [Google Scholar] [CrossRef]
  34. World Meteorological Organization (WMO). Guide to Instruments and Methods of Observation, 2024th ed.; Technical Report WMO-No. 8; World Meteorological Organization (WMO): Geneva, Switzerland, 2024; Volume I. [Google Scholar] [CrossRef]
  35. Toplar, H.T.; Uysal, M. Modeling of Pointing Errors in Terrestrial FSO Links Caused by Building Sway Under Wind Loads. IEEE Open J. Commun. Soc. 2025, 6, 1161–1169. [Google Scholar] [CrossRef]
  36. Yasa, U.G.; Keskin, M.Z.; Figen, Z.G.; Lippert, E.; Fonnum, H. Measuring and Modeling the Influence of Atmospheric Turbulence on a 2-μm Laser Beam. In Proceedings of the Environmental Effects on Light Propagation and Adaptive Systems VI; Stein, K., Gladysz, S., Eds.; SPIE: Amsterdam, The Netherlands, 2023; p. 8. [Google Scholar] [CrossRef]
  37. Mukherjee, A.; Kar, S.; Kumar Jain, V. Analysis of Beam Wander Effect in High Turbulence for FSO Communication Link. IET Commun. 2018, 12, 2533–2537. [Google Scholar] [CrossRef]
  38. Gradkowski, K. Tolerances of the Alignment of Fibers to Photonic Integrated Circuits. Appl. Opt. 2024, 63, 8407. [Google Scholar] [CrossRef]
  39. Cai, W.; N’Doye, I.; Ooi, B.S.; Alouini, M.S.; Laleg-Kirati, T.M. Modeling and Experimental Study of The Vibration Effects in Urban Free-Space Optical Communication Systems. IEEE Photonics J. 2019, 11, 7906713. [Google Scholar] [CrossRef]
  40. Lim, D.; Kim, D.; Park, K.; Im, D.G.; Sup Ihn, Y. Highly-Enhanced Active Beam-Wander-Correction for Free-Space Quantum Communications. Opt. Express 2023, 31, 39981. [Google Scholar] [CrossRef]
  41. Motlagh, A.C.; Ahmadi, V.; Ghassemlooy, Z.; Abedi, K. The Effect of Atmospheric Turbulence on the Performance of the Free Space Optical Communications. In Proceedings of the 2008 6th International Symposium on Communication Systems, Networks and Digital Signal Processing, Graz, Austria, 23–25 July 2008; pp. 540–543. [Google Scholar] [CrossRef]
  42. Kahn, J.; Barry, J. Wireless Infrared Communications. Proc. IEEE 1997, 85, 265–298. [Google Scholar] [CrossRef]
Figure 1. FSOC scenarios in an urban environment, including inter-building links, unmanned aerial vehicle links, and a link via an intelligent reflecting surface (IRS) mounted on a building facade (created with Icograms).
Photonics 13 00525 g001
Figure 2. Model of a 4 × 4 mirror array functioning as an IRS mounted on a building facade, with all tiles pre-aligned at an angle α pre toward the receiver. This configuration highlights a key advantage of mirror arrays over a single mirror: For a given pre-alignment angle α pre , the mirror elements protrude less from the facade than an equivalently tilted single mirror surface.
Photonics 13 00525 g002
Figure 3. ZEMAX simulation of single-mode fiber coupling using the black box lens model of the large-beam collimator described in Section 5.1. (a) Blue rays are perfectly aligned with the optical axis whereas the green rays indicate an angular misalignment. (b) Coupling efficiency versus the incidence angle of the incoming beam (green). The red, dashed line indicates the angle Θ at an efficiency η of approximately 79 % .
Photonics 13 00525 g003
Figure 4. Sectional view of the tip-tilt mechanism for a single mirror element: (a) Static state, with the mirror element planar; (b) active state, where a change in actuator length induces tip-tilt motion (red arrow). Tilting can be actuated in two orthogonal directions. Seen from the top, the assembly forms an “L”, hence the designation L-configuration.
Photonics 13 00525 g004
Figure 6. Schematic of the PCB used to control 32 piezo actuators. The block Piezo 1–32 includes the piezo driver (Boréas, BOS1921) and the piezo stack itself. The schematic shows only the wiring to one piezo.
Photonics 13 00525 g006
Figure 7. Realized mirror array with PCB integrated in an enclosure for safe operation. The piezo actuators are connected to the PCB via a wire guide (orange part).
Photonics 13 00525 g007
Figure 8. Multipath propagation of rays 1, 2, 3, and 4. The mirror array from Figure 5b is shown in top view, with all tiles tilted by the same angle α . The dashed lines near w and v denote the normals to the wavefronts of the incoming and reflected beams, respectively. The blue lines indicate the optical paths v and w of the rays, which differ due to the lateral separation of the tiles.
Photonics 13 00525 g008
Figure 9. Schematic of the measurement setup. Left: Fiber-coupled segment including a broadband light source (BBS), single-mode fiber (SMF), Mach-Zehnder modulator (MZM), optical circulator (CIR), Erbium-doped fiber amplifier (EDFA), and photodetector (PD). Right: Free-space path incorporating a collimator (COL), mirror array (MA), and plane mirror (PM). To measure the frequency response, a vector network analyzer (VNA) is used.
Photonics 13 00525 g009
Figure 10. Laboratory measurement setup of the free-space part with additional blocking device (BD) for defining the configurations in Figure 11. The components described in Figure 9 are highlighted in purple.
Photonics 13 00525 g010
Figure 12. Measurement results (ad) for configurations I–IV, respectively (see Figure 11). The blue curve is the measured S 21 from the VNA; the orange curve is the simulated frequency response.
Photonics 13 00525 g012
Table 2. Simulation parameters for Configurations I–III (see Figure 11).
Configuration IConfiguration IIConfiguration III
θ in 18°18°18°
α 6.7°6.7°6.7°
p14.3 mm27.5 mm41 mm
A 2 0.90.90.3
Δ A 00.10
Δ S 21 −34 dB−55 dB−58.5 dB
Table 3. Simulation parameters for configurations IV (see Figure 11) as a superposition of Iterations for configurations I–III. The simulation parameters for Configuration I are used for Iterations 1, 2, and 3, whereas those for Configuration II are used for Iteration 4.
Iteration 1Iteration 2Iteration 3Iteration 4
θ in 18°18°18°18°
α 6.7°6.7°6.7°6.7°
p14.3 mm14.3 mm14.3 mm27.5 mm
A 2 0.90.90.90.2
Δ A 0000
Δ S 21 −43 dB
Table 4. Comparison of the calculated and simulated minima. The theoretical minima in the frequency domain are calculated with Equation (8) by converting the wavelength to frequency. The pitches p are set to the designed values 14 mm, 28 mm, and 42 mm for configurations I–III, respectively. The simulated minima are equivalent to the measured minima and are extracted from the plots in Figure 12.
Calculated MinimumSimulated/Measured Minimum
1.2.1.2.
Configuration I23.41 GHz70.24 GHz22.95 GHz
Configuration II11.71 GHz35.12 GHz11.92 GHz35.77 GHz
Configuration III 7.80 GHz23.41 GHz 8.37 GHz24.34 GHz
Configuration IV23.41 GHz70.24 GHz23.07 GHz
Disclaimer/Publisher’s Note: The statements, opinions and data contained in all publications are solely those of the individual author(s) and contributor(s) and not of MDPI and/or the editor(s). MDPI and/or the editor(s) disclaim responsibility for any injury to people or property resulting from any ideas, methods, instructions or products referred to in the content.