Article

Comparative Analysis of Relative Intensity Noise in DBR Single-Frequency Fiber Lasers with Different Output Power


1
Laser Fusion Research Center, China Academy of Engineering Physics, Mianyang 621900, China
2
Graduate School, China Academy of Engineering Physics, Beijing 100088, China
*
Author to whom correspondence should be addressed.
Photonics 2026, 13(5), 467; https://doi.org/10.3390/photonics13050467
Submission received: 8 April 2026 / Revised: 3 May 2026 / Accepted: 7 May 2026 / Published: 9 May 2026
(This article belongs to the Section Lasers, Light Sources and Sensors)

Abstract

Single-frequency fiber lasers (SFFLs) are essential for applications such as gravitational wave detection, high-precision spectroscopy, and inertial confinement fusion, requiring narrow linewidth, low noise, and high output power. Here, we present a comparative study of 1 μm waveband distributed Bragg reflector (DBR) SFFLs with varying cavity parameters. Numerically, we investigate the effects of key cavity parameters on laser performance by plotting contour maps of output power versus grating reflectivity and lasing wavelength. We also simulate intensity noise transfer functions from pump fluctuations. Increasing pump power shifts the relaxation oscillation peak to higher frequency and reduces its amplitude, which originates from the higher intracavity photon density that speeds up the damping of perturbations. Experimentally, we construct two lasers using 6.5 mm and 10.5 mm YDFs spliced between FBG pairs. These lasers employ low-reflectivity FBGs centered at 1053 nm and 1064 nm, with reflectivities of 74% and 55%, respectively. The corresponding maximum output powers are 29.7 mW and 197 mW. The 1053 nm SFFL exhibits a relative intensity noise (RIN) of −102 dBc/Hz at 2.07 MHz, a linewidth of 12.52 kHz, and a mode-hop-free tuning range of 0.64 nm. Although increasing the pump power suppresses the relaxation oscillation peak, it broadens the linewidth due to laser phase noise degradation caused by pump noise-induced temperature fluctuations in the gain fiber. For SFFLs, the output powers should be selected according to the specific application, as a higher output power inherently leads to a broader linewidth. These insights are essential for optimizing such lasers and underscore their strong potential for future applications.

1. Introduction

Single-frequency fiber lasers (SFFLs) are indispensable to precision high-end science [1], including optical communications [2], precision measurement [3], quantum technology [4], and atomic physics [5], due to their narrow linewidth, high coherence, low noise, and fiber compatibility. Furthermore, their essential role in gravitational wave detection has recently heightened their prominence [6]. SFFLs are also vital for inertial confinement fusion (ICF) laser drivers [7]. ICF requires compressing a fuel pellet with high-energy lasers to achieve fusion conditions [8,9], necessitating a stable, high-power, high-quality beam. SFFLs, with their excellent stability and beam quality, are ideal front-end seeds for ICF laser drivers. Compared to solid-state lasers, they offer higher efficiency, better thermal management, lower maintenance, and a superior signal-to-noise ratio. These advantages enable precise pulse shaping, which is important for optimizing fusion efficiency.
SFFLs can be classified into three main types based on their configuration and operating principles: distributed Bragg reflector (DBR) lasers [10], distributed feedback (DFB) lasers [11], and ring cavity lasers [12]. Ring cavity lasers are susceptible to mode instability because they are sensitive to external environmental perturbations. DFB lasers present fabrication challenges since they require direct grating inscription into the high-gain fiber, which leads to significant heating in the grating region [13,14]. In contrast, DBR lasers offer a more practical solution. They are constructed by splicing a section of doped fiber between two fiber Bragg gratings (FBGs). One is a broadband FBG, acting as a high-reflectivity (HR) rear cavity mirror, and the other is a narrowband FBG, serving as a low-reflectivity (LR) output coupler. The doped fiber, typically Yb3+-doped for operation in the 1 μm band, provides optical amplification. This architecture separates the active gain medium from the passive optical feedback components. It benefits from mature and reliable FBG fabrication techniques, making it ideal for ultrashort linear-cavity fiber lasers. Since only passive FBG pairs are required, the DBR configuration is both simpler and more robust compared to the DFB structure. This further enhances its suitability for high-performance fiber lasers.
The pursuit of higher power, lower noise, and broader tunability has been a key driver in advancing DBR SFFL technology, with progress closely linked to improvements in rare-earth-doped fibers. Meanwhile, early power-scaling demonstrations include the work by S. Xu et al. in 2011 [15]. They achieved a 400 mW single-frequency laser at 1064 nm using a Yb3+-doped phosphate fiber, where the cavity was formed by butt-coupling a narrowband FBG to a dielectric mirror. However, pronounced thermal effects arising under high pump power led to elevated noise levels and ultimately constrained further power scaling. In contrast, significant progress has been achieved in the suppression of intensity noise by employing ultrashort gain fibers as demonstrated by A.C. Wong and his colleagues [16]. They realized a 1.5 μm DBR laser based on a 0.04 cm Er-doped fiber with a relative intensity noise (RIN) of −107 dBc/Hz at 1 MHz, but this came at the expense of a severely limited output power of 2.6 μW. These representative studies illustrate the inherent trade-off between power scaling and noise suppression in DBR SFFLs. Regarding wavelength tunability, the tuning range of a DBR fiber laser is fundamentally governed by the spectral shift of the FBG. However, this range can be substantially extended. This is achieved by carefully controlling the spectral overlap between the longitudinal cavity mode and the reflection band of the FBG. This approach was recently demonstrated in a 2025 study by X. Liu et al. [17]. In their work, a 1053 nm DBR laser achieved a mode-hop-free tuning range of 1.375 nm through cavity length optimization combined with controlled strain application. Substantial progress has been reported in key areas such as high-power operation [15,18,19,20,21], low noise performance [16,22,23,24], and wide wavelength tuning [17,25,26,27]. However, simultaneously achieving all these performance metrics remains a central and ongoing challenge in the development of DBR SFFLs.
In this work, to achieve high output power as well as low intensity noise in DBR SFFLs, numerical investigations are carried out to elucidate the influence of key cavity parameters on laser performance. Contour maps of output power as functions of grating reflectivity and lasing wavelength are obtained for two different gain fiber lengths. We also numerically simulate the transfer functions for intensity noise that originates from pump power fluctuations. These intensity noise spectra are simulated for various operating conditions, including different pump sources, pump power levels, grating reflectivities, and gain fiber lengths. Under the constraint of maintaining stable single-longitudinal-mode operation, a design strategy is proposed. This strategy maximizes the gain fiber length while selecting an appropriate grating reflectivity, thereby enabling concurrent enhancement of output power and suppression of the relaxation oscillation peak. To experimentally verify the numerical predictions, two DBR fiber lasers incorporating 6.5 mm and 10.5 mm long gain fibers are constructed and comparatively investigated. Their operating wavelengths are set to 1053 nm and 1064 nm, respectively, as these represent two commonly used bands in the 1 μm waveband. At a pump power of 600 mW, the 1053 nm laser achieves a maximum output power of 29.7 mW, while the 1064 nm laser yields 197 mW under an 800 mW pump. Furthermore, intensity noise characterization of the 1053 nm laser revealed a relaxation oscillation peak of −102 dBc/Hz at 2.07 MHz under a pump power of 200 mW. Collectively, these findings establish a theoretical basis and offer practical design guidelines for the development of more efficient 1 μm SFFLs.

2. Simulation and Results

2.1. Simulation of Output Power

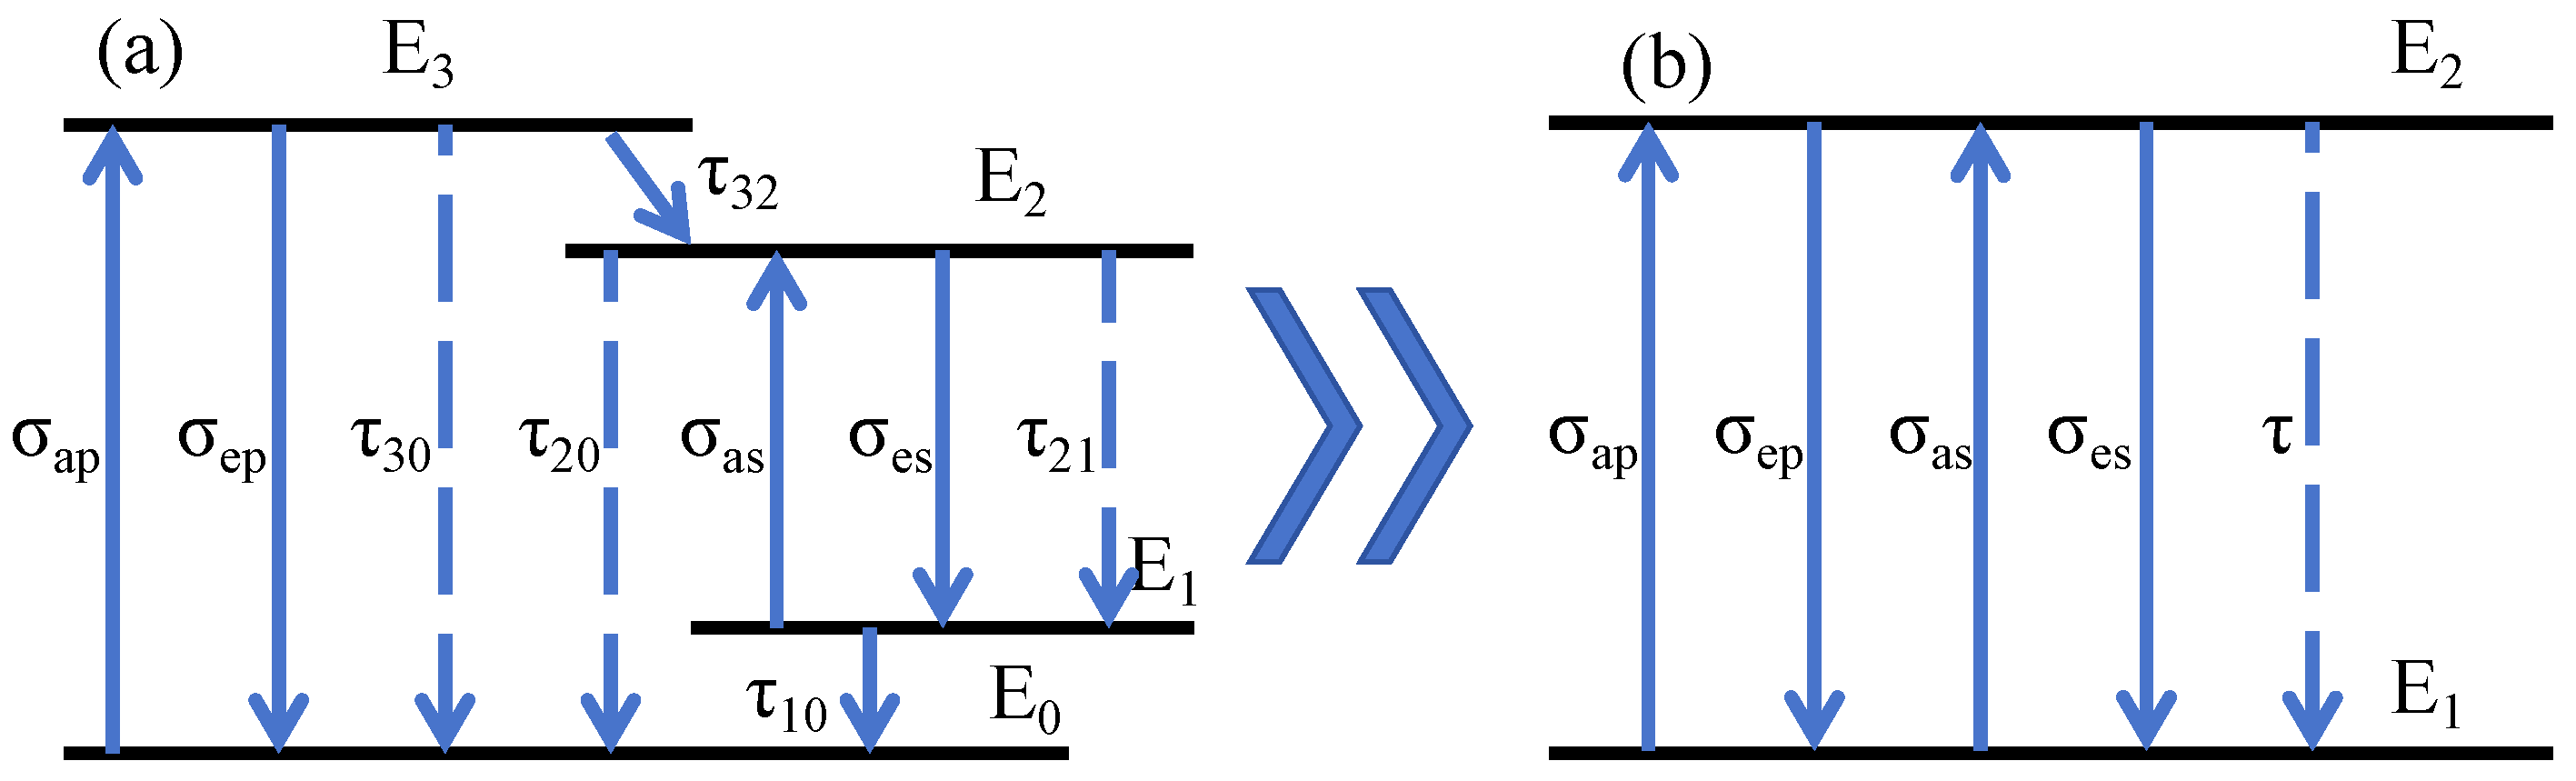
To investigate the influence of key cavity parameters—namely, gain fiber length and FBG reflectivity—on the performance of DBR SFFLs, we performed a series of numerical simulations. In this approach, Yb3+-doped fiber (YDF) lasers are modeled using a numerical framework based on rate equations and boundary conditions. This model allows for the simulation of the system at any point along the entire length of the YDF. The energy level structure of YDF is inherently linked to its operating wavelength. At 1053 nm, the laser operates as a four-level system [28,29], as shown in Figure 1a.
The ground state E0 and the lower laser level E1, as well as the excited state E3 and the upper laser level E2, arise from the Stark splitting of the 2F5/2 and 2F7/2 manifolds of Yb3+, respectively. The non-radiative transition rates between E3 and E2 and between E1 and E0 are much faster than the fluorescence lifetime of the upper level, making these transitions negligible. Consequently, the four-level system can be simplified to the two-level system shown in Figure 1b [30]. However, this two-level approximation ignores spectral hole burning and may fail under extremely high pump intensities or ultrashort pulse excitation. Within the moderate pump power and continuous-wave operation regime of this work, the approximation remains valid.
Figure 1. Energy level structure of Yb3+ ions. (a) Four-level system. (b) Two-level system. In these diagrams, σap and σep represent the absorption and emission cross-sections for the pump, while σas and σes correspond to those for the signal; τ denotes the fluorescence lifetime of the Yb3+ upper level [31,32].
Photonics 13 00467 g001
The model focuses on the longitudinal spatial profiles of the injected pump power Pp(z) and signal light Ps(z) within the fiber, accounting for factors such as the power overlap factor Γ and scattering loss α in the YDF. Consequently, the system’s rate equations for the two-level case [33] simplify to the following form:
d P p ± ( z ) d z = ± Γ p [ ( σ a p + σ e p ) N 2 ( z ) σ a p N 0 ] P p ± ( z ) α p P p ± ( z ) ,
d P s ± ( z ) d z = ± Γ s [ ( σ a s + σ e s ) N 2 ( z ) σ a s N 0 ] P s ± ( z ) α s P s ± ( z ) ,
where N2 is the population density of the upper laser level, and N0 is the concentration of Yb3+.
For the DBR single-frequency laser cavity with a backward-pumping configuration (pump injected from the LR FBG end), the signal light oscillates between the reflecting FBGs while the pump light transmits through them. Considering the signal loss at the splice points between the doped gain fiber and the FBGs, and defining the HR FBG end as the position z = 0, the boundary conditions for the doped gain fiber of length L are given as follows:
P p + ( 0 ) = 0 ,
P p ( L ) = P 0 × ( 1 α s p l i c e t ) ,
P s + ( 0 ) = R H P s ( 0 ) × ( 1 α s p l i c e t ) 2 ,
P s ( L ) = R L P s + ( L ) × ( 1 α s p l i c e t ) 2 ,
where P0 is the incident pump power, αsplicet denotes the splicing loss between the FBG and YDF, and RH and RL represent the power reflectivities of HR and LR FBGs, respectively.
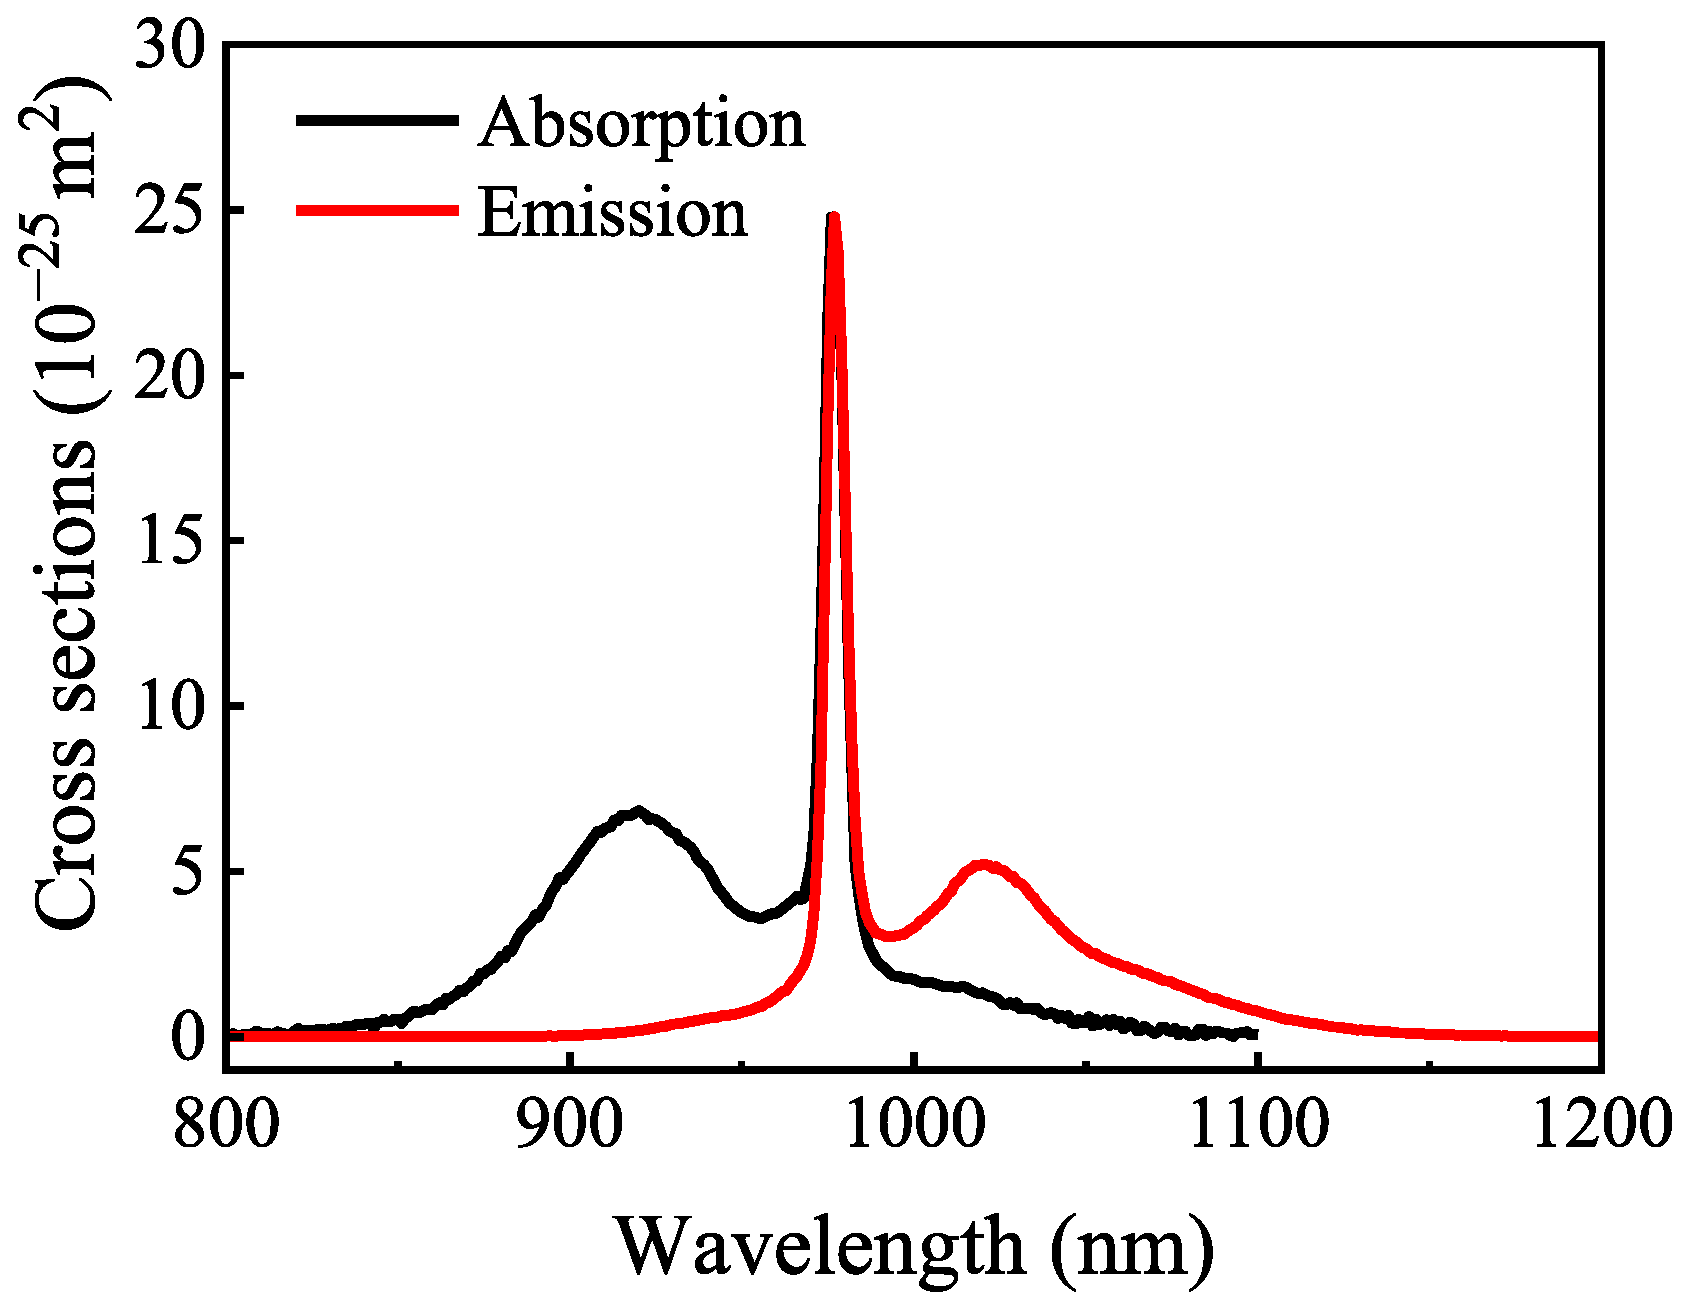
To investigate how the length of the YDF and the reflectivity of the LR FBG affect the output power of DBR SFFLs, we first performed simulations by varying these two parameters jointly. The parameters used in this model are summarized in Table 1. The absorption and emission cross-sections of the YDF are shown in Figure 2. We obtained the absorption coefficient and the emission coefficient of the YDF from the fiber manufacturer. Then, using these coefficients together with the Yb3+ doping concentration N0, we calculated both the absorption and the emission cross-section with the formula given as follows:
σ λ = c o e f f i c i e n t ( λ ) / N 0 ,
The resulting cross-sections serve as key input parameters for Equations (1) and (2) in our numerical simulations.
The large peak near 976 nm corresponds to the main absorption band of Yb3+ ions. A laser at this wavelength suffers from severe reabsorption due to the small energy gap between the ground and excited states [34]. Therefore, we operate the laser above 1000 nm, where the emission cross-section remains sufficiently high and reabsorption is much weaker.
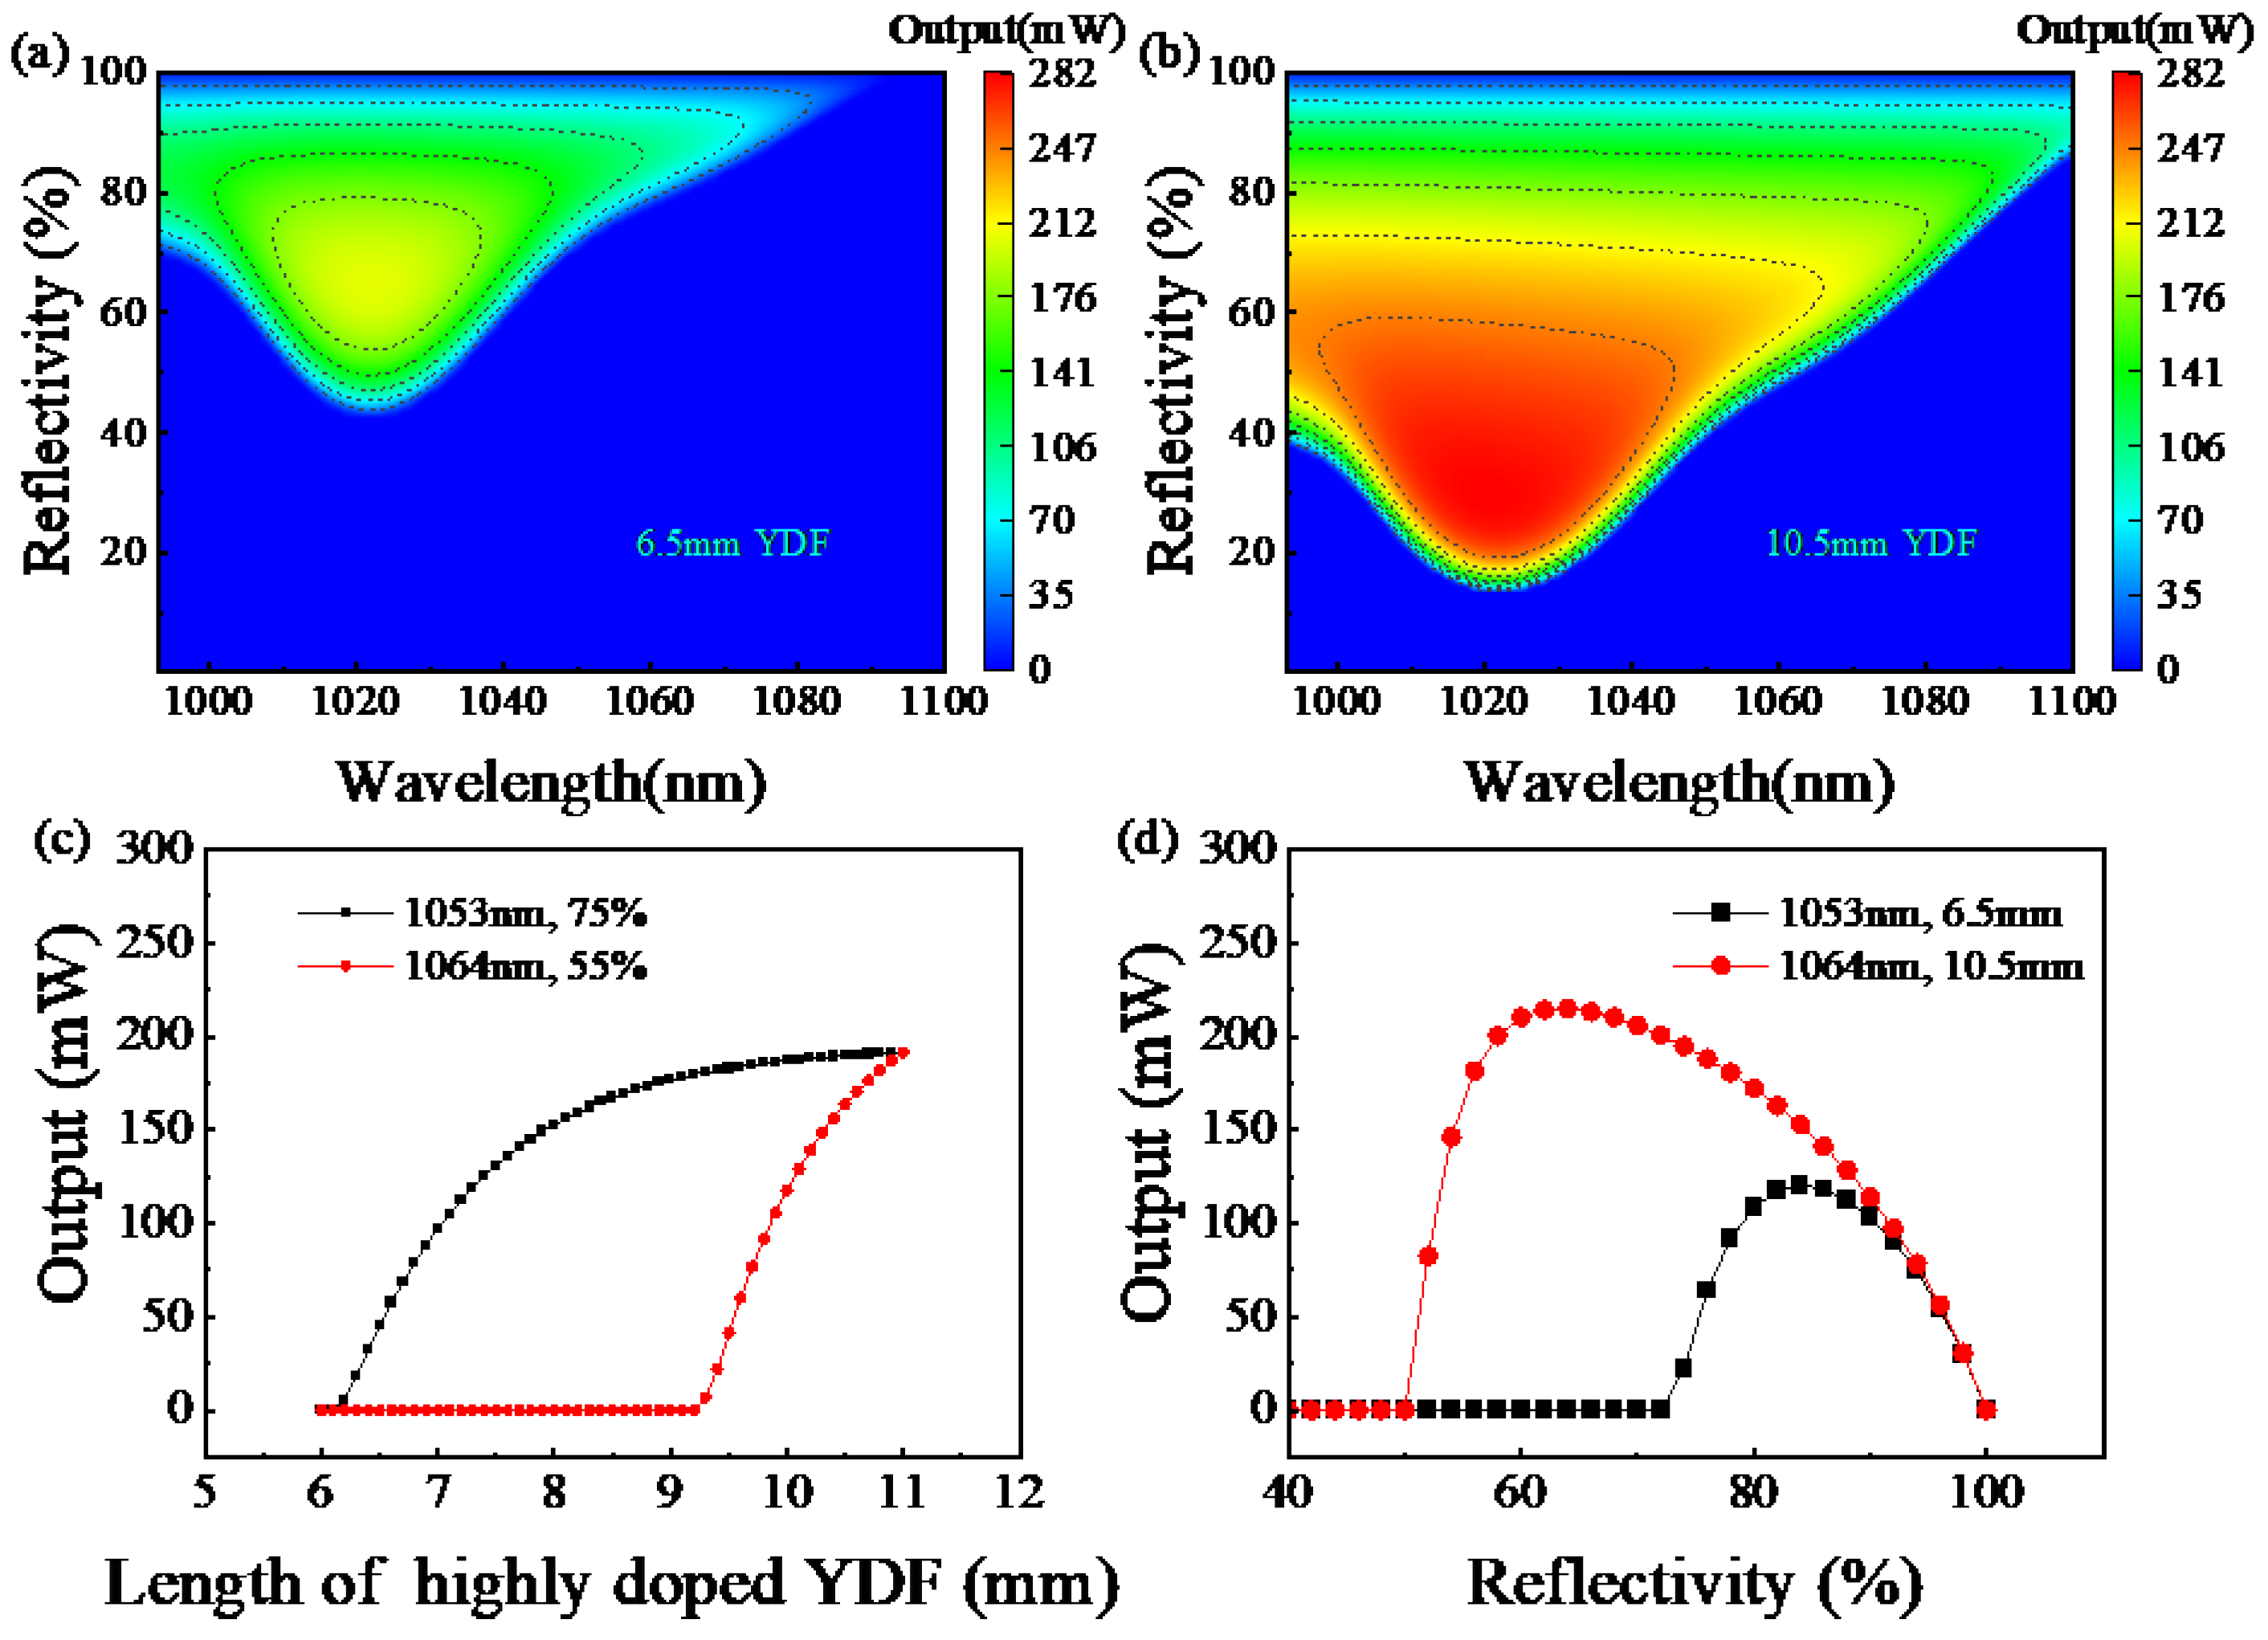
Figure 3a presents a contour plot of the output power for the 6.5 mm Yb3+-doped DBR SFFL as a function of both operating wavelength and LR FBG reflectivity. It is evident that, by selecting an appropriate LR FBG reflectivity, a single-frequency output power exceeding 100 mW can be achieved over a broad wavelength range from 993 nm to 1060 nm. In particular, due to the larger emission cross-section in the 1010–1030 nm range, the output power within this band exceeds 150 mW. As shown in Figure 3b, using the 10.5 mm fiber further enhances performance. It increases output power, expands the high-power operational region, and lowers the reflectivity threshold for lasing compared to the 6.5 mm fiber.
The output power as a function of YDF length is calculated at a fixed pump power of 600 mW for two different LR-FBGs: one centered at 1053 nm with 75% reflectivity, and the other centered at 1064 nm with 55% reflectivity. The results are plotted in Figure 3c as two corresponding curves. The simulation results indicate that the maximum output power of approximately 200 mW can be obtained for a 1053 nm DBR SFFL using YDF with an LR FBG reflectivity of 75%. No signal output was observed when the YDF length was below 6.1 mm, suggesting a gain threshold length of 6.1 mm for sustaining oscillation in the laser cavity. The 1064 nm cavity (with 55% reflectivity) shows a gain threshold length at 9.2 mm, with rapid power growth beyond this point. Its output power matches that of the 1053 nm cavity (with 75% reflectivity) at 11 mm, without saturation, suggesting further potential for power scaling. It should be noted that the performance of other parameter combinations (e.g., 1053 nm with 55% reflectivity or 6.5 mm fiber at 1064 nm) can be readily evaluated from the contour plots in Figure 3a,b. As shown in Figure 3c, higher reflectivity results in a lower gain threshold length and a lower saturation power, whereas lower reflectivity yields a higher threshold but a greater saturation power.
The simulation results for the YDF lengths of 6.5 mm and 10.5 mm with different LR FBG reflectivities are presented in Figure 3d. As the YDF length increases from 6.5 mm to 10.5 mm, the maximum achievable output power increases from 120 mW to 214 mW across varying LR FBG reflectivities. Meanwhile, the reflectivity threshold required to achieve signal output decreases from 72% to 50%. For both fiber lengths, the grating reflectivities that yields the maximum output power are found to be 84% and 64%, respectively.

2.2. Simulation of Relaxation Oscillation

To evaluate potential improvements in the intensity noise performance of the 1053 nm DBR SFFL, we numerically simulate the YDF-based DBR SFFL using a model that describes the system’s relative intensity noise (RIN). The key parameters employed in this model are also summarized in Table 1.
Let the pump absorption, signal absorption, and signal emission rates be denoted as Wp, WA, and WE, respectively. The rate equations governing the fractional excited ion density Δn and the cavity signal photon density ϕ are then expressed as follows [35]:
d Δ n d t = ( 1 Δ n ) ( W p + W A ) Δ n ( W E + 1 τ ) ,
d ϕ d t = W E N 0 Δ n ( 1 Δ n ) W A N 0 ϕ τ c ,
where τc is the lifetime of intracavity photons.
The intensity noise of the fiber laser is assumed to originate from small perturbations in the pump source power and the intracavity loss, both of which fluctuate around their steady-state values. By employing the first-order perturbation approximation and applying a Fourier transform, the transfer functions for pump power fluctuations, Hp(f), and intracavity loss fluctuations, H1(f), are derived. The resulting RIN is then given by:
R I N ( f ) = H P ( f ) 2 S δ W p W p 0 2 + H 1 ( f ) 2 S δ γ γ 0 2 ,
where SδWp and Sδγ represent the power spectral densities of pump and loss perturbations, respectively, while Wp0 and γ0 denote the average pump power and the steady-state intracavity loss. Using this formulation, the RIN for different DBR cavity configurations can be numerically simulated and analyzed.
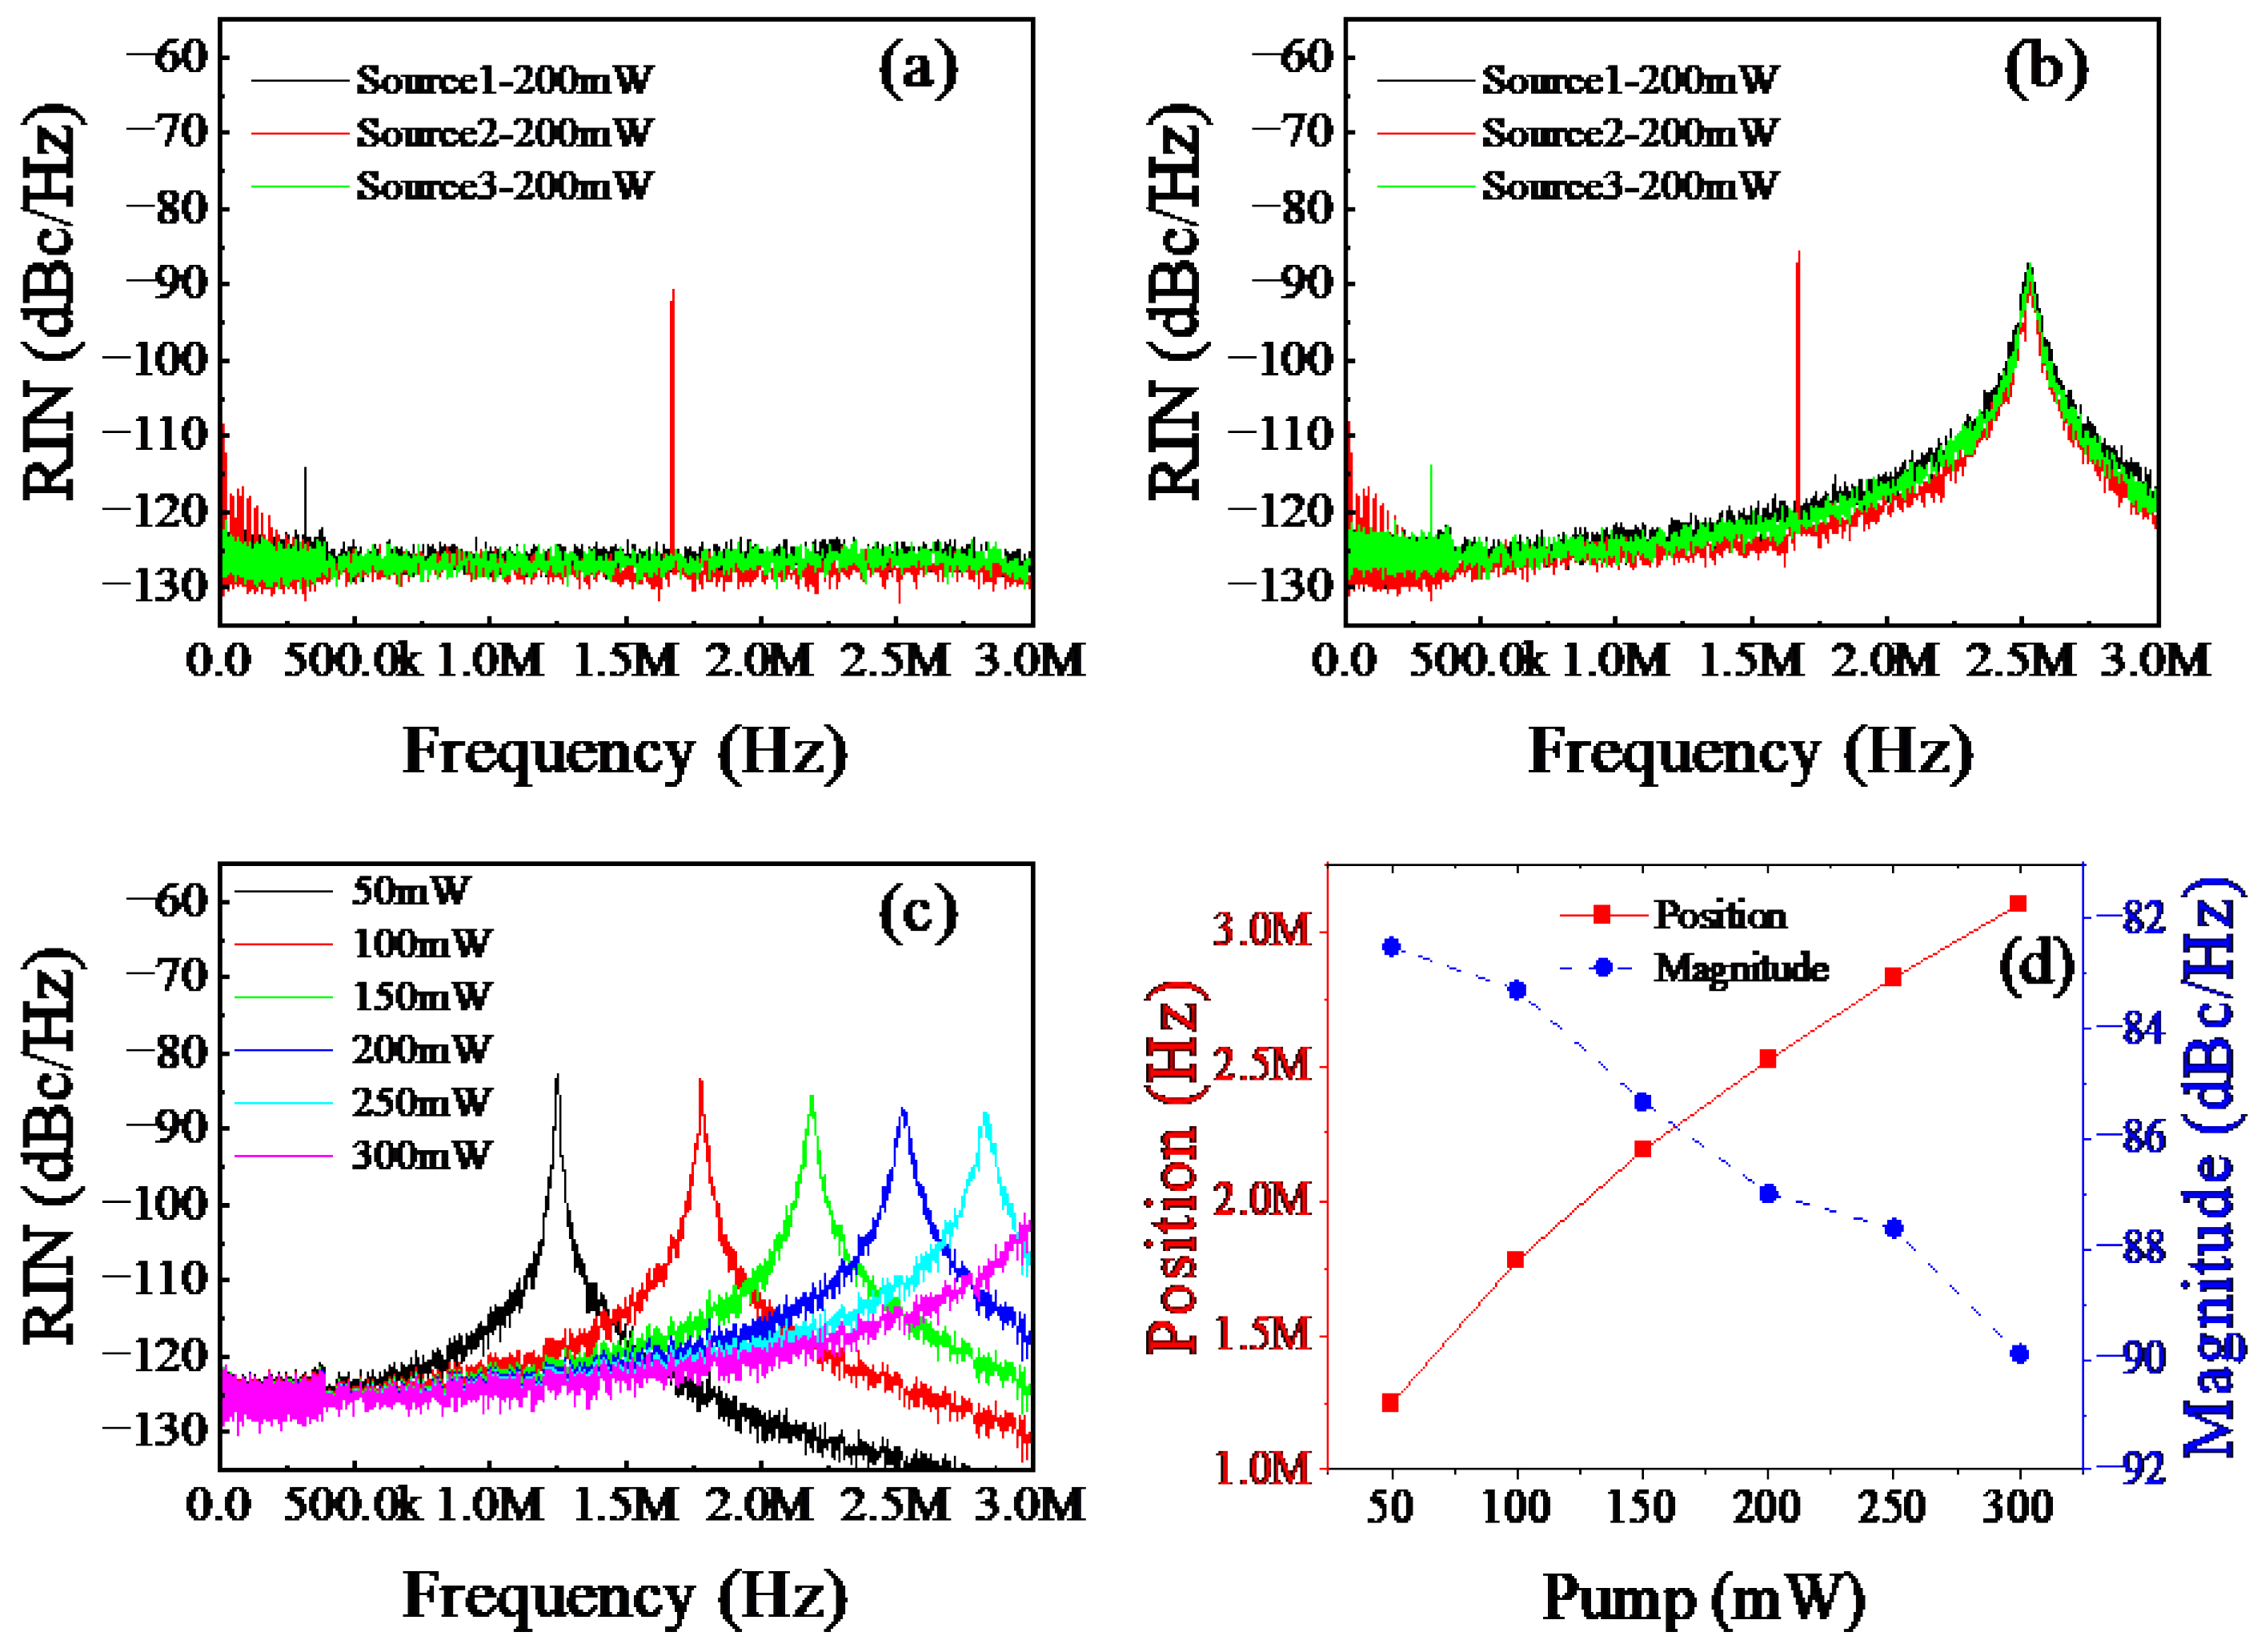
Figure 4 presents the results obtained with a gain fiber length of 6.5 mm and an LR FBG reflectivity of 74%. Figure 4a displays the measured RIN spectra of three different commercial pump sources. Based on these measurements, the corresponding RIN spectra in the laser are simulated, with the results shown in Figure 4b. It can be observed that Source1 and Source3 exhibit similar noise floors. Although the average noise level of Source2 is lower, its spectrum is characterized by multiple sharp peaks at specific frequencies. These spikes are referred to as discrete spectral spikes, which may originate from the switching ripple harmonics in pump drive circuits. For example, a spike near 1.6 MHz appears for Source2, and spikes around 300 kHz appear for Source1 and Source3. These spikes are different for different pump sources. Figure 4c displays the RIN spectra obtained by coupling the Source3 at different power levels. It is observed that as the pump power increases, the relaxation oscillation peak shifts toward higher frequencies while its magnitude diminishes. Figure 4d further shows this trend. A higher pump power leads to a faster stimulated emission rate. As a result, any perturbation in the population inversion or photon density is pulled back to equilibrium more quickly. This faster response shifts the relaxation oscillation peak to a higher frequency and makes the oscillation decay more rapidly. The increased damping reduces its amplitude, similar to the behavior of a high-damping RLC circuit.
The significant impact of pump characteristics on the laser’s intensity noise is demonstrated through this series of simulations on pump coupling. Although the lowest RIN floor is achieved with Source2, its spectrum is contaminated by multiple spurious peaks induced by electrical interference. In comparison, Source3 yields a consistently low RIN level over a broad frequency range, free from significant electrical noise peaks. Given the superior cleanliness of its RIN spectrum, Source3 at a pump power of 200 mW is therefore selected for all subsequent simulations.
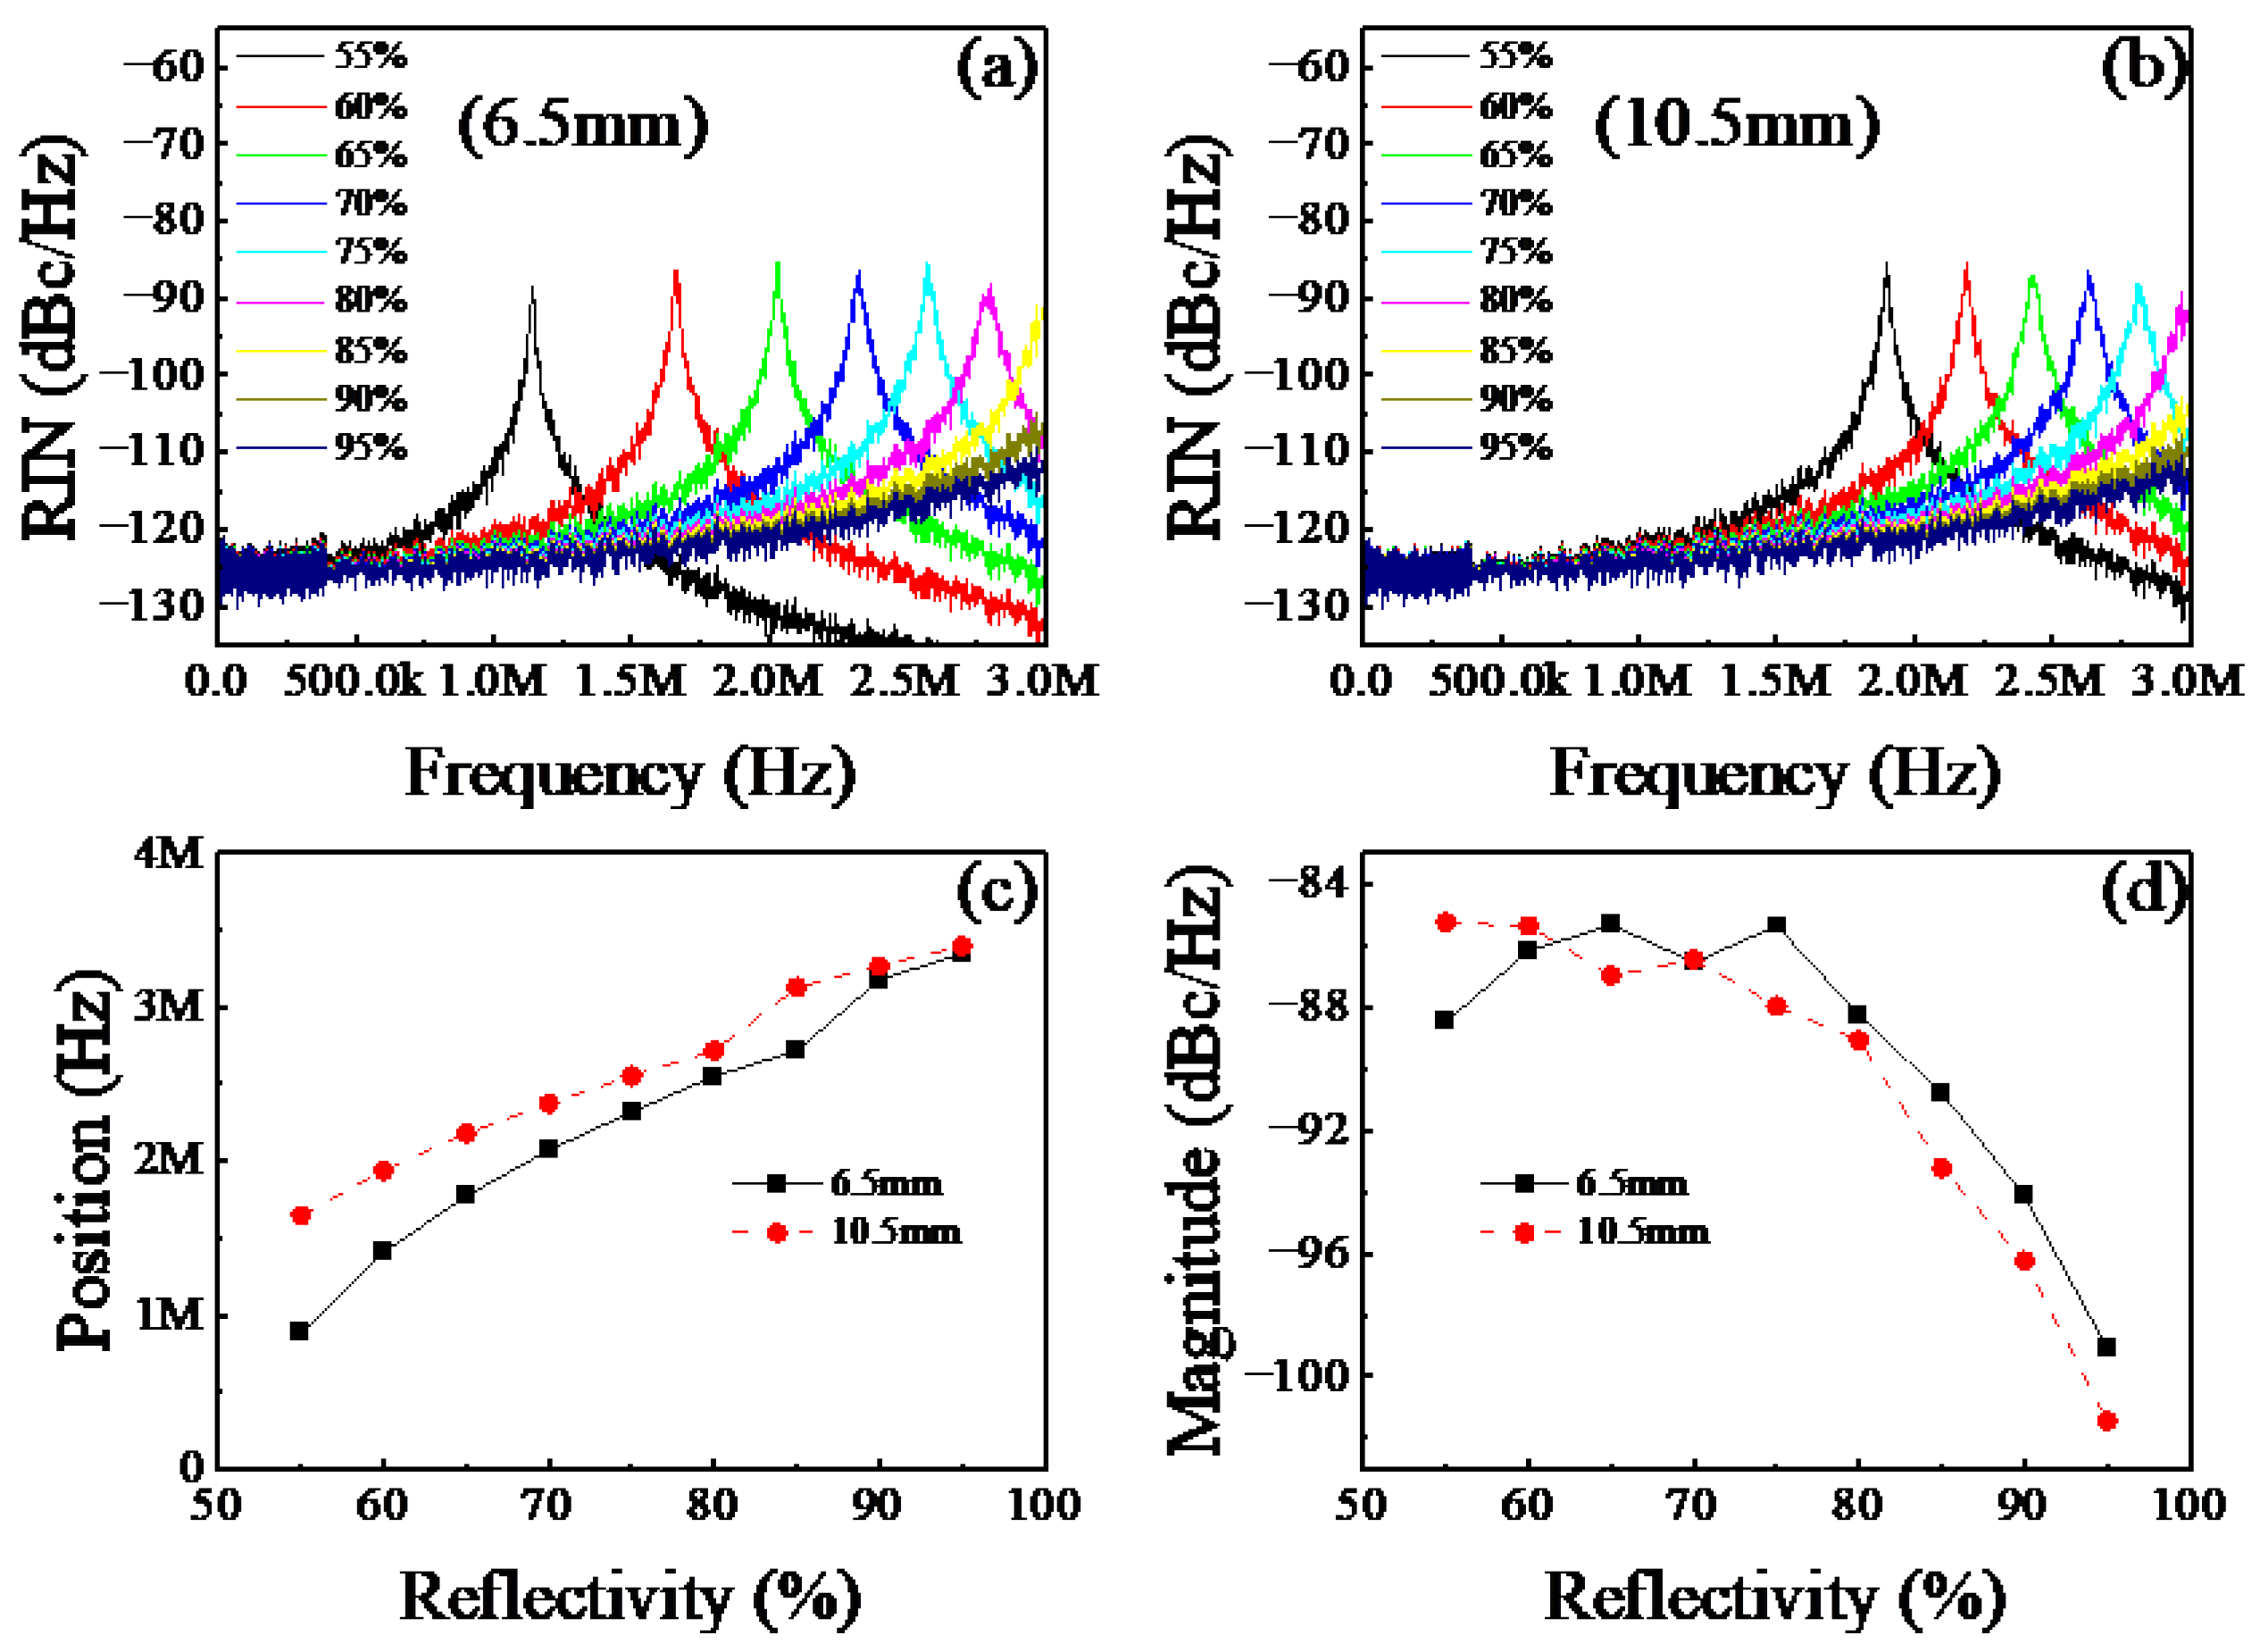
The RIN spectrum as a function of LR FBG reflectivity is calculated for DBR laser cavities incorporating 6.5 mm and 10.5 mm YDFs, with the results shown in Figure 5a and Figure 5b, respectively. A consistent trend is observed across all gain fiber lengths: increasing the LR FBG reflectivity causes the relaxation oscillation peak to shift toward higher frequencies, with minimal change in its magnitude. The specific quantitative dependencies of the peak position and magnitude on the reflectivity are plotted in Figure 5c and Figure 5d, respectively. The relaxation oscillation frequency exhibits a clear dependence on both fiber length and reflectivity. While longer fibers initially produce peaks at higher frequencies, this length-dependent disparity diminishes with increasing reflectivity, resulting in the convergence of all curves at high reflectivities. Conversely, the peak magnitude exhibits a two-stage dependence on reflectivity. It remains relatively constant between 55% and 75%, and then decreases sharply beyond 75%, with the magnitude reduction being more pronounced for longer fibers. The underlying mechanisms for these trends are complex and interrelated. The primary cause is attributed to changes in grating reflectivity, which induce two main effects: first, a direct variation in intracavity loss, and second, a shift in the effective cavity length of the grating itself. This shift alters the overall resonator length, thereby influencing the intracavity photon lifetime and ultimately driving the observed changes in the RIN spectrum. For practical implementation, increasing the grating reflectivity proves advantageous, as the laser exhibits superior RIN performance at higher reflectivities. Furthermore, a longer gain fiber can be employed, provided that single-longitudinal-mode operation is maintained. This combination of higher reflectivity and optimized fiber length facilitates the achievement of a lower overall intensity noise level.

3. Experimental Setup and Results

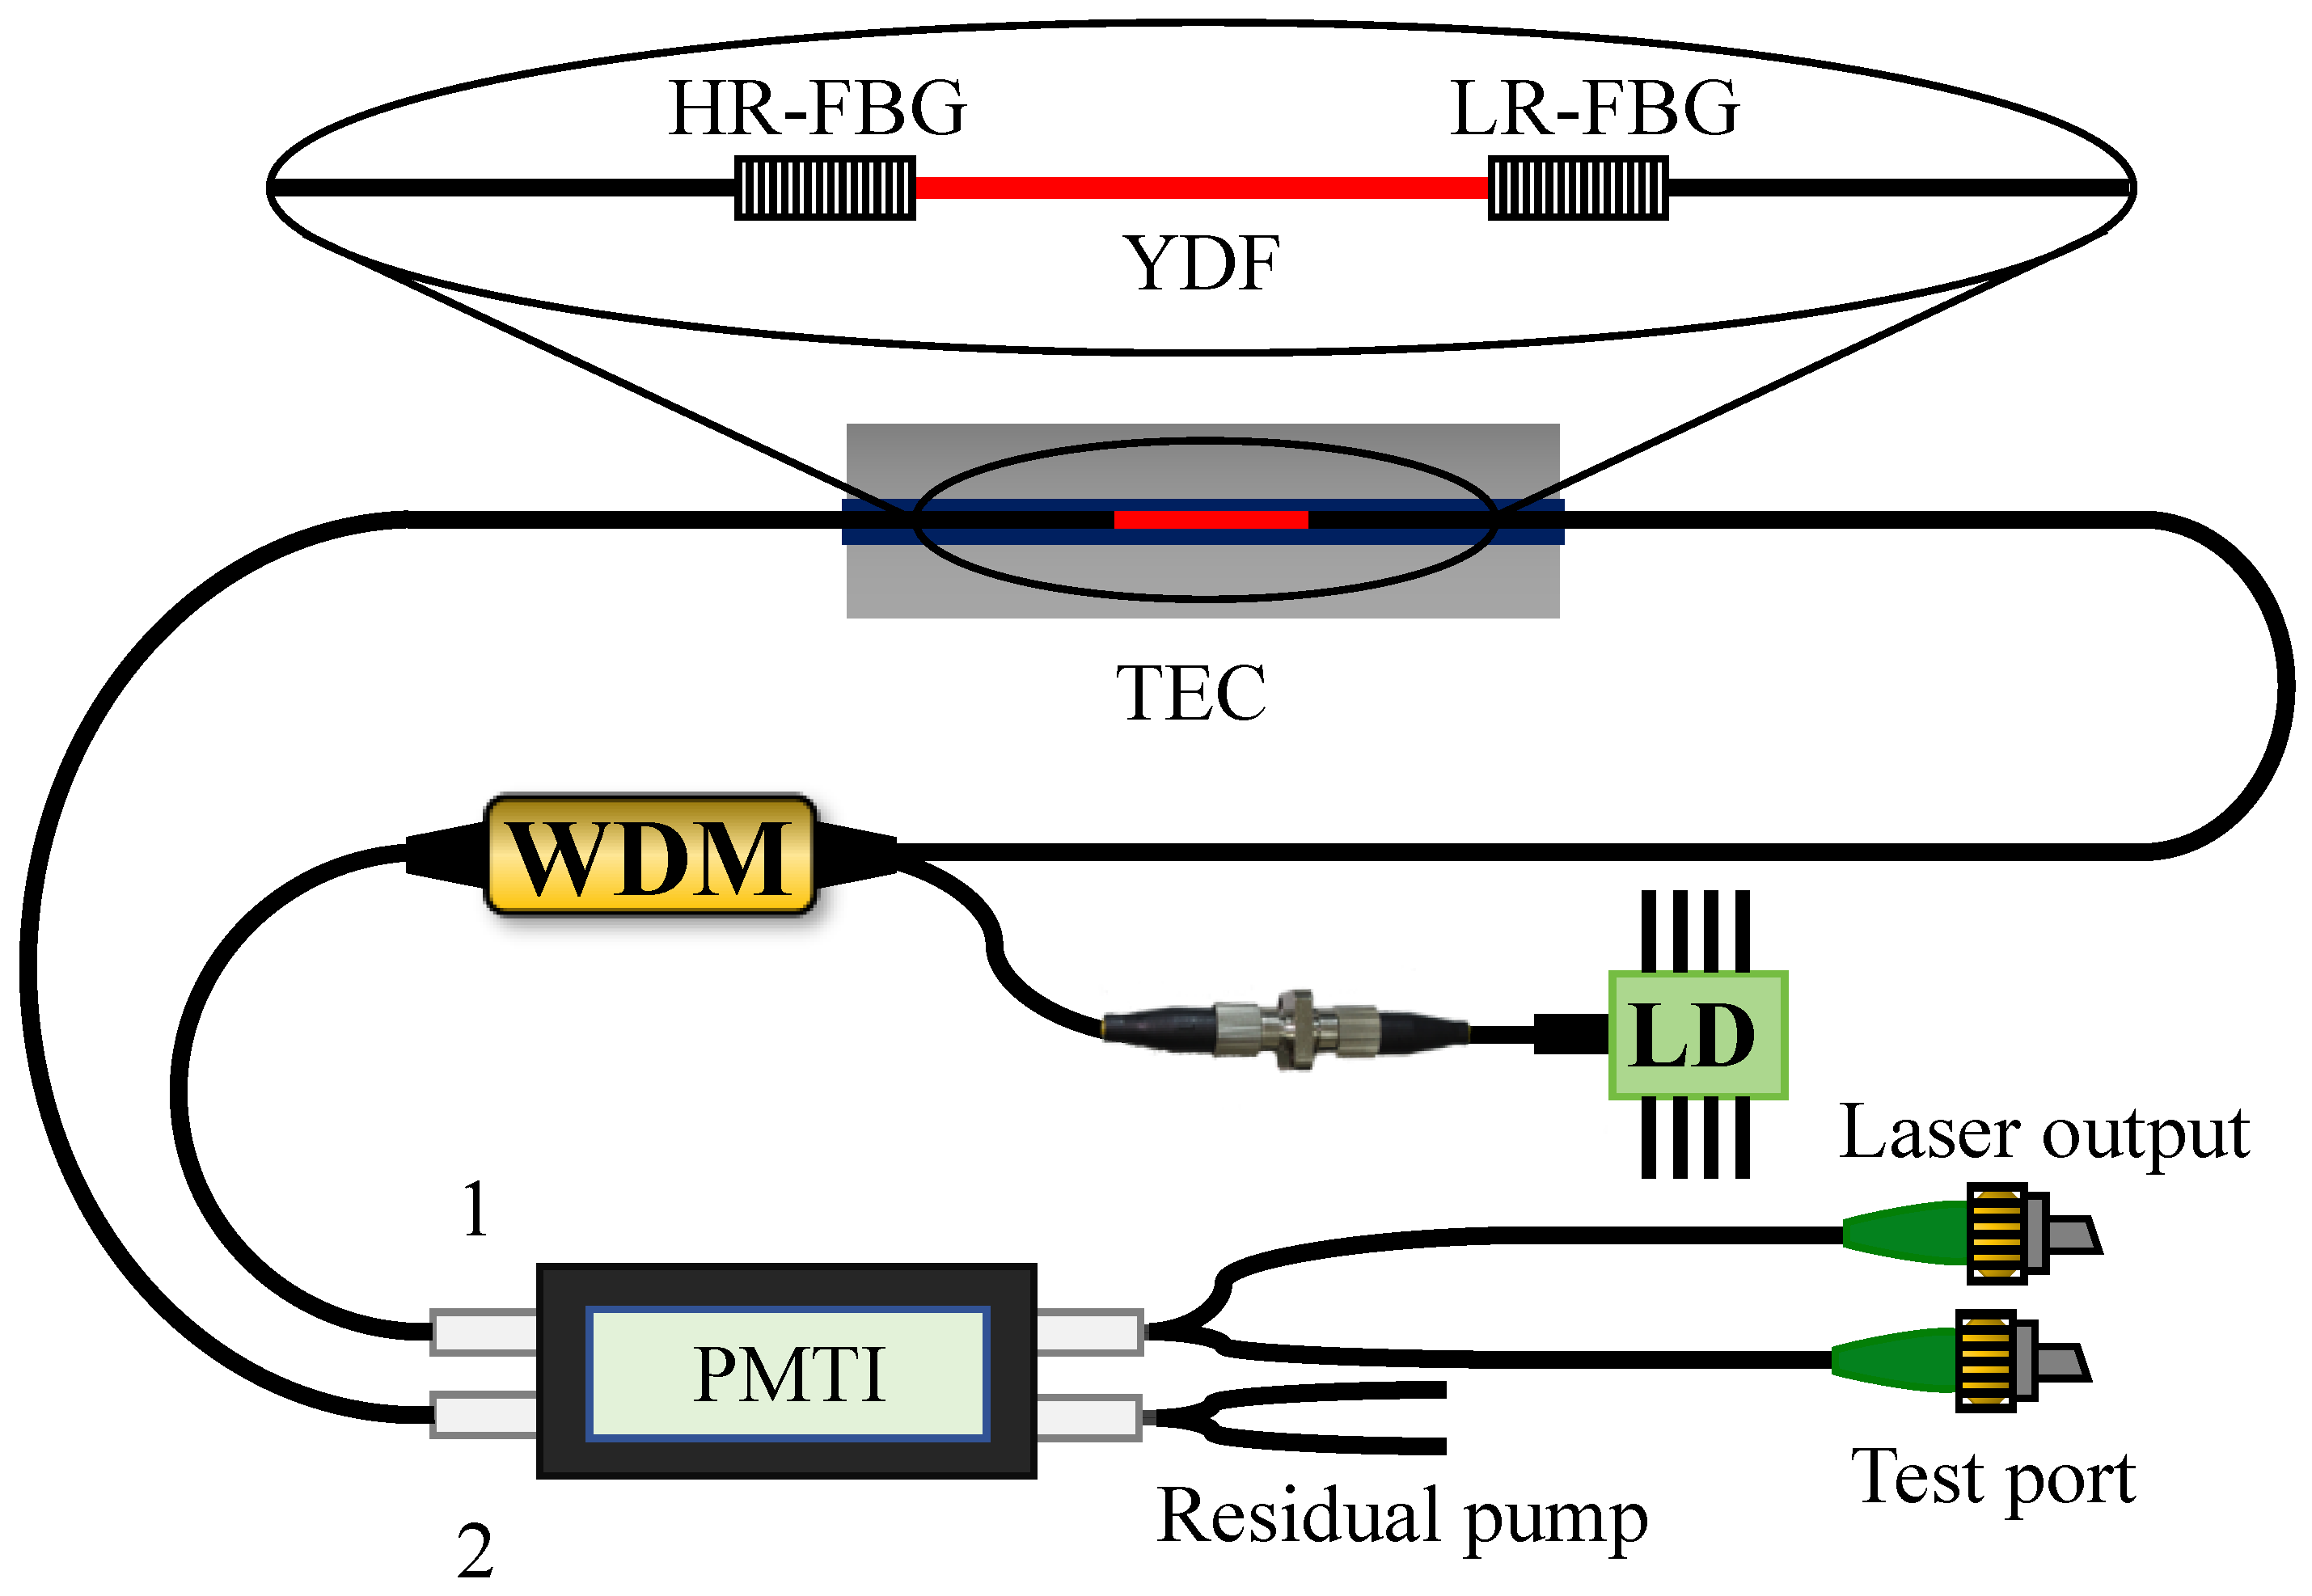
Ensuring stable single-longitudinal-mode operation is essential in DBR cavities. Generally, single-mode operation can be achieved when the 3 dB bandwidth ΔνB of the narrowband grating is less than twice the longitudinal mode spacing Δνq [25]. The Δνq is inversely proportional to the cavity length. Based on this criterion, the configuration of the 1053 nm DBR SFFL is shown in Figure 6. The DBR cavity is constructed by splicing a 6.5 mm long YDF to a pair of FBGs. The absorption coefficient of the YDF at 975 nm is approximately 2400 dB/m. The calculated mode field diameter (MFD) at 1060 nm is 4.9 µm, with a cladding diameter of 125 µm, and the core numerical aperture (NA) is 0.17. The FBG pair for the DBR laser consists of an HR FBG written in a non-polarization-maintaining (non-PM) passive fiber (Hi1060), which serves as the laser cavity mirror, and an LR FBG written in a polarization-maintaining (PM) passive fiber (PM980), which acts as the output coupler. The HR FBG has a reflectivity of 99.7% and a 3 dB bandwidth of 0.23 nm, while the LR FBG has a reflectivity of 74% and a 3 dB bandwidth of 0.045 nm. This reflectivity value is chosen based on the simulation results shown in Figure 3d. Considering the availability of FBGs in our laboratory, we select a reflectivity that gives a reasonably high output power. Due to the birefringence of the PM980 fiber, the LR FBG exhibits two reflection peaks, separated by 0.28 nm. Since the 3 dB reflection bandwidth of the HR FBG is slightly narrower than the separation between the reflection peaks of the birefringent LR FBG, stable single-polarization operation can be achieved. This is because only one reflection peak of the LR FBG falls within the reflection band of the HR FBG, and the mismatch between the reflection peaks of the HR FBG and LR FBG is minimal. As shown in Figure 6, a dual-channel polarization-maintaining tap isolator (PMTI) is spliced to the end of the HR FBG and the output port of the wavelength division multiplexer (WDM) to protect the cavity from the interference of back-reflected light. It also serves to split the output signal into the main output and a test port. The entire laser cavity is mounted on an aluminum plate and covered with a thermal pad to enhance heat dissipation. To achieve stable single-frequency operation, the temperature of the fiber laser cavity is actively controlled using a high-resolution temperature controller. A comparative cavity, incorporating a 10.5 mm YDF and 1064 nm FBGs (LR: 0.038 nm, 55%; HR: 0.22 nm, 99.2%), is also constructed for comparison.
To ensure single-longitudinal-mode operation, the length of the YDF must be appropriately chosen. For the 1053 nm and 1064 nm lasers, the 3 dB bandwidths of LR FBGs are 0.045 nm and 0.038 nm, respectively. The largest effective cavity length is inversely proportional to 3 dB bandwidths of LR FBGs. Therefore, according to the simulation results, the YDF lengths of 1053 nm and 1064 nm lasers are calculated and chosen to be 6.5 mm and 10.5 mm, respectively.
Three commercial laser diode pumps are integrated into the setup via a shared optical flange, providing a maximum available pump power of 350 mW, 600 mW, and 300 mW, respectively. This configuration facilitates easy interchange of the pumps through simple disconnection and reconnection procedures. A polarization-maintaining 1030/980 nm WDM is employed to couple the pump light into the fiber laser cavity, simultaneously protecting the pump diodes from backward amplified spontaneous emission (ASE).
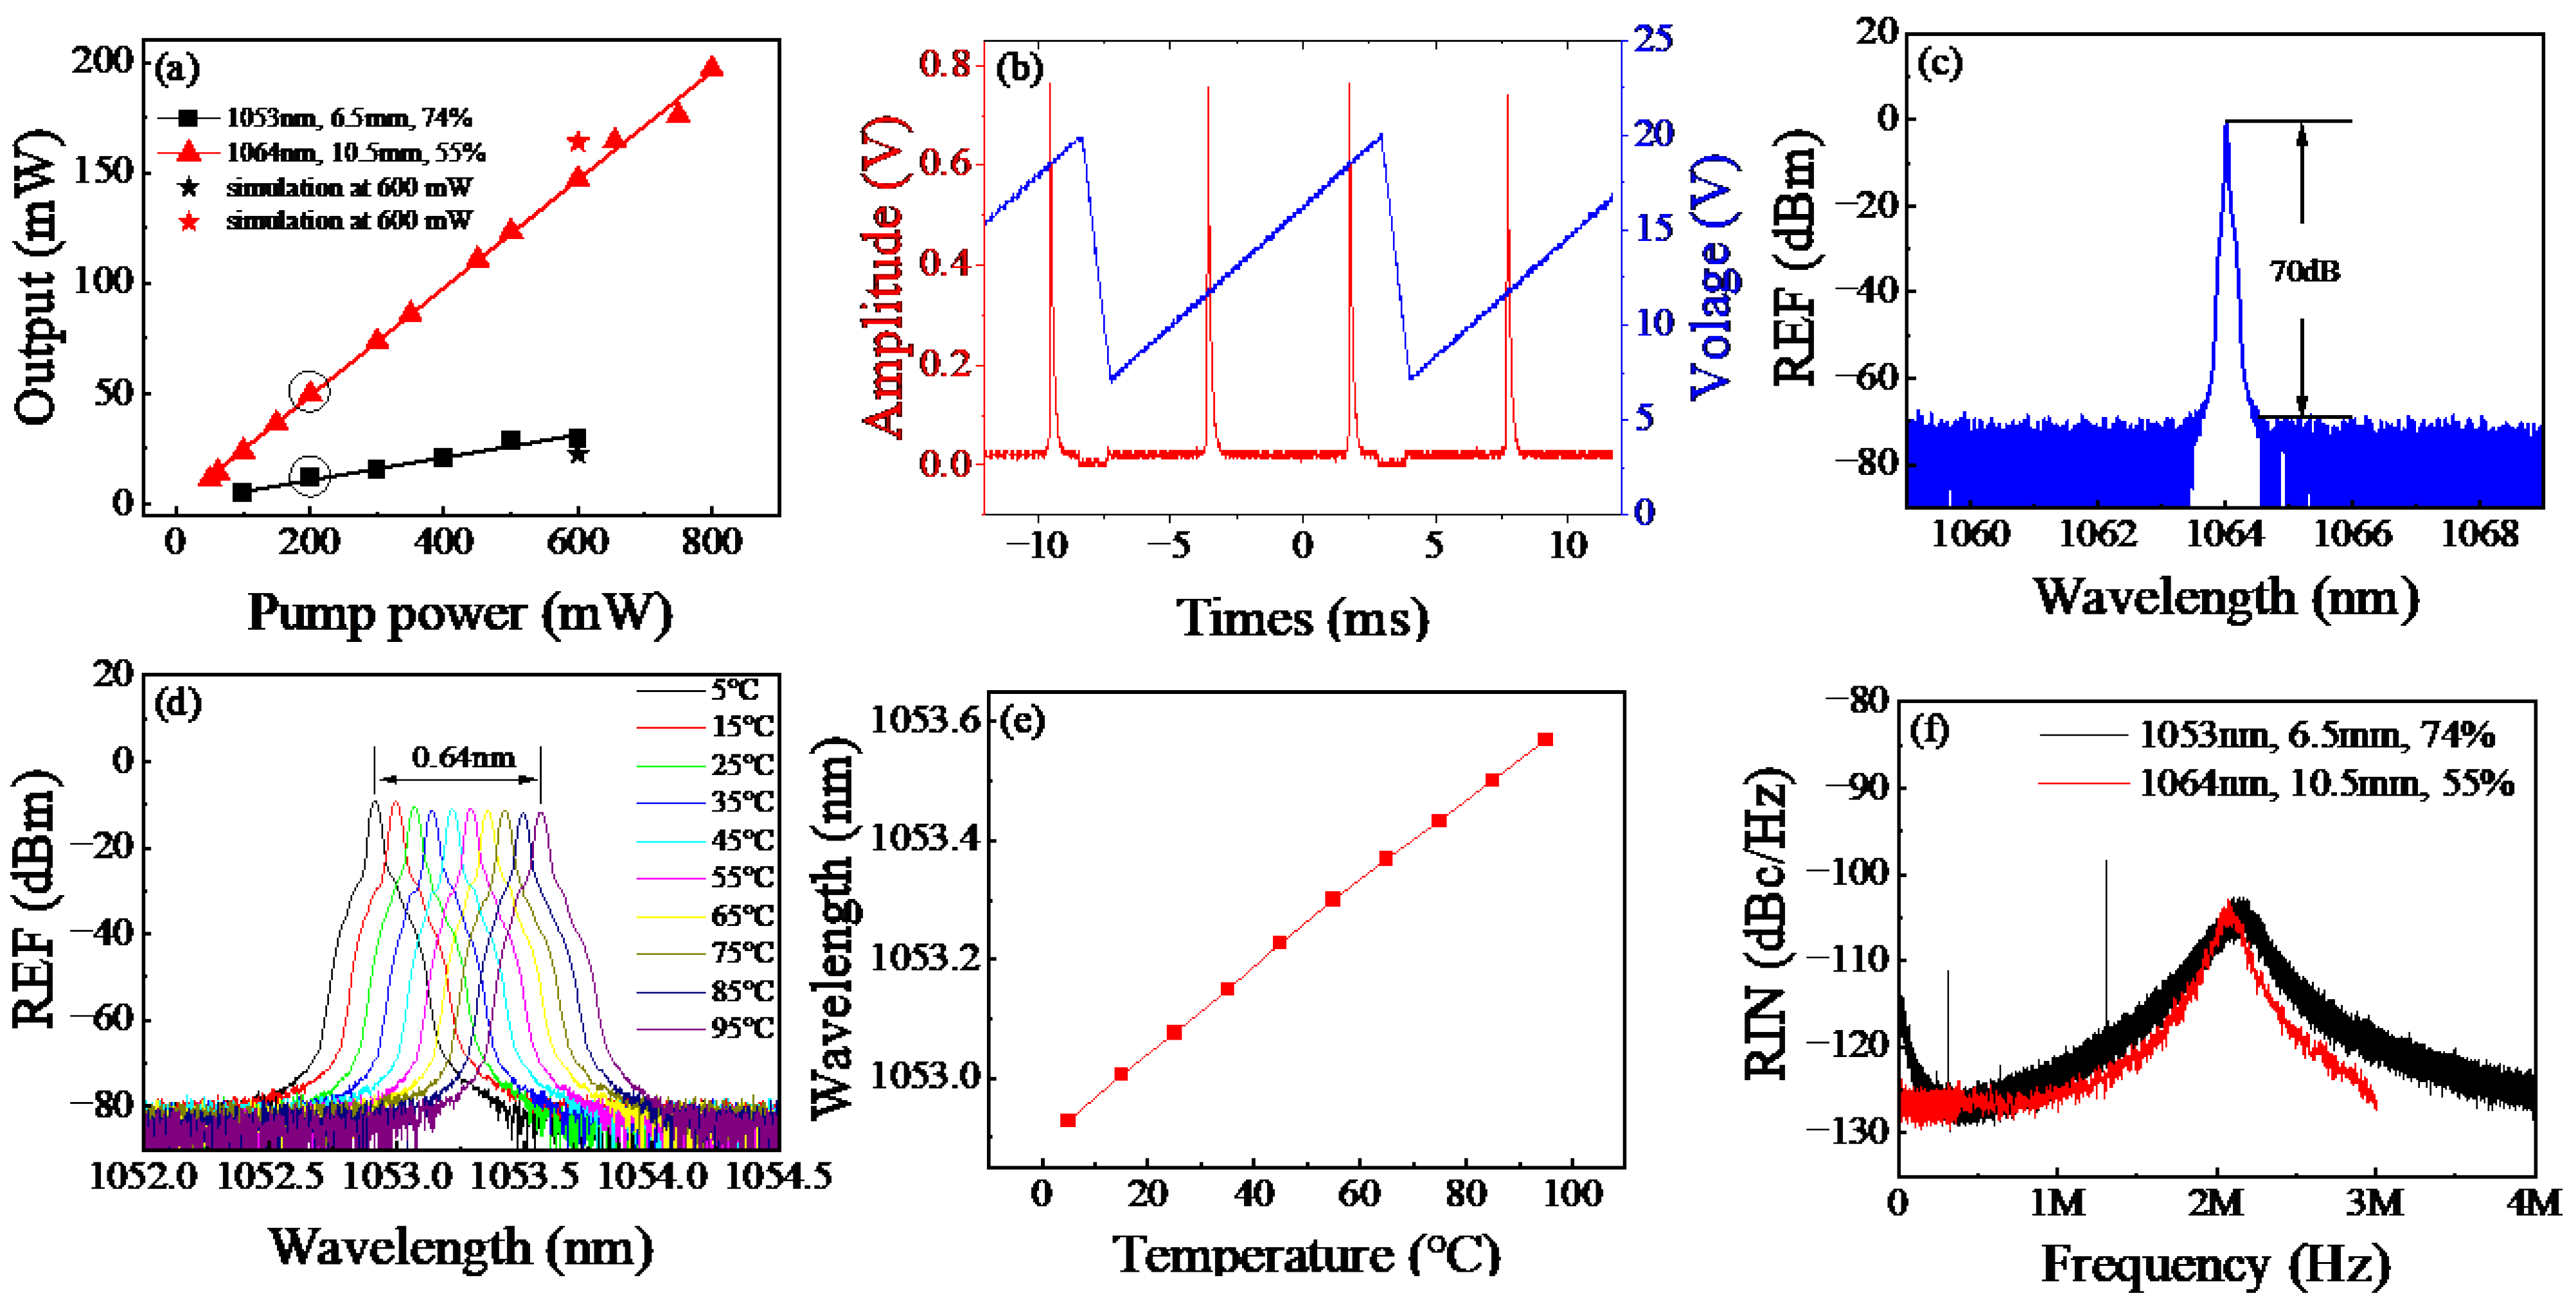
The output power of the 1053 nm DBR SFFL was measured using a power meter, and the results are shown as a function of launched pump power in Figure 7a (black squares). For comparison, the corresponding data for the 1064 nm DBR laser with a 10.5 mm YDF are also presented (red triangles). Additionally, simulation results at a pump power of 600 mW are overlaid on the same figure: the simulated output power for the 1053 nm laser is 22.47 mW (black star), and for the 1064 nm laser it is 163.85 mW (red star). Both lasers exhibit a low pump threshold of only 5 mW, which is attributed to the low splice loss of the cavity and the high gain coefficient of the heavily doped YDF. For the 1053 nm laser (6.5 mm YDF), a maximum output power of 29.7 mW is achieved at a launched pump power of 600 mW, corresponding to a slope efficiency of 5.12% (derived from curve fitting). The simulated value (22.47 mW) is within 24% of the experimental result, capturing the overall trend despite minor discrepancies likely due to uncertainties in fiber parameters (e.g., doping concentration, splice loss). For the 1064 nm laser (10.5 mm YDF), under the same pump power of 600 mW, the output power reaches 147.4 mW, while the simulation gives 163.85 mW (a deviation of about 11%). When the pump power is increased to 800 mW, the output further increases to 197.3 mW, with a fitted slope efficiency of 24.45%. Even higher output powers would be attainable using more powerful 976 nm laser diodes. Compared to the 1053 nm laser, the superior output power and efficiency of the 1064 nm laser result not only from its longer gain fiber but also from the optimized low-reflectivity (LR) FBG in the cavity.
The longitudinal mode characteristics of the 1053 nm DBR laser are measured with a scanning Fabry–Perot (F-P) interferometer. Under the condition of a stabilized cavity temperature, the laser maintains robust single-longitudinal-mode operation without any mode hopping at 200 mW pump power. The F-P scanning curve in Figure 7b shows no secondary peaks within the free spectral range, confirming single-mode operation.
Figure 7c presents the optical spectrum of the 1064 nm DBR SFFL at a pump power of 200 mW. The measured optical signal-to-noise ratio (OSNR) is 70 dB, indicating excellent spectral purity.
The central wavelength of the 1053 nm DBR SFFL exhibits a continuous redshift with increasing temperature. As shown in Figure 7d,e, raising the temperature from 5 °C to 95 °C shifts the lasing wavelength from 1052.9276 nm to 1053.5698 nm, yielding a tuning range of 0.64 nm. Importantly, single-longitudinal-mode operation is preserved across the entire temperature range.
Figure 7f shows the RIN spectra of DBR single-frequency lasers with 6.5 mm and 10.5 mm YDFs, both pumped at 200 mW by Source1, measured using an intensity noise analyzer. A longer gain fiber increases the intracavity photon lifetime, which shifts the relaxation oscillation peak to higher frequencies. A lower-reflectivity FBG increases the cavity loss and raises the laser threshold, which shifts the peak to lower frequencies. In our experiments, the 1053 nm DBR laser (6.5 mm/74%) has a higher reflectivity but a lower gain compared with the 1064 nm laser (10.5 mm/55%). As a result, both lasers exhibit a relaxation oscillation peak at approximately the same frequency of 2.07 MHz, with a magnitude of −102 dBc/Hz.
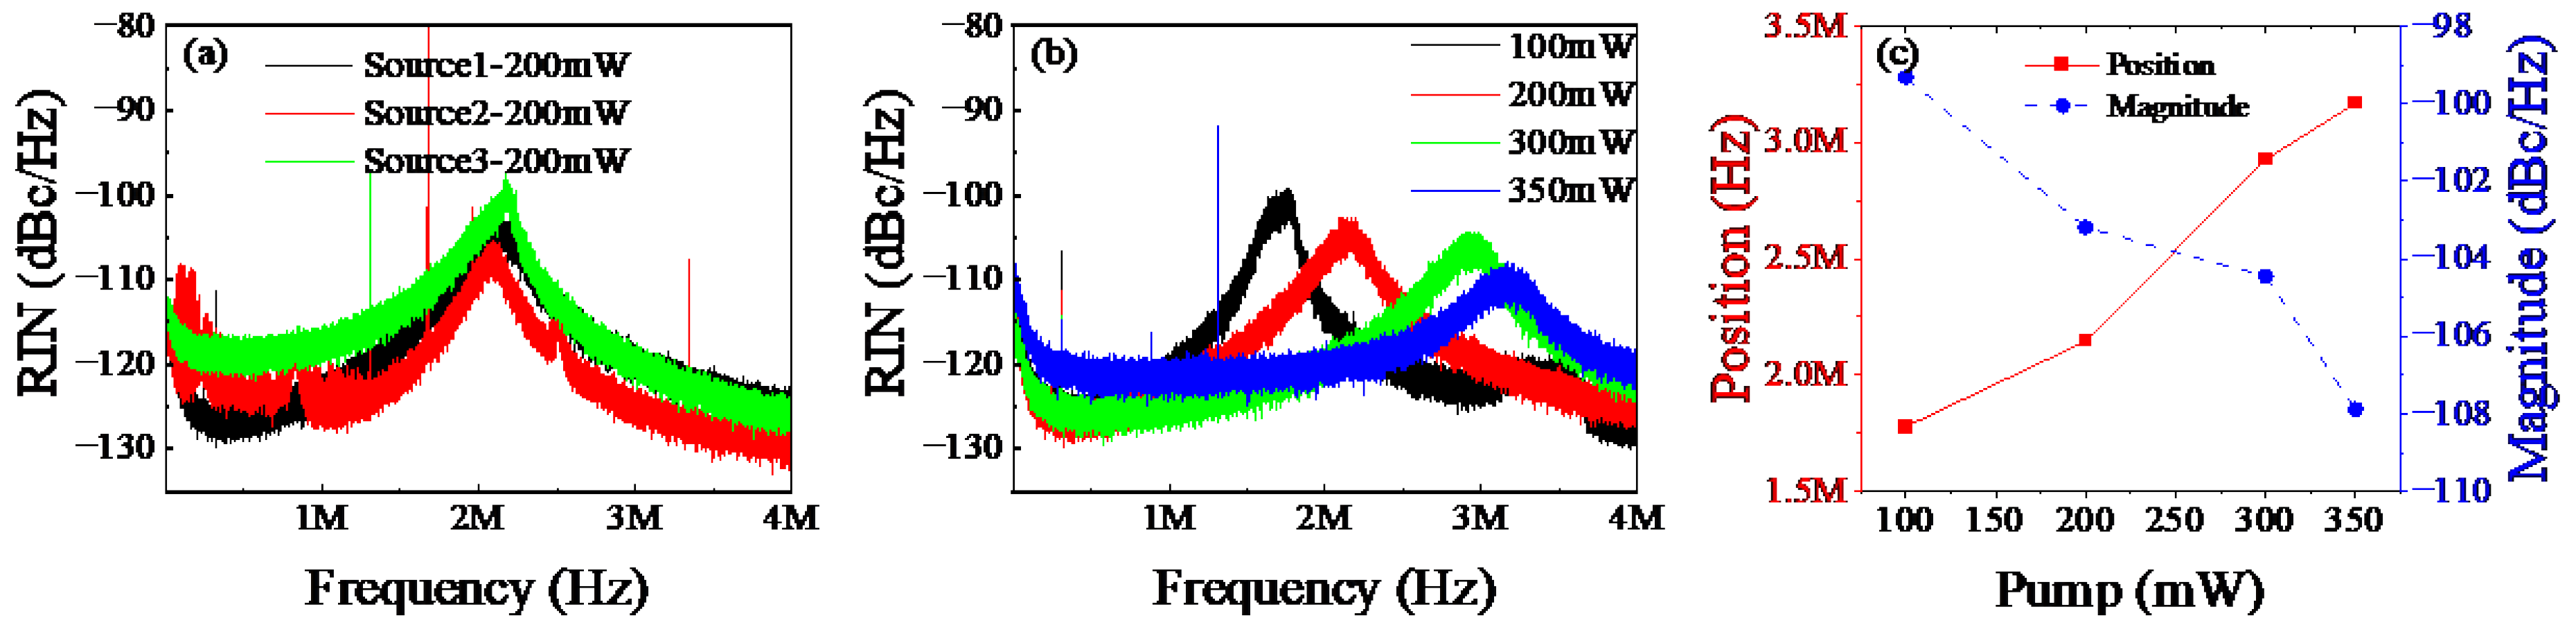
Figure 8a compares the RIN spectra of three pumps at 200 mW. The relaxation oscillation peaks at ~2.1 MHz are −102 dBc/Hz (Source1), −105 dBc/Hz (Source2), and −98 dBc/Hz (Source3). Beyond this frequency, the RIN drops to the shot noise limit of −135 dBc/Hz. Source2 has the lowest peak but suffers from electrical interference spikes. Source3 shows the highest peak. Source1 offers a clean spectrum with a moderately low peak, making it the optimal choice. Figure 8b shows the RIN spectra of Source1 at different pump powers. As the pump power increases from 100 mW to 350 mW, the relaxation oscillation peak shifts from 1.77 MHz to 3.17 MHz, and its magnitude decreases from −99 dBc/Hz to −108 dBc/Hz (detailed in Figure 8c).
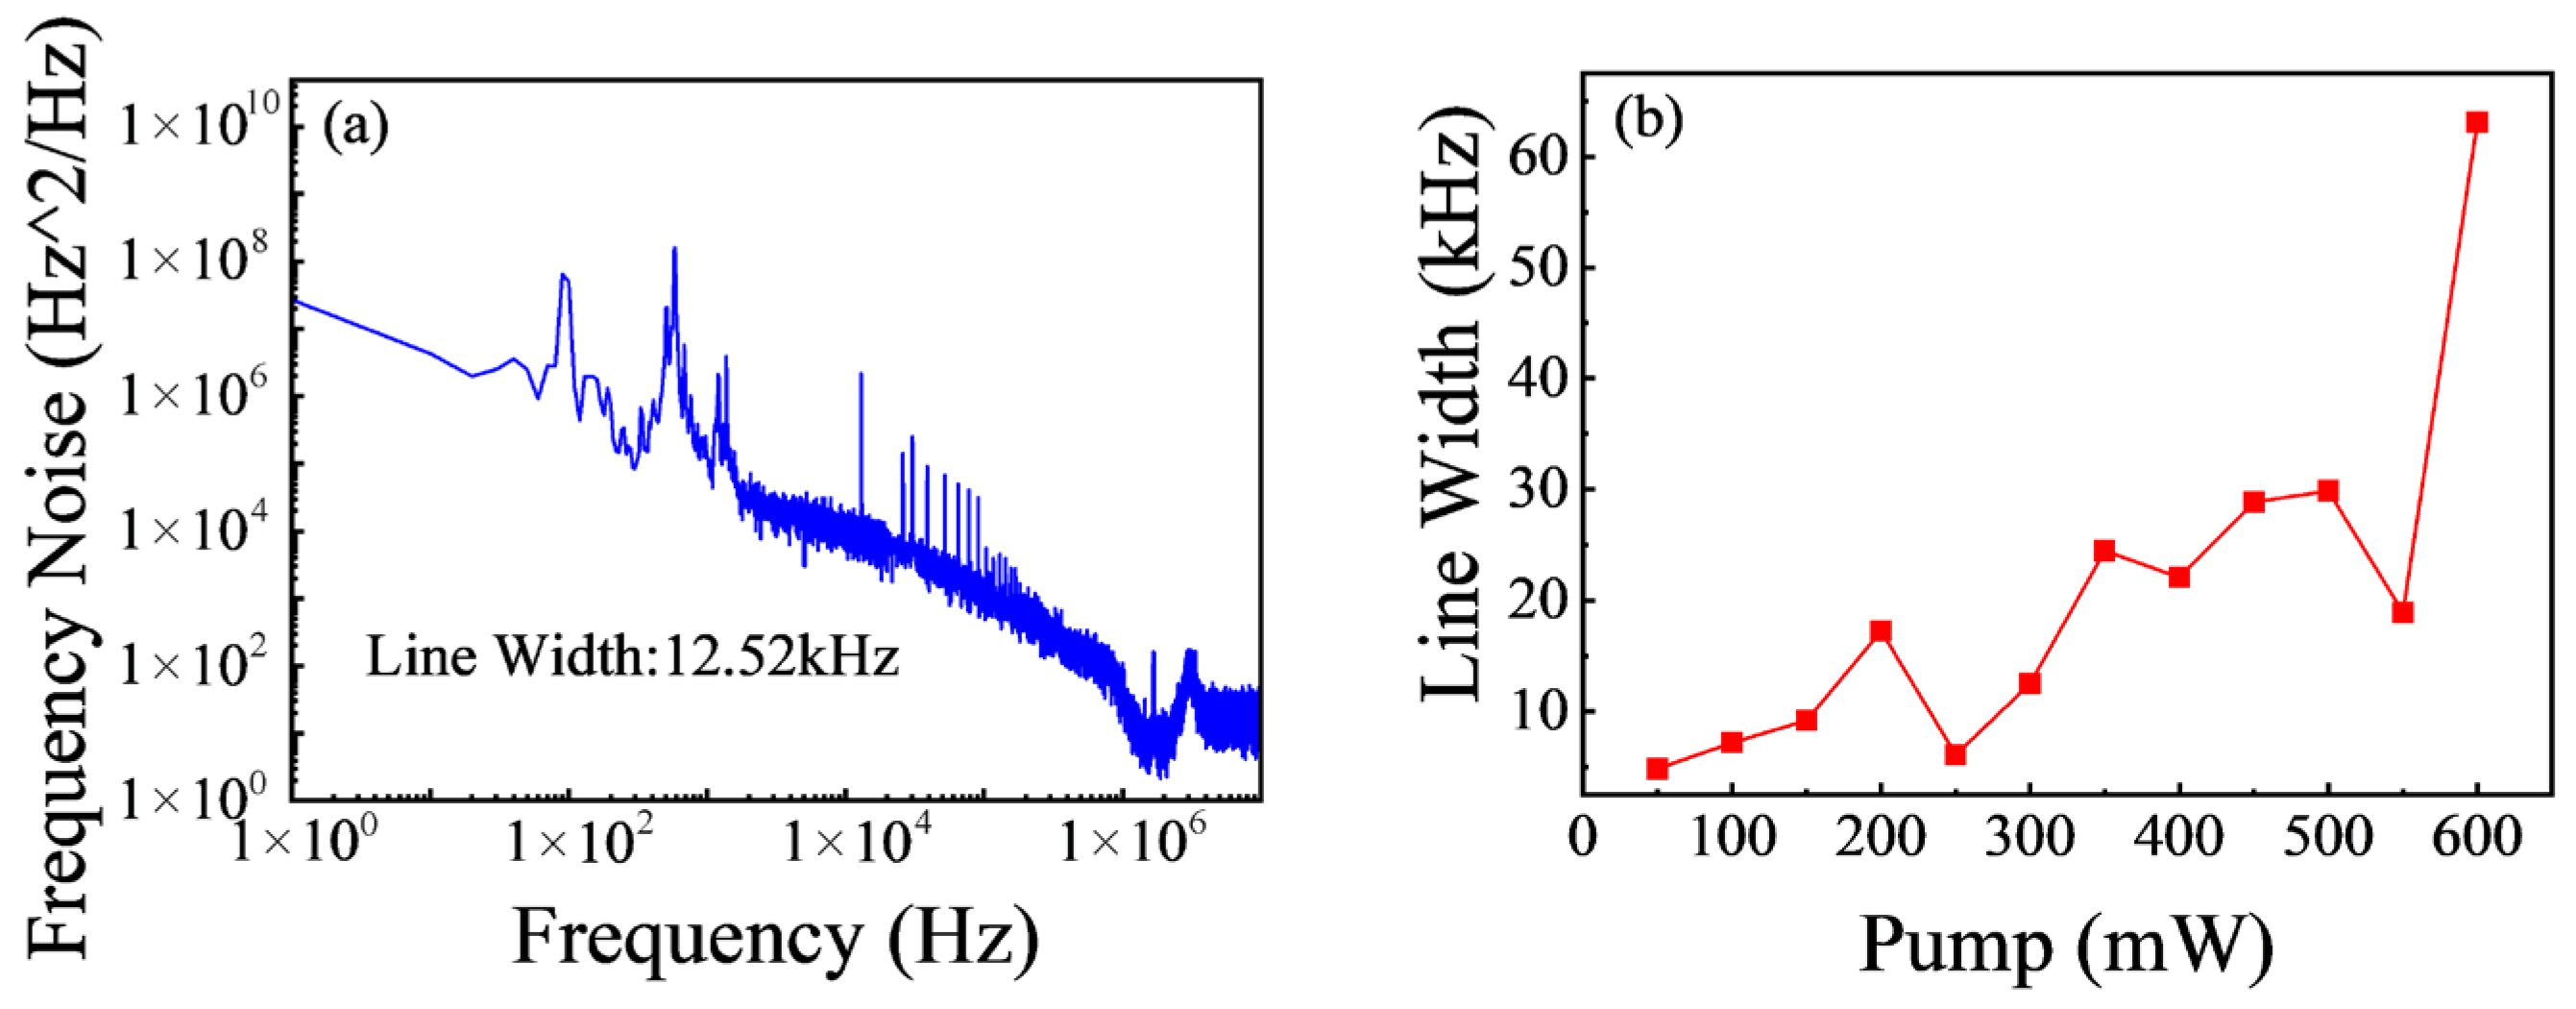
The frequency noise spectrum of the 1053 nm DBR SFFL is characterized using a frequency noise analyzer with integrated linewidth measurement capability, from which the laser linewidth is computed. Figure 9a presents the frequency noise spectrum measured under pumping by Source2 at 300 mW. In the RIN spectrum of this pump, electrical noise interference is observed. Notably, the same electrical interference also appears in the frequency noise spectrum, indicating that the pump’s electrical noise couples into both the intensity and frequency noise domains. Under these measurement conditions, the corresponding laser linewidth is measured to be 12.52 kHz. The linewidth is within the range of 10–25 kHz in recently reported literature for similar DBR single-frequency fiber lasers [19,20,21]. Therefore, our laser achieves a linewidth performance comparable to the state of the art. The dependence of the integrated linewidth on pump power is shown in Figure 9b.
Two competing trends are observed. On one hand, increasing the pump power broadens the linewidth, indicating reduced coherence. This broadening is mainly caused by pump-noise-induced temperature fluctuations in the gain fiber. As the pump power increases, quantum defect heating raises the fiber core temperature. The pump intensity noise then creates fluctuations in this temperature. Through the thermo-optic effect, these temperature fluctuations change the refractive index of the fiber core and the Bragg wavelengths of the FBGs. This leads to enhanced phase noise and a broader linewidth [36,37]. Voo et al. reported that the 3 dB linewidth of an Er-Yb doped DFB fiber laser increased from about 15 kHz to 40 kHz as the pump power was raised from near the threshold to 110 mW. They also found that the linewidth varied significantly with the pumping configuration [38]. These pump-induced thermal effects, together with a low thermal-noise floor, have been identified as a major cause of linewidth broadening [37]. On the other hand, increasing the pump power suppresses the relaxation oscillation peak, which improves noise performance. This reduction in the RIN peak is consistent with the simulated trend shown in Figure 4c. When the pump power increases, the intracavity photon density rises. A higher photon density accelerates the stimulated emission rate. As a result, the relaxation oscillation decays more quickly. A faster decay means that the oscillation is damped more strongly. This enhanced damping effect then reduces the amplitude of the relaxation oscillation peak. For single-frequency DBR/DFB fiber lasers, this RIN improvement with increasing pump power has been experimentally confirmed in several studies [12,19,20]. Therefore, the final selection of pump power represents a compromise. The chosen pump power balances the requirement of low intensity noise while keeping the linewidth as small as possible.

4. Conclusions

In conclusion, this work presents a comprehensive numerical and experimental study on 1 μm DBR SFFLs. The simulations give contour plots of output power for different fiber lengths over a range of reflectivities and wavelengths, together with intensity noise spectra under various operating conditions. The results indicate that, while maintaining single-longitudinal-mode operation, maximizing the doped fiber length and selecting an optimal reflectivity for that length can effectively maximize output power and suppress the relaxation oscillation peak.
Two lasers are fabricated using 6.5 mm and 10.5 mm YDFs, paired with FBGs having central wavelengths of 1053 nm and 1064 nm and different reflectivities. Their output and noise characteristics are then compared. The maximum output power of the 1053 nm laser reaches 29.7 mW under a 600 mW pump, while the 1064 nm laser achieves 197 mW at a 800 mW pump. Additionally, for the 1053 nm laser under a 200 mW pump, a relaxation oscillation peak of −102 dBc/Hz is measured at 2.07 MHz. This study further reveals a key trade-off: although increasing pump power suppresses the relaxation oscillation peak, it also broadens the linewidth. Therefore, choosing a suitable pump power requires balancing linewidth and intensity noise. Through this comparative analysis of lasers with different parameters, the work deepens the understanding of how critical design choices affect performance. These insights are essential for optimizing such lasers and underscore their strong potential for future applications.

Author Contributions

Conceptualization, H.X. and Y.Z.; methodology, Y.Z. and H.X.; software, Y.Z.; validation, Y.Z., H.X., and Z.Y.; formal analysis, Y.Z.; investigation, Y.Z., H.X., Z.Y., X.T., J.Z., J.L., F.Z., and R.Z.; resources, H.X.; data curation, Y.Z.; writing—original draft preparation, Y.Z.; writing—review and editing, H.X.; visualization, Y.Z.; supervision, H.X.; project administration, H.X.; funding acquisition, H.X. All authors have read and agreed to the published version of the manuscript.

Funding

National Natural Science Foundation of China (U2441250, U24A20311); National Key Research and Development Program of China (2023YFF0715803).

Institutional Review Board Statement

Not applicable.

Informed Consent Statement

Not applicable.

Data Availability Statement

The original contributions presented in the study are included in the article; further inquiries can be directed to the corresponding author.

Conflicts of Interest

The authors declare no conflicts of interest.

References

  1. Shi, W.; Fang, Q.; Zhu, X.; Norwood, R.A.; Peyghambarian, N. Fiber lasers and their applications. Appl. Opt. 2014, 53, 6554–6568. [Google Scholar] [CrossRef] [PubMed]
  2. Zhou, K.; Zhao, Q.; Huang, X.; Yang, C.; Li, C.; Zhou, E.; Xu, X.; Wong, K.K.; Cheng, H.; Gan, J. kHz-order linewidth controllable 1550 nm single-frequency fiber laser for coherent optical communication. Opt. Express 2017, 25, 19752–19759. [Google Scholar] [CrossRef]
  3. Mauranyapin, N.; Madsen, L.; Taylor, M.; Waleed, M.; Bowen, W. Evanescent single-molecule biosensing with quantum-limited precision. Nat. Photonics 2017, 11, 477–481. [Google Scholar] [CrossRef]
  4. Braunstein, S.L.; Van Loock, P. Quantum information with continuous variables. Rev. Mod. Phys. 2005, 77, 513–577. [Google Scholar] [CrossRef]
  5. Endres, M.; Bernien, H.; Keesling, A.; Levine, H.; Anschuetz, E.R.; Krajenbrink, A.; Senko, C.; Vuletic, V.; Greiner, M.; Lukin, M.D. Atom-by-atom assembly of defect-free one-dimensional cold atom arrays. Science 2016, 354, 1024–1027. [Google Scholar] [CrossRef]
  6. Zhang, Q.; Hou, Y.; Wang, X.; Song, W.; Chen, X.; Bin, W.; Li, J.; Zhao, C.; Wang, P. 5 W ultra-low-noise 2 µm single-frequency fiber laser for next-generation gravitational wave detectors. Opt. Lett. 2020, 45, 4911–4914. [Google Scholar] [CrossRef]
  7. Paradis, C.; Hammond, D.; Thoma, J.; Loescher, A.; Le Touzé, G.; Friedman, G.; Le Garrec, B.; Chériaux, G. Advances in laser technology for direct drive inertial fusion energy. In High Power Lasers for Fusion Research VIII; SPIE: Bellingham, WA, USA, 2025; p. 1334302. [Google Scholar]
  8. Keefe, D. Inertial confinement fusion. Annu. Rev. Nucl. Part. Sci. 1982, 32, 391–441. [Google Scholar] [CrossRef]
  9. Betti, R.; Hurricane, O. Inertial-confinement fusion with lasers. Nat. Phys. 2016, 12, 435–448. [Google Scholar] [CrossRef]
  10. Spiegelberg, C.; Geng, J.; Hu, Y.; Kaneda, Y.; Jiang, S.; Peyghambarian, N. Low-noise narrow-linewidth fiber laser at 1550 nm (June 2003). J. Light. Technol. 2004, 22, 57–62. [Google Scholar] [CrossRef]
  11. Zhang, W.; Chen, S.; Su, R.; Jiang, M.; Li, C.; Ma, Y.; Zhou, P. Single-frequency linearly-polarized gain-switched DFB pulsed fiber laser. Opt. Laser Technol. 2023, 158, 108808. [Google Scholar] [CrossRef]
  12. Zhang, L.; Sheng, Q.; Chen, L.; Zhang, J.; Fu, S.; Fang, Q.; Wang, Y.; Shi, W.; Yao, J. Single-frequency Tm-doped fiber laser with 215 mW at 2.05 µm based on a Tm/Ho-codoped fiber saturable absorber. Opt. Lett. 2022, 47, 3964–3967. [Google Scholar] [CrossRef] [PubMed]
  13. Hill, K.O.; Malo, B.; Bilodeau, F.; Johnson, D.; Albert, J. Bragg gratings fabricated in monomode photosensitive optical fiber by UV exposure through a phase mask. Appl. Phys. Lett. 1993, 62, 1035–1037. [Google Scholar] [CrossRef]
  14. Hill, K.; Bilodeau, F.; Malo, B.; Kitagawa, T.; Thériault, S.; Johnson, D.; Albert, J.; Takiguchi, K. Chirped in-fiber Bragg gratings for compensation of optical-fiber dispersion. Opt. Lett. 1994, 19, 1314–1316. [Google Scholar] [CrossRef]
  15. Xu, S.; Yang, Z.; Zhang, W.; Wei, X.; Qian, Q.; Chen, D.; Zhang, Q.; Shen, S.; Peng, M.; Qiu, J. 400 mW ultrashort cavity low-noise single-frequency Yb 3+-doped phosphate fiber laser. Opt. Lett. 2011, 36, 3708–3710. [Google Scholar] [CrossRef]
  16. Wong, A.C.; Chen, D.; Wang, H.-J.; Chung, W.; Tam, H.-Y.; Lu, C.; Guan, B.-O. Extremely short distributed Bragg reflector fibre lasers with sub-kilohertz linewidth and ultra-low polarization beat frequency for sensing applications. Meas. Sci. Technol. 2011, 22, 045202. [Google Scholar] [CrossRef]
  17. Liu, X.; Pan, H.; Pan, Y.; Jin, J.; Yang, X. Low-noise 1053 nm DBR single longitudinal mode fiber laser with 1.3 nm mode-hop-free tuning range. Opt. Fiber Technol. 2025, 93, 104255. [Google Scholar] [CrossRef]
  18. Kaneda, Y.; Spiegelberg, C.; Geng, J.; Hu, Y.; Luo, T.; Wang, J.; Jiang, S. 200-mW, narrow-linewidth 1064.2-nm Yb-doped fiber laser. In Proceedings of the Conference on Lasers and Electro-Optics; Optica Publishing Group: Washington, DC, USA, 2004; p. CThO3. [Google Scholar]
  19. Fu, S.; Zhu, X.; Zong, J.; Norwood, R.A.; Peyghambarian, N. Diode-pumped 1.15 W linearly polarized single-frequency Yb3+-doped phosphate fiber laser. Opt. Express 2021, 29, 30637–30643. [Google Scholar] [CrossRef]
  20. Guan, X.; Yang, C.; Qiao, T.; Lin, W.; Zhao, Q.; Tang, G.; Qian, G.; Qian, Q.; Yang, Z.; Xu, S. High-efficiency sub-watt in-band-pumped single-frequency DBR Tm3+-doped germanate fiber laser at 1950 nm. Opt. Express 2018, 26, 6817–6825. [Google Scholar] [CrossRef]
  21. Li, Y.; Deng, X.; Fu, S.; Sheng, Q.; Shi, C.; Zhang, J.; Zhang, L.; Shi, W.; Yao, J. High-power, high-efficiency single-frequency DBR fiber laser at 1064 nm based on Yb3+-doped silica fiber. Opt. Lett. 2023, 48, 598–601. [Google Scholar] [CrossRef] [PubMed]
  22. Zhao, Q.; Xu, S.; Zhou, K.; Yang, C.; Li, C.; Feng, Z.; Peng, M.; Deng, H.; Yang, Z. Broad-bandwidth near-shot-noise-limited intensity noise suppression of a single-frequency fiber laser. Opt. Lett. 2016, 41, 1333–1335. [Google Scholar] [CrossRef]
  23. Hou, Y.; Zhang, Q.; Wang, P. Frequency-and intensity-noise suppression in Yb3+-doped single-frequency fiber laser by a passive optical-feedback loop. Opt. Express 2016, 24, 12991–12999. [Google Scholar] [CrossRef]
  24. Xiao, Y.; Li, C.; Xu, S.-H.; Feng, Z.-M.; Yang, C.-S.; Zhao, Q.-L.; Yang, Z.-M. Simultaneously suppressing low-frequency and relaxation oscillation intensity noise in a DBR single-frequency phosphate fiber laser. Chin. Phys. Lett. 2015, 32, 064205. [Google Scholar] [CrossRef]
  25. Zhang, Y.; Li, C.; Xu, S.; Deng, H.; Feng, Z.; Yang, C.; Huang, X.; Zhang, Y.; Gan, J.; Yang, Z. A broad continuous temperature tunable DBR single-frequency fiber laser at 1064 nm. IEEE Photonics J. 2016, 8, 1–7. [Google Scholar] [CrossRef]
  26. Huang, Z.; Deng, H.; Yang, C.; Zhao, Q.; Zhang, Y.; Zhang, Y.; Feng, Z.; Yang, Z.; Peng, M.; Xu, S. Self-injection locked and semiconductor amplified ultrashort cavity single-frequency Yb3+-doped phosphate fiber laser at 978 nm. Opt. Express 2017, 25, 1535–1541. [Google Scholar] [CrossRef]
  27. Wang, K.; Lu, B.; Qi, X.; Wen, Z.; Zhang, K.; Chen, H.-W.; Bai, J. Wavelength-tunable single-frequency ytterbium-doped fiber laser based on a double-circulator interferometer. Laser Phys. Lett. 2019, 16, 015104. [Google Scholar] [CrossRef]
  28. Jelger, P.; Engholm, M.; Norin, L.; Laurell, F. Degradation-resistant lasing at 980 nm in a Yb∕Ce∕Al-doped silica fiber. J. Opt. Soc. Am. B 2010, 27, 338–342. [Google Scholar] [CrossRef]
  29. Dragic, P.D.; Cavillon, M.; Ballato, J. Materials for optical fiber lasers: A review. Appl. Phys. Rev. 2018, 5, 041301. [Google Scholar] [CrossRef]
  30. Li, Y. High-Power Single-Frequency Yb3+-Doped All-Silica Fiber Laser Based on FBG-FP Cavity. Master’s Thesis, Tianjin University, Tianjin, China, 2022. [Google Scholar]
  31. Allain, J.; Monerie, M.; Poignant, H. Ytterbium-doped fluoride fibre laser operating at 1.02 μm. Electron. Lett. 1992, 28, 988–989. [Google Scholar] [CrossRef]
  32. Allain, J.; Bayon, J.; Monerie, M.; Bernage, P.; Niay, P. Ytterbium-doped silica fibre laser with intracore Bragg gratings operating at 1.02 μm. Electron. Lett. 1993, 29, 309–310. [Google Scholar] [CrossRef]
  33. Wu, J.; Zhu, X.; AlYahyaei, K.; Peyghambarian, N.; Norwood, R.A. Toward 10-watt-level single-frequency fiber laser oscillators. J. Opt. Soc. Am. B 2024, 41, 2675–2683. [Google Scholar] [CrossRef]
  34. Xu, T.; Su, X. Study of the reabsorption effect on the ytterbium-doped fiber amplifiers. Opt. Commun. 2023, 533, 129303. [Google Scholar] [CrossRef]
  35. Ma, L.; Hu, Y.; Xiong, S.; Meng, Z.; Hu, Z. Intensity noise and relaxation oscillation of a fiber-laser sensor array integrated in a single fiber. Opt. Lett. 2010, 35, 1795–1797. [Google Scholar] [CrossRef] [PubMed]
  36. Horak, P.; Voo, N.; Ibsen, M.; Loh, W. Dominant causes of linewidth in DFB fiber lasers. In Proceedings of the Conference on Lasers and Electro-Optics (CLEO); IEEE: New York, NY, USA, 2005; pp. 1566–1571. [Google Scholar]
  37. Horak, P.; Voo, N.Y.; Ibsen, M.; Loh, W.H. Pump-noise-induced linewidth contributions in distributed feedback fiber lasers. IEEE Photonics Technol. Lett. 2006, 18, 998–1000. [Google Scholar] [CrossRef]
  38. Voo, N.; Horak, P.; Ibsen, M.; Loh, W. Anomalous linewidth behavior in short-cavity single-frequency fiber lasers. IEEE Photonics Technol. Lett. 2005, 17, 546–548. [Google Scholar] [CrossRef]
Figure 2. Absorption and emission cross-sections of YDF.
Photonics 13 00467 g002
Figure 3. Output power levels of (a) 6.5 mm and (b) 10.5 mm YDF lasers operating at 976 nm pump for different output wavelengths and reflectivity of LR FBG. (c) Calculated output power of the 1053 nm and 1064 nm DBR SFFL with different lengths of YDF at 600 mW pump power with LR FBG reflectivity of 75% and 55%. (d) Calculated laser output power as a function of the LR FBG reflectivity for the 1053 nm and 1064 nm DBR SFFL with lengths of YDF at 6.5 mm and 10.5 mm with pump power at 600 mW.
Photonics 13 00467 g003
Figure 4. Calculated laser intensity noise spectrum and the position/magnitude of the relaxation oscillation peak under different cavity conditions coupled with pump noise. (a) Measured RIN spectra of three different commercial pump sources. (b) Intensity noise spectra calculated using different pump sources. (c) Calculated intensity noise spectra at different pump power levels. (d) Position and magnitude of the relaxation oscillation peak as functions of pump power.
Photonics 13 00467 g004
Figure 5. (a,b) Intensity noise spectra versus LR FBG reflectivity for gain fiber lengths of 6.5 mm and 10.5 mm. (c) Relaxation oscillation peak position as a function of LR FBG reflectivity for different gain fiber lengths. (d) Relaxation oscillation peak magnitude as a function of LR FBG reflectivity for different gain fiber lengths.
Photonics 13 00467 g005
Figure 6. Experimental setup of the DBR SFFL at 1053 nm. WDM: Wavelength division multiplexer. LD: 976 nm pump laser diode. LR-FBG: Low-reflection fiber Bragg grating. HR-FBG: High-reflection fiber Bragg grating. YDF: Ytterbium-doped fiber. PMTI: Polarization-maintaining tap isolator. TEC: Thermoelectric cooler. The numbers 1/2 represent the two input ports of the dual-channel PMTI.
Photonics 13 00467 g006
Figure 7. (a) Comparison of output power between the DBR SFFLs with 6.5 mm and 10.5 mm long YDFs. The black circles mark the operating conditions for Figure 7b–f. (b) Longitudinal mode characteristics of the 1053 nm DBR SFFLs at a 200 mW pump power measured with a scanning Fabry–Perot interferometer. (c) Spectral diagrams of the 1064 nm DBR SFFL under a 200 mW pump. The optical signal-to-noise ratio (OSNR) of the laser spectrum was 70 dB. (d) Spectral diagrams of the 1053 nm DBR SFFL at different temperatures under a 200 mW pump. The spectra were measured using an optical spectrum analyzer with a resolution of 0.02 nm over the wavelength range of 1052–1054.5 nm. (e) Central wavelength of the DBR SFFL as a function of temperature at a fixed pump power of 200 mW. (f) Intensity noise comparison. The measured RIN of the 1053 nm DBR SFFL is compared with the RIN of the 1064 nm laser under the 200 mW Source1 pump.
Photonics 13 00467 g007
Figure 8. (a) RIN spectra from different pump sources at 200 mW. Measured over the frequency range of 100 Hz to 10 MHz. (b) RIN spectra of the Source1 pump at various power levels. Measured over the frequency range of 100 Hz to 4 MHz. (c) Position and magnitude of the relaxation oscillation peak as functions of pump power.
Photonics 13 00467 g008
Figure 9. (a) Frequency noise spectrum of the 1053 nm DBR SFFL at a 300 mW pump power. The measured linewidth is 12.52 kHz. (b) Linewidth variation with pump power.
Photonics 13 00467 g009
Table 1. Key parameters and dynamical variables.
SymbolParameter MeaningNumerical ValueDimension
cLight velocity2.998 × 108m/s
hPlanck’s constant6.626 × 10−34J·s
neffEffective refractive index1.456-
τSpontaneous emission lifetime1ms
σaAbsorption cross-section of signal light3.8 × 10−26m2
σeEmission cross-section of signal light1.12 × 10−25m2
σpPump absorption cross-section2.6 × 10−24m2
ApPump mode effective area22.95μm2
N0Doping concentration1.95 × 1026m−3
ΓpPump overlap factor0.99-
λpPump wavelength976nm
R1Reflectivity of HR FBG99.6%
αsplicetInsertion loss at splice points0.2dB
Disclaimer/Publisher’s Note: The statements, opinions and data contained in all publications are solely those of the individual author(s) and contributor(s) and not of MDPI and/or the editor(s). MDPI and/or the editor(s) disclaim responsibility for any injury to people or property resulting from any ideas, methods, instructions or products referred to in the content.