Article

Mechanism and Performance of a Reflective Plasmonic Humidity Sensor Based on an Au–PVA–Au Nanohole Sandwich Structure


by
Liang Zhu
1,
Jin Liu
1,*,
Haima Yang
2,
Jingru Zhang
3,*,
Damin Ding
4 and
Wenyao Xia
1
1
School of Electronic and Electrical Engineering, Shanghai University of Engineering Science, Shanghai 201620, China
2
School of Optical-Electrical and Computer Engineering, University of Shanghai for Science and Technology, Shanghai 200093, China
3
School of Art and Design, Jiangsu Ocean University, Lianyungang 222005, China
4
School of Chemistry and Chemical Engineering, Shanghai University of Engineering Science, Shanghai 201620, China
*
Authors to whom correspondence should be addressed.
Photonics 2026, 13(5), 463; https://doi.org/10.3390/photonics13050463
Submission received: 10 April 2026 / Revised: 29 April 2026 / Accepted: 6 May 2026 / Published: 8 May 2026
(This article belongs to the Section Lasers, Light Sources and Sensors)

Abstract

A reflective plasmonic humidity sensor based on an Au–PVA–Au nanohole sandwich structure is investigated. The device consists of a periodic gold nanohole array, a poly(vinyl alcohol) (PVA) spacer, and a continuous gold film. A humidity-dependent model considering both the refractive-index decrease and thickness swelling of PVA is established to analyze the optical response and resonance-modulation mechanism. Within the relative humidity range of 20–98%RH, the reflection resonance dip exhibits a continuous blueshift with a total wavelength shift of approximately 135 nm. Piecewise linear fitting shows sensitivities of 1.3857 nm/%RH in the 20–74%RH range and 2.5000 nm/%RH in the 74–98%RH range. At approximately 74%RH, the resonance wavelength, full width at half maximum, and quality factor are about 830 nm, 19 nm, and 43.7, respectively. Decoupling analysis confirms that both PVA refractive-index reduction and thickness swelling contribute to the blueshift, while their combined effect produces the largest response. These results demonstrate that the proposed structure converts humidity-induced optical and geometric variations in PVA into a pronounced wavelength response, providing a mechanism-guided design route for reflective nanoplasmonic humidity sensors based on polymer-assisted cavity modulation.

1. Introduction

In recent years, various surface plasmon resonance (SPR) structures have been applied to humidity sensing. Wang et al. employed a PVA-sensitive film integrated with a fiber-optic SPR configuration for highly sensitive humidity detection and respiration monitoring [1]. Other researchers have used SPR structures modified with two-dimensional materials for relative humidity (RH) sensing [2], while some studies have further extended SPR technology from single-parameter humidity monitoring to dual-parameter temperature–humidity sensing [3,4]. Hua G et al. designed more sophisticated periodic nanogratings and localized surface plasmon resonance (LSPR) sensors for humidity monitoring [5,6]. Among these structures, intensity-interrogation sensing has been widely adopted because of its simplicity and low cost. For example, a fiber-optic relative humidity sensor based on intensity interrogation has previously been reported [7]. In addition, a relative humidity sensor based on a polyvinyl alcohol (PVA)-coated tilted fiber Bragg grating (FBG) has been demonstrated, showing sensitivities of 2.52 dBm/%RH and 14.95 dBm/%RH in the ranges of 20–74%RH and 74–98%RH, respectively [8]. Compared with intensity interrogation, wavelength interrogation directly tracks the shift in the resonance peak, offering stronger immunity to optical intensity fluctuations, clearer physical significance, and easier quantitative calibration. Therefore, it is more suitable for characterizing the humidity-sensing mechanism in complex nanoplasmonic structures [9,10]. More broadly, recent optical-sensing studies have also demonstrated that spectral, refractive-index, and resonance-based optical responses can provide effective routes for detecting environmental or material-parameter variations, further supporting the use of optical interrogation strategies in compact sensing platforms [11,12,13].
PVA is a typical hydrophilic polymer with good film-forming capability and transparency. Owing to its abundant hydroxyl groups, it is highly sensitive to humidity variations. As the ambient relative humidity increases, PVA absorbs moisture and swells, accompanied by a change in refractive index. Wong et al. first introduced PVA into photonic crystal fiber humidity sensors and experimentally verified that the refractive-index change induced by moisture absorption could be effectively converted into measurable spectral shifts [11]. In recent years, related studies have further progressed toward miniaturization and high performance. Sun et al. reported a PVA-based fiber-optic humidity sensor with good real-time response, stability, and repeatability [14]. Peng et al. introduced PVA into a miniature tapered-fiber SPR platform and achieved highly sensitive humidity response [15]. These studies show that fiber-type SPR/PVA humidity sensors have already achieved high absolute sensitivity. However, most reported SPR/PVA sensors use transmission-type fiber configurations, which are less convenient for planar integration and compact reflective readout. Reflective planar nanoplasmonic structures are more suitable for chip-level integration and miniaturized optical interrogation. However, their humidity-response mechanism, especially the coupled effect of PVA refractive-index variation and thickness swelling, remains insufficiently investigated. Therefore, the Au–PVA–Au nanohole sandwich structure provides a useful platform for studying how humidity-induced optical and geometric changes in PVA modulate plasmonic resonance. However, under humid conditions, PVA films not only undergo refractive-index (RI) variation due to water absorption, but also swell simultaneously, which may further induce resonance peak shifts [16].
Based on this, this paper proposes a reflective surface plasmon humidity-sensing model based on an Au–PVA–Au nanosandwich structure. The structure consists of a periodic gold nanohole array as the top layer, a PVA humidity-sensitive intermediate layer, and a continuous gold film as the bottom layer. A dual-parameter sensing model is established by simultaneously considering the decrease in PVA refractive index and the increase in film thickness induced by moisture absorption. The aperture diameter and periodicity are analyzed to determine the baseline structural parameters. Under the optimized parameters, as the ambient relative humidity increases from 20%RH to 98%RH, the resonance wavelength continuously blueshifts with a total shift of about 135 nm. This work can provide a theoretical basis for the structural design, mechanism analysis, and future experimental implementation of reflective nanoplasmonic humidity sensors.

2. Materials and Methods

2.1. Design and Simulation Model Establishment of Au–PVA–Au Sandwich Structure

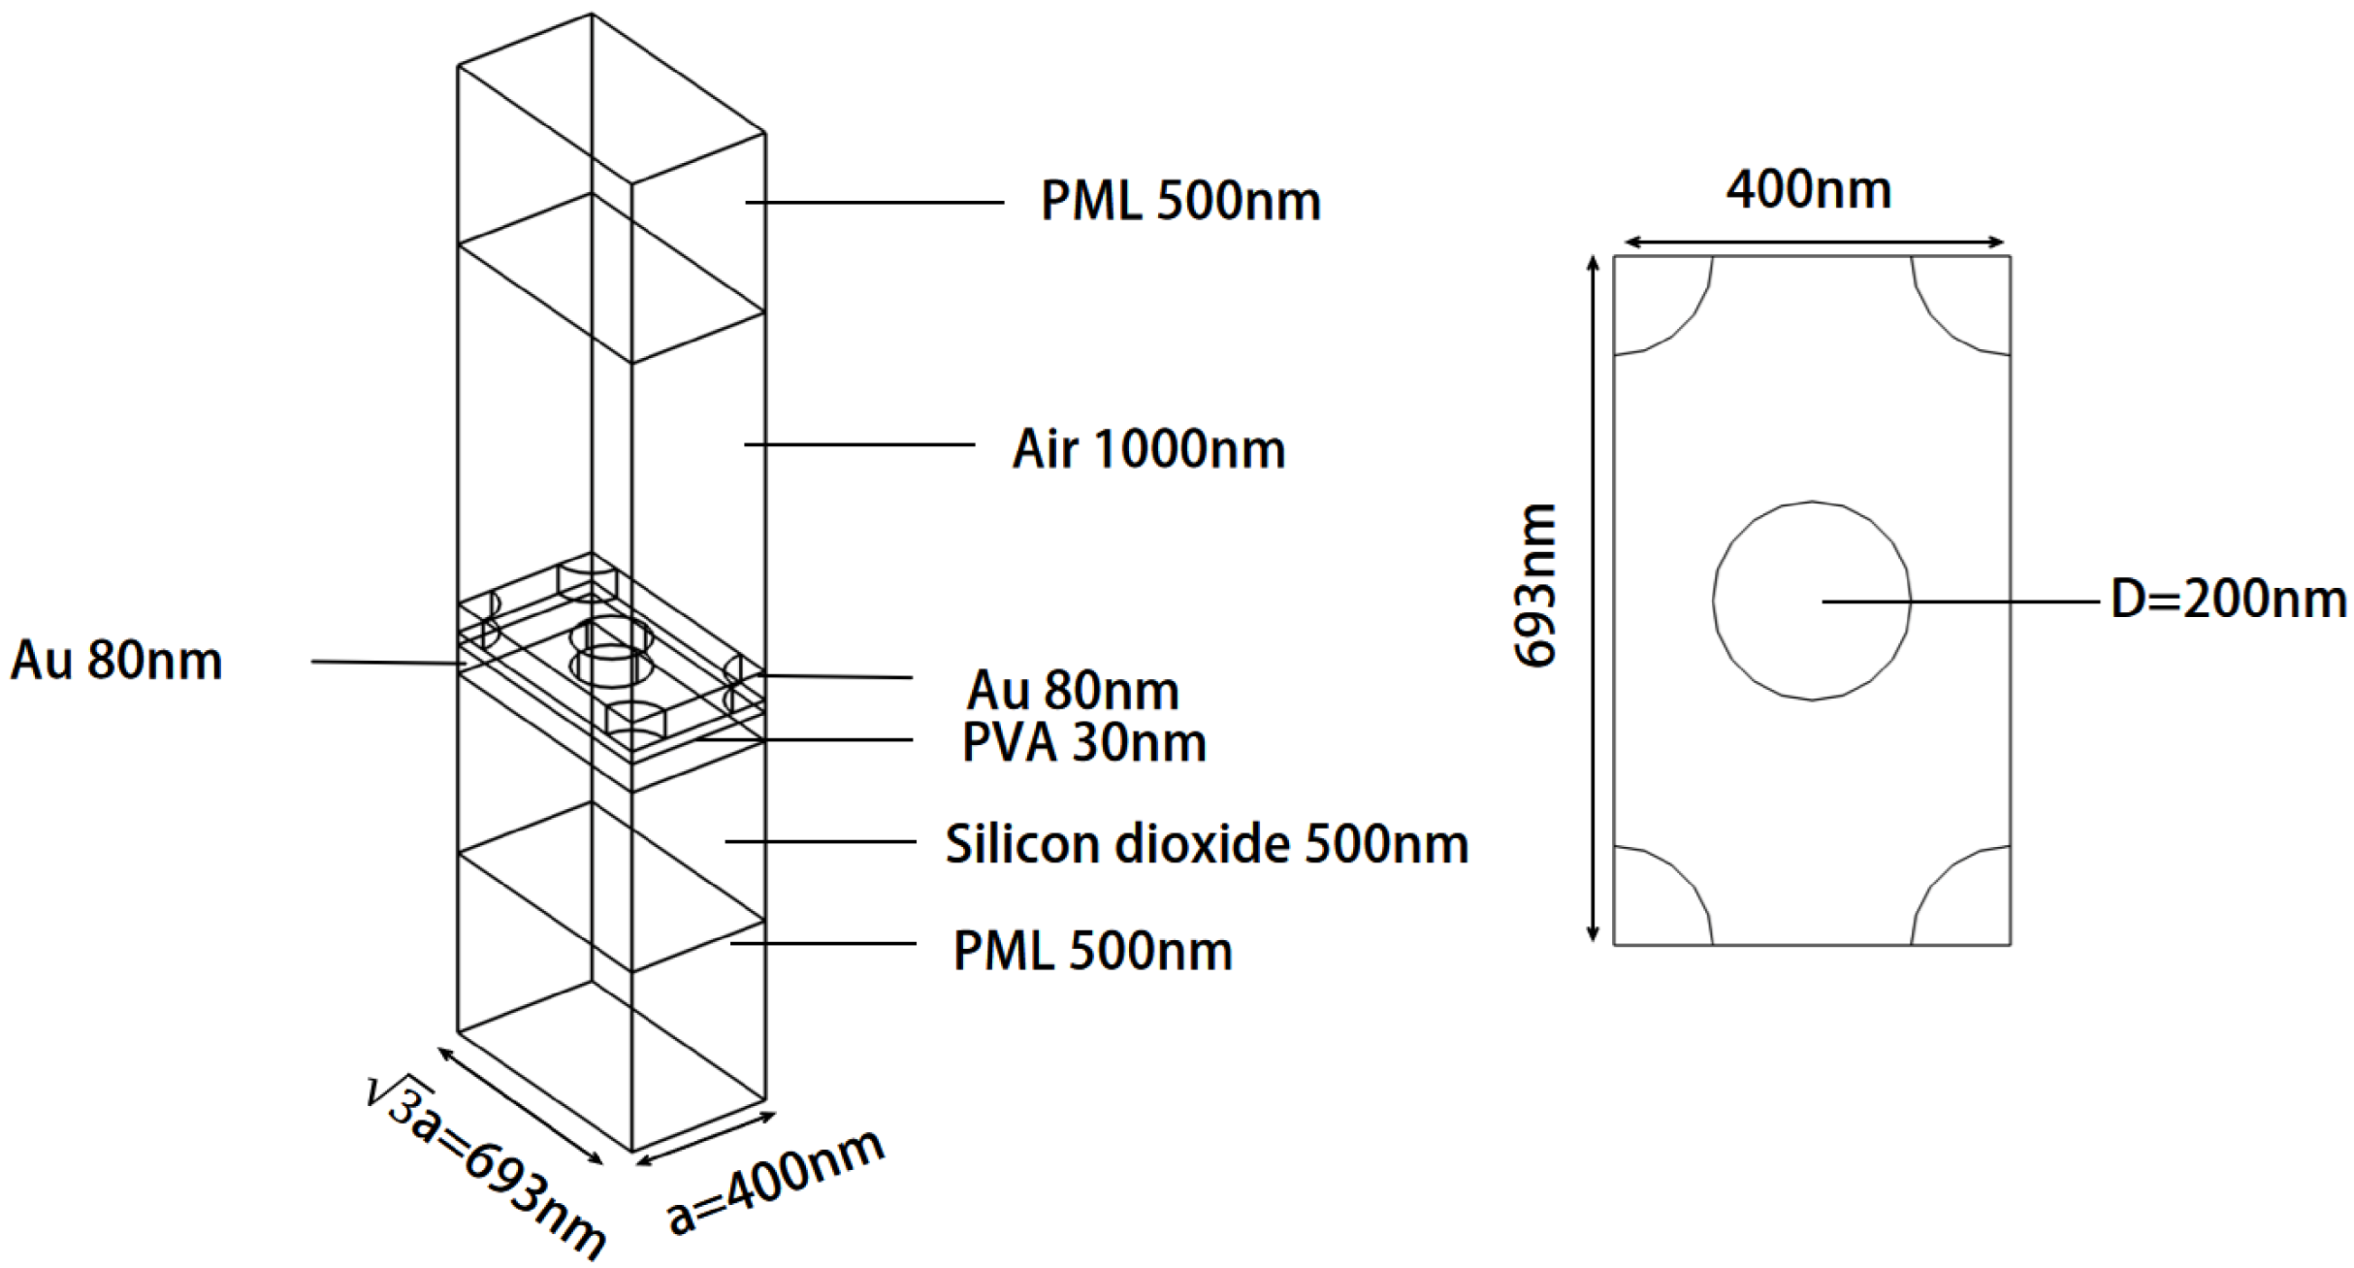
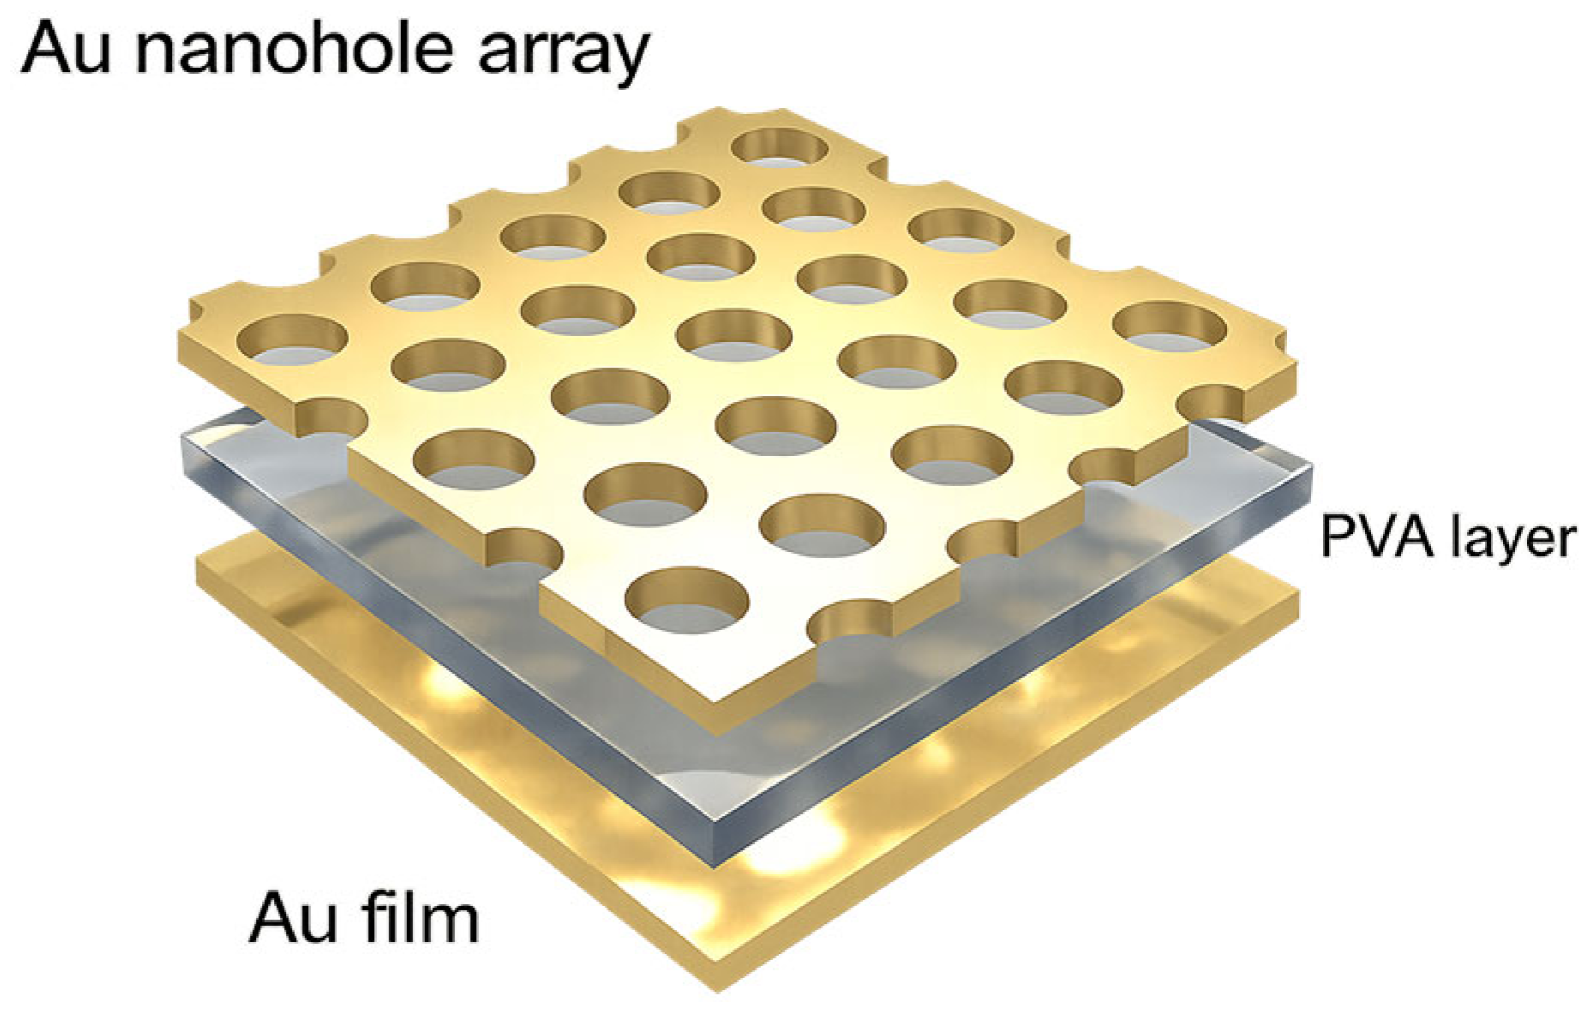
The gold nanohole sandwich structure designed in this study consists of a top Au nanohole array, an intermediate PVA dielectric layer, and a bottom continuous Au film, all supported on a silicon dioxide substrate. As shown in Figure 1, the top Au nanohole layer has a thickness of 80 nm, the nanohole diameter is 200 nm, and the array periodicity is 400 nm × 692.8 nm; the intermediate PVA layer has a thickness of 30 nm; and the bottom Au film has a thickness of 80 nm. Since this work is a numerical simulation study, no device was fabricated at this stage. We therefore outline a proposed fabrication route based on established nanofabrication processes. First, the silicon dioxide substrate would be cleaned and surface-activated to remove organic contaminants and improve the adhesion of the subsequently deposited films. Then, an 80 nm thick continuous Au film could be deposited on the substrate to form the bottom Au layer. Subsequently, a PVA thin film could be spin-coated onto the surface of the bottom Au film, and its thickness could be controlled to approximately 30 nm by adjusting the PVA solution concentration, spin-coating speed, and post-treatment conditions, thereby forming the intermediate dielectric spacer layer. After the formation of the PVA layer, an electron-beam resist could be spin-coated onto its surface and prebaked. A rectangular-period nanohole array pattern could then be written using electron-beam lithography according to the designed parameters, followed by development to form a patterned resist mask. An 80 nm thick Au film could subsequently be deposited by electron-beam evaporation. Finally, the resist mask could be removed by a lift-off process, thereby forming the top Au nanohole array with a hole diameter of 200 nm and a periodicity of 400 nm × 692.8 nm above the PVA layer.
Figure 2 shows the three-dimensional simulation model and the top-view periodic unit cell of the Au–PVA–Au gold nanohole sandwich structure. From top to bottom, the structure consists of an air layer, an upper Au nanohole film, a PVA humidity-sensitive dielectric layer, a lower continuous Au film, and a silicon dioxide substrate. Perfectly matched layers (PMLs) with a thickness of 500 nm were introduced at the upper and lower boundaries to absorb outgoing electromagnetic waves and reduce artificial boundary reflections. The structural parameters were as follows: the thickness of the upper Au nanohole layer was 80 nm, the initial thickness of the PVA layer was 30 nm, the thickness of the lower Au film was 80 nm, the thickness of the air layer was 1000 nm, and the thickness of the silicon dioxide substrate was 500 nm. The transverse period of the unit cell was 400 nm, and the longitudinal period was 3 times the transverse period. The diameter of the circular nanohole was 200 nm.
The optical simulations were performed using the frequency-domain finite-element method in the Wave Optics Module of COMSOL Multiphysics (version 6.3, COMSOL AB, Stockholm, Sweden). A normally incident x-polarized plane wave was launched from the top port along the −z direction, and the reflection response was extracted from the port response. Periodic boundary conditions were applied in the lateral directions to represent an infinite periodic nanohole array, while 500 nm perfectly matched layers were used in the upper and lower z directions to absorb outgoing electromagnetic waves and reduce artificial boundary reflections. The computational domain was discretized using a free tetrahedral mesh, with local mesh refinement applied near the nanohole edges, the Au–PVA interfaces, and the PVA spacer region to improve the calculation accuracy in regions with strong localized electric fields and thin dielectric layers. For the material model, the wavelength-dependent optical constants of Au were taken from the experimental data reported by Johnson and Christy. The ambient temperature was assumed to be constant at 22 °C. For each RH value, the PVA layer was modeled under a steady-state humidity condition, and the corresponding refractive index and thickness were assigned according to the parameterized RH-dependent functions.

2.2. Material Properties and Parameterization of PVA

PVA is a typical hydrophilic polymer with strong water absorption capability and pronounced humidity sensitivity [17,18]. Studies in the field of optical humidity sensing have indicated that, during the moisture absorption process, the PVA layer usually undergoes three simultaneous changes, namely, an increase in water content, thickness swelling, and a decrease in refractive index. These three changes jointly alter the optical path and resonance position of the device [19]. Experimental studies on PVA have further shown that the relationship between the refractive index of PVA and relative humidity can be approximately divided into two linear intervals over the range from 20%RH to 98%RH [20]. In addition, studies on humidity-responsive PVA nanostructures have shown that PVA can undergo significant swelling under humid conditions, although the exact swelling amplitude depends strongly on the film geometry, substrate constraint, preparation conditions, and hydration state [21]. In optical sensing and active photonic structures, both the refractive index and geometric parameters of PVA can vary with humidity, and both variations can affect the optical response [22]. In this work, the initial thickness of the PVA interlayer is defined as d 0 = 30 nm at RH = 20%, which is used as the reference humidity for the swelling-ratio calculation. Based on the humidity-dependent refractive-index variation reported for PVA-based optical humidity sensing, the refractive index of the PVA interlayer is parameterized as:
R I P V A ( R H ) = 1.49 1.49 1.42 74 20 ( R H 20 ) , 20 % R H 74 % 1.42 1.42 1.34 98 74 ( R H 74 ) , 74 % < R H 98 %
where R I P V A denotes the refractive-index of the PVA interlayer, and RH denotes the ambient relative humidity. Equation (1) adopts a piecewise linear refractive index model for the PVA humidity-sensitive layer in the two ranges of 20%RH to 74%RH and 74%RH to 98%RH. This piecewise form is consistent with the empirical relationship reported in studies on PVA humidity sensing [20]. To evaluate the possible influence of humidity-induced PVA swelling on the plasmonic response, the PVA thickness in the main model is parameterized as a function of relative humidity:
d P V A ( R H ) = 30 + 36 30 74 20 ( R H 20 ) , 20 % R H 74 % 36 + 42 36 98 74 ( R H 74 ) , 74 % < R H 98 %
where d P V A denotes the thickness of the PVA interlayer, in nm. According to Equation (2), the PVA thickness increases from 30 nm at 20%RH to 36 nm at 74%RH and further to 42 nm at 98%RH. This corresponds to an assumed maximum swelling ratio of 40% relative to the reference thickness at 20%RH. This value is used as a representative strong-swelling case in the main model, rather than as a directly measured thickness expansion for the present 30 nm PVA interlayer. The adopted thickness model is therefore intended as a structure-specific approximation rather than a universal experimental value for all 30 nm PVA films. This model captures the main physical trend of humidity-induced PVA expansion and enables evaluation of its effect on the plasmonic resonance of the Au–PVA–Au structure. The thickness swelling ratio of the PVA interlayer is defined as:
S d ( R H ) = d P V A ( R H ) d 0 d 0
where d 0 denotes the initial thickness of PVA at the reference humidity of 20%RH. Accordingly, the variation in the thickness of the PVA interlayer can be expressed as:
d PVA ( R H ) = d 0 1 + S d ( R H )
Equation (3) defines the swelling ratio relative to the reference thickness, and Equation (4) relates this ratio to the humidity-dependent PVA thickness. The present numerical model uses Equations (1) and (2) as parameterized material and geometric inputs to analyze the coupled effects of refractive-index reduction and thickness swelling. Because the swelling amplitude of the ultrathin PVA spacer is treated as an assumed modeling parameter, its influence on the resonance response is further evaluated through the swelling-ratio sensitivity analysis in Section 4.4. Future experimental calibration should determine the exact humidity-dependent thickness variation in the fabricated Au–PVA–Au sensor.

2.3. Humidity-Sensing Mechanism of Au–PVA–Au Sandwich Structure

The Au–PVA–Au nanoscale sandwich structure designed in this study can be regarded as a typical metal–dielectric–metal (MDM) nanocavity. Therefore, the device operates mainly through a reflection-type coupled gap-plasmon resonance. The PVA interlayer provides both the local dielectric environment and the nanoscale gap in the MDM cavity. Both the refractive-index parameters and the geometric parameters can directly modulate the optical response of the device [20,21]. Recent studies on Au nanohole arrays have also shown that the reflection resonance is highly sensitive to the refractive index of the surrounding medium, the near-field distribution, and the thickness of the target layer [23]. For a periodic nanohole array, the resonance wavelength can be approximately described using an SPP-related momentum-matching relation:
λ i j a 4 3 i 2 + i j + j 2 ε m ε d ε m + ε d
where a denotes the characteristic period of the nanohole array; i and j denote the scattering orders of the array; ε m denotes the effective dielectric constant of the metal; and ε d denotes the effective dielectric constant of the local environment near the nanoholes. Equation (5) indicates that the resonance wavelength is affected not only by the geometric parameters of the array but also by the dielectric constant of the local environment [21,22,23].
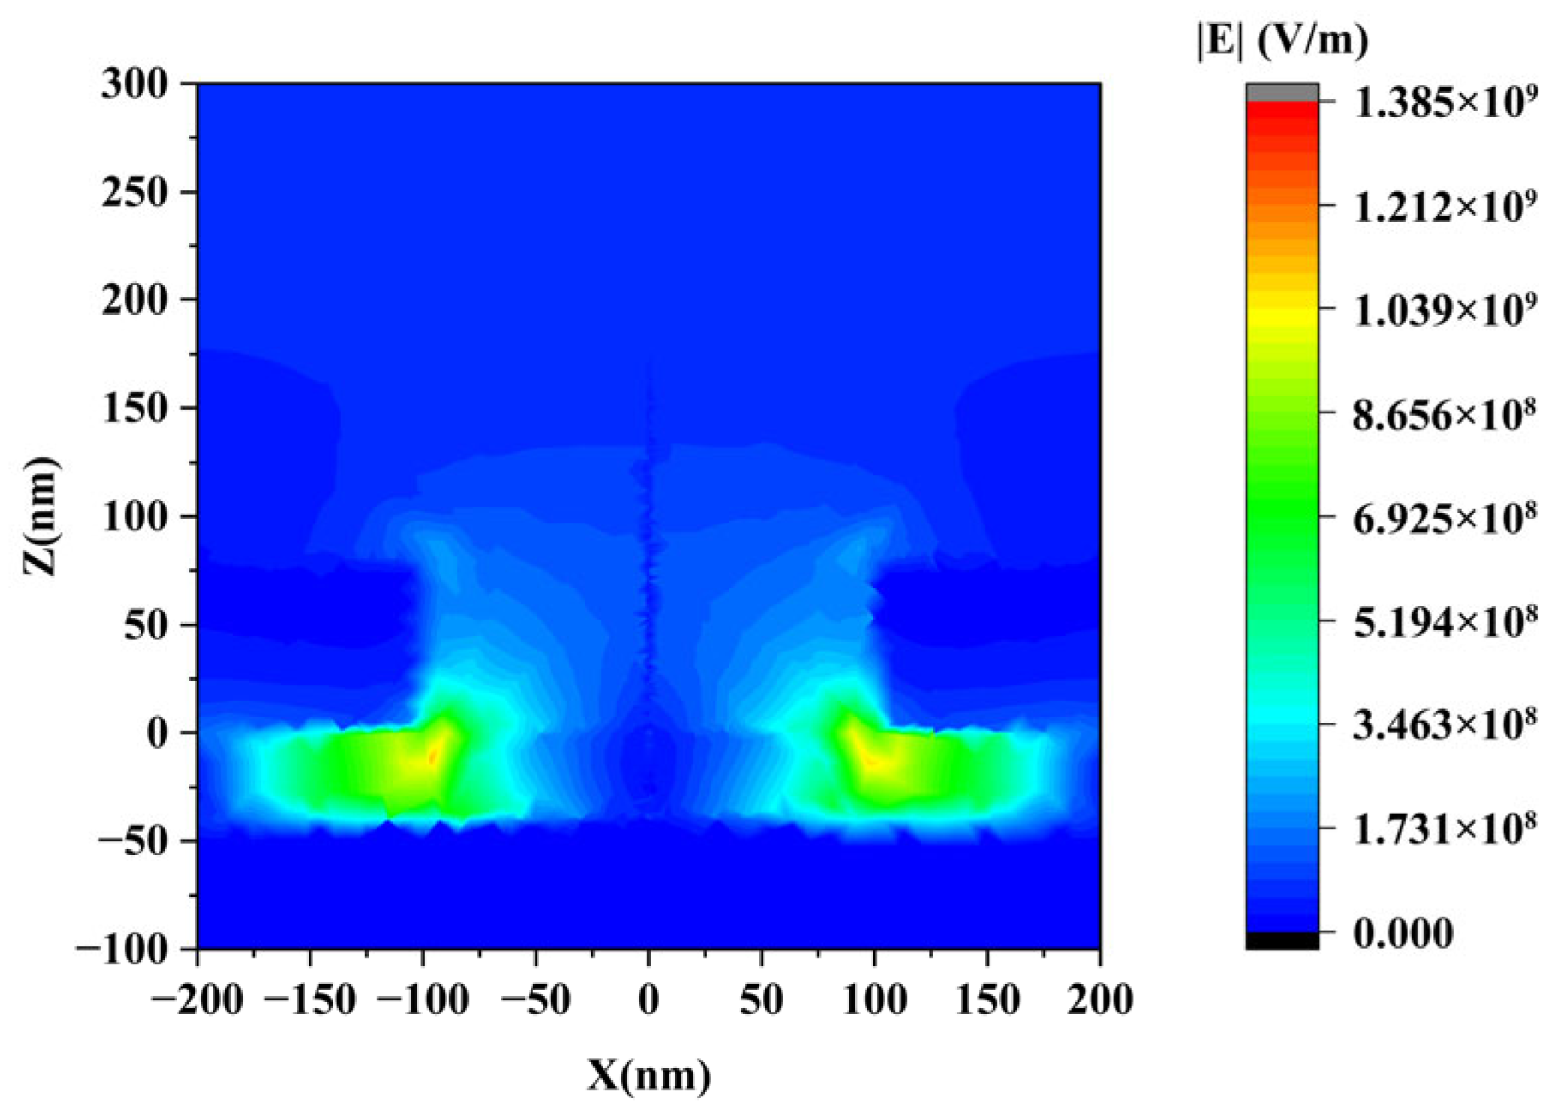
The electric-field distribution at RH = 90% is shown in Figure 3. The enhanced electric field is mainly concentrated at the edges of the top Au nanoholes, within the PVA interlayer, and near the upper surface of the bottom Au film. In particular, strong field confinement appears in the interfacial region between the bottom of the nanoholes and the PVA layer. This indicates that the incident light first excites localized surface plasmons at the edges of the top nanoholes, then couples with the induced charges in the bottom continuous Au film, and forms strong charge accumulation within the 30 nm thick PVA interlayer. Because this coupled resonance is strongly confined in the PVA region, the Au–PVA–Au nanocavity is highly sensitive to changes in both the dielectric parameters and the geometric dimensions of the PVA interlayer.
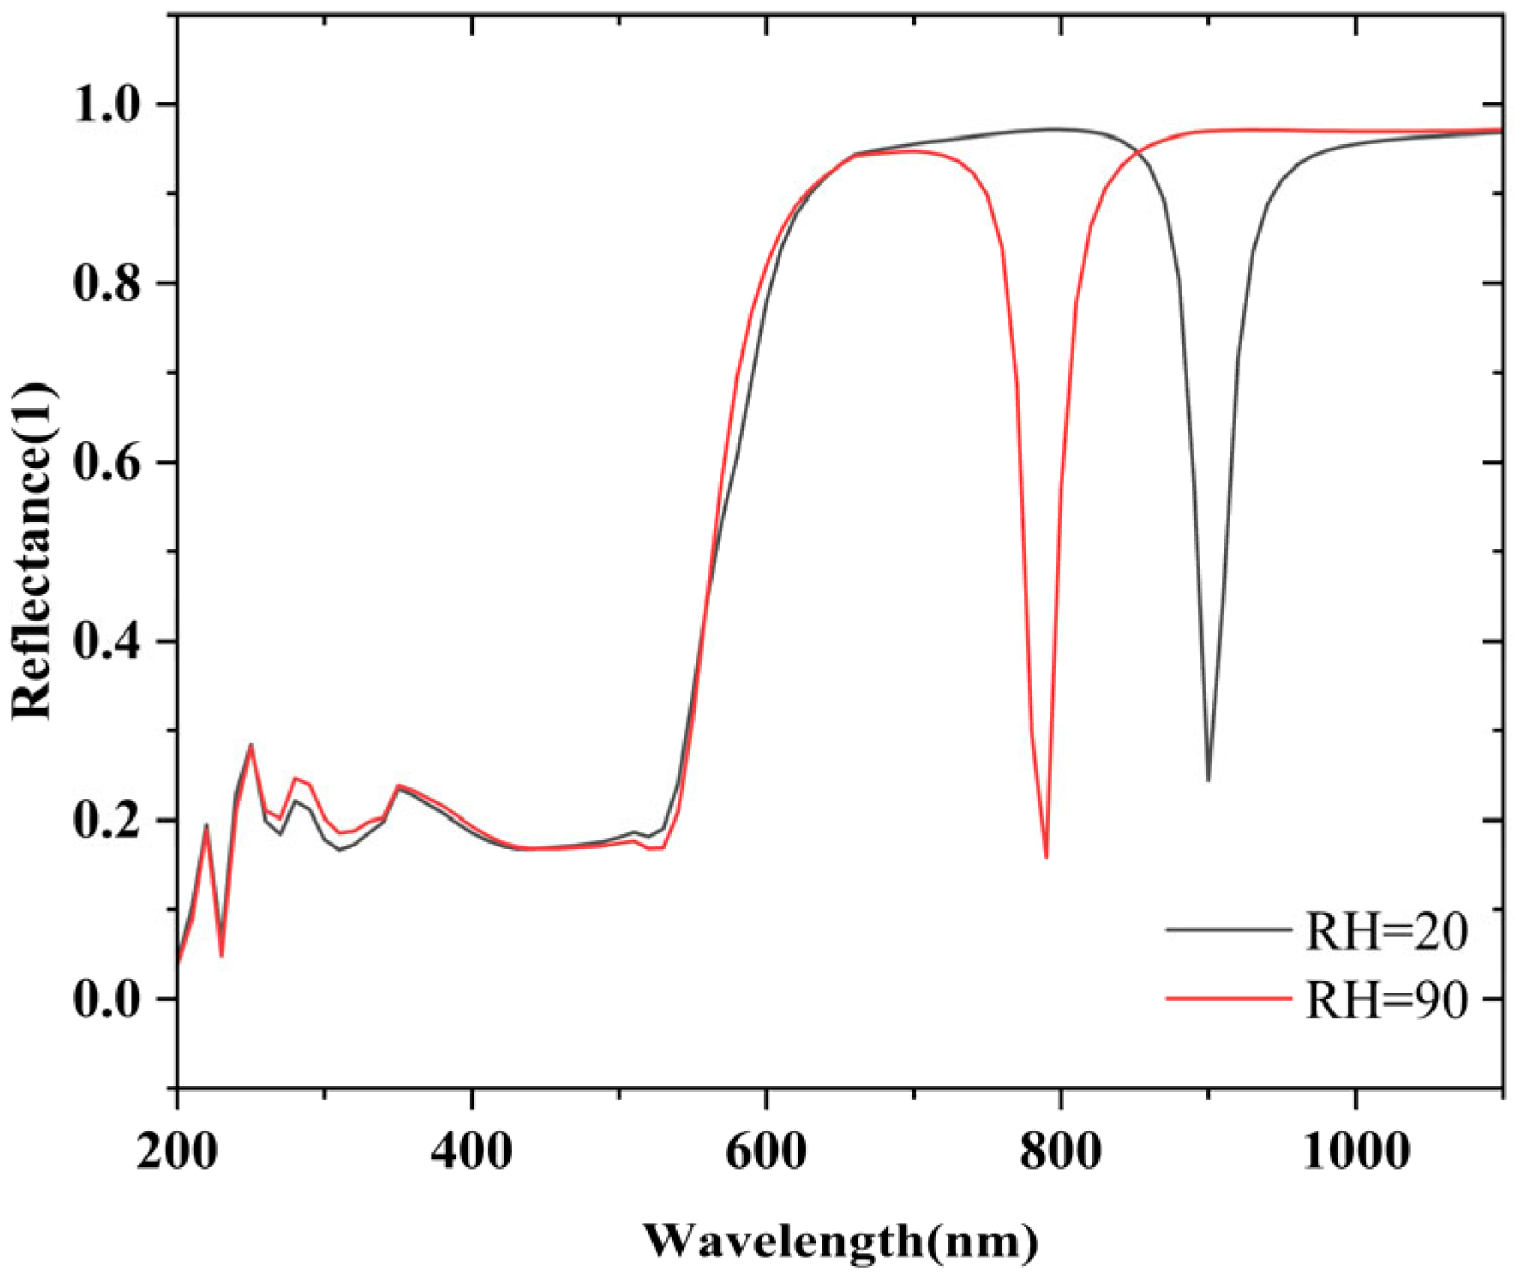
As shown in Figure 4, when the relative humidity increases from 20%RH to 90%RH, the reflection resonance dip of the device shifts from approximately 900 nm to 790 nm. This blueshift indicates a pronounced spectral response to humidity variation. The shift occurs because moisture absorption modifies both the refractive index and the thickness of the PVA interlayer, thereby changing the resonance condition of the Au–PVA–Au MDM nanocavity. Since the resonance dip positions at different humidity levels are clearly distinguishable, ambient humidity can be effectively detected by tracking the resonance wavelength shift in the reflection spectrum.
The humidity-sensing mechanism of this structure mainly originates from the synergistic modulation of the coupled gap-plasmon resonance by the refractive-index change and thickness swelling of the PVA interlayer after moisture absorption. The peak shift can be expressed as:
Δ λ r e s = λ r e s R I P V A Δ R I P V A + λ r e s d P V A Δ d P V A
where Δ R I P V A denotes the change in the refractive index of the PVA interlayer, and Δ d P V A denotes the change in the thickness of the PVA interlayer. In summary, the Au–PVA–Au nanometer sandwich structure proposed in this chapter can improve the response sensitivity of the device to the moisture absorption behavior of PVA through the enhanced gap electric field and the coupling effect between the metal layers, thereby enabling efficient detection of changes in ambient humidity. Its optical properties will be discussed in detail in the following sections.

3. Optimization Design of Sensor Structure

3.1. Effect of Array Period on the Resonance Response

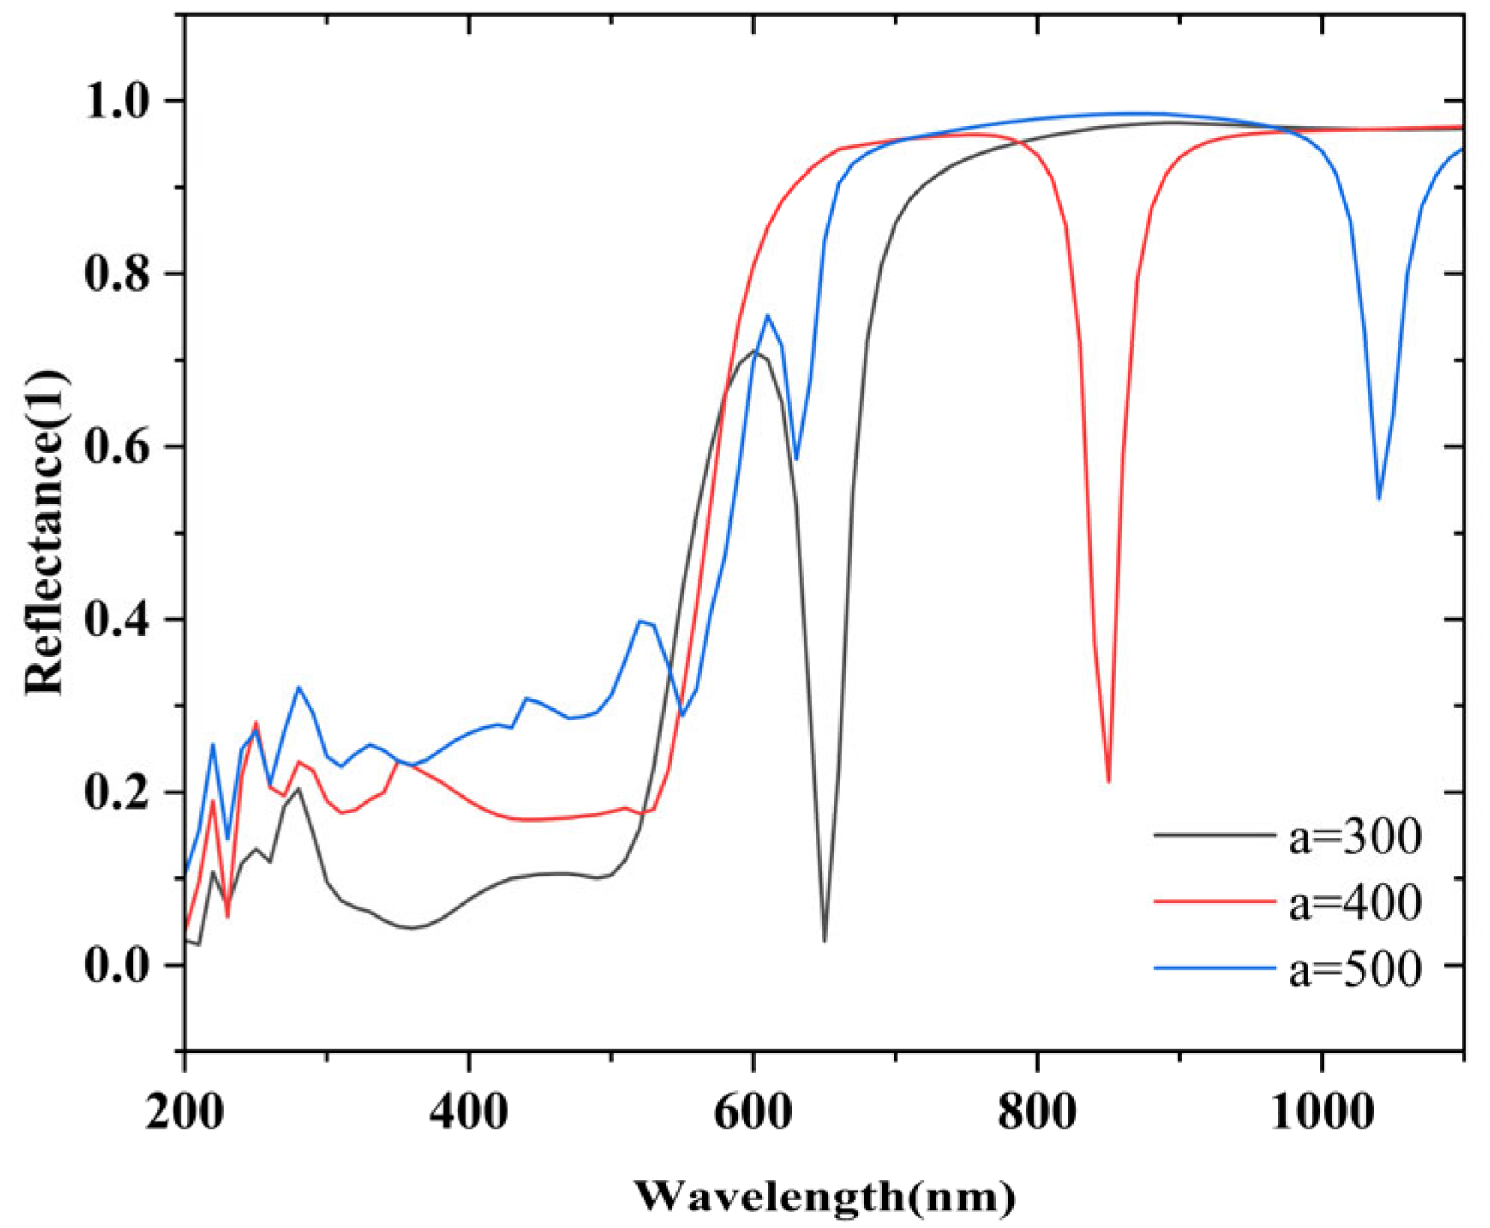
To determine a suitable operating period for the Au nanohole array, the effect of the array period a on the reflection spectrum was investigated. During this analysis, the aperture diameter was fixed at D = 200 nm, while the array period varied from 300 nm to 500 nm.
As shown in Figure 5, when the period increased from 300 nm to 500 nm, the main long-wavelength resonance of the structure shifted progressively toward longer wavelengths. This trend is consistent with the well-established redshift of lattice-related resonances induced by an increase in the period. When a = 300 nm, the main reflection dip was located in the shorter-wavelength range. When a = 500 nm, the resonance wavelength continued to shift toward longer wavelength. However, the spectrum already exhibited more pronounced multimode features, which are unfavorable for the stable identification and subsequent tracking of a single resonance dip. By comparison, when a = 400 nm, the structure formed a relatively distinct main reflection dip near 845 nm, with a moderate resonance position and a more regular spectral profile. Therefore, a = 400 nm was selected as the baseline array period for the subsequent humidity-response analysis.

3.2. Effect of Aperture Diameter on the Resonance Response

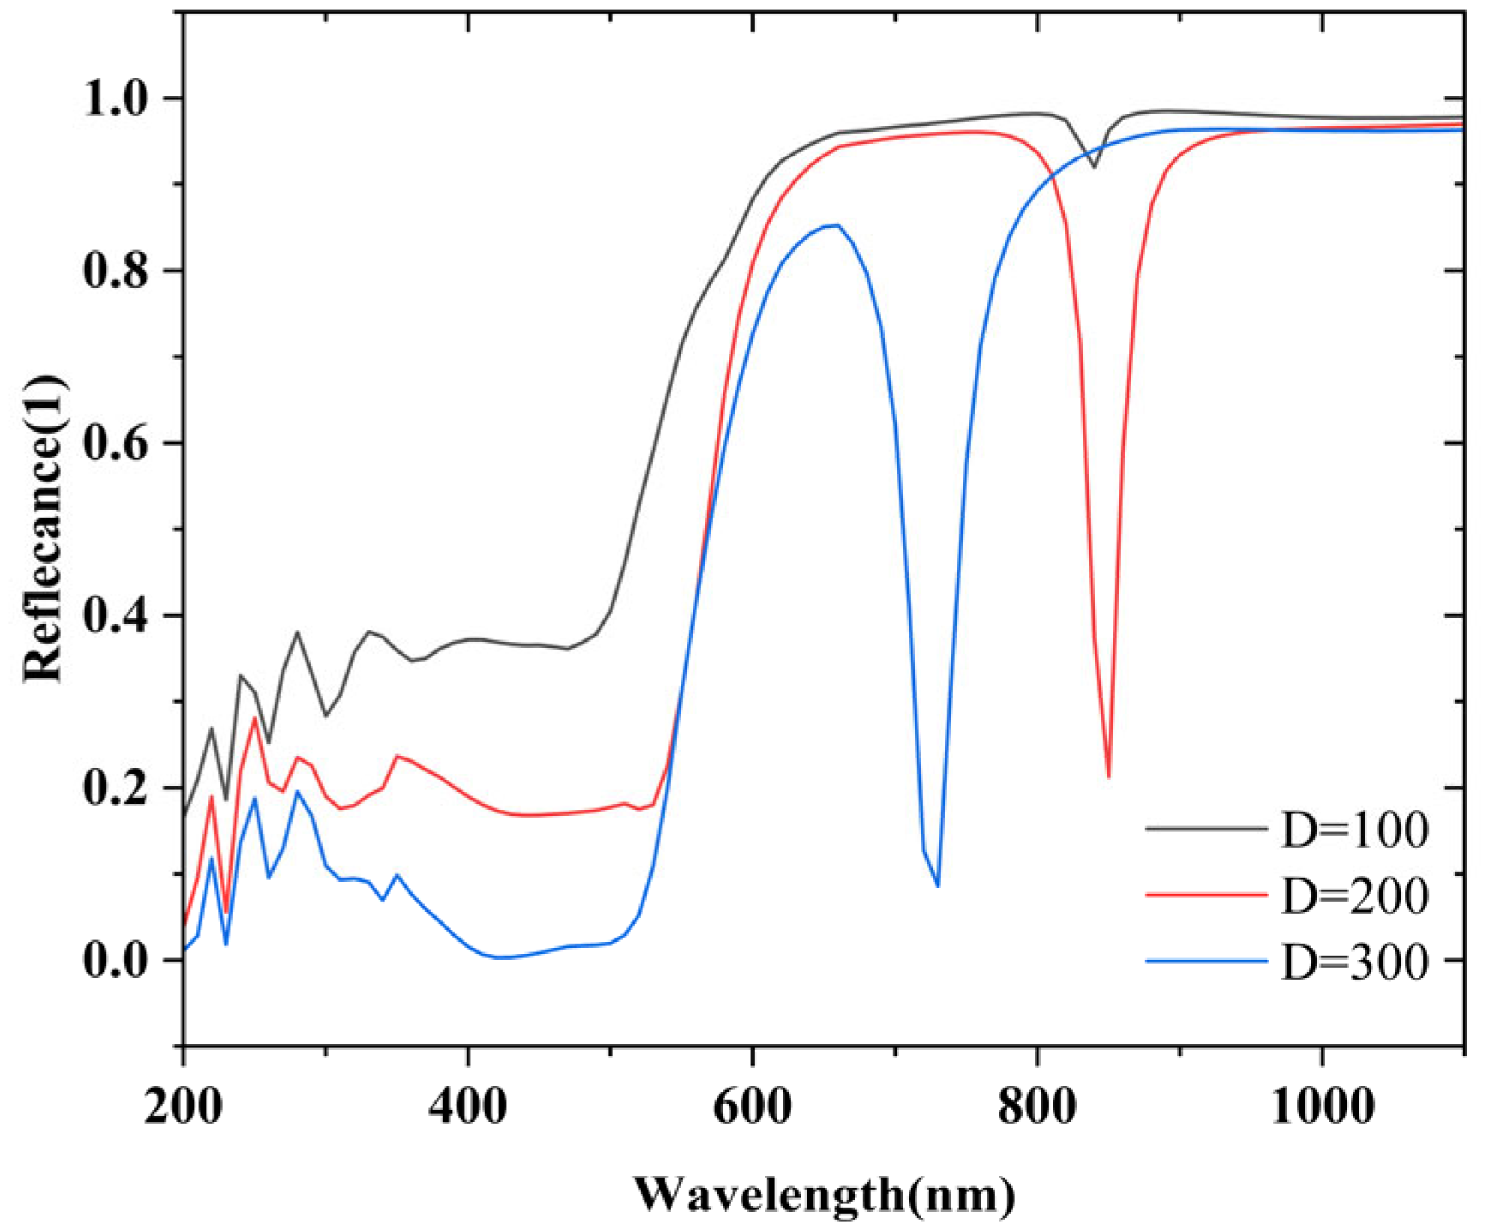
After the array period was determined, the aperture diameter D was analyzed with a = 400 nm. The aperture diameter mainly affects the excitation efficiency of the localized plasmonic mode at the nanohole edge and its coupling with the cavity mode. To provide a more quantitative basis for evaluating the coupling strength, the resonance dip depth was defined as η dip = 1 R min , where R min is the minimum reflectance at the main resonance dip.
As shown in Figure 6, the aperture diameter strongly affects the resonance dip depth. For D = 100 nm, the minimum reflectance is R min = 0.919, corresponding to a small dip depth of η dip = 0.081, indicating weak excitation of the cavity-coupled plasmonic mode. When D = 200 nm, R min decreases to 0.213 and η dip increases to 0.787, showing a much more distinct resonance feature and stronger coupling. For D = 300 nm, although the aperture is larger, the resonance shifts markedly toward shorter wavelengths and the spectral profile becomes broader, which reduces the distinguishability of the main resonance dip. Therefore, D = 200 nm was selected as the baseline aperture diameter because it provides a better balance among resonance depth, spectral clarity, and operating wavelength. The optimized geometric parameters were a = 400 nm and D = 200 nm for the following humidity-response simulations.

3.3. Influence of Fabrication Tolerance on Resonance Response

Practical fabrication may introduce deviations during Au film deposition, PVA spin coating, and electron-beam lithography. These deviations can change the PVA spacer thickness, Au layer thickness, aperture diameter, and array period. This study therefore performed a fabrication tolerance analysis to evaluate the robustness of the optimized Au–PVA–Au nanohole sandwich structure.
The nominal structure used d0 = 30 nm, tAu = 80 nm, D = 200 nm, and a = 400 nm. The tolerance analysis varied one parameter at a time while keeping the other parameters fixed. The tested values were d0 = 28–32 nm, tAu = 75–85 nm, D = 190–210 nm, and a = 390–410 nm. The simulations calculated the reflection spectra at RH = 60% and extracted the corresponding resonance wavelengths. Table 1 summarizes the tolerance conditions and resonance wavelengths.
The PVA thickness tolerance mainly changes the spacer geometry and near-field coupling between the upper Au nanohole array and the lower Au film. The Au thickness tolerance mainly affects optical loss, field penetration, and resonance linewidth. The aperture diameter tolerance affects the excitation efficiency of the localized plasmonic mode, while the array-period tolerance directly changes the lattice-related resonance condition.
Table 1 shows that different fabrication deviations cause different resonance-wavelength shifts. The array period produces the largest deviation, with Δ λ = 20 nm when a varies from 390 nm to 410 nm. The PVA spacer thickness also shows a noticeable influence on the resonance position, with Δ λ = 15 nm for d0 = 28 nm and 32 nm. The Au thickness and aperture diameter produce smaller deviations, with Δ λ = 5 nm. The resonance feature remains identifiable within the investigated tolerance range, and practical wavelength offsets can be compensated through device-specific spectral calibration.

4. Results and Discussion

4.1. Reflectance Spectral Response Characteristics Under Different Relative Humidity

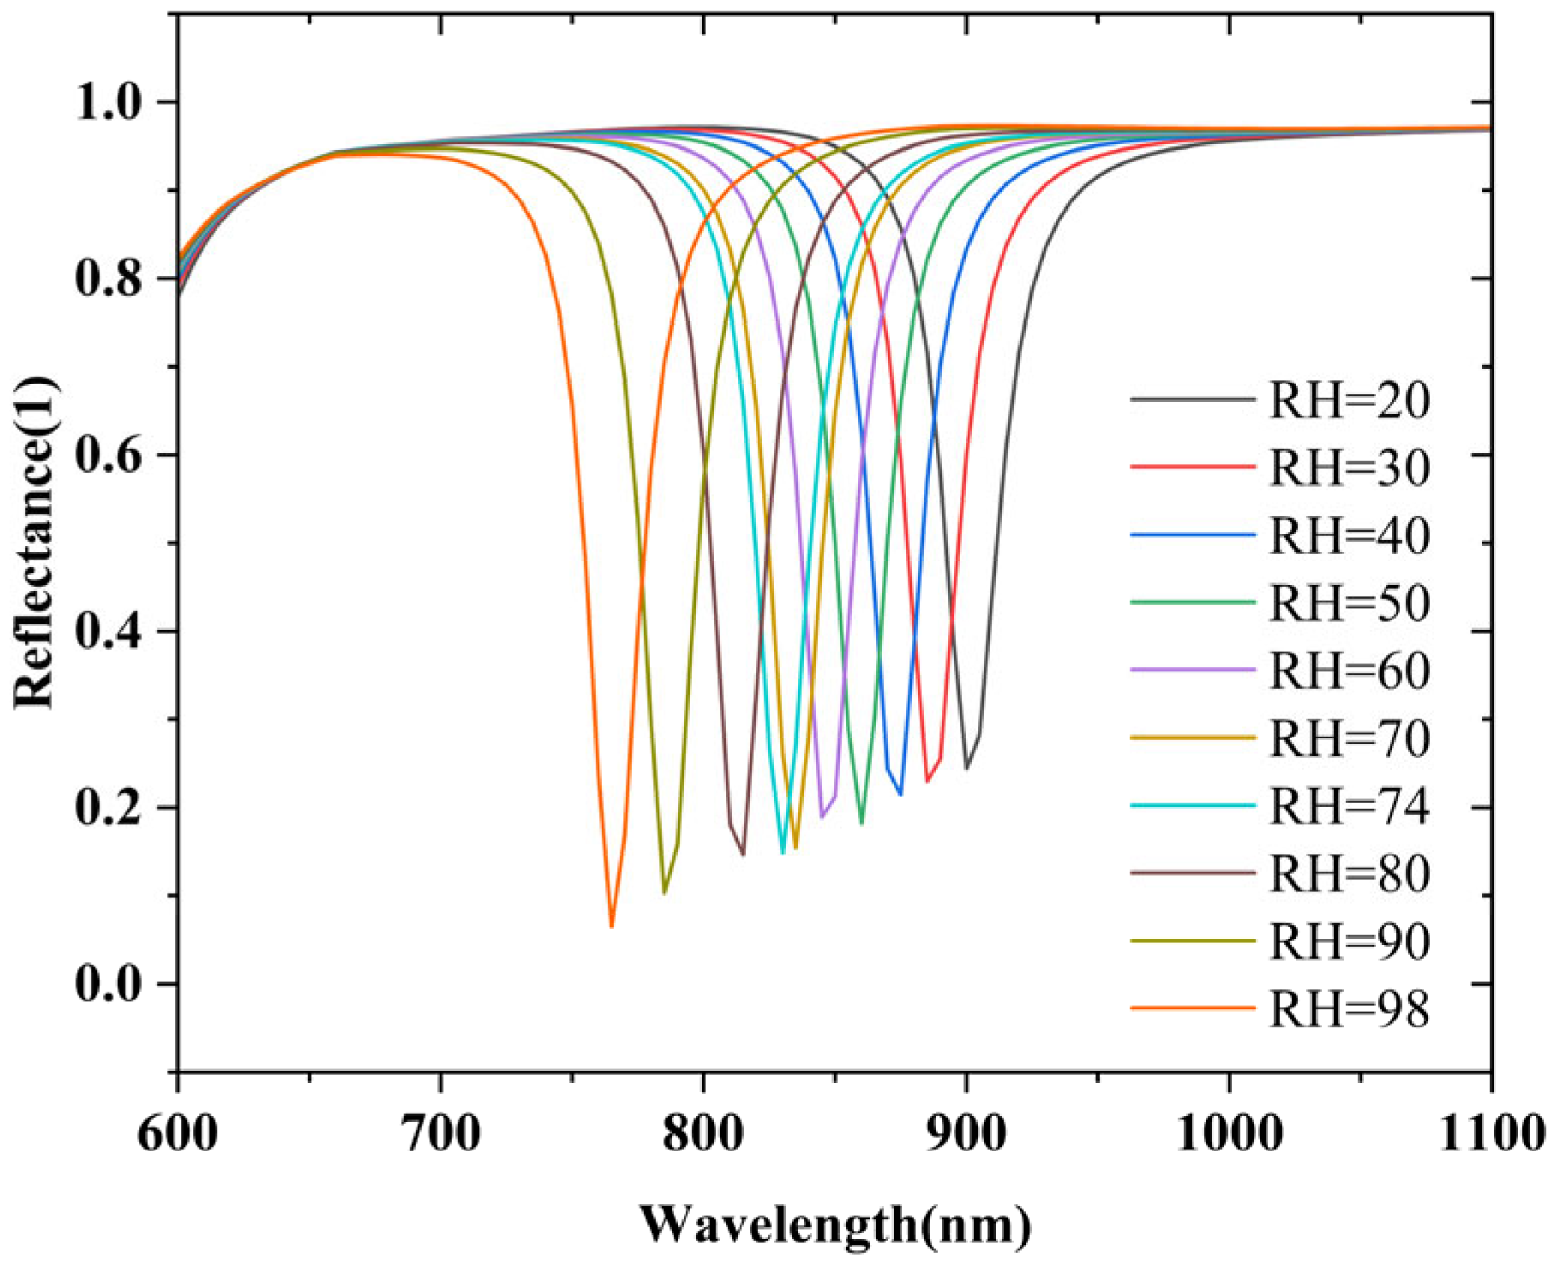
A parametric simulation analysis of the reflection spectra of the Au–PVA–Au nanocavity structure was conducted under different relative humidity conditions. RH values were set to 20%, 30%, 40%, 50%, 60%, 70%, 74%, 80%, 90%, and 98%. Meanwhile, the refractive index and thickness of the PVA layer were synchronously introduced into the model according to the aforementioned piecewise functions, in order to characterize the synergistic variation in the optical parameters and geometric dimensions of PVA during moisture absorption. As shown in Figure 7, the device essentially operates in a reflection-type plasmonic resonance mode. Within the RH range of 20–98%, the total resonance wavelength shift is approximately 135 nm, corresponding to an average wavelength sensitivity of about 1.7 nm/%RH. After 74%RH, the blue shift in the resonance dip becomes more rapid. In the RH range of 90–98%, the average wavelength sensitivity reaches approximately 2.5 nm/%RH, indicating that the sensing response is more pronounced in the high-humidity region.
This response characteristic is consistent with the parameter variation pattern assigned to the PVA material in this study. In the RH range of 20–74%, the water absorption of PVA remains relatively low, and its refractive index decreases gradually while the cavity thickness increases slowly; therefore, the resonance peak shift is relatively moderate. In contrast, in the RH range of 74–98%, the moisture absorption of PVA is enhanced, the decreasing rate of the refractive index becomes significantly greater, and the cavity thickness enters a faster expansion stage. As a result, the effective optical environment of the structure changes more markedly, thereby increasing the shift rate of the resonance peak.

4.2. Humidity-Sensing Performance of Sandwich Structure

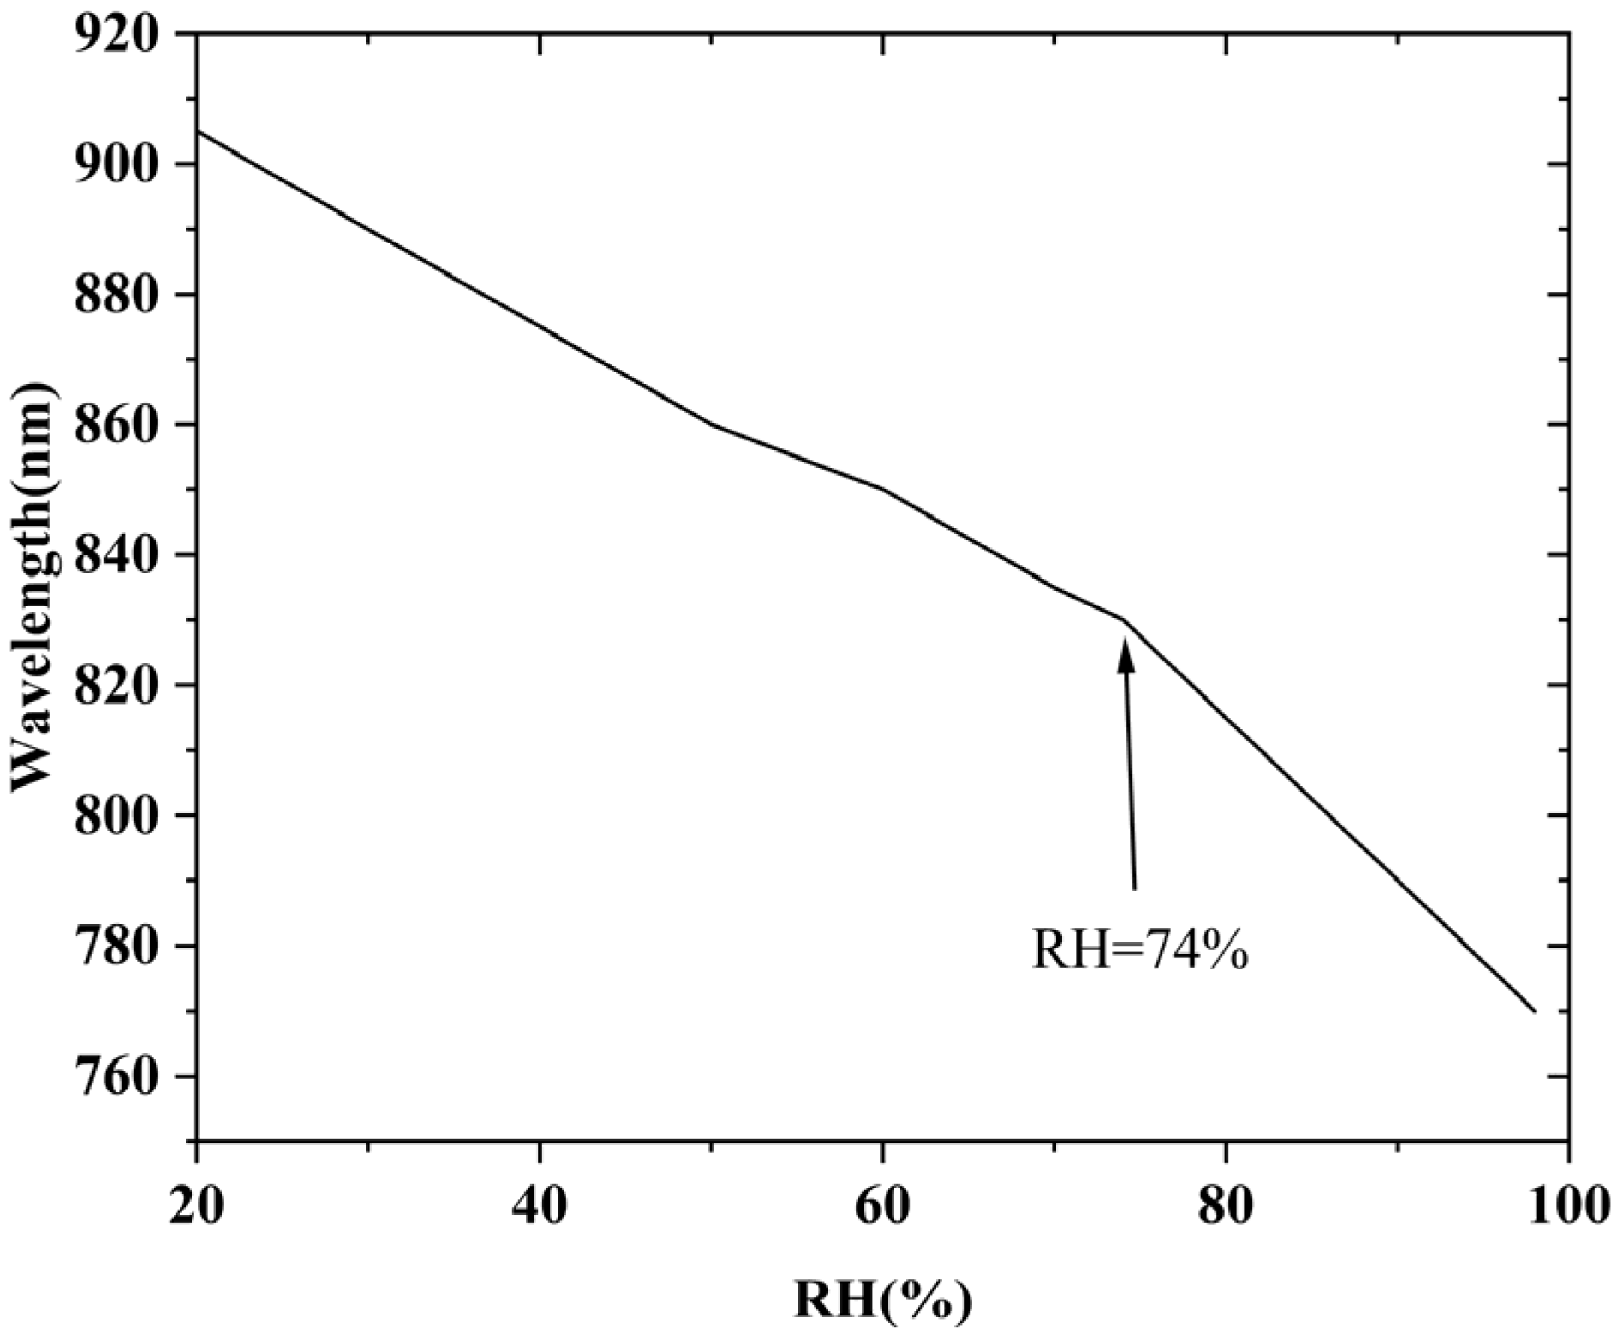
To quantitatively evaluate the humidity-sensing capability of the designed Au–PVA–Au nanocavity structure, the central wavelengths corresponding to the main resonance dips in the reflection spectra under different relative humidity conditions were extracted, and the relationship curve between the resonance wavelength and the ambient relative humidity was established, as shown in Figure 8. In the range from 20%RH to 98%RH, the resonance wavelength continuously decreases with increasing relative humidity, exhibiting an overall monotonic blue shift. This structure is able to stably convert changes in ambient humidity into spectrally resolvable wavelength-shift signals, indicating a good basis for humidity sensing. From the shape of the curve, the relationship between resonance wavelength and humidity does not satisfy a single linear relation, and a relatively obvious change in slope appears around 74%RH. Based on this feature, piecewise linear fitting was performed using 74%RH as the boundary point. The fitting result for the 20–74%RH range is:
λ = 1.3857 R H + 931.5238 R 2 = 0.9969
The fitting result for the 74–98%RH range is:
λ = 2.5000 R H + 1015.0000 R 2 = 0.9999
Here, λ denotes the resonance wavelength, with the unit of nm, and RH denotes the ambient relative humidity, with the unit of %. According to the fitted slopes, the wavelength sensitivities of the structure in the low-to-medium humidity region and the high-humidity region are 1.3857 nm/%RH and 2.5000 nm/%RH, respectively. Both fitting segments exhibit high coefficients of determination, and in particular, the R2 in the high-humidity region reaches 0.9999. The resonance wavelength of the device is approximately 830 nm near RH = 74%, with a full width at half maximum of about 19 nm and a Q factor of 43.7. The FOM values in the low-to-medium humidity region and the high-humidity region are 0.0729/%RH and 0.1316/%RH, respectively. The higher FOM in the high-humidity region indicates that it not only exhibits a larger peak shift but also maintains better overall readout quality under a relatively narrow linewidth condition. The slope change near 74%RH is mainly related to the piecewise PVA parameterization defined in Section 2.2. The present model uses 74%RH as the boundary between the low-to-medium and high-humidity regions for both PVA refractive index and thickness. This transition therefore reflects the enhanced humidity response of the PVA model rather than an independent structural discontinuity. Above 74%RH, the PVA refractive-index decrease and thickness swelling both become faster, which strengthens the modulation of the dielectric environment and cavity coupling. The resonance wavelength therefore shows a higher fitted sensitivity in the high-humidity region.
Overall, the structure maintains a monotonic blue shift over the RH range of 20–98% and exhibits a stable mapping relationship as well as good potential for quantitative calibration. The related main parameters are listed in Table 2.
From the viewpoint of wavelength-based readout, the large resonance shift of approximately 135 nm over the RH range of 20–98% improves the spectral distinguishability of different humidity levels. However, this also requires a broadband light source and a near-infrared detector or spectrometer covering the operating wavelength range with sufficient spectral resolution. Therefore, practical implementation should consider the bandwidth and resolution of the optical readout system. From the perspective of sensing applications, this structure exhibits several useful characteristics. First, the device uses wavelength demodulation, and the resonance-position information is less dependent on the absolute incident-light intensity. This readout mode can improve tolerance to light-source fluctuations and power drift. Second, the resonance wavelength maintains a monotonic variation over the wide RH range of 20–98%, without peak reversal or multivalued correspondence. This behavior provides a clear mapping relationship for continuous humidity monitoring. Third, the piecewise fitting results show good linearity in both humidity regions, while the high-humidity region exhibits higher sensitivity and linearity. This feature is beneficial for quantitative humidity calibration, especially in high-humidity detection. Overall, the proposed Au–PVA–Au nanocavity structure realizes a stable, monotonic, and calibratable wavelength response over a wide humidity range. This result provides a basis for the subsequent design and parameter optimization of reflective nanophotonic humidity sensors.

4.3. Decoupling Analysis of PVA Refractive–Index Change and Thickness Swelling

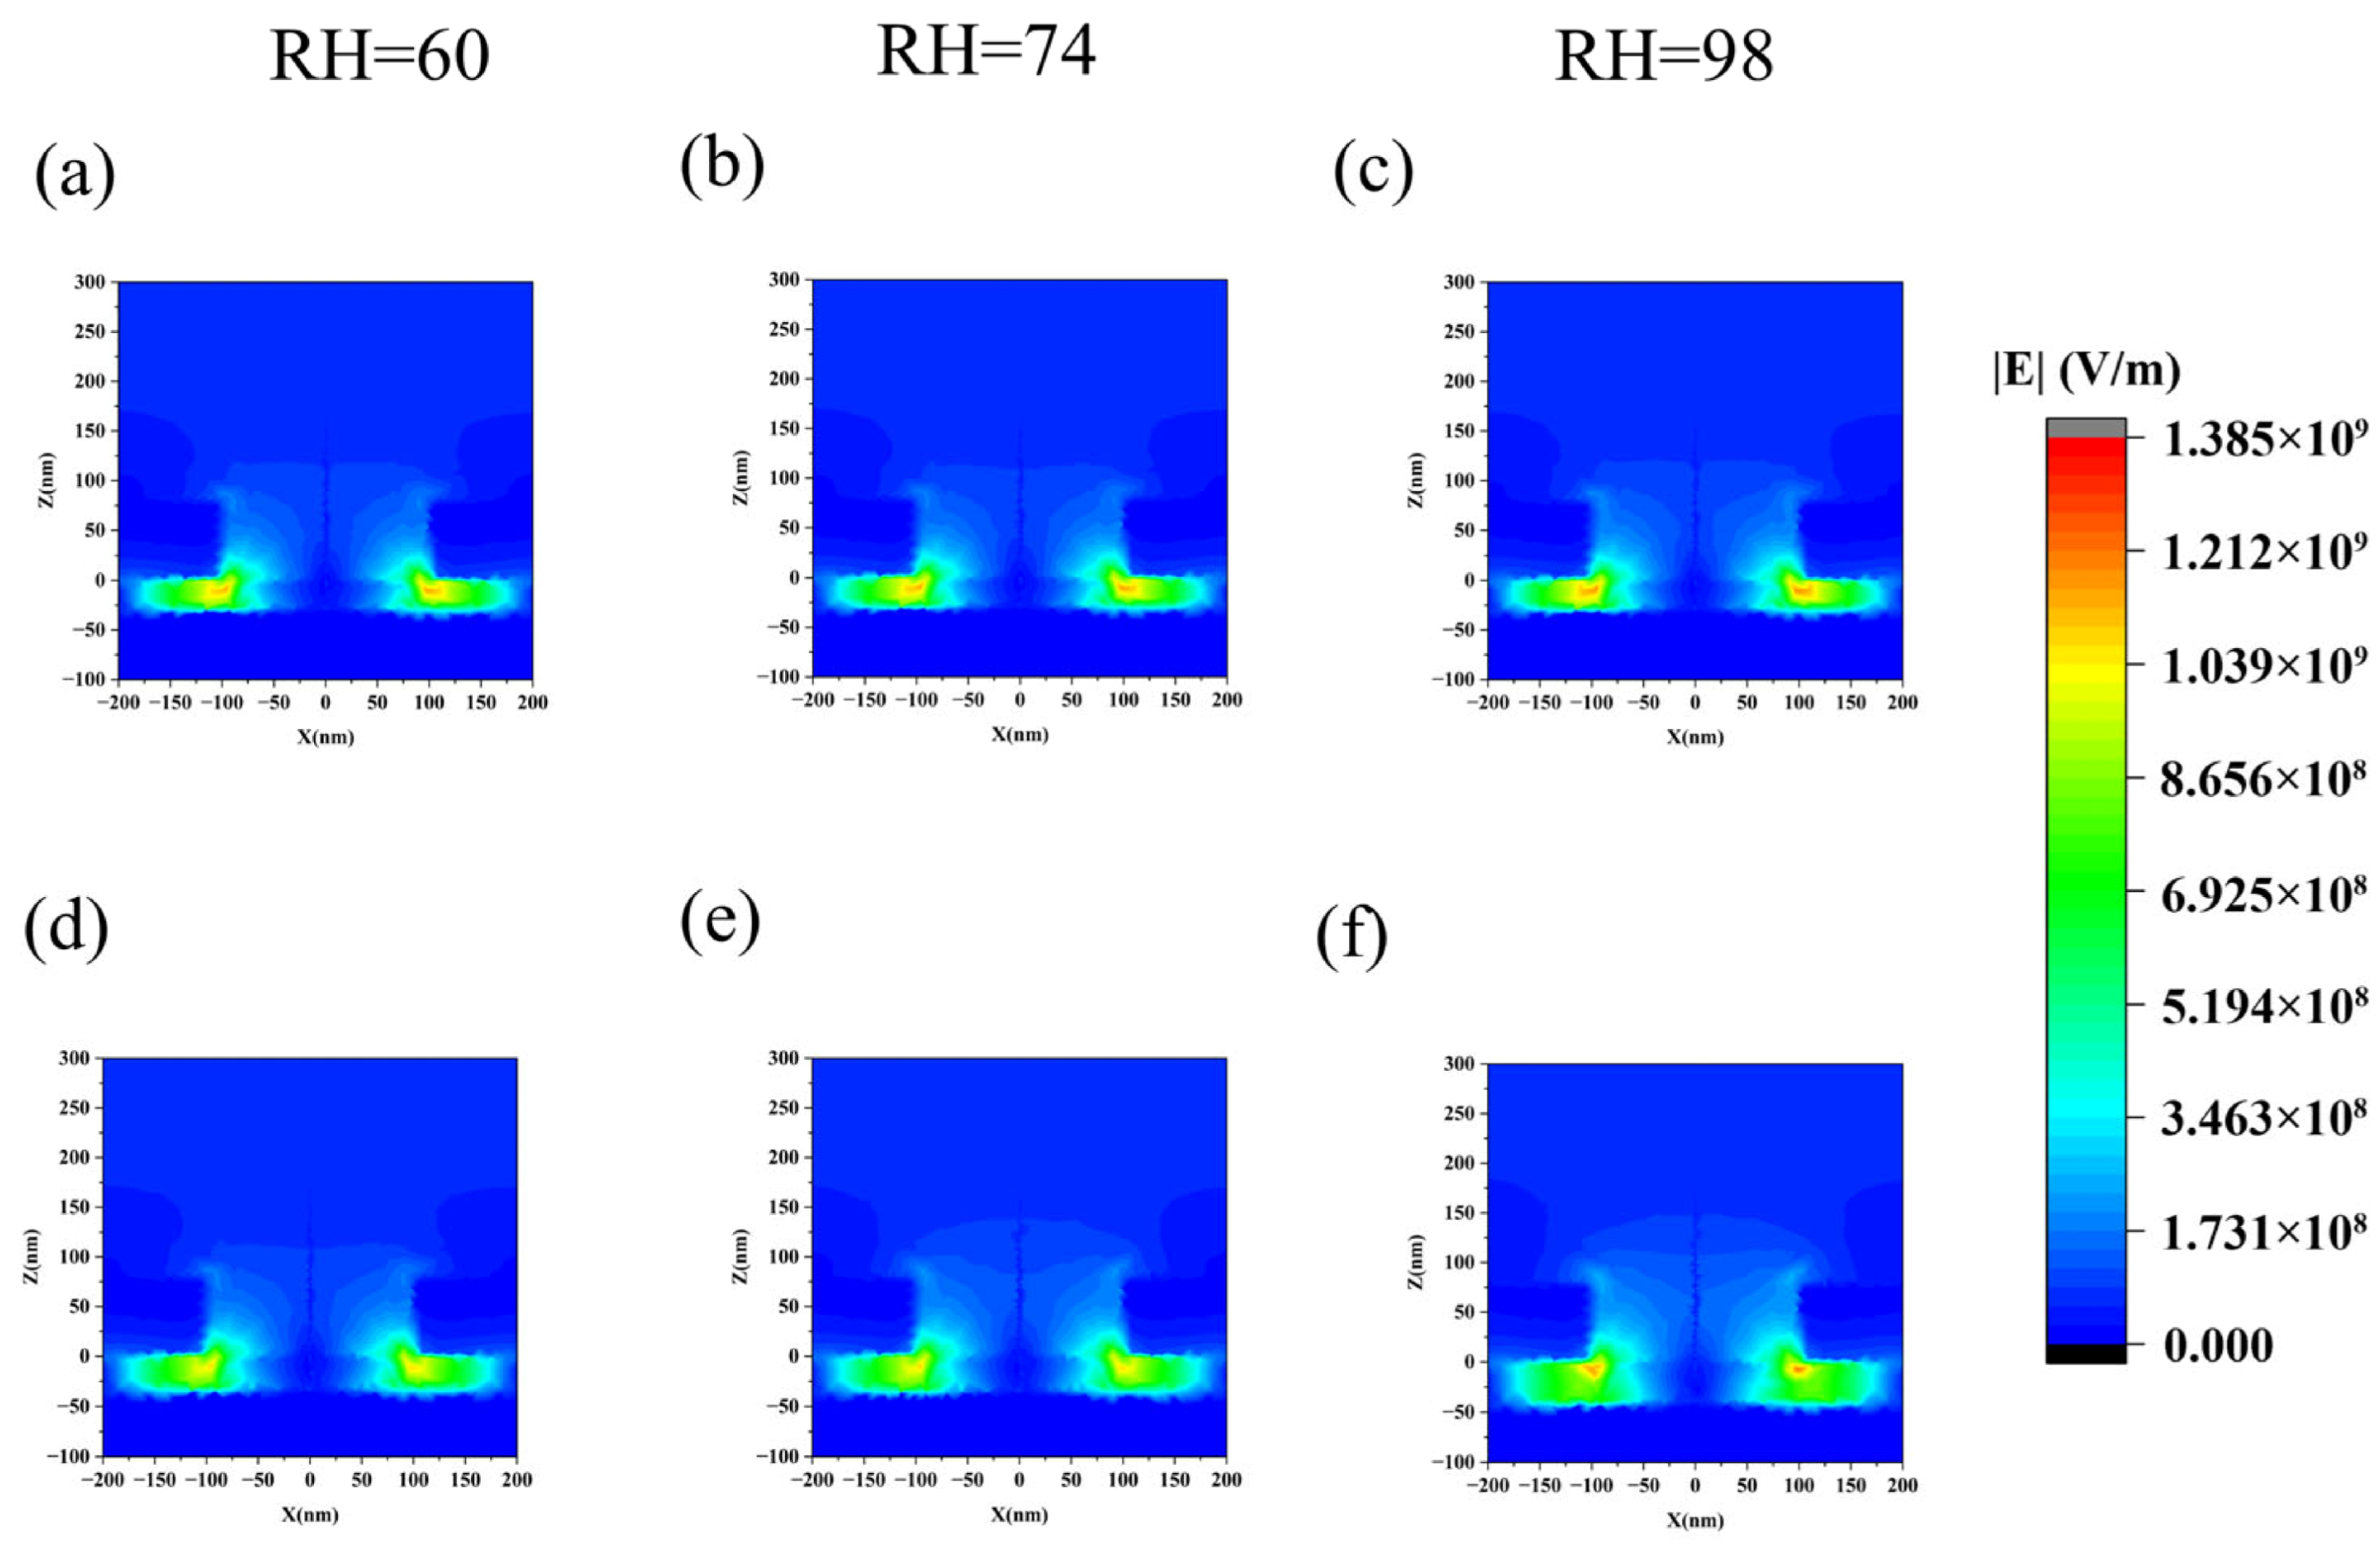
To decouple the effects of PVA refractive-index variation and thickness swelling, the electric-field distributions were first compared under two modeling conditions: refractive-index variation with fixed PVA thickness and simultaneous refractive-index variation and thickness swelling. All electric-field maps in Figure 9 are plotted using the same electric-field amplitude scale from 0 to 1.385 × 10⁹ V/m, so that the field distributions under different RH values and modeling conditions can be compared consistently. This comparison helps clarify how PVA swelling modifies the cavity-coupled plasmonic mode before the resonance-wavelength shifts are quantitatively analyzed.
As shown in Figure 9, at RH = 60%, 74%, and 98%, regardless of whether the thickness variation is considered, the strong electric field remains mainly localized near the nanohole edge and in the region adjacent to the Au–PVA–Au cavity, which can be attributed to the hybrid plasmonic resonance mode. For the case considering only the refractive-index variation, as shown in Figure 9a–c, the overall field-distribution profiles remain similar under different humidity conditions, and the variation in field position is relatively small. This indicates that the effect of humidity in this case is mainly reflected in the modification of the resonance condition by the change in the dielectric constant of PVA.
When the thickness variation is also taken into account, as shown in Figure 9d–f, the strong-field region is still concentrated near the nanohole edge and the cavity interface, but the field-distribution range within the cavity and the modal profile near the aperture show additional variations compared with the fixed-thickness case. This indicates that thickness expansion changes the spacing between the upper and lower metal layers, the degree of modal overlap, and the near-field coupling strength. Therefore, for this cavity structure, PVA is not only a humidity-sensitive functional layer, but also an important cavity dielectric that affects the modal coupling strength and resonance position.
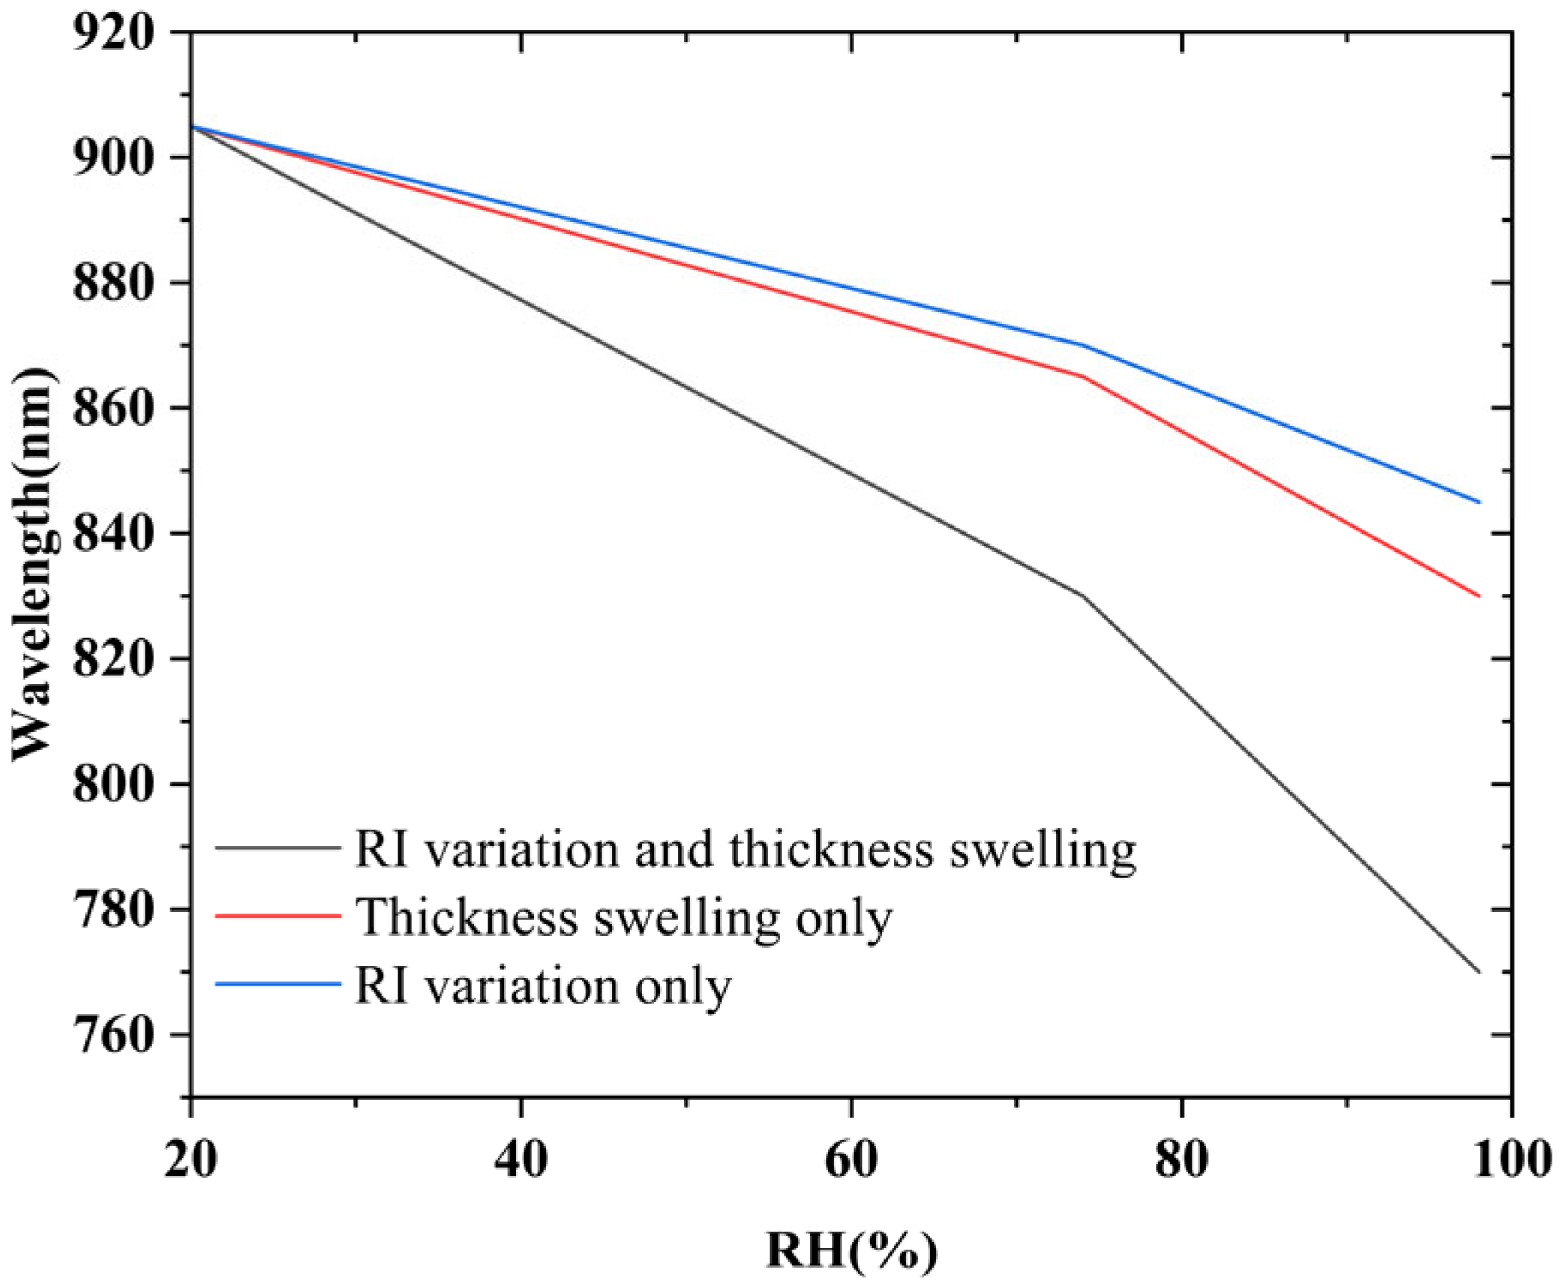
Three cases were compared to quantify the contributions of PVA refractive-index variation and thickness swelling: (i) refractive-index variation only, with the PVA thickness fixed at 30 nm; (ii) thickness swelling only, with the PVA refractive index fixed at 1.49; and (iii) simultaneous refractive-index variation and thickness swelling. Figure 10 shows that all three cases exhibit a blueshift as RH increases from 20% to 98%. This result indicates that both PVA refractive-index decrease and thickness swelling contribute to the humidity response. Table 3 summarizes the extracted resonance wavelengths. The refractive-index-only case shifts from 905 nm to 845 nm, giving a blueshift of 60 nm. The thickness-swelling-only case shifts from 905 nm to 830 nm, giving a blueshift of 75 nm. The full model shifts from 905 nm to 770 nm, giving the largest blueshift of 135 nm.
The full model produces the largest wavelength shift, confirming that the refractive-index decrease and thickness swelling act in the same blueshift direction in the Au–PVA–Au structure. Within the current parameter range, the decrease in PVA refractive index weakens the dielectric loading effect in the cavity region, while the increase in PVA thickness enlarges the spacing between the upper and lower metal layers, weakens the interlayer near-field coupling, and reduces the effective refractive index of the hybrid mode. The PVA thickness variation therefore serves as an additional resonance-modulation mechanism that enhances the humidity response. This quantitative comparison is also consistent with the electric-field analysis above, where PVA swelling modifies the cavity coupling and modal profile.

4.4. Sensitivity Analysis of the PVA Swelling Ratio

To examine whether the main sensing trend depends critically on the assumed swelling amplitude of the PVA interlayer, a sensitivity analysis was performed by varying the maximum swelling ratio S max . The initial PVA thickness was fixed at d 0 = 30 nm at RH = 20% for all cases. Three maximum swelling ratios, namely 5%, 20%, and 40%, were considered. The 40% case corresponds to the swelling assumption used in the main model, while the 5% and 20% cases represent weaker swelling scenarios. The humidity-dependent PVA thickness was defined as:
d PVA ( R H ) = d 0 [ 1 + S max F ( R H ) ]
where d 0 = 30 nm and S max = 5%, 20%, and 40%. Here, F ( R H ) is a normalized piecewise swelling function:
F ( R H ) = R H 20 2 ( 74 20 ) , 20 % R H 74 % 0.5 + R H 74 2 ( 98 74 ) , 74 % < R H 98 %
where RH is expressed as a percentage value. Therefore, F ( R H ) increases from 0 at RH = 20% to 0.5 at RH = 74%, and further to 1 at RH = 98%. Accordingly, the PVA thicknesses at RH = 98% become 31.5 nm, 36 nm, and 42 nm for Smax = 5%, 20%, and 40%, respectively.
As summarized in Table 4, the resonance wavelength maintains a monotonic blueshift with increasing RH under all three swelling assumptions. When S max increases from 5% to 40%, the resonance wavelength at RH = 98% shifts from 820 nm to 770 nm, and the total blueshift increases from 85 nm to 135 nm. This indicates that a larger assumed PVA swelling amplitude enhances the resonance shift, the monotonic blueshift trend remains unchanged for all three cases.
Although the assumed swelling amplitude changes the total wavelength shift, the overall response trend remains stable. The 40% swelling case should therefore be regarded as a representative strong-swelling assumption used in the main model, rather than an exact experimental value for all 30 nm PVA films. The 5% and 20% cases further show that the proposed sensing mechanism remains valid under weaker assumed PVA swelling amplitudes. Therefore, the main qualitative conclusion is not critically dependent on the exact value of the assumed 40% swelling ratio, although the swelling amplitude affects the magnitude of the resonance shift.

4.5. Comparison with Reported Optical and Plasmonic Humidity Sensors

To place the proposed Au–PVA–Au nanohole sensor in context, Table 5 compares its performance with representative reported optical and plasmonic humidity sensors. Different sensors employ different sensitive materials, optical configurations, and readout mechanisms. Therefore, this comparison focuses on the RH range, sensitivity, and readout mode, which are the most consistently reported parameters among the selected studies.
As shown in Table 5, several fiber-based SPR/PVA humidity sensors have achieved higher absolute wavelength sensitivities than the present simulated structure. For example, the PVA-coated POF-SPR sensor reaches 10.15 nm/%RH in the 75–90%RH range, and the PVA-embedded Au-grating D-shaped fiber SPR sensor reaches 5.4 nm/%RH. Therefore, the main advantage of the proposed Au–PVA–Au nanohole sensor is not the highest absolute sensitivity.
The significance of the present design lies in its reflective planar nanoplasmonic configuration, wide simulated operating range of 20–98%RH, and ultrathin 30 nm PVA spacer layer. Compared with transmission-type fiber sensors, the planar reflective geometry is more suitable for chip-scale integration and compact optical readout. The 30 nm PVA spacer may also reduce the water-diffusion length. Although the top Au nanohole array partially covers the PVA spacer, the nanoholes may provide access pathways for water molecules to reach the PVA layer and diffuse laterally within the ultrathin spacer. However, the actual diffusion pathway, response/recovery time, and hysteresis still require experimental verification. In addition, the obtained Q factor and FOM values are moderate rather than exceptionally high, but they confirm that the resonance dip remains sufficiently narrow for wavelength-based readout. More importantly, this work explicitly analyzes the coupled effects of PVA refractive-index variation and thickness swelling, which provides a useful theoretical basis for reflective plasmonic humidity-sensor design. The proposed device is currently a numerical design, and future work should include experimental fabrication, calibration, dynamic response, hysteresis, and temperature cross-sensitivity evaluation.

5. Conclusions

This work investigates an Au–PVA–Au reflective plasmonic humidity sensor composed of a periodic gold nanohole array, a PVA spacer, and a continuous gold film. A humidity-dependent model incorporating both the refractive-index decrease and thickness swelling of PVA is established to analyze the resonance modulation of the metal–dielectric–metal nanocavity. The optimized structure forms a distinct reflection resonance dip in the near-infrared region. As the relative humidity increases from 20% RH to 98% RH, the resonance wavelength continuously blueshifts, with a total shift of approximately 135 nm. Piecewise linear fitting using 74% RH as the boundary gives sensitivities of 1.3857 nm/%RH in the 20–74% RH range and 2.5000 nm/%RH in the 74–98%RH range. At approximately 74%RH, the resonance wavelength, full width at half maximum, and quality factor are about 830 nm, 19 nm, and 43.7, respectively. The humidity response originates from the dual modulation of the cavity resonance by the optical and geometric variations in PVA. The refractive-index-only, thickness-swelling-only, and full models produce blueshifts of 60 nm, 75 nm, and 135 nm, respectively. PVA thickness swelling is therefore not merely an interference factor in this structure, but an additional modulation mechanism that enhances the humidity response. Under weaker swelling assumptions, the resonance wavelength still maintains a monotonic blueshift, while the total shift varies with the swelling amplitude. Compared with representative optical and plasmonic humidity sensors, the proposed structure is distinguished by its reflective planar configuration, wide humidity response range of 20–98%RH, and explicit utilization of the dual modulation induced by PVA refractive-index variation and thickness swelling. This work provides a design reference for reflective nanoplasmonic humidity sensors based on polymer-assisted cavity modulation.

Author Contributions

Conceptualization, L.Z. and J.L.; methodology, L.Z.; software, L.Z.; validation, L.Z., W.X. and D.D.; formal analysis, L.Z.; investigation, H.Y.; resources, L.Z.; data curation, L.Z.; writing—original draft preparation, L.Z.; writing—review and editing, D.D.; visualization, W.X.; supervision, J.Z.; project administration, J.Z.; funding acquisition, J.L. All authors have read and agreed to the published version of the manuscript.

Funding

This research was funded by National Natural Science Foundation of China, grant number 617011296.

Institutional Review Board Statement

Not applicable.

Data Availability Statement

The data presented in this study are available from the corresponding author upon reasonable request.

Conflicts of Interest

The authors declare no conflicts of interest.

Abbreviations

The following abbreviations are used in this manuscript:
SPRSurface Plasmon Resonance
RIRefractive Index
RHRelative Humidity
FWHMFull Width at Half Maximum
FOMFigure of Merit

References

  1. Wang, Y.; Wang, J.; Shao, Y.; Liao, C.; Wang, Y. Highly Sensitive Surface Plasmon Resonance Humidity Sensor Based on a Polyvinyl-Alcohol-Coated Polymer Optical Fiber. Biosensors 2021, 11, 461. [Google Scholar] [CrossRef] [PubMed]
  2. Wang, J. Surface Plasmon Resonance Humidity Sensor Based on Twisted Long Period Fiber Grating Coated with Tungsten Disulfide Film. Optik 2021, 236, 166616. [Google Scholar] [CrossRef]
  3. Teng, C.; Liu, Y.; Min, R.; Hu, X.; Qin, Z.; Deng, H.; Yuan, L. An Mmf–Hcf Reflective Spr Sensor for Simultaneous Measurement of Temperature and Relative Humidity. IEEE Sens. J. 2023, 23, 21301–21307. [Google Scholar] [CrossRef]
  4. Cheng, T.; Li, B.; Zhang, F.; Chen, J.; Zhang, Q.; Yan, X.; Zhang, X.; Suzuki, T.; Ohishi, Y.; Wang, F. A Surface Plasmon Resonance Optical Fiber Sensor for Simultaneous Measurement of Relative Humidity and Temperature. IEEE Sens. J. 2022, 22, 3246–3253. [Google Scholar] [CrossRef]
  5. Hua, G.; Cheng, J.; Chen, J.; Shen, Y.; Chang, J.; Ni, H. Relative Humidity Sensor Based on a Silver Nano-Grating Made from Dvd Discs. Appl. Opt. 2022, 61, 9099–9106. [Google Scholar] [CrossRef] [PubMed]
  6. Sgibnev, Y.; Tananaev, P.; Shelaev, A.; Yankovskii, G.; Baryshev, A. Relative Humidity Optical Sensor Based on Self-Assembled Gold Nanoparticles Covered with Nafion. Photonics 2023, 10, 975. [Google Scholar] [CrossRef]
  7. Zamarreño, C.R.; Hernaez, M.; Del Villar, I.; Matias, I.R.; Arregui, F.J. Tunable Humidity Sensor Based on Ito-Coated Optical Fiber. Sens. Actuators B Chem. 2010, 146, 414–417. [Google Scholar] [CrossRef]
  8. Miao, Y.; Liu, B.; Zhang, H.; Li, Y.; Zhou, H.; Sun, H.; Zhang, W.; Zhao, Q. Relative Humidity Sensor Based on Tilted Fiber Bragg Grating with Polyvinyl Alcohol Coating. IEEE Photonics Technol. Lett. 2009, 21, 441–443. [Google Scholar] [CrossRef]
  9. Liu, X.; Huang, S.; Tai, J.; Ni, H.; Dai, X.; Wang, X.; Chen, J.; Ho, H.-P.; Qiu, P.; Wang, Y. Rapid Wavelength Interval Selection Technology for Multi-Channel Intensity-Interrogation Surface Plasmon Resonance Imaging Sensing. Appl. Phys. Lett. 2024, 125, 163701. [Google Scholar] [CrossRef]
  10. Zeng, Y.; Wang, X.; Zhou, J.; Miyan, R.; Qu, J.; Ho, H.-P.; Zhou, K.; Gao, B.Z.; Shao, Y. Phase Interrogation Spr Sensing Based on White Light Polarized Interference for Wide Dynamic Detection Range. Opt. Express 2020, 28, 3442–3450. [Google Scholar] [CrossRef]
  11. Maleki, M.J.; Soroosh, M. A Low-Loss Subwavelength Plasmonic Waveguide for Surface Plasmon Polariton Transmission in Optical Circuits. Opt. Quantum Electron. 2023, 55, 1266. [Google Scholar] [CrossRef]
  12. Li, Y.; Yu, Y.; Lai, K.; Han, Y.; Gao, F.; Zhang, B.; Shvets, G. Mode-Selective Single-Dipole Excitation and Controlled Routing of Guided Waves in a Multi-Mode Topological Waveguide. Appl. Phys. Lett. 2022, 120, 221702. [Google Scholar] [CrossRef]
  13. Awad, M.; Workie, T.B.; Bao, J.-F.; Hashimoto, K.-Y. Three-Channel Acoustic Wave Filter in a Phononic Crystal Based Slab. Microsyst. Technol. 2026, 32, 1. [Google Scholar] [CrossRef]
  14. Sun, D.; Chen, J.; Fu, Y.; Ma, J. A Real-Time Response Relative Humidity Sensor Based on a Loop Microfiber Coated with Polyvinyl Alcohol Film. Measurement 2022, 187, 110359. [Google Scholar] [CrossRef]
  15. Peng, Y.; Qin, S.; Ye, Y.; Zhao, Y. Miniature Fiber Optic Spr High Sensitivity Humidity Sensor Based on Coated Polyvinyl Alcohol Film. Opt. Fiber Technol. 2024, 87, 103934. [Google Scholar] [CrossRef]
  16. Shinbo, K.; Ohdaira, Y.; Baba, A.; Kato, K.; Kaneko, F. Vapor Sorption to Polyvinyl Alcohol Thin Film Observed Using a Hybrid Sensor of Quartz-Crystal-Microbalance and Surface-Plasmon-Resonance. Mol. Cryst. Liq. Cryst. 2015, 622, 67–73. [Google Scholar] [CrossRef]
  17. Filimon, A.; Dobos, A.M.; Onofrei, M.D.; Serbezeanu, D. Polyvinyl Alcohol-Based Membranes: A Review of Research Progress on Design and Predictive Modeling of Properties for Targeted Application. Polymers 2025, 17, 1016. [Google Scholar] [CrossRef]
  18. Liang, X.; Zhong, H.-J.; Ding, H.; Yu, B.; Ma, X.; Liu, X.; Chong, C.-M.; He, J. Polyvinyl Alcohol (Pva)-Based Hydrogels: Recent Progress in Fabrication, Properties, and Multifunctional Applications. Polymers 2024, 16, 2755. [Google Scholar] [CrossRef]
  19. Rao, X.; Zhao, L.; Xu, L.; Wang, Y.; Liu, K.; Wang, Y.; Chen, G.Y.; Liu, T.; Wang, Y. Review of Optical Humidity Sensors. Sensors 2021, 21, 8049. [Google Scholar] [CrossRef] [PubMed]
  20. Quiñones-Flores, A.A.; Guzman-Sepulveda, J.R.; Castillo-Guzman, A.A. Relative Humidity Measurement Based on a Tapered, Pva-Coated Fiber Optics Multimode Interference Sensor. Optics 2023, 4, 473–481. [Google Scholar] [CrossRef]
  21. Ko, B.; Badloe, T.; Yang, Y.; Park, J.; Kim, J.; Jeong, H.; Jung, C.; Rho, J. Tunable Metasurfaces Via the Humidity Responsive Swelling of Single-Step Imprinted Polyvinyl Alcohol Nanostructures. Nat. Commun. 2022, 13, 6256. [Google Scholar] [CrossRef]
  22. Ko, B.; Jeon, N.; Kim, J.; Kang, H.; Seong, J.; Yun, S.; Badloe, T.; Rho, J. Hydrogels for Active Photonics. Microsyst. Nanoeng. 2024, 10, 1. [Google Scholar] [CrossRef] [PubMed]
  23. Yang, K.; Li, M. The Sensitivity of a Hexagonal Au Nanohole Array under Different Incident Angles. Biosensors 2023, 13, 654. [Google Scholar] [CrossRef] [PubMed]
  24. Shao, Y.; Wang, Y.; Cao, S.; Huang, Y.; Zhang, L.; Zhang, F.; Liao, C.; Wang, Y. Mechanism and Characteristics of Humidity Sensing with Polyvinyl Alcohol-Coated Fiber Surface Plasmon Resonance Sensor. Sensors 2018, 18, 2029. [Google Scholar] [CrossRef]
  25. Yan, H.; Han, D.; Li, M.; Lin, B. Relative Humidity Sensor Based on Surface Plasmon Resonance of D-Shaped Fiber with Polyvinyl Alcohol Embedding Au Grating. J. Nanophotonics 2017, 11, 016008. [Google Scholar] [CrossRef]
  26. Tong, R.; Wang, Y.; Zhao, K.-J.; Li, X.; Zhao, Y. Surface Plasmon Resonance Optical Fiber Sensor for Relative Humidity Detection without Temperature Crosstalk. Opt. Laser Technol. 2022, 150, 107951. [Google Scholar] [CrossRef]
Figure 1. Schematic diagram of sandwich structure.
Photonics 13 00463 g001
Figure 2. Simulation model and geometric structure diagram: 3D perspective view and top view.
Photonics 13 00463 g002
Figure 3. Electric-field distribution of the Au–PVA–Au nanohole structure at RH = 90%.
Photonics 13 00463 g003
Figure 4. Reflectance spectra at RH = 20% and RH = 90%.
Photonics 13 00463 g004
Figure 5. The effect of period a on resonant wavelength.
Photonics 13 00463 g005
Figure 6. The effect of aperture D on resonant wavelength.
Photonics 13 00463 g006
Figure 7. Spectra of sandwich structures at different RH levels.
Photonics 13 00463 g007
Figure 8. The curve showing the variation in resonant wavelength with relative humidity within the range of 20–98%RH.
Photonics 13 00463 g008
Figure 9. Electric-field distributions under different PVA modeling conditions at representative RH values: (ac) refractive-index variation only with fixed PVA thickness; (df) simultaneous refractive-index variation and thickness swelling.
Photonics 13 00463 g009
Figure 10. Decoupling analysis of resonance wavelength shifts induced by PVA refractive-index variation and thickness swelling.
Photonics 13 00463 g010
Table 1. Influence of representative fabrication tolerances on the resonance wavelength at RH = 60%.
Parameter VariedValue λ r e s at RH = 60%Shift from Nominal
PVA reference thickness d028 nm890 nm15 nm
PVA reference thickness d030 nm875 nm0 nm
PVA reference thickness d032 nm860 nm15 nm
Au thickness tAu75 nm870 nm5 nm
Au thickness tAu80 nm875 nm0 nm
Au thickness tAu85 nm880 nm5 nm
Aperture diameter D190 nm880 nm5 nm
Aperture diameter D200 nm875 nm0 nm
Aperture diameter D210 nm870 nm5 nm
Array period a390 nm855 nm20 nm
Array period a400 nm875 nm0 nm
Array period a410 nm895 nm20 nm
Table 2. Key relevant parameters.
ParameterValueDescription
Operating humidity range20–98%RHThe structure can achieve wide-range humidity sensing
Total wavelength shift135 nmThe resonance wavelength continuously blue-shifts with increasing humidity
Sensitivity in the low-to-medium humidity region 1.3857 nm/%RHCorresponding to the 20–74%RH range
Sensitivity in the high-humidity region2.5000 nm/%RHCorresponding to the 74–98%RH range
Representative resonance wavelength830 nmNear RH = 74%
Full width at half maximum FWHM19 nmNear RH = 74%
Quality factor Q43.7 Q = λ r e s / FWHM
FOM in the low-to-medium humidity regionApproximately 0.0729/%RH FOM = S / FWHM
FOM in the high-humidity regionApproximately 0.1316/%RH FOM = S / FWHM
Table 3. Resonance wavelengths under different PVA modulation mechanisms.
CaseRH = 20%RH = 74%RH = 98%Total Blueshift
RI variation and thickness swelling905 nm830 nm770 nm135 nm
Thickness swelling only905 nm865 nm830 nm75 nm
RI variation only905 nm870 nm845 nm60 nm
Table 4. Sensitivity analysis under different assumed PVA swelling ratios.
SmaxPVA Thickness RangeRH = 20%RH = 74%RH = 98%Total Blueshift
5%30–31.5 nm905 nm860 nm820 nm85 nm
20%30–36 nm905 nm850 nm790 nm115 nm
40%30–42 nm905 nm830 nm770 nm135 nm
Table 5. Comparison of the proposed Au–PVA–Au humidity sensor with representative optical and plasmonic humidity sensors.
Sensor TypeSensitive MaterialRH RangeSensitivityReadout ModeRef.
PVA-coated TFBGPVA20–98%2.52 and 14.95 dBm/%RHIntensity[8]
PVA-coated side-polished SMF-SPRPVA/Au40–90%1.01 nm/%RH average; up to 4.97 nm/%RH in high-RH regionWavelength[24]
PVA-embedded Au-grating D-shaped fiber SPRPVA/Au grating0–70%5.4 nm/%RHWavelength[25]
PVA-coated POF-SPRPVA/Au40–90%4.98 nm/%RH average; 10.15 nm/%RH at 75–90%RHWavelength[1]
Miniature tapered-fiber SPRPVA/Au46–93%1.542 nm/%RHWavelength[15]
SPR/MZ fiber sensorGQDs–PVA/AuNot reported23 pm/%RHWavelength/data demodulation[26]
LSPR Au nanoparticle filmNafion/Au nanoparticles0–85%LOD: 0.12%RHLSPR wavelength/intensity[6]
This workAu–PVA–Au nanohole sandwich20–98%1.3857 and 2.5000 nm/%RHReflective wavelength
Disclaimer/Publisher’s Note: The statements, opinions and data contained in all publications are solely those of the individual author(s) and contributor(s) and not of MDPI and/or the editor(s). MDPI and/or the editor(s) disclaim responsibility for any injury to people or property resulting from any ideas, methods, instructions or products referred to in the content.