Article

Detection of AC Electrical Signals Using a PZT-Driven Ring Tapered-Fiber Resonator


1
College of Electronic Information and Physics, Central South University of Forestry and Technology, Changsha 410004, China
2
College of Life Science and Technology, Central South University of Forestry and Technology, Changsha 410004, China
*
Author to whom correspondence should be addressed.
These authors contributed equally to this work.
Photonics 2026, 13(5), 459; https://doi.org/10.3390/photonics13050459
Submission received: 2 April 2026 / Revised: 24 April 2026 / Accepted: 30 April 2026 / Published: 7 May 2026
(This article belongs to the Special Issue Optical Fiber Sensors: Refractivity and Interferometric Applications)

Abstract

To address the need for high electrical insulation, strong immunity to electromagnetic interference, and miniaturized AC electrical-signal detection in complex electromagnetic environments, we propose and experimentally demonstrate a fiber-optic sensor based on a piezoelectric ceramic (PZT)-driven ring tapered-fiber resonator. The applied AC excitation is converted into periodic mechanical deformation through the inverse piezoelectric effect of the PZT, and the resulting strain modulates the resonator response, enabling optical demodulation of the input frequency and amplitude. A comprehensive figure of merit was introduced to optimize the tapered-fiber geometry, yielding an optimal waist diameter of approximately 10 μm. The sensor can effectively distinguish both single- and dual-frequency AC signals. Over the range of 50–500 Hz, the demodulated frequency agrees closely with the input frequency, with a linear fitting coefficient of 0.9999. At a fixed driving frequency of 250 Hz, the amplitude of the characteristic spectral peak increases nearly linearly with the input voltage amplitude, with a fitting coefficient of 0.9945. The device also exhibits good stability over 30–150 °C and during 70 h of continuous operation. With its simple structure, low cost, and strong immunity to electromagnetic interference, this sensor provides a practical solution for AC electrical-signal detection in complex environments.

1. Introduction

Accurate identification of the frequency components and amplitude variations of AC electrical signals is essential for fault diagnosis, state awareness, feedback control, and harmonic analysis in modern power systems, power electronics, and energy-conversion platforms [1,2,3]. Conventional electrical sensing approaches, including shunt resistors, current transformers, and Hall sensors, remain widely used; however, in practical applications they are often limited by Joule heating, inadequate electrical isolation, magnetic-core saturation, restricted bandwidth, and susceptibility to interference in harsh electromagnetic environments [4,5,6].
Fiber-optic sensors have attracted significant attention due to their inherent dielectric isolation, high immunity to electromagnetic interference, and remote demodulation capabilities [7,8,9,10,11]. Chen et al. proposed a PZT-driven FBG-FP cascaded fiber current transformer [12]; although this design achieved improvements in sensitivity, its complex optical cascaded structure significantly increased fabrication difficulty and relied heavily on a complex static wavelength-tracking demodulation mechanism. Li et al. developed a multifunctional hybrid plasmonic microfiber resonator [13]. Although it exhibits ultra-high sensitivity and a wide measurement range, its micro- and nano-structures are extremely unstable in complex environments. Furthermore, Wang et al. designed a dispersion-compensated fiber-optic sensor driven by PZT [14], but the use of specially customized optical fibers limits its industrial application. These studies demonstrate the application potential of fiber optic sensing technology in various fields, such as power system condition assessment, while also exposing the limitations of current technologies in terms of engineering translation. Therefore, there is an urgent need to develop an industrial-grade fiber optic sensor with a simple physical structure, high mechanical stability, and the ability to achieve high-fidelity, easily demodulable signals across a wide temperature range.
Against this backdrop, we propose a fiber-optic AC signal sensor based on a PZT-driven annular tapered fiber resonator. The input electrical excitation drives the PZT to undergo mechanical deformation via the inverse piezoelectric effect [15,16]. The resulting deformation is transmitted to the annular tapered fiber resonator, modulating its optical path to achieve dynamic conversion from electrical to optical signals. Furthermore, the frequency of the electrical signal is demodulated by performing a frequency-domain analysis (FFT) on the acquired data. Experimental results demonstrate that this sensor can effectively identify single- and dual-frequency AC signals, exhibiting stable dynamic response within the 50–500 Hz range while maintaining low temperature cross-sensitivity across the 30–150 °C range. Compared to traditional electromagnetic sensing schemes, this structure reduces temperature-induced drift and eliminates the reliance on additional magnetic functional media, thereby simplifying the sensing mechanism and device architecture. It provides a new approach for AC signal sensing in complex electromagnetic environments and for miniaturized applications.

2. Experimental Theory

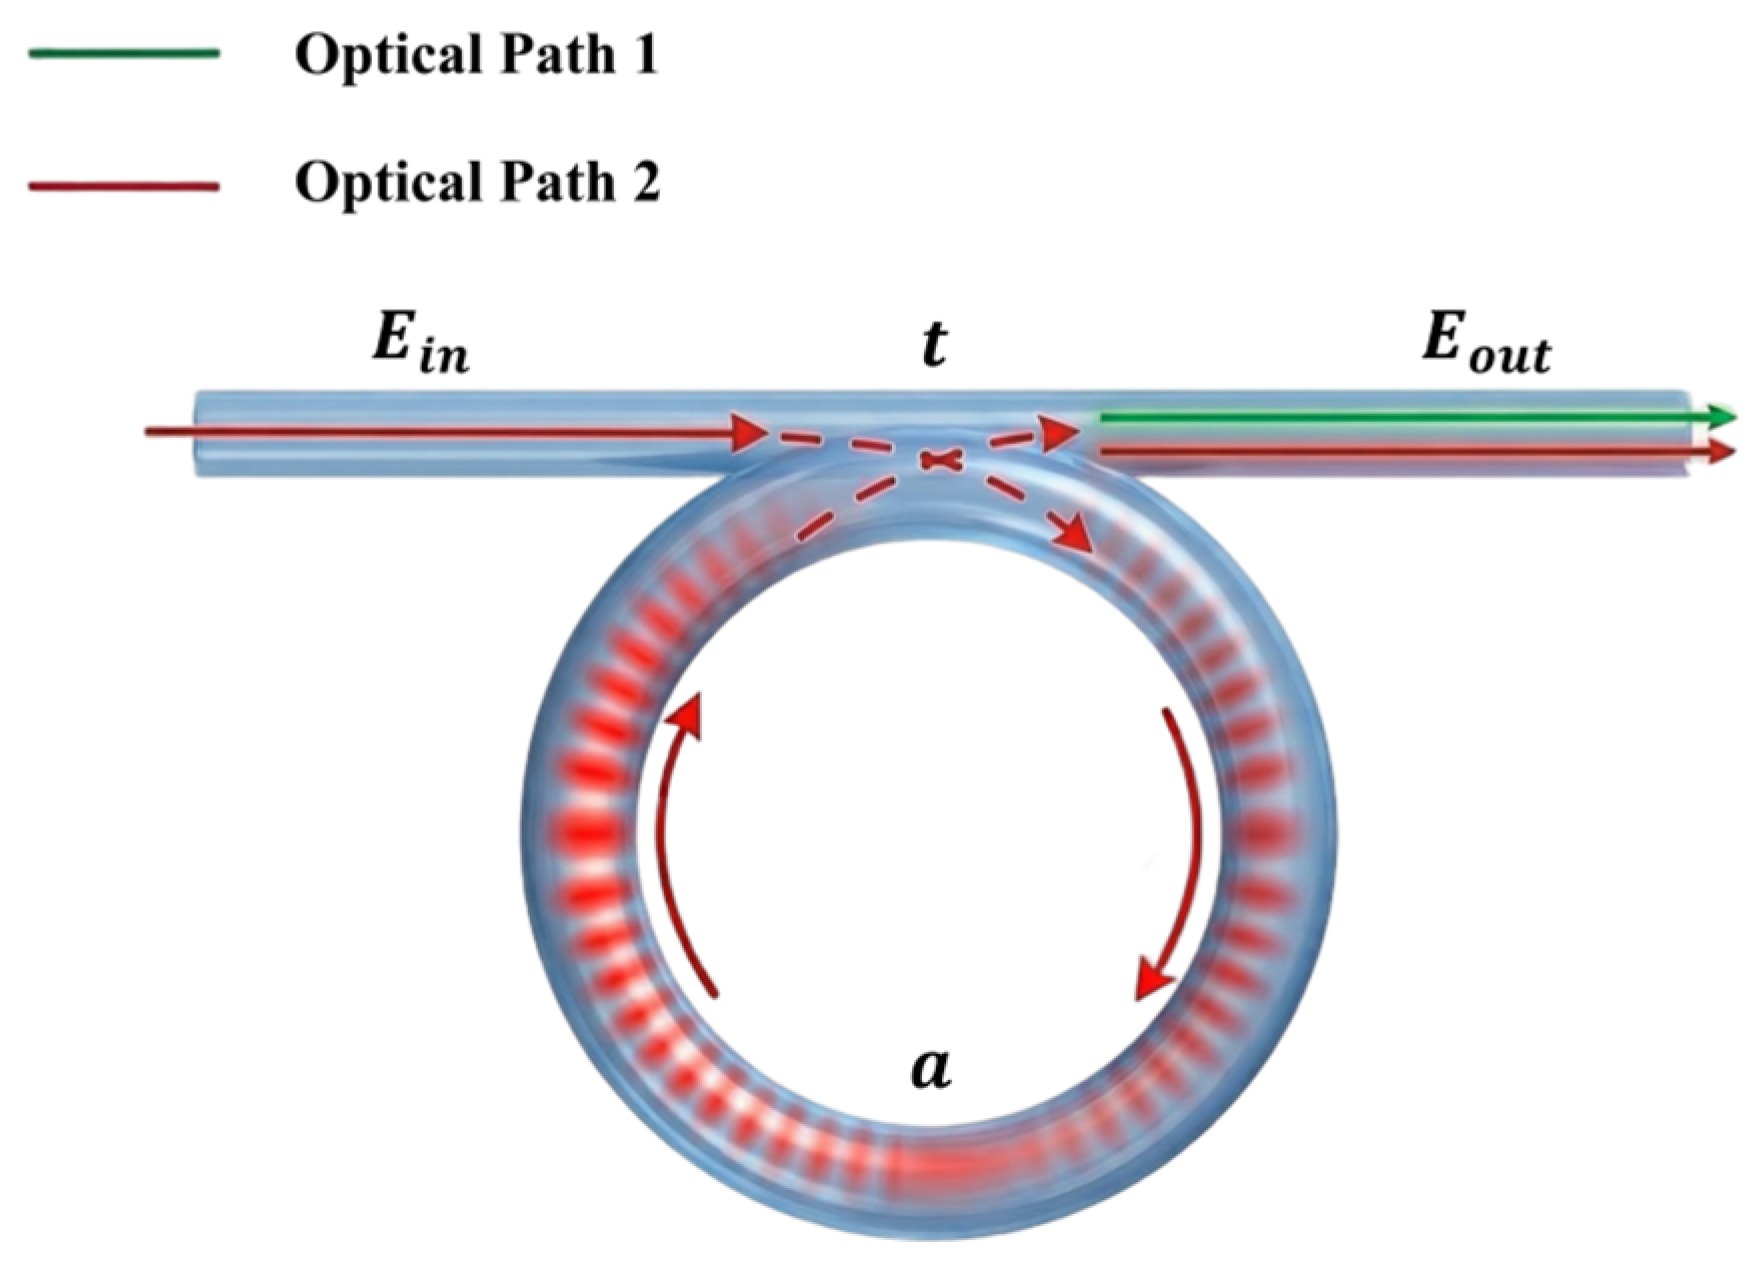
A ring-shaped tapered-fiber resonator can be regarded as a self-coupled ring-waveguide structure. When the input light is coupled into the microfiber ring, the optical field circulates within the ring and interferes with the field in the straight waveguide at the coupling region. When the phase accumulated over one round trip satisfies the resonance condition, distinct resonance features appear in the output spectrum of the device [17,18,19], as shown in Figure 1.
For a single-loop resonator, the transmission function can be expressed as:
E out = t - a e - i ϕ 1 - t a e - i ϕ E in ,
Here, E in and E out represent the input and output fields, respectively; t is the self-coupling coefficient; a is the single-round-trip amplitude transmission factor within the loop; and ϕ is the single-round-trip propagation phase. The corresponding transmission coefficient is
T = | E out E in | 2 = | t - a e - i ϕ 1 - t a e - i ϕ | 2 ,
The resonance condition for a circular resonator can be written as:
m λ res = n eff L ,
Here, m is the resonance order, λ res is the resonance wavelength, n eff is the effective refractive index of the tapered fiber, and L is the cavity length of the ring resonator. As shown in Equation (3), any change in n e f f or L induced by external perturbations will result in a shift in the resonance wavelength, which can be expressed as:
Δ λ res   =   λ res ( Δ n eff n eff + Δ L L ) .
Therefore, the ring-shaped tapered-fiber resonator can serve as an optical sensing unit that is highly sensitive to minute mechanical perturbations. In this work, a ring-shaped tapered fiber is attached to the surface of a piezoelectric ceramic. When an AC electrical signal is applied to the piezoelectric ceramic, the PZT generates periodic mechanical deformation via the inverse piezoelectric effect and transfers this deformation to the ring-shaped tapered-fiber resonator, thereby causing dynamic variations in the resonator length and propagation phase. To simplify the analysis, the resonator length can be expressed as:
L ( t ) = L 0 + Δ L sin ( 2 π f t ) ,
Here, L 0 is the initial cavity length, Δ L is the amplitude of the length modulation, and f is the frequency of the applied electrical signal. Accordingly, the resonance phase varies with time as:
ϕ ( t ) = 2 π n eff L ( t ) λ .
This indicates that an input electrical signal can be converted into periodic modulation of the resonance phase through piezoelectric actuation. Under small-signal conditions, the deformation of the piezoelectric ceramic is approximately proportional to the drive amplitude [20]. Therefore, the dynamic optical response of the resonator also varies approximately linearly with the amplitude of the input signal. When the resonator operates near a fixed bias point, the phase modulation manifests as periodic variations in the output transmission intensity. Let
ϕ ( t ) = ϕ 0 + Δ ϕ sin ( 2 π f t ) ,
Here, ϕ 0 is the phase at the static operating point, and Δ ϕ is the amplitude of the dynamic phase modulation. Substituting Equation (7) into Equation (2) and performing a first-order Taylor expansion around ϕ 0 yields the following expression:
T ( ϕ ( t ) ) T ( ϕ 0 ) + d T d ϕ | ϕ 0 Δ ϕ sin ( 2 π f t ) .
As shown in Equation (8), the output optical intensity contains frequency components identical to those of the driving signal. Therefore, the frequency of the input signal can be extracted by recording the time-dependent variation in transmission intensity at the characteristic wavelength and performing a fast Fourier transform [21].

3. Sensor Fabrication and Experimental Setup

3.1. Materials and Instrumentation

In this study, standard single-mode fiber (SMF-28e, Corning; core/cladding diameters of 8.2/125 µm; cutoff wavelength of 1260 nm) was used as the precursor fiber for the ring-shaped tapered-fiber resonator. A broadband supercontinuum light source (SC-5, YSL Photonics) was used to characterize the transmission spectrum of the resonator. Tapered fibers were fabricated using a flame-heated taper-drawing method, and a microscope was used to observe the tapered region and the coupling structure.
To convert electrical signals into mechanical vibrations, a piezoelectric ceramic actuator (PZT actuator, operating voltage: 0–120 V) was introduced as the mechanical driving unit, and an AC driving signal was applied using a signal generator. The output spectrum of the device was recorded by an optical spectrum analyzer (AQ6370C, Yokogawa, Tokyo, Japan), and the input electrical waveform was simultaneously monitored using a digital storage oscilloscope. Temperature-characterization tests were conducted in a vertical electric-heating oven, and the ambient temperature was monitored in real time using a digital thermometer. All optical components were mounted on a precision translation stage to enhance the stability of both the coupling structure and the measurement process.

3.2. Simulation for Taper Diameter Selection

To determine the appropriate waist diameter for a tapered optical fiber, numerical simulations of the light field distribution were first performed for fibers of different diameters. In the simulations, the waist region of the tapered fiber was approximated as a silica cylindrical waveguide with a core–cladding structure, where the refractive indices of the core and cladding were set to 1.4504 and 1.4437, respectively, and the surrounding medium was air (refractive index approximately 1.0).
For the PZT-driven ring-shaped tapered-fiber resonator investigated here, the waist diameter cannot be selected solely on the basis of a single mode-field distribution. On the one hand, a smaller diameter increases field overlap near the boundary and thus enhances the device response to strain perturbations. On the other hand, in practical power-equipment testing, an excessively small diameter leads to higher bending loss, stronger scattering loss, and poorer structural stability. Therefore, an auxiliary performance-evaluation factor, namely the figure of merit (FOM), was introduced to assess the overall operating characteristics at different diameters.
To characterize the extent to which the optical mode is concentrated near the boundary, the surface-field overlap factor is defined as [22]:
Γ s u r f = Ω s h e l l I ( x , y ) d A Ω a l l I ( x , y ) d A ,
Here, I ( x , y ) represents the localized irradiance distribution across the cross-section obtained from finite element field analysis; Ω a l l denotes the entire cross-sectional area of the fiber; and Ω s h e l l denotes the annular near-surface region adjacent to the outer boundary of the fiber. For a cylindrical frustum cross-section with diameter D, it is defined as:
Ω a l l = { ( x , y | x 2 + y 2 ( D 2 ) 2 } ,
Ω s h e l l = { ( x , y | ( D 2 δ ) 2 x 2 + y 2 ( D 2 ) 2 } ,
Among these, δ is the thickness of the near-surface layer. To enable a consistent comparison of the contribution of the near-boundary mode field within the examined diameter range, this paper adopts a relative shell thickness δ = D / 20 ,   Ω s h e l l defined in this way, it can characterize the local mode field regions near the boundary in a relatively consistent manner across different diameters [23]. The larger the value of Γ s u r f , the greater the contribution of the light field near the boundary, and the device is generally more sensitive to boundary strain perturbations caused by PZT. In addition to Γ s u r f , we further introduce three factors related to the waist diameter of the cone to establish a comprehensive comparative framework for structural optimization in this study. First of all, L b e n d represents the bending loss term. This term was obtained through numerical simulation under identical bending conditions for the annular resonant structure and is used to characterize the additional bending optical loss caused by the tapering of the waist and the resulting weakening of the mode field confinement. In addition, we must take into account the scattering loss in the optical fiber L s c a t , Surface scattering loss in tapered fiber arises from the coupling of guided modes to radiated modes via interface roughness; the scattering loss per unit length is proportional to [23,24]:
L s c a t Γ s u r f σ 2 λ 2 ,
where σ is the root-mean-square value of surface roughness (which is assumed to remain constant across different diameters for a given flame-drawing process), λ is the operating wavelength. Since Γ s u r f increases as D decreases, L s c a t increases correspondingly in thinner fibers, reflecting the relative amplification of the effect of surface roughness when a larger proportion of the modal energy is located near the boundary. Finally, we introduce a robustness factor M related to geometric dimensions to characterize variations in mechanical manipulability during the device fabrication and packaging processes, assuming that M increases monotonically with the waist diameter [24], i.e., M ( D ) D .
To enable a unified comparison of the parameters with different dimensions and orders of magnitude mentioned above, this paper examines the range of candidate cone waist diameters D [ 4 ,   14 ] µm, applying a uniform min-max normalization to all items:
x = x x m i n x m a x x m i n ,
For yield-based parameters Γ s u r f and M , a larger normalized value indicates better boundary field participation and structural robustness; Regarding penalty terms L b e n d and L s c a t , a larger normalization value indicates a stronger loss or penalty. After normalization, all parameters fall within the interval [0, 1], facilitating a consistent comparison. Based on this, the comprehensive evaluation index is defined as:
F O M = Γ s u r f M ( 1 + L b e n d ) ( 1 + L s c a t ) .
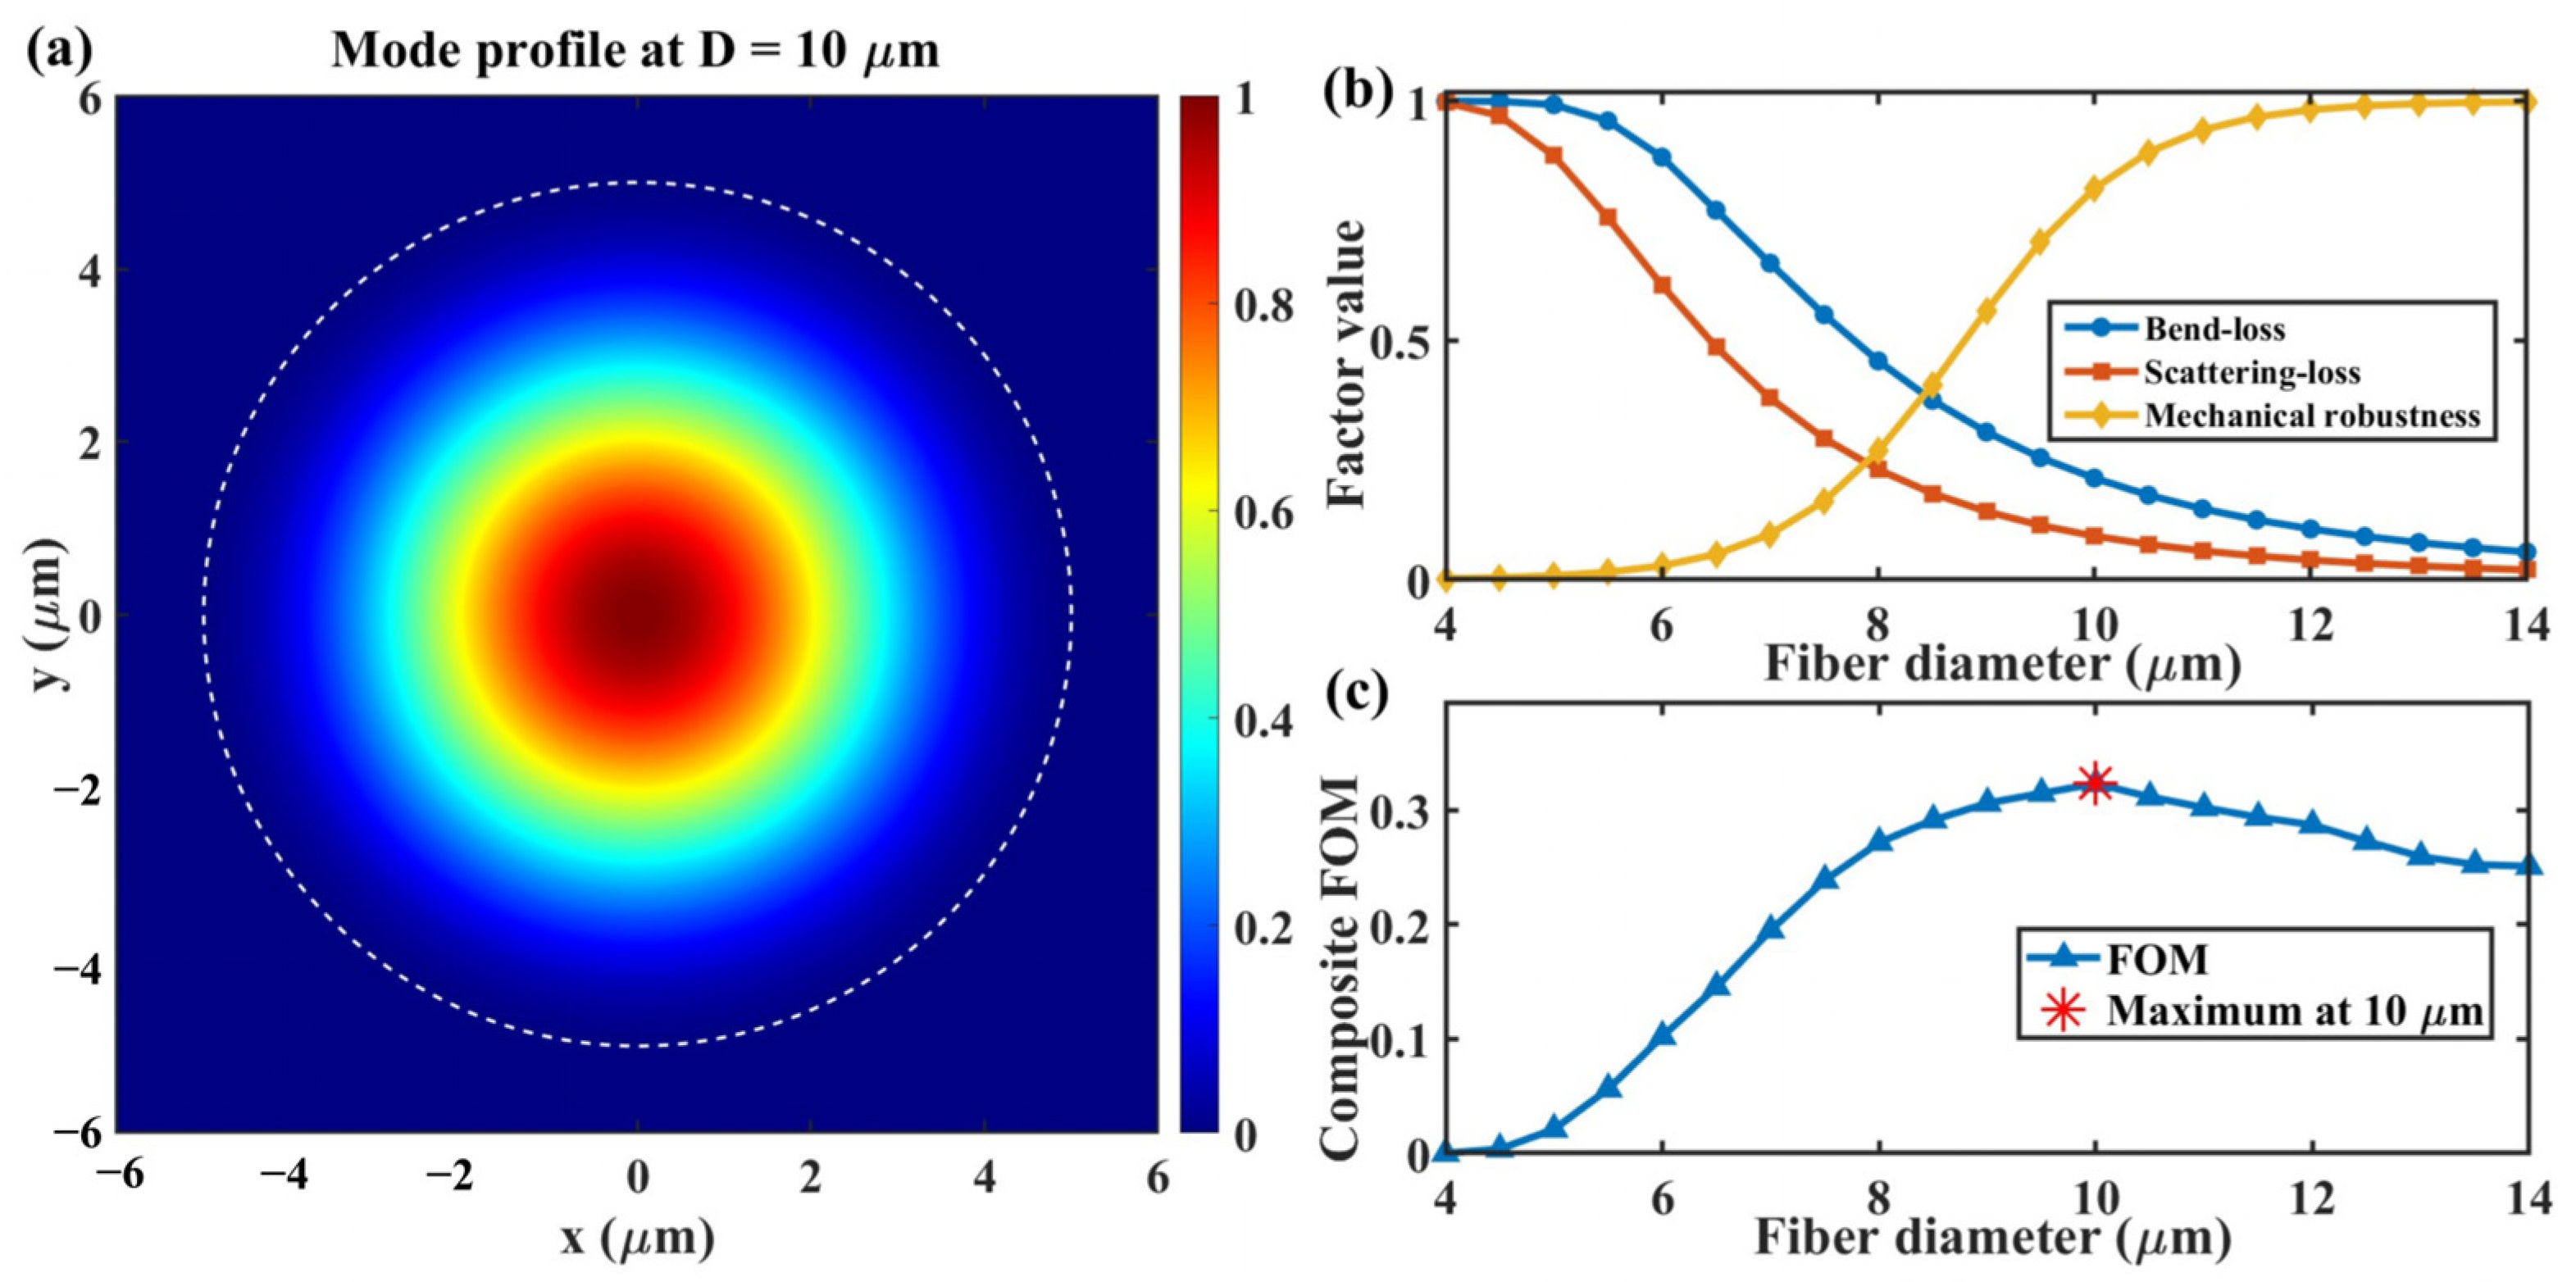
This equation indicates that the higher the contribution of the boundary field and the greater the structural robustness, the better the overall performance of the device; conversely, the greater the sensitivity to bending leakage and surface scattering, the more the overall performance is degraded. The simulation results are shown in Figure 2. Cross-sectional modal analysis indicates that, at this scale, the optical mode is primarily confined within the fiber while retaining the boundary field, laying the foundation for subsequent PZT-driven resonance modulation. As the waist diameter increases, bending and scattering losses generally decrease, while mechanical robustness gradually improves, as shown in Figure 2c.
Based on the relationship between FOM and diameter, FOM reaches a maximum at approximately 10 μm, indicating that this diameter achieves a good balance between boundary field participation, loss suppression, and structural stability. Accordingly, a tapered fiber with a diameter of 10 μm was selected as the reference dimension for subsequent modal field analysis and device fabrication.

3.3. Fabrication of the Ring Tapered-Fiber Resonator

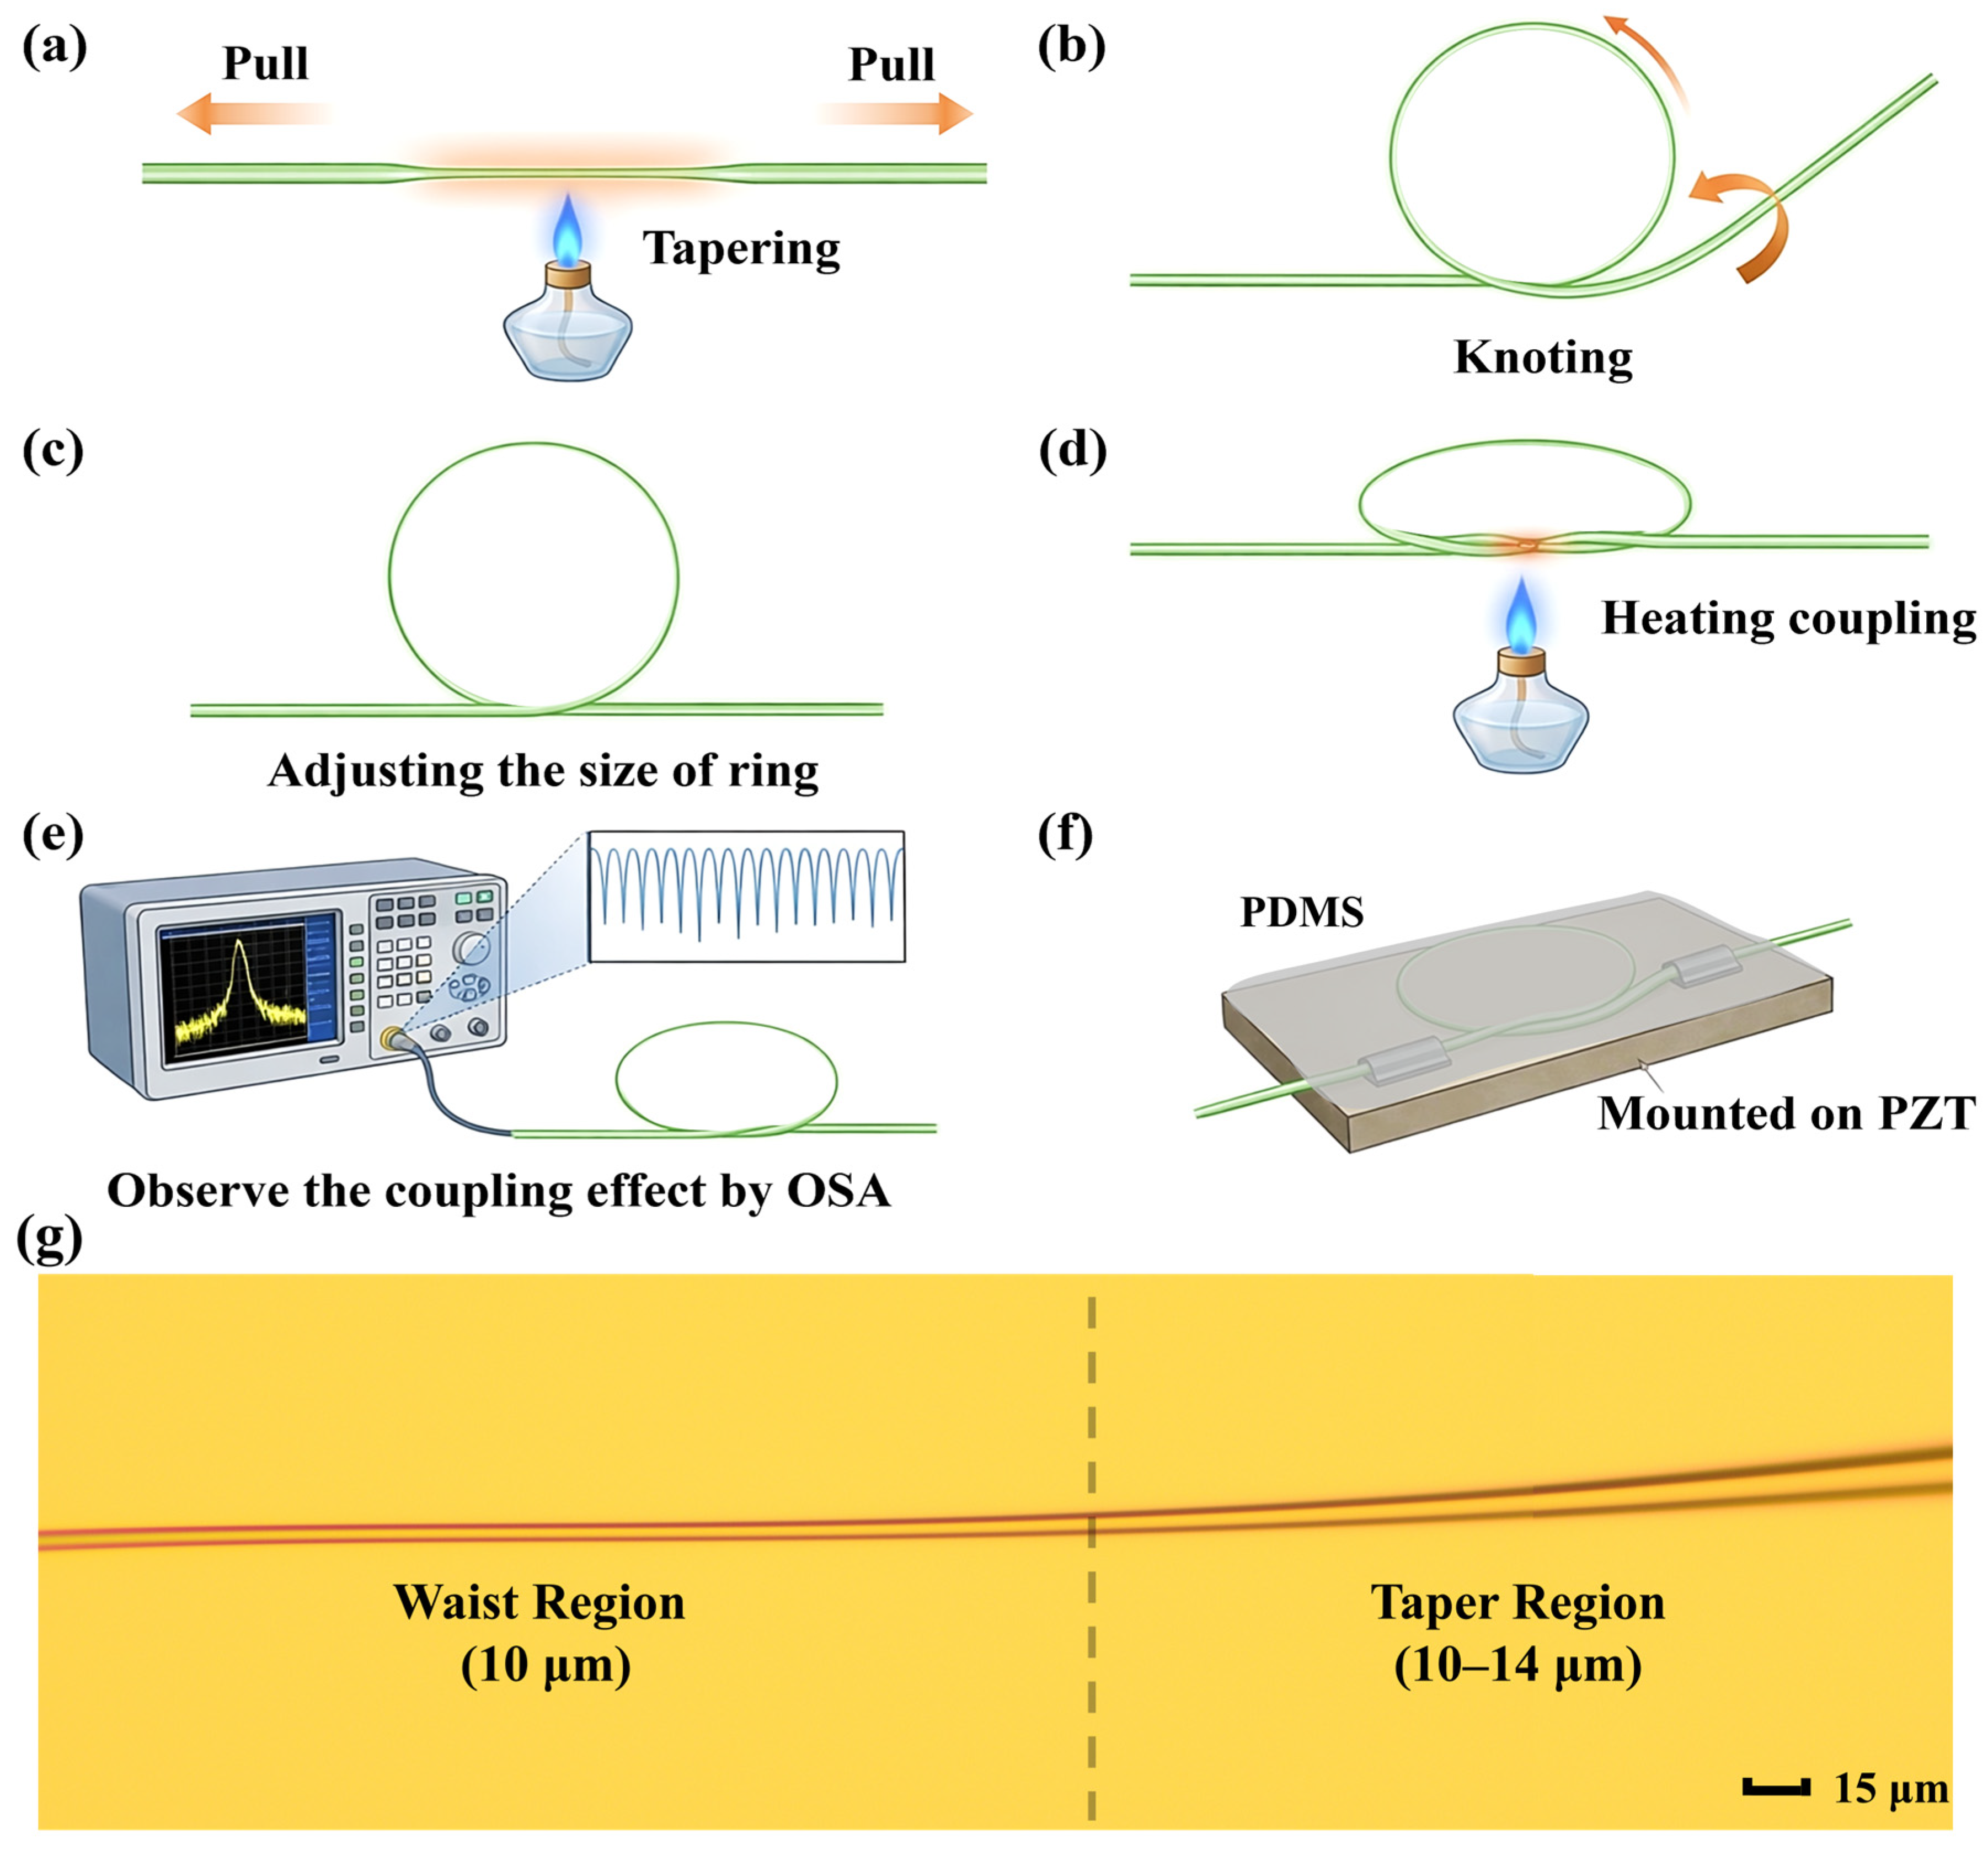
In this study, a ring-shaped tapered-fiber resonator was fabricated by a fused-taper process and integrated onto the surface of a piezoelectric ceramic. The fabrication procedure is illustrated in Figure 3. First, a standard single-mode optical fiber approximately 30–40 cm in length was selected. The coating was stripped from a 5 cm section at the center of the fiber, and the prepared fiber was mounted on the taper-drawing platform. During fabrication, the fiber was positioned approximately 2 mm above the tip of the inner flame, and the preheating time was set to 2 s. Once the fiber softened, it was stretched uniformly along the axial direction under the control of the tapering system, with a drawing speed of 0.10 mm/s on each side and a total separation speed of 0.20 mm/s. The effective heating and drawing time were controlled within 60–90 s, resulting in a tapered-fiber structure with a transition-region diameter of 10–14 μm, a waist-region diameter of approximately 10 μm, and a uniform waist length of approximately 8–12 mm.
After tapering, the fiber was bent into a ring, and the overlapping region was mildly fused to form a stable self-coupling zone, thereby producing a ring-shaped tapered-fiber resonator. During fabrication, a spectrometer was used to monitor the output spectrum in real time, and the emergence of stable resonance features was taken as evidence that the coupling structure had been successfully established. Finally, the fabricated ring-shaped tapered-fiber resonator was mounted on the surface of a piezoelectric ceramic, and a layer of PDMS was applied to encapsulate the sensing structure, thereby protecting the resonator and improving the stability and reliability of the device during operation.

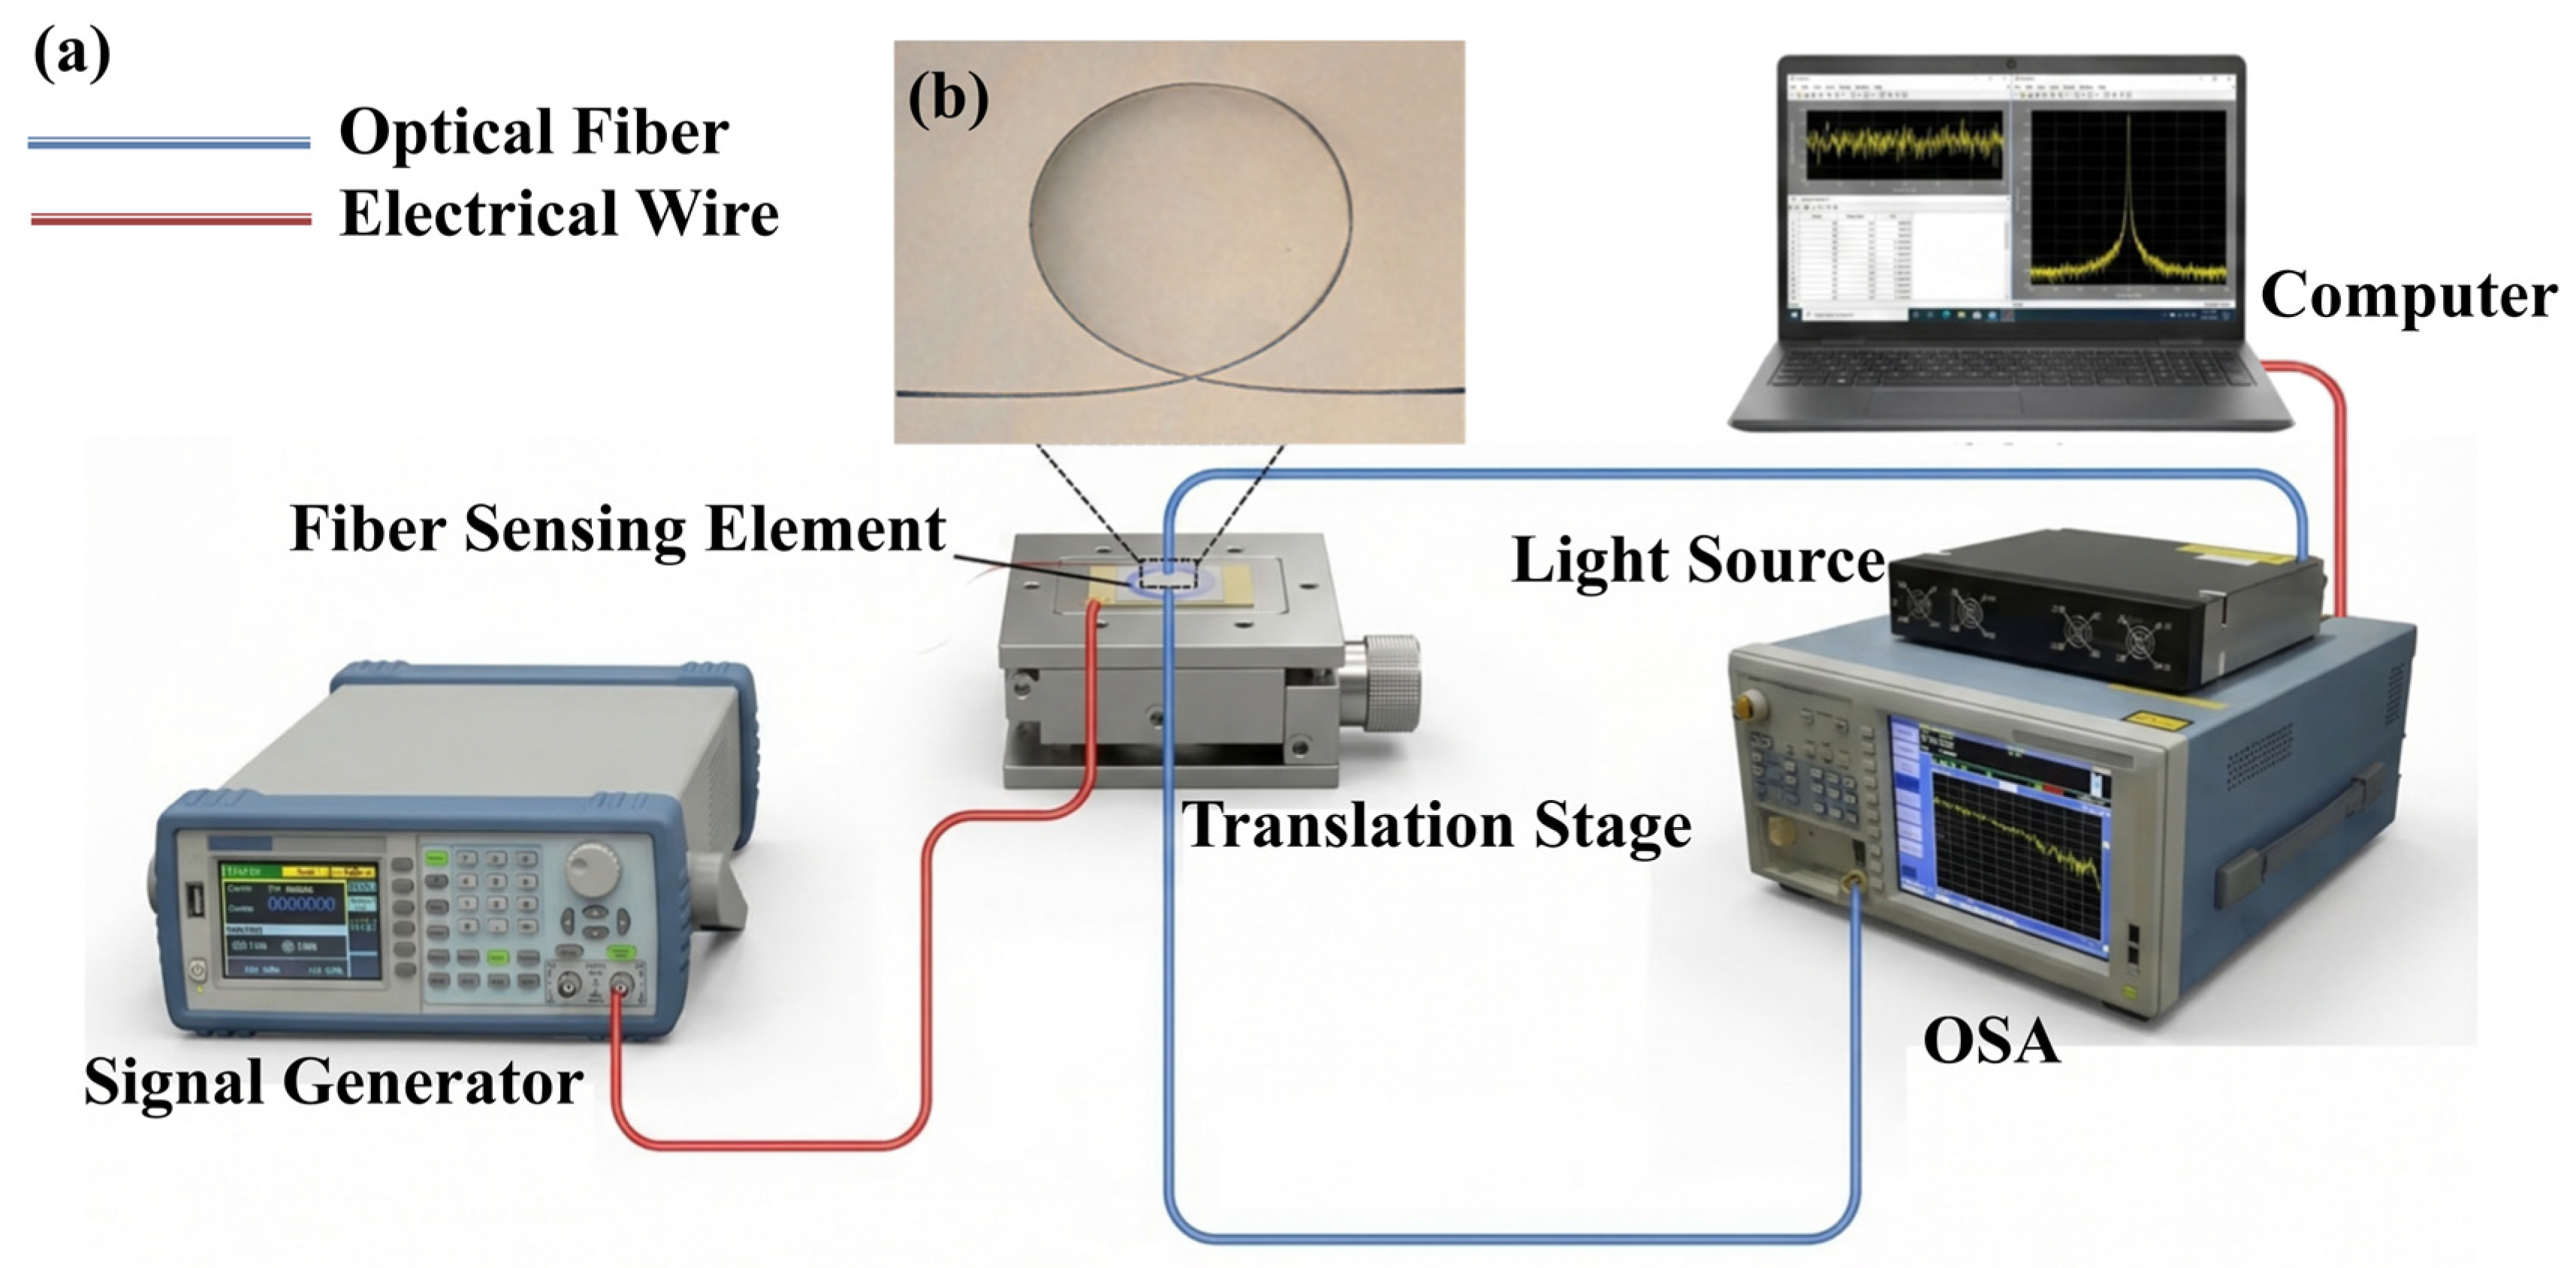
3.4. Experimental Setup and Measurement Procedure

To evaluate the response characteristics of the sensor, experiments were conducted on its frequency response, voltage-amplitude response, and temperature response. The experimental setup is shown in Figure 4. The sensor was mounted on a precision stage. The input electrical signal was supplied by a signal generator, the optical response was recorded by a spectral analysis system, and the time-domain waveform of the input electrical signal was simultaneously monitored using a digital storage oscilloscope. For frequency demodulation, the time-domain optical modulation traces at the selected resonance wavelength were processed by FFT, and the dominant spectral peak was extracted with a frequency step of 0.01 Hz.
In the frequency-response experiments, the ambient temperature was maintained at 25 °C and the drive-signal amplitude was fixed at 10 V. First, single-frequency response tests were performed by adjusting the drive frequency over the range of 50–500 Hz, using 10 Hz steps from 50 Hz to 200 Hz and 20 Hz steps from 200 Hz to 500 Hz, to evaluate the frequency-tracking capability of the sensor. Subsequently, dual-frequency response experiments were conducted, in which the signal generator simultaneously output two AC driving signals with different frequencies to assess the ability of the device to resolve composite frequency components.
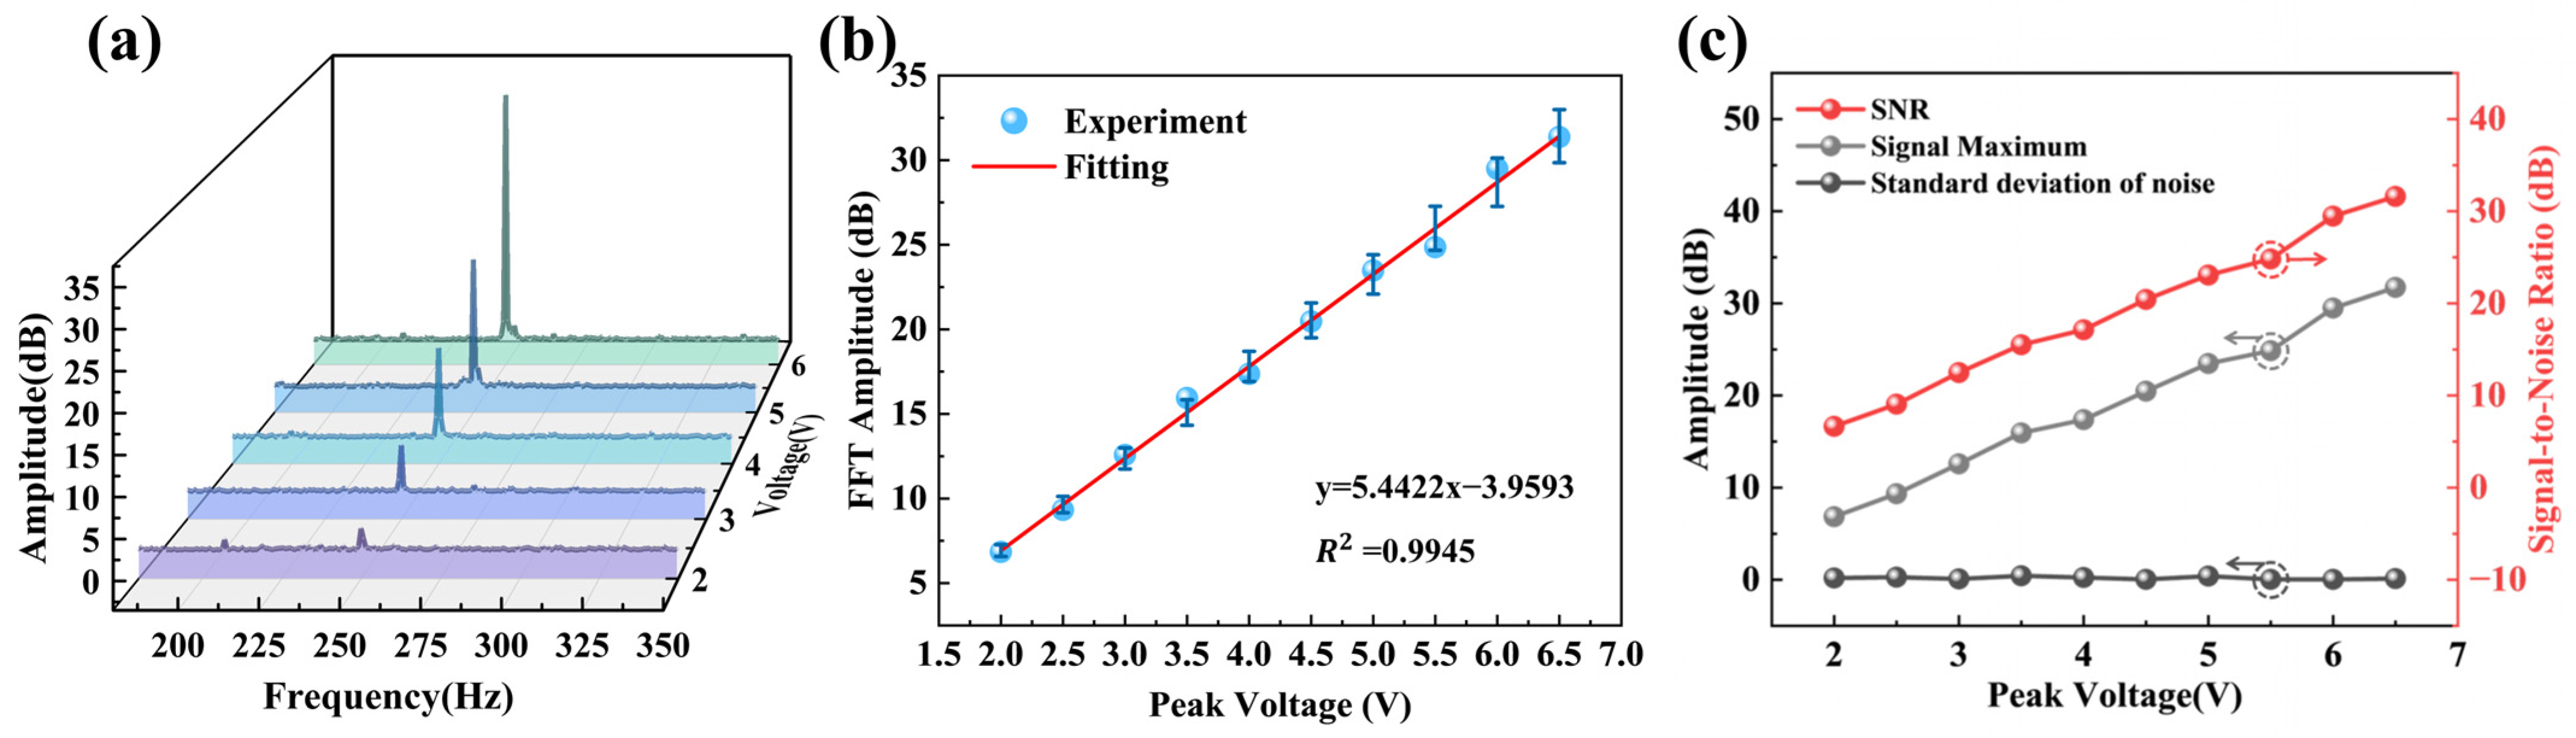
In the voltage-amplitude response experiment, the driving frequency was fixed at 250 Hz, and the amplitude of the sinusoidal driving signal was increased from 2 V to 6.5 V in 0.5 V increments. The optical modulation signals recorded under different driving conditions were analyzed by fast Fourier transform (FFT), and the amplitude at the characteristic frequency was extracted to establish the relationship between the sensor output and the input voltage amplitude.
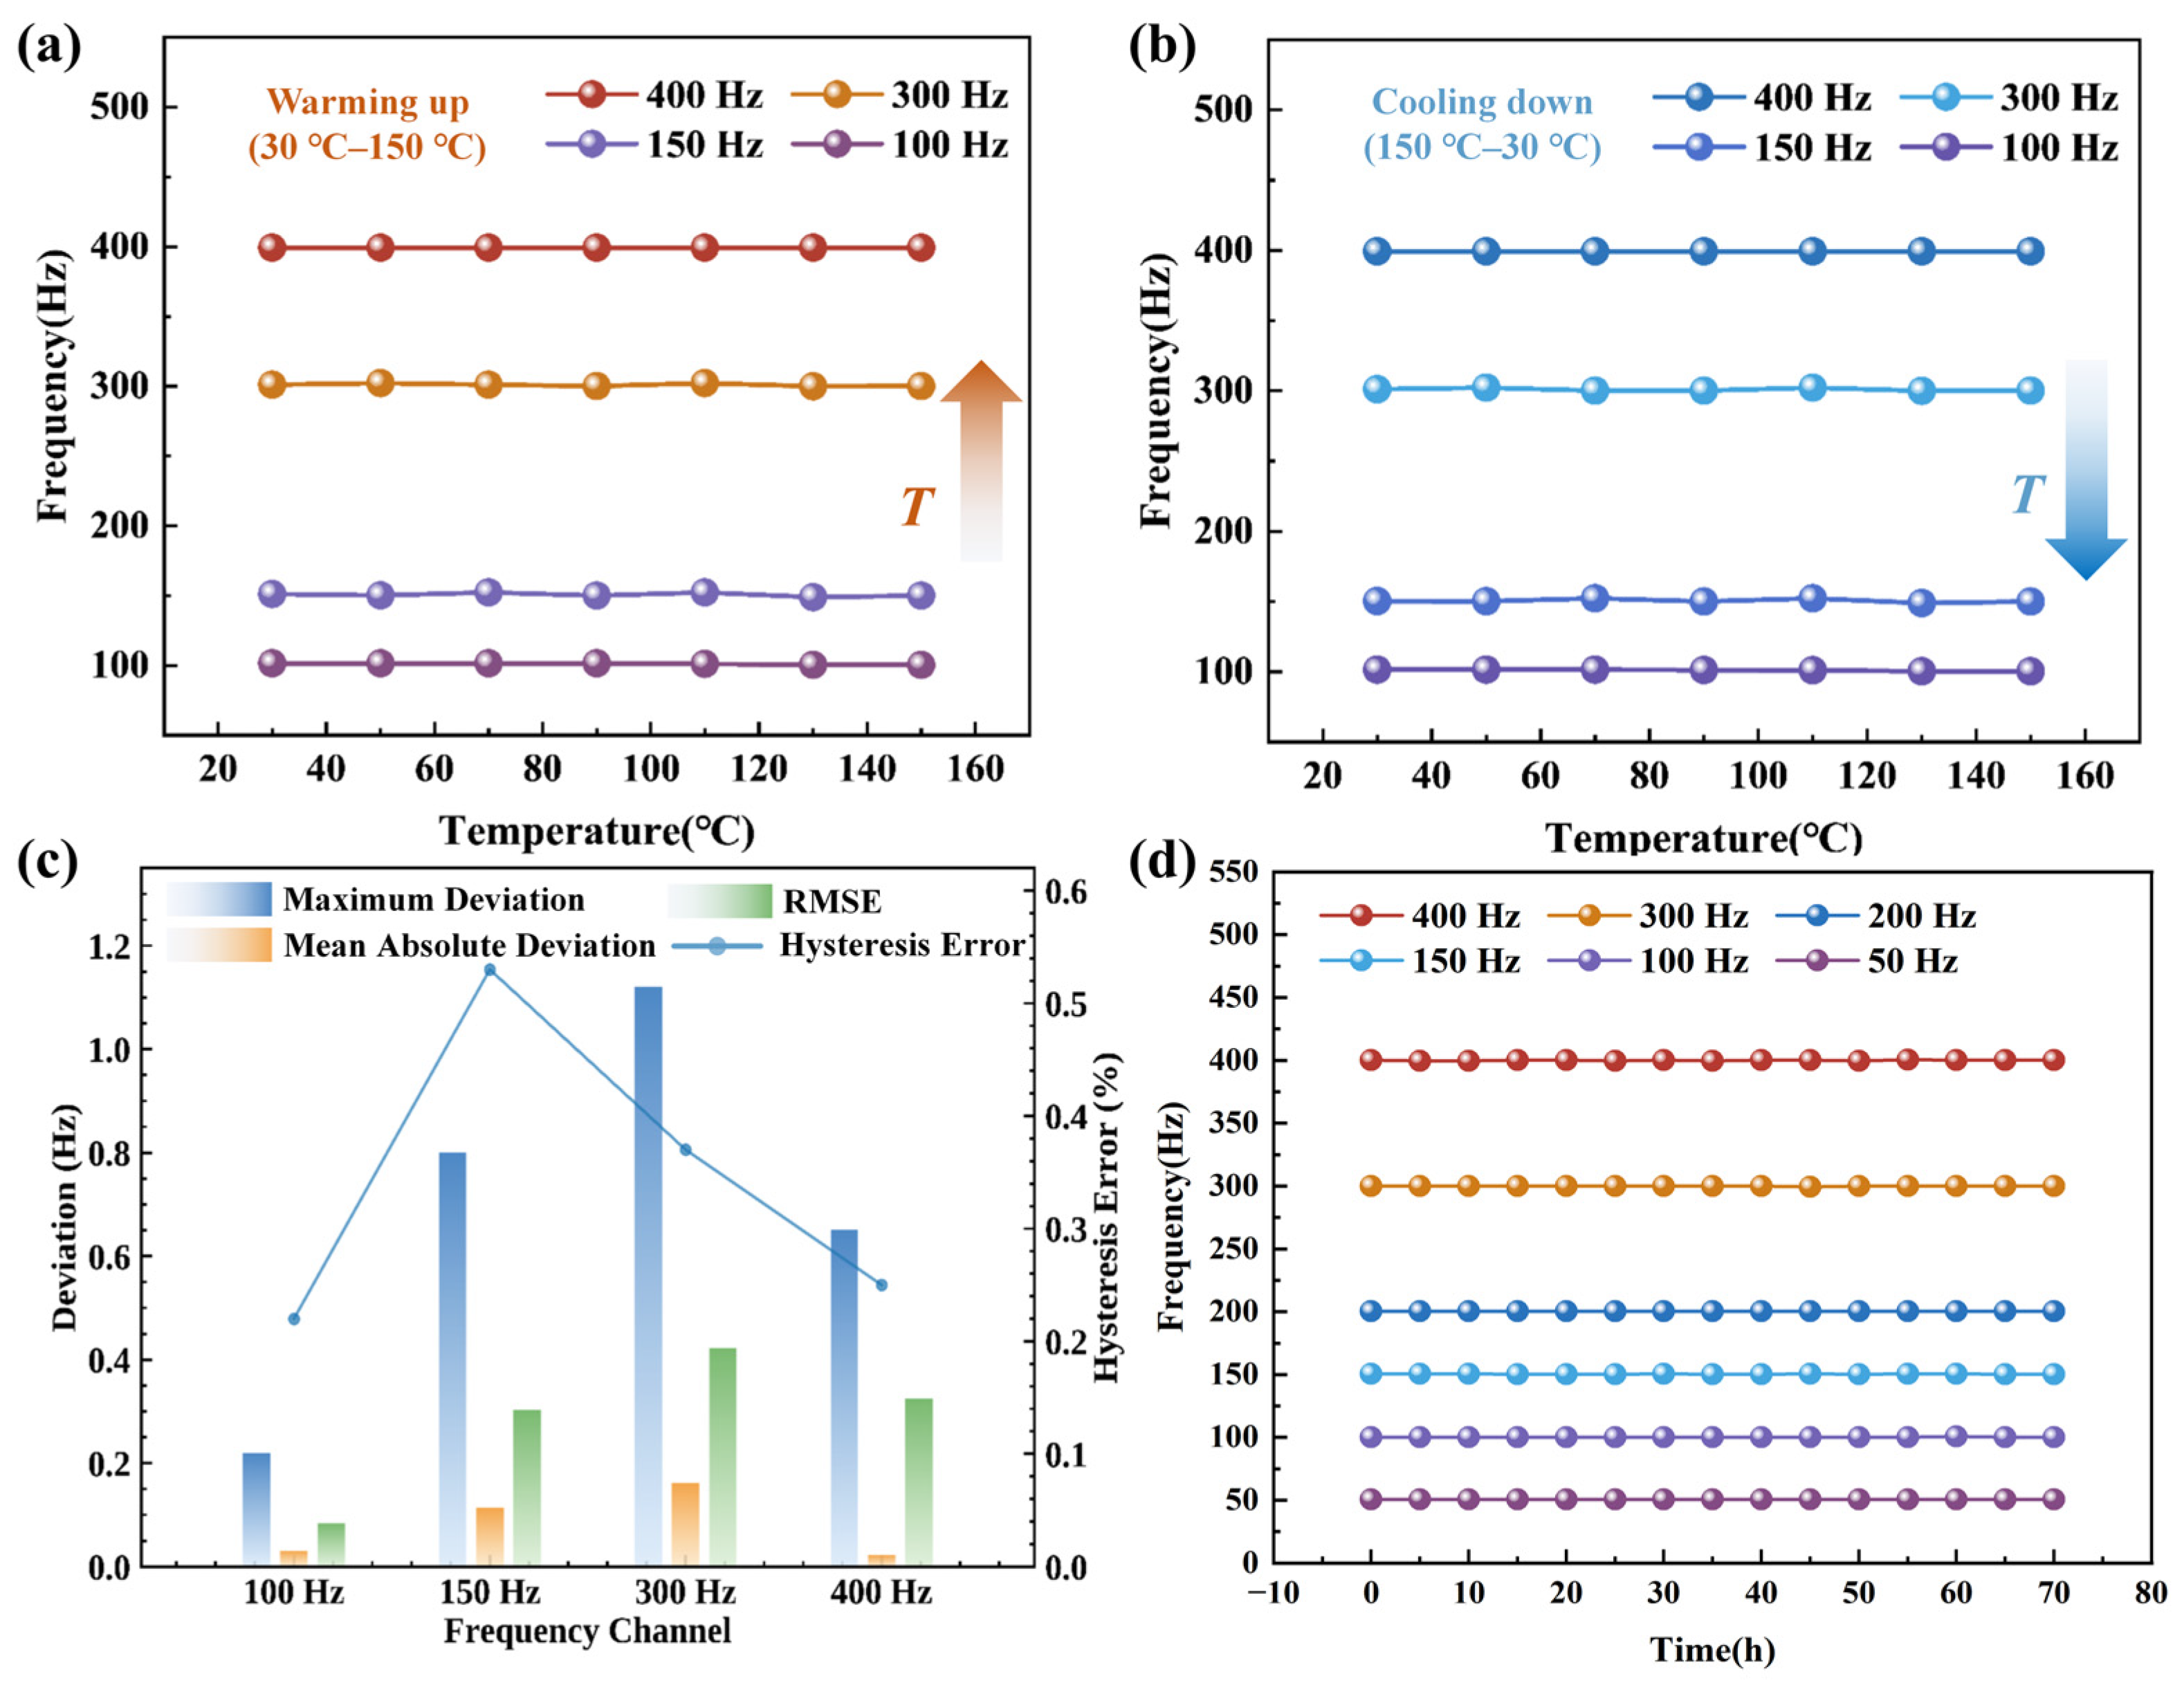
In the temperature-response test, the sensor was placed inside an electric-heating chamber, and a digital thermometer was used to monitor the ambient temperature in real time. Under a fixed driving signal, the temperature was cycled between 30 °C and 150 °C in 20 °C steps during both heating and cooling. The demodulated frequency and the variation in signal intensity at different temperatures were recorded to evaluate temperature cross-sensitivity and the thermal hysteresis characteristics of the system.

4. Experimental Results and Discussion

4.1. Frequency-Response Characteristics

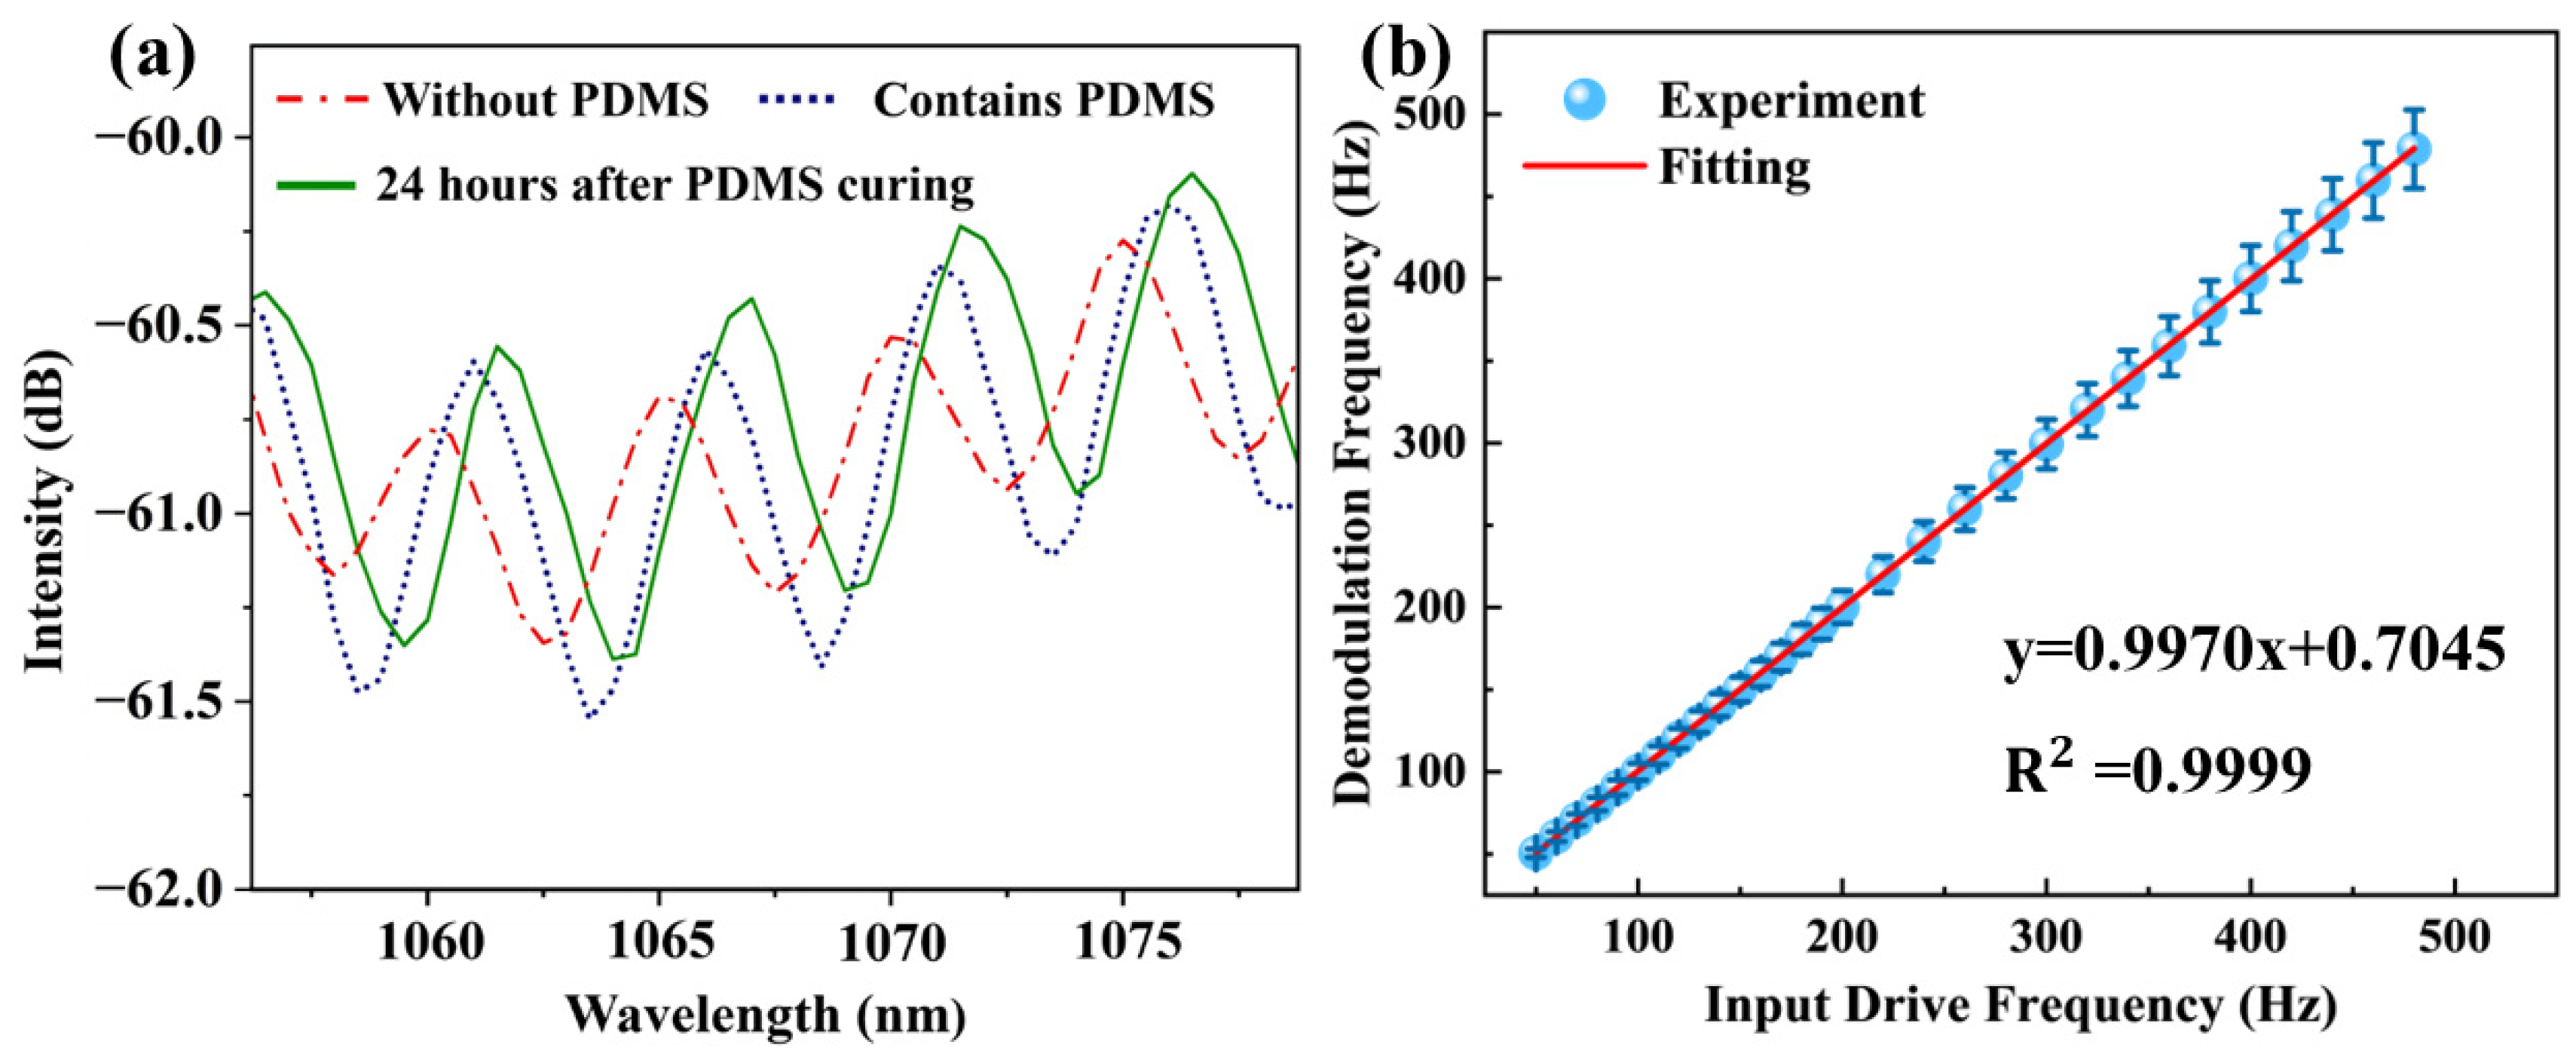
To evaluate the frequency response of the annular tapered fiber resonator under AC excitation, its spectral characteristics were first analyzed. During the curing process, PDMS may introduce additional constraint stresses due to polymerization shrinkage, which could lead to certain changes in the state of the coupling region, the effective optical path length, and the resonance conditions. Therefore, as shown in Figure 5a, we compared the transmission spectra of the device before PDMS encapsulation, after PDMS encapsulation, and 24 h after PDMS curing. The results show that within the 1060–1075 nm wavelength range, the resonance wavelength shifted by approximately 2.5 nm, the extinction ratio changed by about 0.56 dB, and the linewidth changed by about 0.23 nm; the spectrum after standing for 24 h did not exhibit linewidth collapse or significant additional drift. Therefore, PDMS encapsulation primarily caused a slight shift in the device’s initial resonant operating point without compromising the integrity of the resonant structure itself, thereby providing a foundation for subsequent frequency demodulation experiments.
In sensor characterization experiments, the test range must first be defined. Since the fundamental frequencies of global AC power systems are primarily 50 Hz and 60 Hz [25], low-frequency AC signals close to the power frequency range are of significant engineering importance [26,27]. Consequently, this study selects 50 Hz as the lower limit and extends the upper limit to 500 Hz, ensuring that the selected frequency band fully covers the low-frequency characteristic range from the fundamental frequency (50 Hz) to the 10th harmonic (500 Hz), thereby meeting the requirements for practical electrical signal analysis and fault diagnosis. As shown in Figure 5b, in the experiment, the optical response signals acquired in the 50–500 Hz range were subjected to FFT processing, and the position of the main spectral peak was used as the demodulation frequency. Under the current analysis settings, the frequency resolution is 0.01 Hz. Within the test range, the main peak frequency extracted by FFT closely matches the input excitation frequency, with a linear regression coefficient R2 of 0.9999, fully validating its high fidelity in the monitoring of low-frequency AC signals.
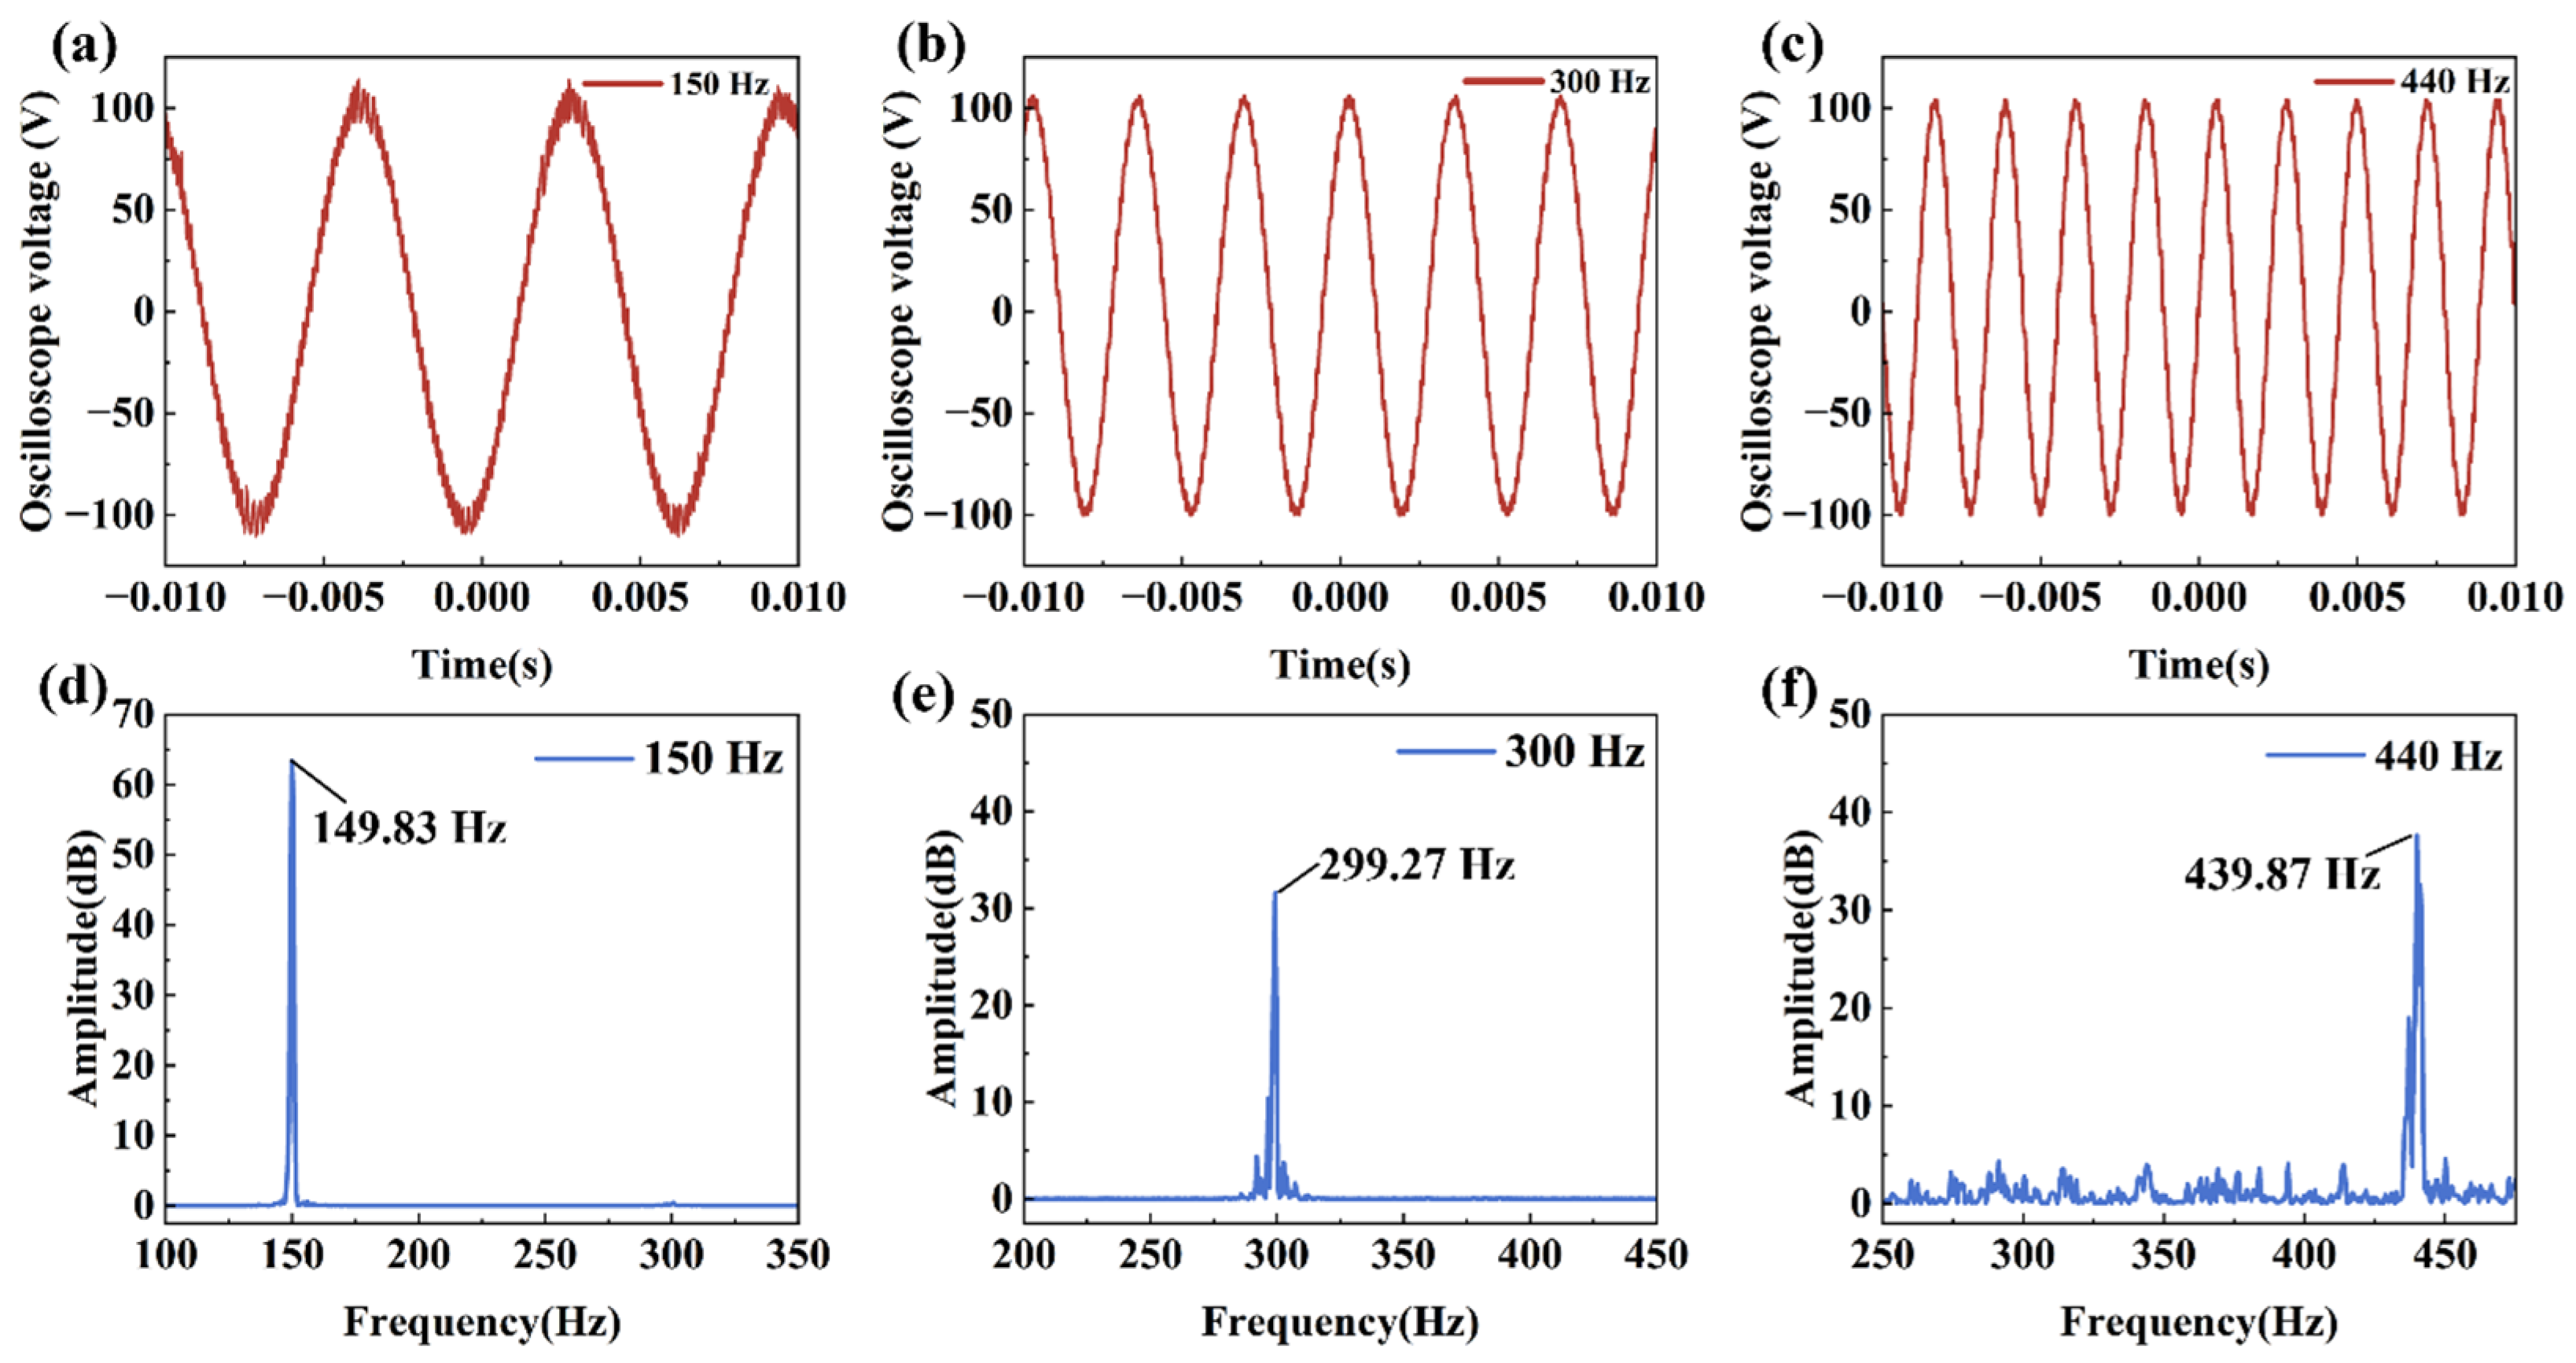
To further illustrate the typical response of the device at different frequencies, 150 Hz, 300 Hz, and 440 Hz were selected as representative operating points, and the corresponding results are shown in Figure 6. Under 150 Hz excitation, the main spectral peak is located at approximately 149.83 Hz; under 300 Hz excitation, it appears at approximately 299.27 Hz; and under 440 Hz excitation, it appears at approximately 439.87 Hz, corresponding to relative errors of 0.11%, 0.24%, and 0.03%, respectively. Thus, the demodulated frequencies at these representative operating points agree closely with the input frequencies, with all relative errors below 1%.
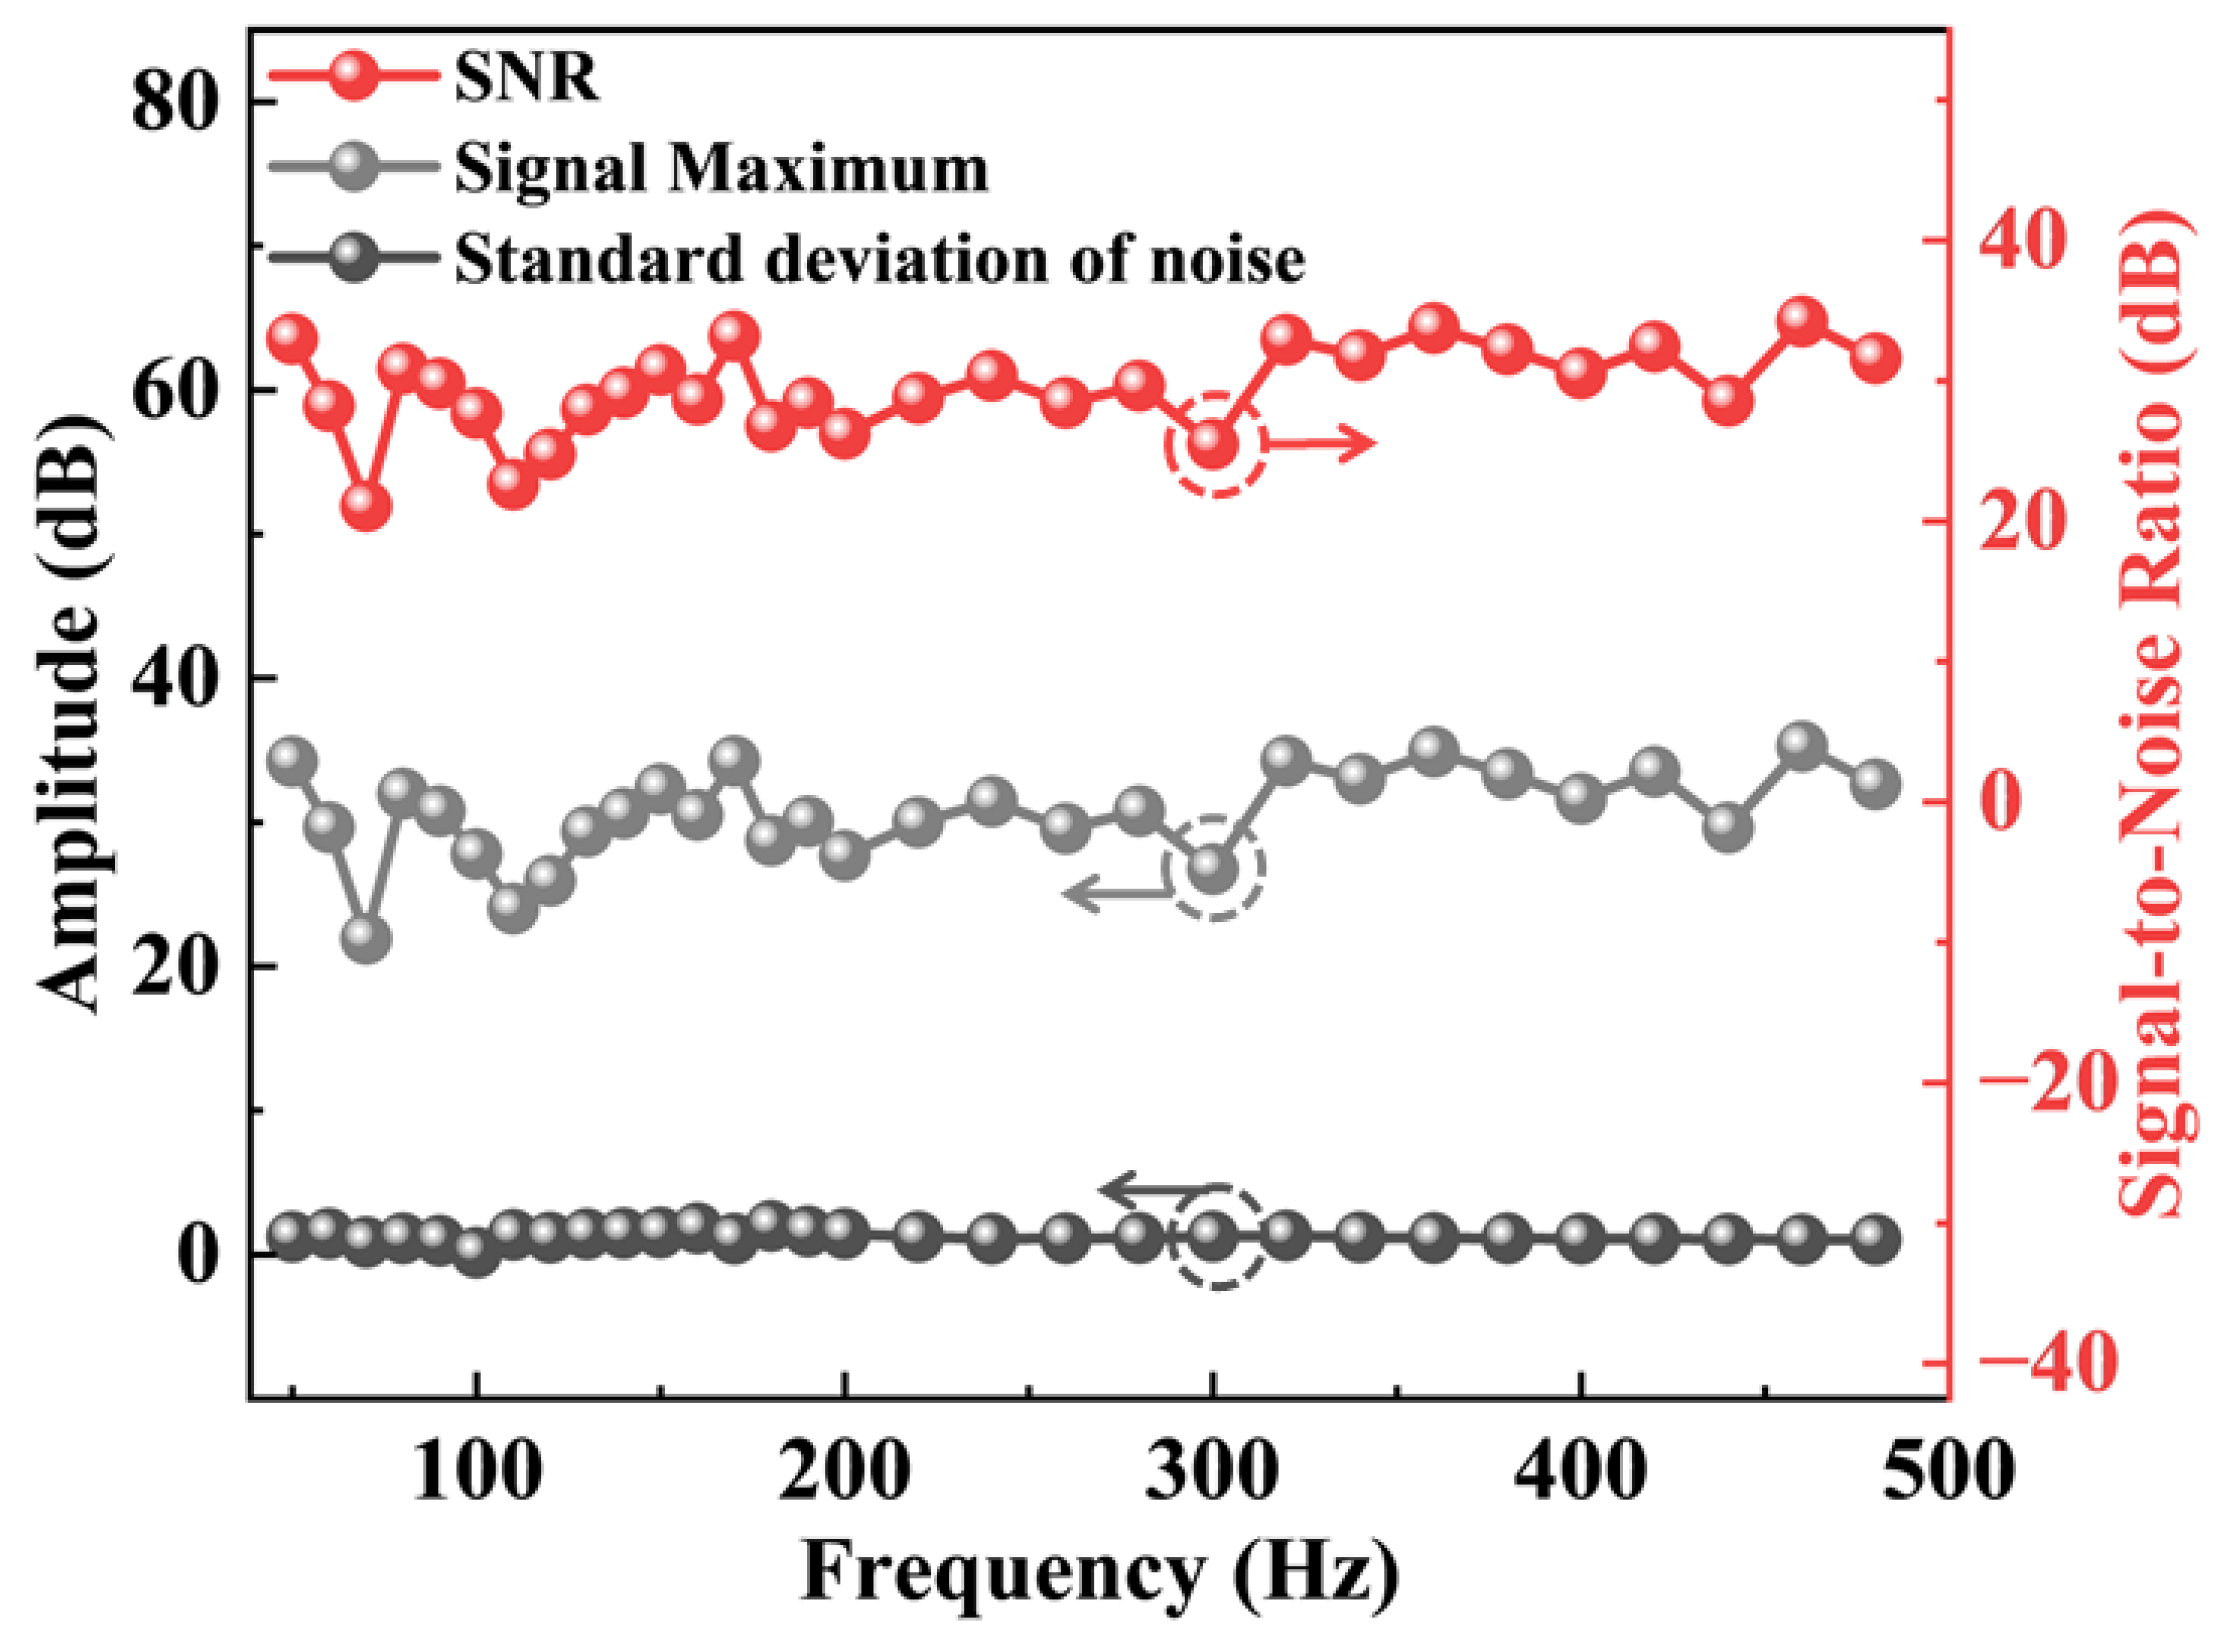
The signal-to-noise ratio (SNR) is a key indicator of sensor quality and reliability [27]. To quantitatively analyze signal quality at different frequencies, statistical analyses were performed on the characteristic peak amplitude, standard deviation of background noise, and SNR for each frequency point sampled within the 50–500 Hz range. In this study, SNR is expressed in decibels (dB) and is calculated as the difference between the characteristic peak amplitude and the background noise level. Figure 7 shows the peak amplitude, standard deviation of background noise, and corresponding SNR for all tested frequency points. The maximum SNR across the entire frequency bandwidth reached 34.22 dB, with most values exceeding 25 dB and only a few falling below this level. These results indicate that the sensor possesses good spectral discriminability and stable signal quality.
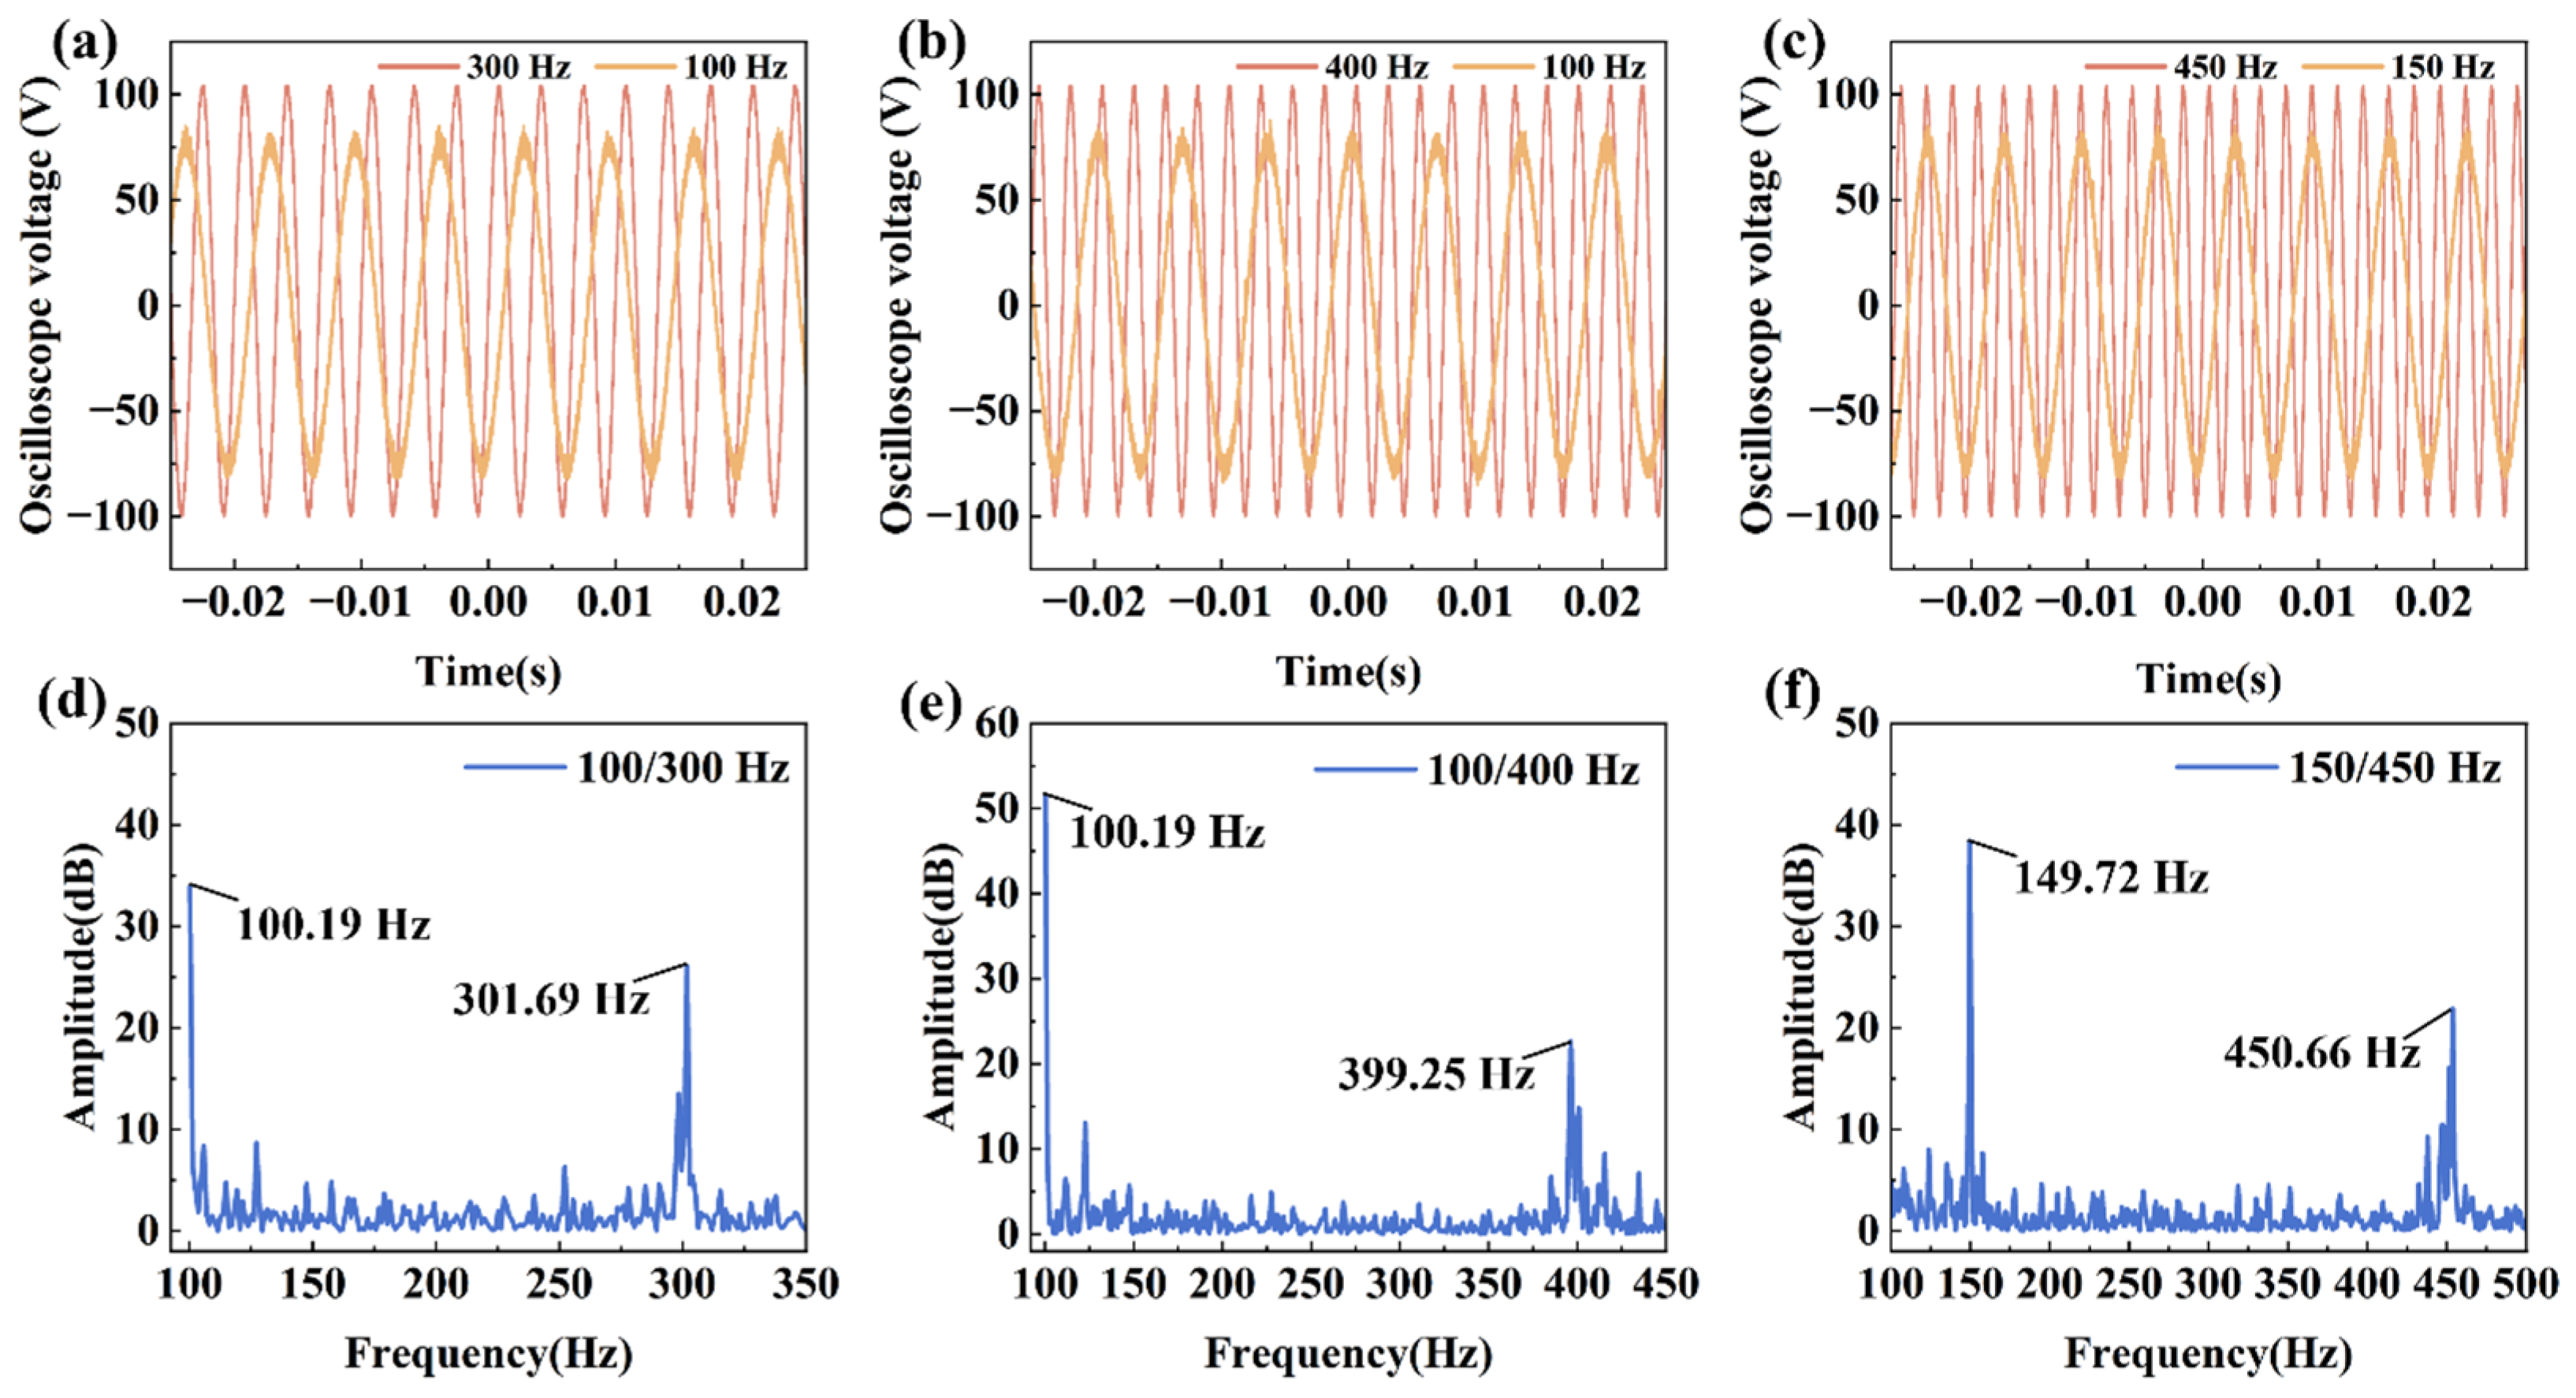
In the single-frequency response experiments, the fabricated sensor demonstrated excellent frequency-tracking capability, indicating that it can accurately identify the frequency of an applied AC driving signal. However, in practical electrical-signal monitoring, the input waveform is seldom an ideal single-frequency sinusoid; instead, it often contains a fundamental component, harmonics, or multiple characteristic frequency components, especially in power-electronic converters, switching power supplies, and complex load conditions. To further evaluate the response of the device to composite frequency signals, dual-frequency driving experiments were carried out to assess its resolution and identification capability for multiple frequency components. Three representative dual-frequency driving signals, namely 100/300 Hz, 100/400 Hz, and 150/450 Hz, were selected for testing. Figure 8 shows the FFT spectra obtained under these excitation conditions. For the 100/300 Hz, 100/400 Hz, and 150/450 Hz cases, the positions of the two main peaks agree well with the preset frequencies, with relative errors all below 1%. These results indicate that under dual-frequency composite excitation, the sensor output retains the principal frequency components of the input signal after FFT processing, and the different frequency components can be clearly resolved.

4.2. Voltage-Amplitude Response

Variations in electrical-signal amplitude are closely related to excitation level, load conditions, power-transfer levels, and operating states [28]. Therefore, after verifying the frequency-demodulation capability of the device, it is important to further investigate its response to changes in the input amplitude. Because the PZT in this experiment was driven by an AC voltage, this section focuses on the response of the sensor output to variations in the driving-voltage amplitude and, on this basis, evaluates its potential for characterizing electrical-signal strength. In the experiment, the frequency of the sinusoidal driving signal was fixed at 250 Hz, and the driving-voltage amplitude was increased from 2 V to 6.5 V in 0.5 V increments. As shown in Figure 9a, the optical response signals recorded under each driving condition were processed by FFT, and the spectral peak amplitude at the characteristic frequency was extracted to analyze the dependence of the sensor output on the input amplitude.
Figure 9b shows the spectral peaks at different drive voltages and their corresponding linear fitting curves. As the input voltage amplitude increases, the demodulated characteristic peaks also increase, exhibiting a good linear relationship within the test range. The correlation coefficient R2 obtained from the linear fitting is 0.9945, indicating that the device exhibits a stable response to amplitude variations at a fixed drive frequency. Further analysis, as shown in Figure 9c, reveals the signal-to-noise ratio results at different drive voltages. We found that the system noise level is low across the tested range, and the SNR remains high even at low voltages, increasing monotonically with voltage. This indicates that the system possesses excellent detection capability and stability.

4.3. Time Stability and Temperature Effects

In power-electronics systems and field-monitoring environments, prolonged continuous operation and fluctuations in ambient temperature during both heating and cooling may affect frequency demodulation [29,30]. Therefore, the sensor must maintain stable performance under complex operating conditions, including long-term continuous operation and varying environmental temperatures.
To evaluate the thermal stability and cycling consistency of the sensor under changing temperature conditions, as shown in Figure 10a,b, temperature-cycling tests were performed over the range of 30–150 °C. The characteristic frequency responses of the 100 Hz, 150 Hz, 300 Hz, and 400 Hz channels were monitored, and statistical analyses were performed on the frequencies measured at the same temperature points during heating and cooling. As shown in Figure 10c, the response deviations of all monitored frequency channels remained very small: the maximum absolute deviation was below 1.120 Hz, the root-mean-square error was below 0.423 Hz, the mean absolute deviation was below 0.031 Hz, and the hysteresis error was below 0.53%. These results demonstrate that the sensor maintains stable performance throughout the temperature cycle, with strong overlap between the heating and cooling curves and no obvious irreversible temperature-induced drift.
The long-term operating stability of the sensor was further evaluated. Under constant environmental conditions, the demodulation results at six driving frequencies, namely 50 Hz, 100 Hz, 150 Hz, 200 Hz, 300 Hz, and 400 Hz, were continuously monitored for a total duration of 70 h. Figure 10d shows the variation in the demodulated frequency as a function of time for the different excitation frequencies. Throughout the test, the demodulation results at each frequency remained highly stable, with no obvious frequency drift or cumulative fluctuation.
To further evaluate the performance of the proposed sensor, Table 1 compares it with representative fiber-optic AC signal/frequency sensing schemes. The comparison focuses mainly on temperature characteristics, demonstrated operating range, signal-identification capability, and stability or packaging strategy. Overall, the proposed device offers an effective approach for single-/dual-frequency identification and long-term stable operation while maintaining a relatively simple structure.

5. Conclusions

This paper proposes and experimentally validates a fiber-optic AC electrical-signal sensor based on a cascaded structure consisting of a piezoelectric ceramic (PZT) driver and a ring-shaped tapered-fiber resonator. Through theoretical simulations incorporating a comprehensive performance-evaluation factor, the optimal waist diameter of the tapered fiber was determined to be 10 μm, providing a suitable balance among mode sensitivity, device loss, and mechanical robustness.
Experimental results show that the sensor exhibits excellent dynamic response and frequency-tracking capability over the low-frequency range of 50–500 Hz. It not only achieves high-accuracy demodulation of single-frequency AC signals (R2 = 0.9999) but also accurately resolves multi-frequency composite signals, with the relative error of each demodulated frequency component remaining below 1%. Furthermore, at a fixed driving frequency, the spectral peak amplitude shows a good linear relationship with the input driving-voltage amplitude over the range of 2–6.5 V (R2 = 0.9945), demonstrating the potential of the proposed structure for characterizing electrical-signal strength. In terms of environmental adaptability and reliability, the device exhibited an extremely low thermal hysteresis error (<0.53%), good consistency during temperature cycling over 30–150 °C, and high demodulation stability during continuous operation for up to 70 h.
Owing to the inherent electrical insulation of its PZT-driven fiber-optic resonator structure, its strong immunity to electromagnetic interference, and its low temperature cross-sensitivity associated with the absence of magnetic media, the proposed sensor shows promise for AC electrical-signal detection under harsh operating conditions. In particular, it may provide a basis for low-frequency signal identification, harmonic analysis, and condition monitoring in complex electromagnetic environments and miniaturized optoelectronic sensing applications.

Author Contributions

Z.Z. and W.S. contributed equally to this work and share first authorship. Conceptualization and design, Z.Z.; Methodology, W.S.; Software development, W.S.; Validation, Z.Z.; Survey research, J.D. and C.X.; Resources, J.L.; Data organization, B.W. and X.Z.; Writing—drafting, Z.Z.; Writing—review and editing, J.L.; Visualization, W.S.; Supervision, J.L. All authors have read and agreed to the published version of the manuscript.

Funding

This work was supported by the National Natural Science Foundation of China (No. 52276094) and the Research Project on Teaching Reform in Ordinary Undergraduate Universities in Hunan Province (No. 202401000142).

Institutional Review Board Statement

Not applicable.

Informed Consent Statement

Not applicable.

Data Availability Statement

The data underlying the results presented in this paper may be obtained from the authors upon reasonable request.

Conflicts of Interest

The authors declare no conflicts of interest.

References

  1. Li, S.T.; Yu, S.H.; Feng, Y. Progress in and prospects for electrical insulating materials. High Volt. 2016, 1, 122–129. [Google Scholar] [CrossRef]
  2. Li, Y.; Guo, J.; He, Y.H.; He, R.M. Research on safety and energy efficiency monitoring technology for substation power system based on load holography perception. AIP Adv. 2025, 15, 025211. [Google Scholar] [CrossRef]
  3. Nazarychev, A.; Iliev, I.; Manukian, D.; Beloev, H.; Suslov, K.; Beloev, I. Review of Operating Conditions, Diagnostic Methods, and Technical Condition Assessment to Improve Reliability and Develop a Maintenance Strategy for Electrical Equipment. Energies 2025, 18, 5832. [Google Scholar] [CrossRef]
  4. Crescentini, M.; Marchesi, M.; Romani, A.; Tartagni, M.; Traverso, P.A. A Broadband, On-Chip Sensor Based on Hall Effect for Current Measurements in Smart Power Circuits. IEEE Trans. Instrum. Meas. 2018, 67, 1470–1485. [Google Scholar] [CrossRef]
  5. Crescentini, M.; Syeda, S.F.; Gibiino, G.P. Hall-Effect Current Sensors: Principles of Operation and Implementation Techniques. IEEE Sens. J. 2022, 22, 10137–10151. [Google Scholar] [CrossRef]
  6. Liu, Y.T.; Tao, Y.; Ye, C.F. Measurement of Transformer DC Bias Current Based on Integrated Array Magnetoresistance Sensors and Signal Fusion Algorithm. IEEE Sens. J. 2025, 25, 10860–10867. [Google Scholar] [CrossRef]
  7. Bohnert, K.; Gabus, P.; Kostovic, J.; Brändle, H. Optical fiber sensors for the electric power industry. Opt. Lasers Eng. 2005, 43, 511–526. [Google Scholar] [CrossRef]
  8. Garcia, Y.R.; Corres, J.M.; Goicoechea, J. Vibration detection using optical fiber sensors. J. Sens. 2010, 1, 936487. [Google Scholar] [CrossRef]
  9. Hillmer, H.; Woidt, C.; Kobylinskiy, A.; Kraus, M.; Istock, A.; Iskhandar, M.S.; Brunner, R.; Kusserow, T. Miniaturized interferometric sensors with spectral tunability for optical fiber technology—A comparison of size requirements, performance, and new concepts. Proc. Photonics 2021, 8, 332. [Google Scholar] [CrossRef]
  10. Wang, J.; Fu, X.; Gao, H.; Gui, X.; Wang, H.; Li, Z. FPGA-based dynamic wavelength interrogation system for thousands of identical FBG sensors. Proc. Photonics 2022, 9, 79. [Google Scholar] [CrossRef]
  11. Senkans, U.; Silkans, N.; Merijs-Meri, R.; Haritonovs, V.; Skels, P.; Porins, J.; Lima, M.S.S.; Spolitis, S.; Braunfelds, J.; Bobrovs, V. Fiber-Optical-Sensor-Based Technologies for Future Smart-Road-Based Transportation Infrastructure Applications. Photonics 2026, 13, 106. [Google Scholar] [CrossRef]
  12. Chen, C.; Li, Z.; Chen, Q.; Zhang, W. Study of an FBG-FP Cascaded Optical Fiber Current Transformer Based on Electrostrictive Material Coupling. Sensors 2025, 25, 2492. [Google Scholar] [CrossRef] [PubMed]
  13. Li, J.H.; Chen, J.H.; Yan, S.C.; Ruan, Y.P.; Xu, F.; Lu, Y.Q. Versatile hybrid plasmonic microfiber knot resonator. Opt. Lett. 2017, 42, 3395–3398. [Google Scholar] [CrossRef] [PubMed]
  14. Wang, F.; Liu, Y.; Wei, H.; Wu, Q.; Peng, Y.; Yu, K.; Liu, Y. Temperature-Insensitive, Wide-Range Optical Fiber Vibration Sensor Based on Dispersion-Compensated Fiber. IEEE Sens. J. 2023, 23, 15597–15606. [Google Scholar] [CrossRef]
  15. Okayasu, M.; Shimazu, I. Electric Power Generation of PZT Piezoelectric Ceramics Using Both Direct and Inverse Piezoelectric Effects. J. Electron. Mater. 2025, 54, 5143–5150. [Google Scholar] [CrossRef]
  16. Xiang, W.K.; Yin, Z.F.; Yang, X. Study and Application of PZT in the Field of Wearable Devices. Adv. Mater. Technol. 2025, 10, 2401692. [Google Scholar] [CrossRef]
  17. Chiasera, A.; Dumeige, Y.; Féron, P.; Ferrari, M.; Jestin, Y.; Conti, G.N.; Pelli, S.; Soria, S.; Righini, G.C. Spherical whispering-gallery-mode microresonators. Laser Photonics Rev. 2010, 4, 457–482. [Google Scholar] [CrossRef]
  18. Min, B.K.; Ostby, E.; Sorger, V.; Ulin-Avila, E.; Yang, L.; Zhang, X.; Vahala, K. High-Q surface-plasmon-polariton whispering-gallery microcavity. Nature 2009, 457, 455–458. [Google Scholar] [CrossRef]
  19. Yang, S.C.; Wang, Y.; Sun, H.D. Advances and Prospects for Whispering Gallery Mode Microcavities. Adv. Opt. Mater. 2015, 3, 1136–1162. [Google Scholar] [CrossRef]
  20. Zhang, Z.H.; Kan, J.W.; Yu, X.C.; Wang, S.Y.; Ma, J.J.; Cao, Z.X. Sensitivity enhancement of piezoelectric force sensors by using multiple piezoelectric effects. AIP Adv. 2016, 6, 075320. [Google Scholar] [CrossRef]
  21. Dai, S.; Zhong, H.; Rao, X.; Liu, J.; Fu, C.; Wang, Y.; Chen, G.Y. Hybrid-Mechanism Distributed Sensing Using Forward Transmission and Optical Frequency-Domain Reflectometry. Sensors 2025, 25, 6229. [Google Scholar] [CrossRef]
  22. Zakis, K.; Olonkins, S.; Udalcovs, A.; Lukosevics, I.; Prigunovs, D.; Grube, J.; Bikse, L.; Supe, A.; Ozolins, O.; Spolitis, S.; et al. Cladding-Pumped Er/Yb-Co-Doped Fiber Amplifier for Multi-Channel Operation. Photonics 2022, 9, 457. [Google Scholar] [CrossRef]
  23. Tien, P.v. Light waves in thin films and integrated optics. Appl. Opt. 1971, 10, 2395–2413. [Google Scholar] [CrossRef] [PubMed]
  24. Tong, L.; Gattass, R.R.; Ashcom, J.B.; He, S.; Lou, J.; Shen, M.; Maxwell, I.; Mazur, E. Subwavelength-diameter silica wires for low-loss optical wave guiding. Nature 2003, 426, 816–819. [Google Scholar] [CrossRef] [PubMed]
  25. Fernández-Guillamón, A.; Muljadi, E.; Molina-García, A. Frequency control studies: A review of power system, conventional and renewable generation unit modeling. Electr. Power Syst. Res. 2022, 211, 108191. [Google Scholar] [CrossRef]
  26. Yang, S.; Lao, K.-W.; Hui, H.; Chen, Y. A robustness-enhanced frequency regulation scheme for power system against multiple cyber and physical emergency events. Appl. Energy 2023, 350, 121725. [Google Scholar] [CrossRef]
  27. Mohammadi, Y.; Polajžer, B.; Leborgne, R.C.; Khodadad, D. Quantifying power system frequency quality and extracting typical patterns within short time scales below one hour. Sustain. Energy Grids Netw. 2024, 38, 101359. [Google Scholar] [CrossRef]
  28. Chu, G.; Zeng, P. Real-time motor operating state recognition via multi-sensor fusion: A wavelet-neural-evidence framework for industrial condition monitoring. PLoS ONE 2025, 20, e0335360. [Google Scholar] [CrossRef]
  29. Susinni, G.; Rizzo, S.A.; Iannuzzo, F. Two Decades of Condition Monitoring Methods for Power Devices. Electronics 2021, 10, 683. [Google Scholar] [CrossRef]
  30. Han, Z.; Wang, C.; Wang, J.; Liu, Y.; Tian, H. Design and demodulation stability analysis of cascaded photonic crystal nanobeam cavities for dual-parameter detection. Opt. Commun. 2023, 530, 129063. [Google Scholar] [CrossRef]
Figure 1. Schematic illustration of the operating principle of the ring-shaped tapered-fiber resonator. Light is coupled into the ring structure and propagates repeatedly around the loop.
Photonics 13 00459 g001
Figure 2. (a) Dependence of bending loss, scattering loss, and structural robustness on fiber diameter; (b) Normalized parameters used for performance evaluation; and (c) Variation in the FOM as a function of fiber diameter.
Photonics 13 00459 g002
Figure 3. Fabrication and integration process of the tapered-fiber ring resonator. (af) Sequential illustration of the sensor preparation, involving flame-heated tapering, knotting into a ring structure, ring size optimization for self-coupling, and final PDMS-assisted encapsulation onto a PZT actuator under real-time OSA monitoring. (g) Micrograph of the coupling region, highlighting the waist and taper zones.
Photonics 13 00459 g003
Figure 4. Experimental setup for sensor performance characterization. (a) Schematic diagram of the experimental system. Light emitted by a supercontinuum light source is coupled into the optical fiber sensing element, and the output spectral response is recorded by a spectrometer. The system is connected to the spectrometer in real time via a computer to monitor the spectral response and perform time-domain sampling and frequency analysis. A signal generator provides adjustable electrical excitation to the PZT. (b) Microscopic photograph of a ring-shaped tapered fiber resonator. The blue and red lines represent the optical and electrical paths, respectively.
Photonics 13 00459 g004
Figure 5. (a) Transmittance spectra of the device at different encapsulation stages. The superimposed spectra compare the optical response of the device before encapsulation, after PDMS encapsulation, and after standing for 24 h; (b) a comparison of the input drive frequency with the demodulation frequency obtained via FFT in the 50–500 Hz range.
Photonics 13 00459 g005
Figure 6. Frequency demodulation performance of the sensor. (ac) Time-domain waveforms of the 150 Hz, 300 Hz, and 440 Hz input drive signals used as excitation references. (df) Corresponding FFT power spectra of the actual sensor output, with frequency peaks at 149.83 Hz, 299.27 Hz, and 439.87 Hz, respectively, which closely match the input excitation frequencies.
Photonics 13 00459 g006
Figure 7. Signal characteristics in the frequency range from 50 Hz to 500 Hz. The figure shows the signal peak (gray), the standard deviation of the background noise (black), and the corresponding signal-to-noise ratio (SNR, red).
Photonics 13 00459 g007
Figure 8. Sensor response under dual-frequency excitation. (ac) Mixed-frequency time-domain waveforms and (df) corresponding FFT spectra for three driving combinations: 100/300 Hz, 100/400 Hz, and 150/450 Hz. The distinct spectral peaks at the respective input frequencies demonstrate the system’s capability for multi-signal discrimination without significant cross-talk.
Photonics 13 00459 g008
Figure 9. Linear voltage response of the sensor at 250 Hz. (a) Data chart of the FFT spectra at different drive voltages ranging from 2 V to 6.5 V. (b) Curve showing the relationship between the FFT peak and the input voltage, demonstrating good linear correlation with an R2 value of 0.9945. Error bars indicate the standard deviation of multiple measurement results. (c) Signal characteristics in the range of 2 V to 6.5 V: signal peak (gray), standard deviation of background noise (black), and corresponding signal-to-noise ratio (red).
Photonics 13 00459 g009
Figure 10. Thermal stability and long-term reliability of the sensor. (a,b) Frequency response during heating and cooling cycles between 30 °C and 150 °C. (c) Statistical analysis of maximum absolute deviation, root-mean-square error, mean absolute deviation and hysteresis error across different channels. (d) Long-term stability monitoring of the demodulated frequency over 70 h under various excitation frequencies. The small fluctuations indicate excellent environmental robustness.
Photonics 13 00459 g010
Table 1. Comparison of representative fiber-optic AC signal frequency sensing schemes.
Sensing SchemeTemperature Characteristic/
Test Range
Demonstrated RangeSignal-Identification CapabilityStability/PackagingRef
PZT-driven FBG-FP cascaded structure20–50 °C0–7 kHz; 0.15–42 mASingle-frequency identificationEnhanced resistance to temperature/vibration disturbances with compensation strategy[12]
Hybrid plasmonic microfiber knot resonator<2 pm/°C30 Hz–6 kHzSingle-frequency identificationPDMS encapsulation[13]
PZT-driven dispersion-compensated fiber structure25–60 °C0.1 Hz–47 kHzSingle-/dual-frequency identification70 min continuous operation[14]
PZT-driven ring-shaped tapered-fiber resonator30–150 °C50–500 HzSingle-/dual-frequency identification70 h continuous operation; PDMS encapsulationThis work
Disclaimer/Publisher’s Note: The statements, opinions and data contained in all publications are solely those of the individual author(s) and contributor(s) and not of MDPI and/or the editor(s). MDPI and/or the editor(s) disclaim responsibility for any injury to people or property resulting from any ideas, methods, instructions or products referred to in the content.