Article

Laser Turning with Advanced Process Monitoring by Optical Microphone


Applied Laser and Photonics Group, University of Applied Sciences Aschaffenburg, 63743 Aschaffenburg, Germany
*
Author to whom correspondence should be addressed.
Photonics 2026, 13(5), 448; https://doi.org/10.3390/photonics13050448
Submission received: 2 March 2026 / Revised: 10 April 2026 / Accepted: 30 April 2026 / Published: 1 May 2026
(This article belongs to the Special Issue Advanced Lasers and Their Applications, 3rd Edition)

Abstract

We report on a novel approach for the monitoring of tangential laser turning with ultrashort laser pulses. By using an ultra-sonic sensor consisting of a membrane-free optical microphone, the current state of the ablation process can be analyzed, potentially enabling a real-time automated regulation. With its high sensitivity, bandwidth, and sampling rate, it is an ideal tool for process monitoring. The material ablation caused by focused femtosecond laser pulses produces distinct sound waves, which can be detected by the optical microphone. The diameter reduction of a rotating cylindrical workpiece during the laser turning process with ultrashort laser pulses results in a variation in the acoustic emissions. From this, properties like the state of the machining progress can be inferred.

1. Introduction

Focused ultrashort laser pulses (USPs) are an established tool for micromachining a wide variety of materials. Pulse durations in the femtosecond regime enable contact-less material ablation with almost no thermal effects to the workpiece. Additionally, small focus diameters allow the realization of feature sizes on a micrometer scale. This practice is already being applied in various fields of operations like laser surface treatment, laser drilling, or precision cutting [1,2,3]. Laser turning with ultrashort laser pulses represents the process of turning on a conventional lathe while using a focused USP beam as a tool. Over the past years, this approach gained considerable attention in different fields of application like reconditioning of grinding wheels [4,5], tool manufacturing [6,7,8] or medical engineering [9]. Since the process result depends on a variety of parameters such as focused beam propagation, focal plane positioning, geometrical conditions, and others [10,11], the usage of additional process monitoring for the sake of increased efficiency as well as a user-optimized practice is considered beneficial for the further development of this particular micromachining approach.
When a focused ultrashort pulse laser beam strikes a solid surface, atoms and molecules within the material absorb the incoming energy and release ions. These ions, in turn, also absorb laser radiation and give rise to a high-temperature, high-density plasma plume composed of free electrons, ionized atoms, and related species. The rapid expansion of this plasma plume generates a shockwave, which is detected as sound waves by the optical microphone [12]. Furthermore, it is notable that the thermal stress of the material and its release also play a role in the generation of sound waves. The absorption of a laser pulse by the material causes a localized temperature increase that results in thermal expansion, generating a thermoelastic wave within the solid [13,14]. This produces a non-zero lateral gradient of the acoustic amplitude along the surface, which in turn induces particle motion parallel to the surface due to acoustic diffraction [15]. These mechanisms enable the ablation process triggered by ultrashort laser pulses to be analyzed with an acoustic sensor, i.e., a microphone.
While there are commercially available systems for process monitoring that can be used with numerous laser processes that rely on continuously emitting lasers, there are no available sensor systems that can be used to monitor the ablation process performed with USP lasers. The direct transfer of known systems from macro material processing is often insufficient, as the requirements for very small processing geometries and very fast processes pose an impediment. For instance, optical coherence tomography (OCT) is frequently employed to monitor laser cutting or welding processes [16,17,18]. The direct application of the system in the laser ablation process using USP lasers is not possible due to the extremely small process geometries and low process emissions. One method of monitoring short-pulse laser processes is to detect the emerging plasma by laser-induced breakdown spectroscopy, which enables the differentiation of ablated materials. Furthermore, laboratory-scale methodologies have been developed that utilize silicon-based line cameras to detect changes in the secondary emitted intensity spectrum within the range of 200 nm and 600 nm and allow for drawing conclusions on processing events [19]. Compared with the current deployment rates in USP laser processing, this system has a low sampling rate, which, in combination with its restricted spectral bandwidth, limits its applicability. In addition to optical signal detection using photodiodes or cameras, acoustic process monitoring via microphone detection of acoustic process emissions is also a successful method. This has been demonstrated for processes such as laser welding [20,21], laser cutting [22], additive manufacturing [23], and crack detection [24,25]. Nevertheless, in consideration of the findings of numerous research studies [24,26,27], it may be concluded that conventional microphones have the disadvantage of a relatively narrow bandwidth with high sensitivity for frequencies up to 20 kHz but have very low or no sensitivity for higher frequency ranges.
The utilization of USP laser systems in material processing is distinguished by a high acoustic emission intensity within the pulse frequency range, i.e., the pulse repetition rate and its higher harmonics [28]. Conventional microphones are unable to detect these acoustic emissions because of repetition rates exceeding 50 kHz, and sometimes extending into the megahertz regime. Newly available optical microphones offer the advantage of achieving sampling rates of up to 4 MHz, enabling the detection and analysis of acoustic process emissions with much higher temporal resolution and at higher frequency ranges [25]. These microphones exploit changes in the refractive index of air induced by sound waves, which can be detected by a Fabry–Pérot resonator attached to the tip of an optical fiber. The utilization of such optical microphones in industrial process monitoring has been demonstrated in a number of applications, including the inspection of high-voltage cables [29], the assembly of connectors in engine construction [30], and various non-destructive material testing methods [31,32,33]. In addition to these applications, optical microphones have been successfully used to control welding depth in continuous-wave laser welding processes [34]. Authier et al. further presented a comparison of OCT and an optical microphone for monitoring the welding depth and the formation of the required keyhole in a subsequent study [35]. Optical microphones were also used for process monitoring during laser welding of glass to detect stress-induced cracks resulting from the low thermal conductivity of the material [25]. In addition to the applications in laser welding described above, optical microphones have also been employed in areas such as additive manufacturing [36,37], laser metal deposition [38], laser micro drilling [39], and other processes [40,41,42]. Recently, the advanced features of the optical microphone also enabled the monitoring of USP laser processes [43]. Within this context, a layer-detection system was tested to detect transitions during the ablation of multilayer materials consisting of copper and polyimide, as in the printed circuit board manufacturing process [44].
As previous studies have already shown, the level of acoustic energy is coupled to the ablation rate [44]. The actual ablation is dependent on the fluence and is linked in detail to a wide variety of ablation processes (spallation, phase explosion, fragmentation, vaporization, plasma) [45]. However, all these processes occur as a result of a single laser pulse, which leads to sound generation at this frequency and accounts for the frequency bands considered in this study.
Employing this type of microphone to observe the corresponding frequency range in a USP process constitutes a novel approach and differs from other acoustic detectors with respect to both frequency range and sensitivity. By applying this advanced monitoring technology to the laser turning process, it is possible to determine the process state by analyzing acoustic emissions. Because the laser’s position relative to the workpiece’s edge is the main parameter for inducing material ablation, tracing the ablation process by detecting the emitted sound waves clearly shows when the process is complete, and the targeted material diameter has been reached. Other than in microdrilling, where the cavity geometry hinders acoustic wave expansion, the laser turning process favors acoustic wave expansion because ablation occurs continuously at the material surface. This makes the laser turning process an excellent application for the use of the optical microphone as a process monitoring tool.

2. Materials and Methods

2.1. Laser System

The experiments were conducted on a laser micromachining station equipped with five mechanical axes (GL.evo, GFH GmbH, Deggendorf, Germany). Three linear axes realize the lateral and vertical positioning and movement of the focused laser beam on the material. Two rotational axes are used for adjusting the tilt and realizing the rotation of the workpiece. The maximum workpiece rotation speed is 500 min−1. As a laser source, a TruMicro 5050 Femto Edition (Trumpf SE & CO. KG, Ditzingen, Germany) with a pulse repetition rate of 100 kHz, a wavelength of 1030 nm, a pulse width of 800 fs, and an average power output of 40 W was used. With a beam diameter of 4.1 mm and a beam quality factor M2 of 1.3, the processing head with a focal length of 60 mm generates a focal spot diameter of 25 µm with a Rayleigh range of 365.1 µm. As processing gas N2 with a flow rate of 15 L/min at an applied pressure of 0.5 bar passing a nozzle diameter of 1 mm was used. With this setup, a maximum fluence of 81.8 J/cm2 on a plane surface is feasible. Additionally, a trepanning optic is placed in an optional separate beam path, allowing rotation of the focused laser beam at a speed of up to 28,000 min−1 with an adjustable diameter. The laser is guided through a λ /4 wave plate directly in front of the focusing optic to ensure circular polarization, hence preventing polarization effects on the ablation.

2.2. Optical Microphone

The microphone used for process monitoring (Eta450, XARION Laser Acoustics GmbH, Vienna, Austria) has a bandwidth of 50 kHz to 2 MHz with a dynamic range of 100 dB. While conventional microphones detect sound waves via vibrating membranes, the here-installed measuring system is a Fabry–Pérot interferometer. The sensor head consists of two partially transparent, parallel mirrors that receive a laser beam coupled via an optical waveguide. The change in air density caused by sound waves results in a change in the refractive index in the air cavity of the resonator located in the sensor head. The alteration in the optical path length results in a modification to the interference in the etalon, consequently leading to a change in the intensity of the returning light. A sampling rate of 3.1 MHz was used to monitor the laser turning process. To calculate the spectrogram, the acoustic signal is divided into discrete frequency bands, each with a corresponding normalized acoustic power spectral density. Based on the spectrogram, acoustic energy is calculated over a defined frequency range of 10 kHz to 1550 kHz to evaluate process events quickly and efficiently. In order to compensate for local maxima in the calculated progression, different sizes of the energy consideration window, with a period of 1 ms and 1000 ms, are used to calculate the acoustic energy with the corresponding number of spectra. However, this has no influence on the temporal resolution of the depicted acoustic energy. Scaling over time is performed by adding the non-normalized acoustic power spectral density from a specified number of spectra within the defined frequency range. The acoustic energy calculated in this manner is relative and has been normalized for visualization. The microphone has a sensitivity of 100 mV/Pa and a self-noise level of 5 µPa (at 500 kHz). Other microphones for industrial applications or research purposes based on piezoelectric sensors may operate at frequencies up to 100 kHz; however, they would lack sensitivity with about 3.5 mV/Pa and operate at a higher self-noise level of 35 dB or approximately 1.12 mPa (MP30-Ultra, Roga Instruments, Nentershausen, Germany). For further details of the optical microphone, its functionality, and performance, we refer to [35,46].

2.3. Material and Process Characterization

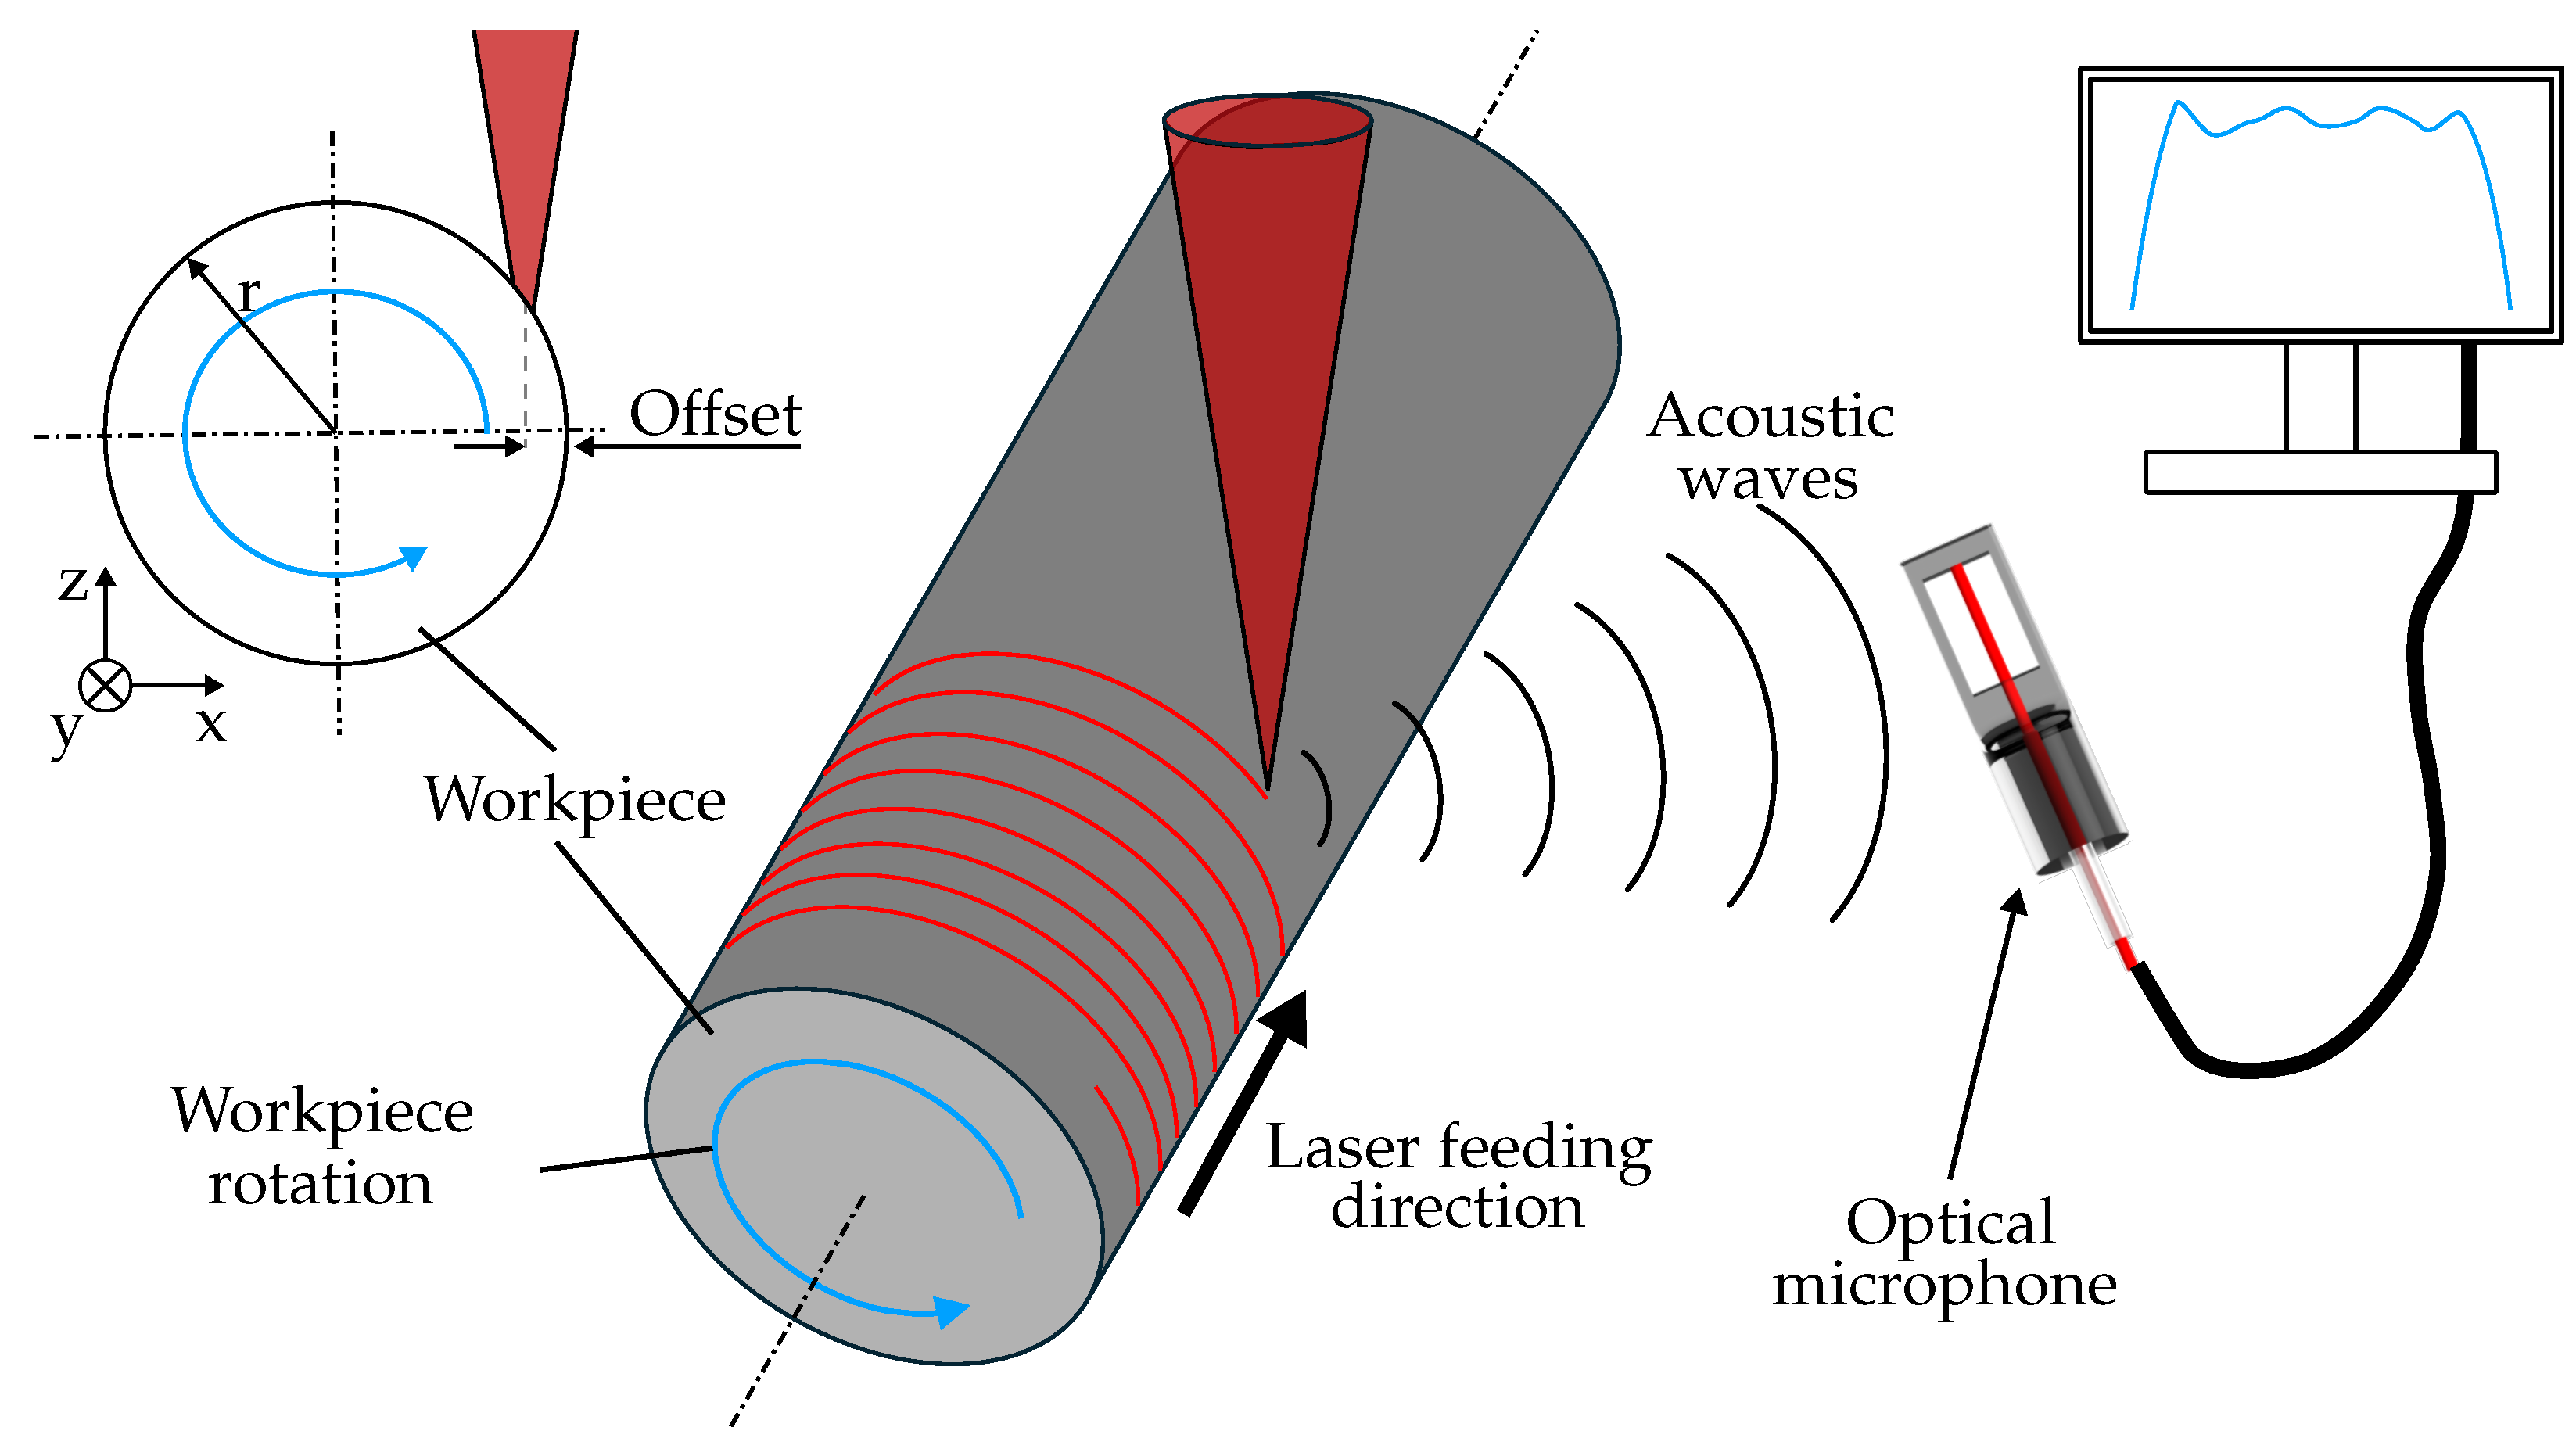
Laser turning with ultrashort laser pulses enables the manufacturing of rotationally symmetric workpieces with feature sizes in the micrometer range. This contribution focuses on the tangential process in which the laser beam is guided along the outer contour of the rotating workpiece to ablate material and realize the final geometry, as illustrated in Figure 1.
To generate material ablation, the focused laser beam must be guided a certain distance into the material relative to the outer circumference of the workpiece. This distance, also called the offset, plays a significant role in the tangential laser turning process because it strongly affects the laser-irradiated area on the material surface and, consequently, the effective laser fluence and pulse-to-pulse overlap. A detailed description of the calculations in this matter is given by the author and others in [11]. For the experimental investigations, cemented carbide rods (K-44UF) with a diameter of 1 mm were used as test material. The material consists of 12% cobalt and 88% tungsten carbide and has a Vickers hardness of 1690 kg/mm2 and a flexural strength of 4000 N/mm2. These properties make the material appealing for use as drilling and cutting tools.
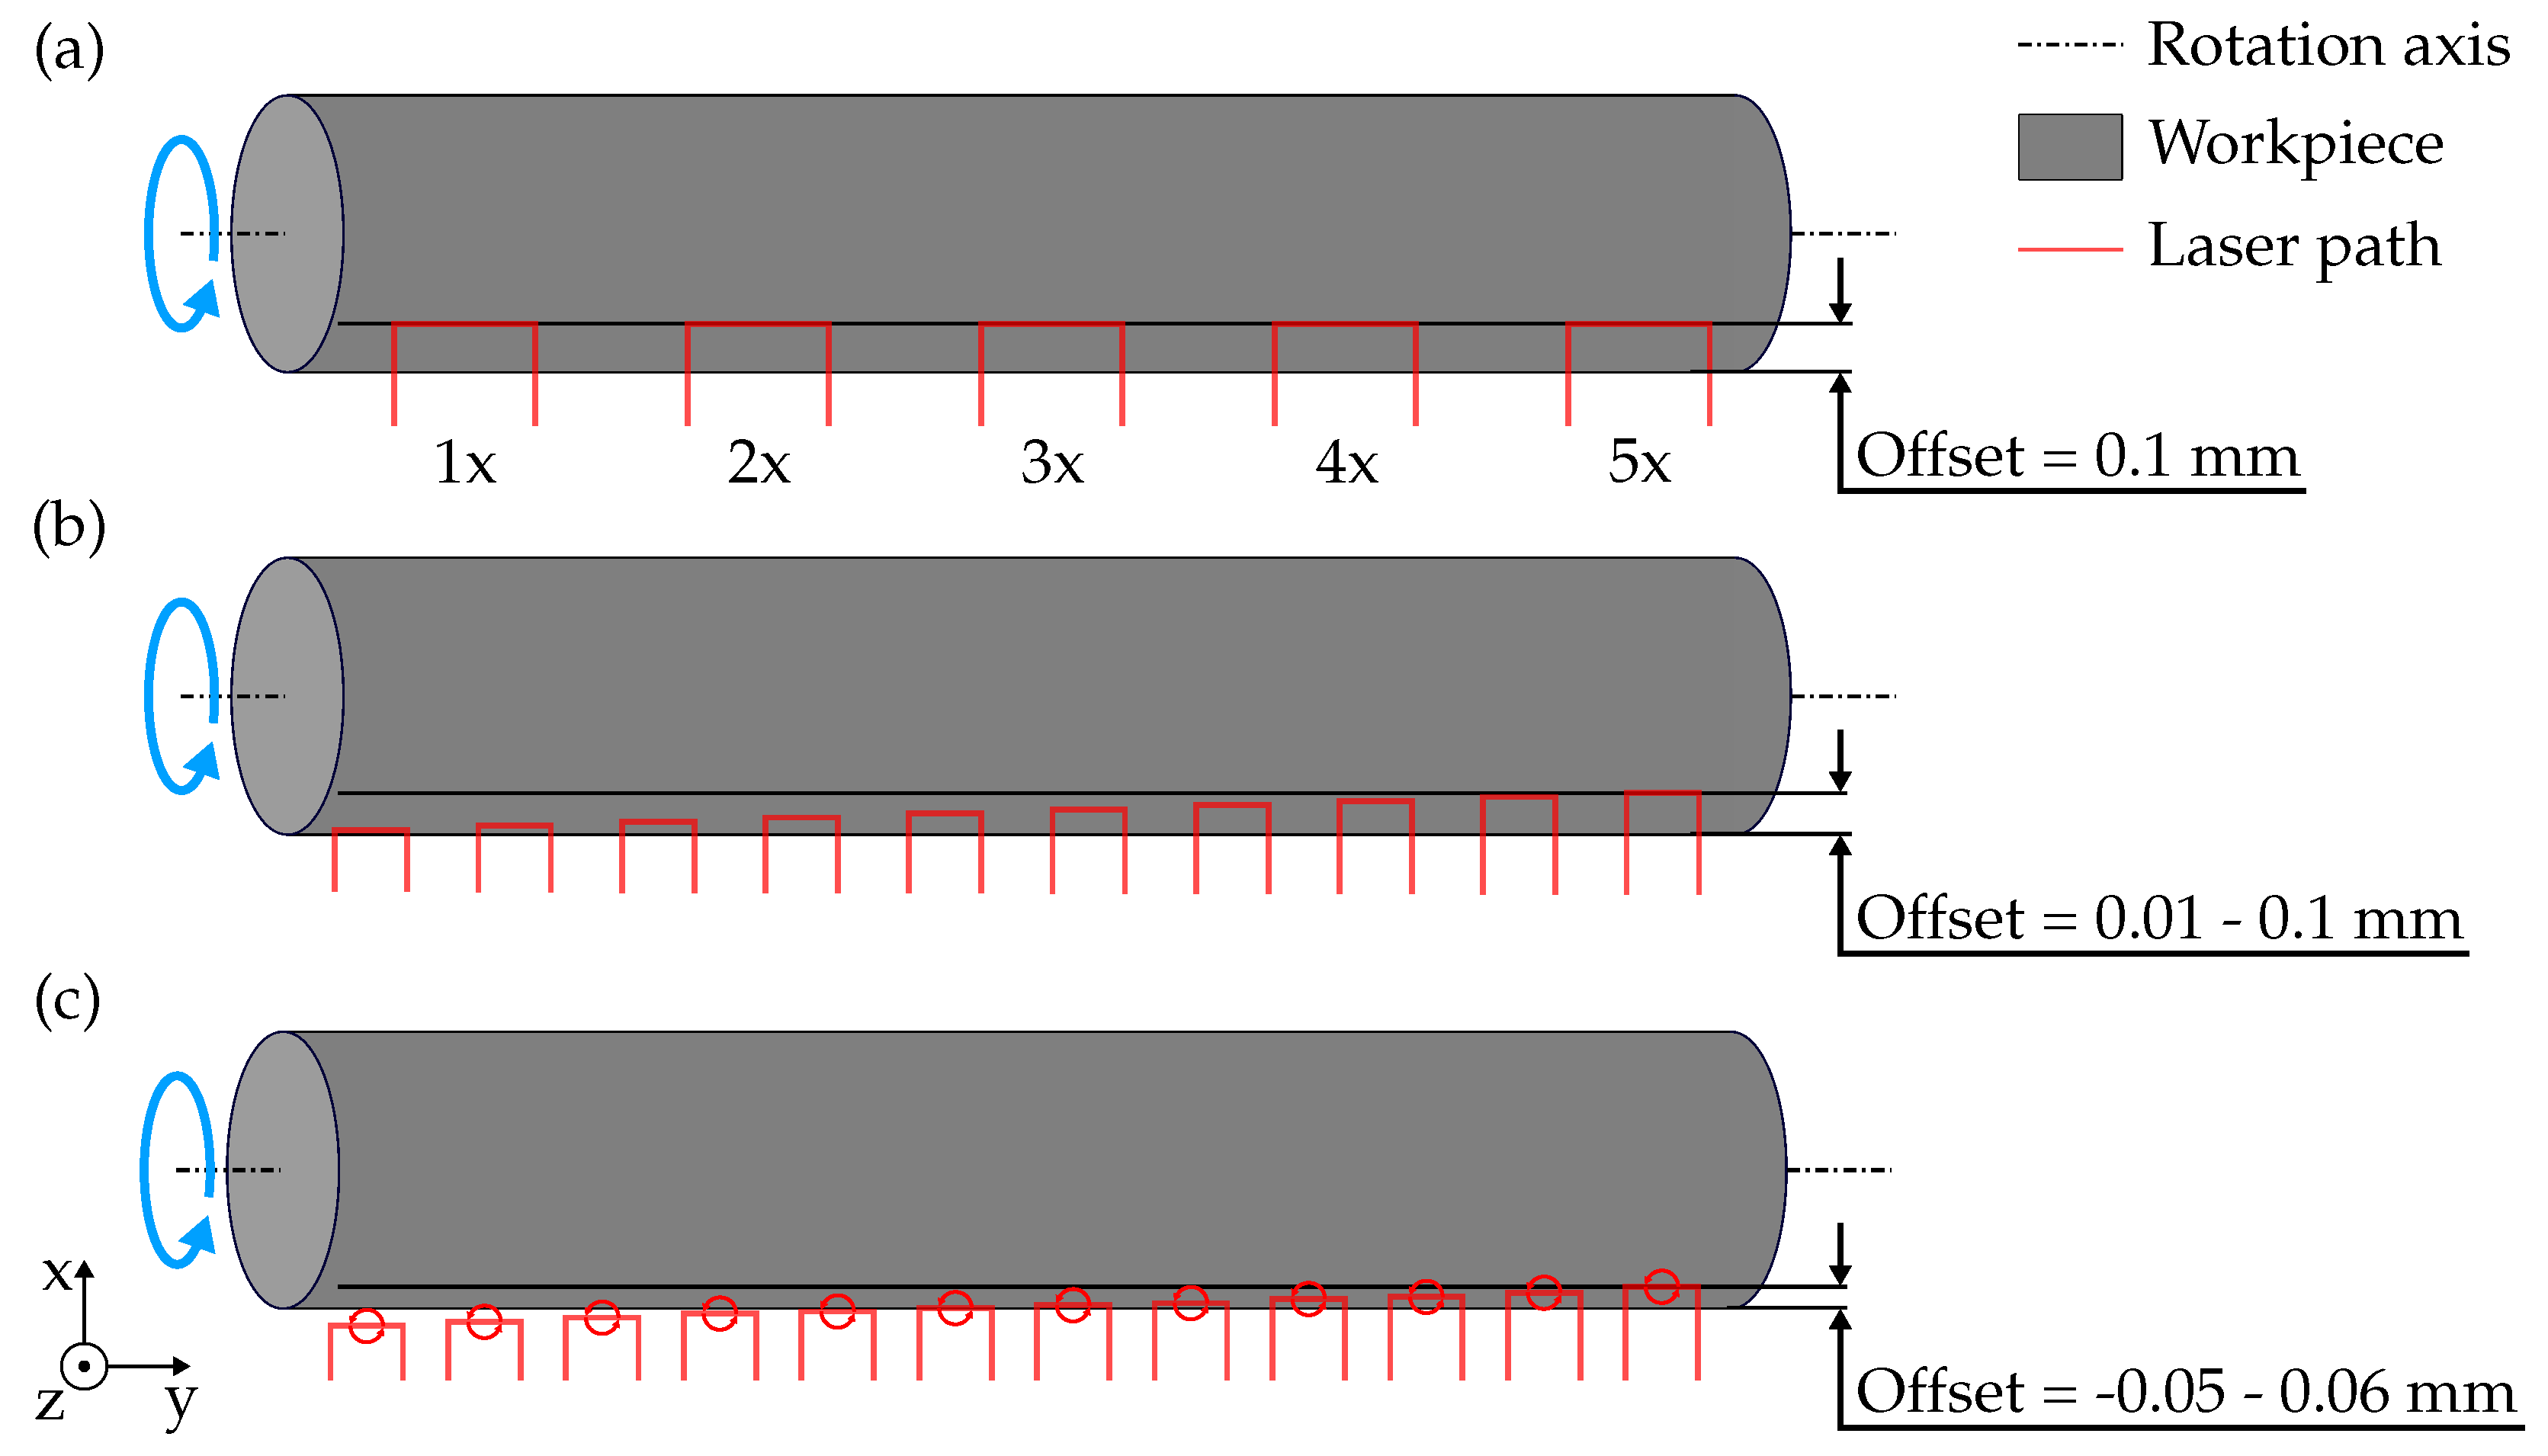
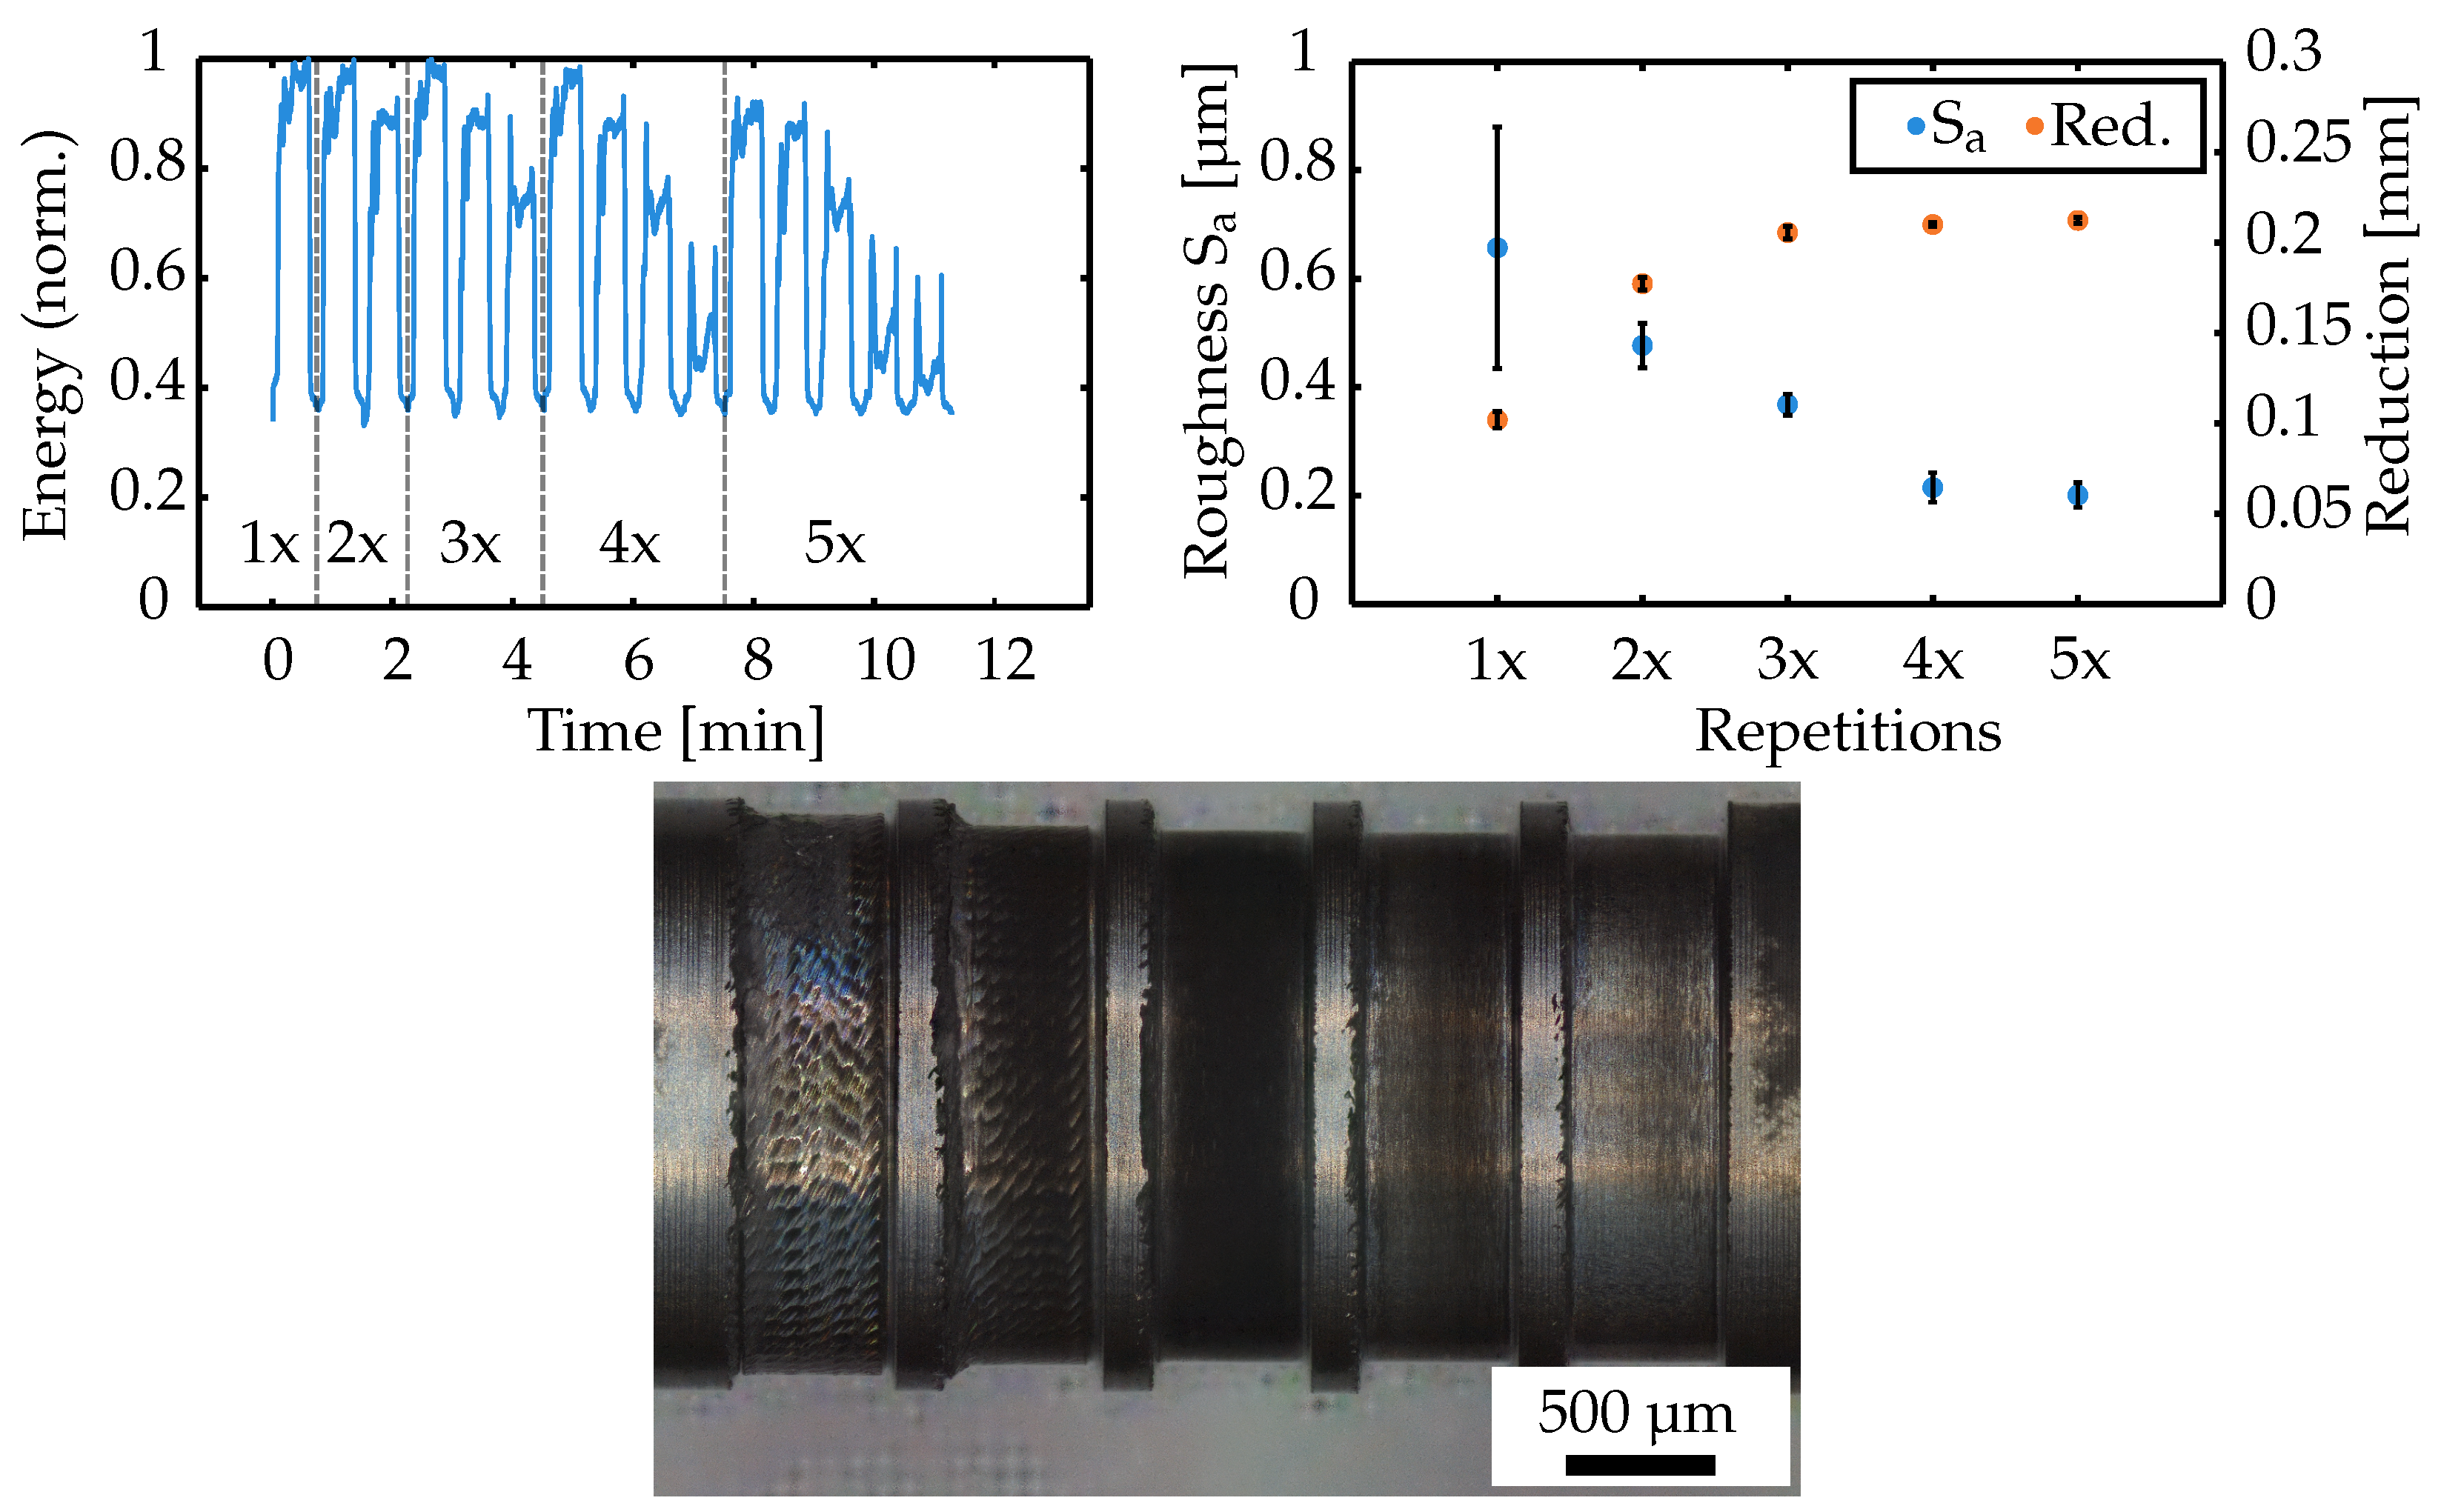
The first set of experiments consists of a series of ablations with an increasing number of repetitions, as shown in Figure 2a. The rotation speed of the workpiece was set to 500 min−1 and the linear movement speed of the focused laser beam was 0.01 mm/s. For the performed ablation processes, a repetition rate of 20 kHz and a pulse energy of 100 µJ were used. The focused laser was moved 0.1 mm perpendicular to the material’s rotation axis into the material. The length of the laser path parallel to the rotation axis was 0.5 mm, and the focal plane of the laser was held constantly on the level of the rotation axis. The subject of the evaluation was the acoustic signals caused by the laser ablation at different states of the process, accordingly, at different workpiece diameters.
In the second set of experiments, the laser movement into the material is gradually increased from 0.01 mm to 0.1 mm, as shown in Figure 2b. All other parameters remain as in the first set of experiments. In this experiment, the subject of evaluation is the correlation between acoustic signals and the ablation rate.
The third set of experiments also consists of a series of laser paths with increasing offset value as shown in Figure 2c. In this case, however, the trepanning optic with a fixed trepanning diameter of 100 µm is applied. This diameter, in combination with the other parameters, realizes a pulse-to-pulse overlap of roughly 65% on a plane surface, which has proven to be a reasonable value for material processing. The range of the offset values gradually increases from −0.05 mm to 0.06 mm. This means that for an offset value of −0.05 mm, the focused laser beam barely reaches the material, whereas an offset value of 0.05 mm or higher implies that all laser pulses strike the workpiece. For an offset value of 0 mm, half of the laser pulses are on the material. All other parameters remain as in the first set of experiments. The subject of evaluation in this case is the ability to determine the current offset position by analyzing the acoustic signal during the process.
In all conducted experiments, the distance between the optical microphone and the processed material was approximately 10 cm. This distance ensured a reliable acoustic level for detecting the acoustic waves emitted by the ablation process. Moving the optical microphone closer could potentially pollute the sensor with ablated material. A greater distance and/or greater tilt of the sensor might result in lower acoustic levels, potentially leading to signal loss. Further details on the positioning of the optical microphone are given in [44].
For measuring the diameter of the workpiece as well as the surface roughness Sa, a confocal laser scanning microscope (VK-X3000, Keyence, Osaka, Japan) was used. In order to calculate the ablation rate, the resulting cross-sectional area of the cylindrical material was subtracted from the initial cross-sectional area and multiplied by the linear movement speed of the focused laser beam.

3. Results

3.1. Increasing Number of Repetitions at Constant Offset Value

The results of the first set of experiments are summarized in Figure 3. The top-left diagram shows the normalized acoustic energy detected during the laser process. The diagram is separated into five segments, indicated by vertical grey dashed lines. Each segment, from left to right, shows an increasing number of laser-machining runs on the same workpiece area. The top-right diagram shows the resulting surface roughness and the achieved diameter reduction of the workpiece as a function of the number of applied repetitions. The bottom picture depicts a microscope image of the processing result.
The detected normalized acoustic energy shows a lower base level, reached between each repetition of the laser path through the material, at around 0.4. This level can be referred to as ambient noise inside the laser micromachining station, mainly caused by the fume exhaust and the applied processing gas. Higher levels of acoustic energy indicate material ablation during ultrashort laser pulse machining. Each additional increment of repetitions decreases the maximum level of the detected acoustic energy. This behavior can be associated with a decrease in material removal, which can be derived from the diameter reduction graph. One repetition reduces the workpiece diameter by approximately 0.1 mm. Two consecutive repetitions decrease the diameter by approximately 0.18 mm, meaning the second repetition reduces the diameter by merely 0.08 mm. This is caused again by a change in the geometric conditions. After the first repetition, the diameter is reduced, changing the offset value and altering the laser-irradiated area on the cylindrical surface as well as the angle of laser impingement. This pattern continues until additional repetitions cannot remove any more material due to low fluence at the material surface and very high impingement angles. In this study, with an initial offset value of 0.1 mm, a maximum diameter reduction of approximately 0.2 mm is feasible. This state is reached after five consecutive repetitions. The fifth repetition hardly reduces the diameter any further. The graph of acoustic energy in the fifth section, which displays five consecutive repetitions of the laser path, behaves accordingly. Starting at minute eleven of the run time, the last of the five consecutive repetitions of this segment reveals an average acoustic energy level of 0.45, close to the ambient noise. This indicates that the ablation process has come to a halt for this process.
A closer look at this last repetition in the acoustic energy graph also shows two distinct peaks at the start and end of the laser movement on the material. These peaks can be observed in three or more repetitions in this study and are linked to the perpendicular laser path and the resulting geometry of the workpiece. The microscope image shows that, across three or more repetitions, the 90° angles in the material are free of any residual material. This favors an interference pattern of the spherically spreading sound waves, which the optical microphone detects as peak intensities. Additionally, the continuous decrease in acoustic energy for increasing repetitions in this study can be linked to the resulting surface roughness Sa. Multiple repetitions result in smoother surfaces, which is in accordance with the findings in [10]. The lower acoustic energy indicates less material ablation, which directly correlates with lower surface roughness.

3.2. Increasing Offset Value

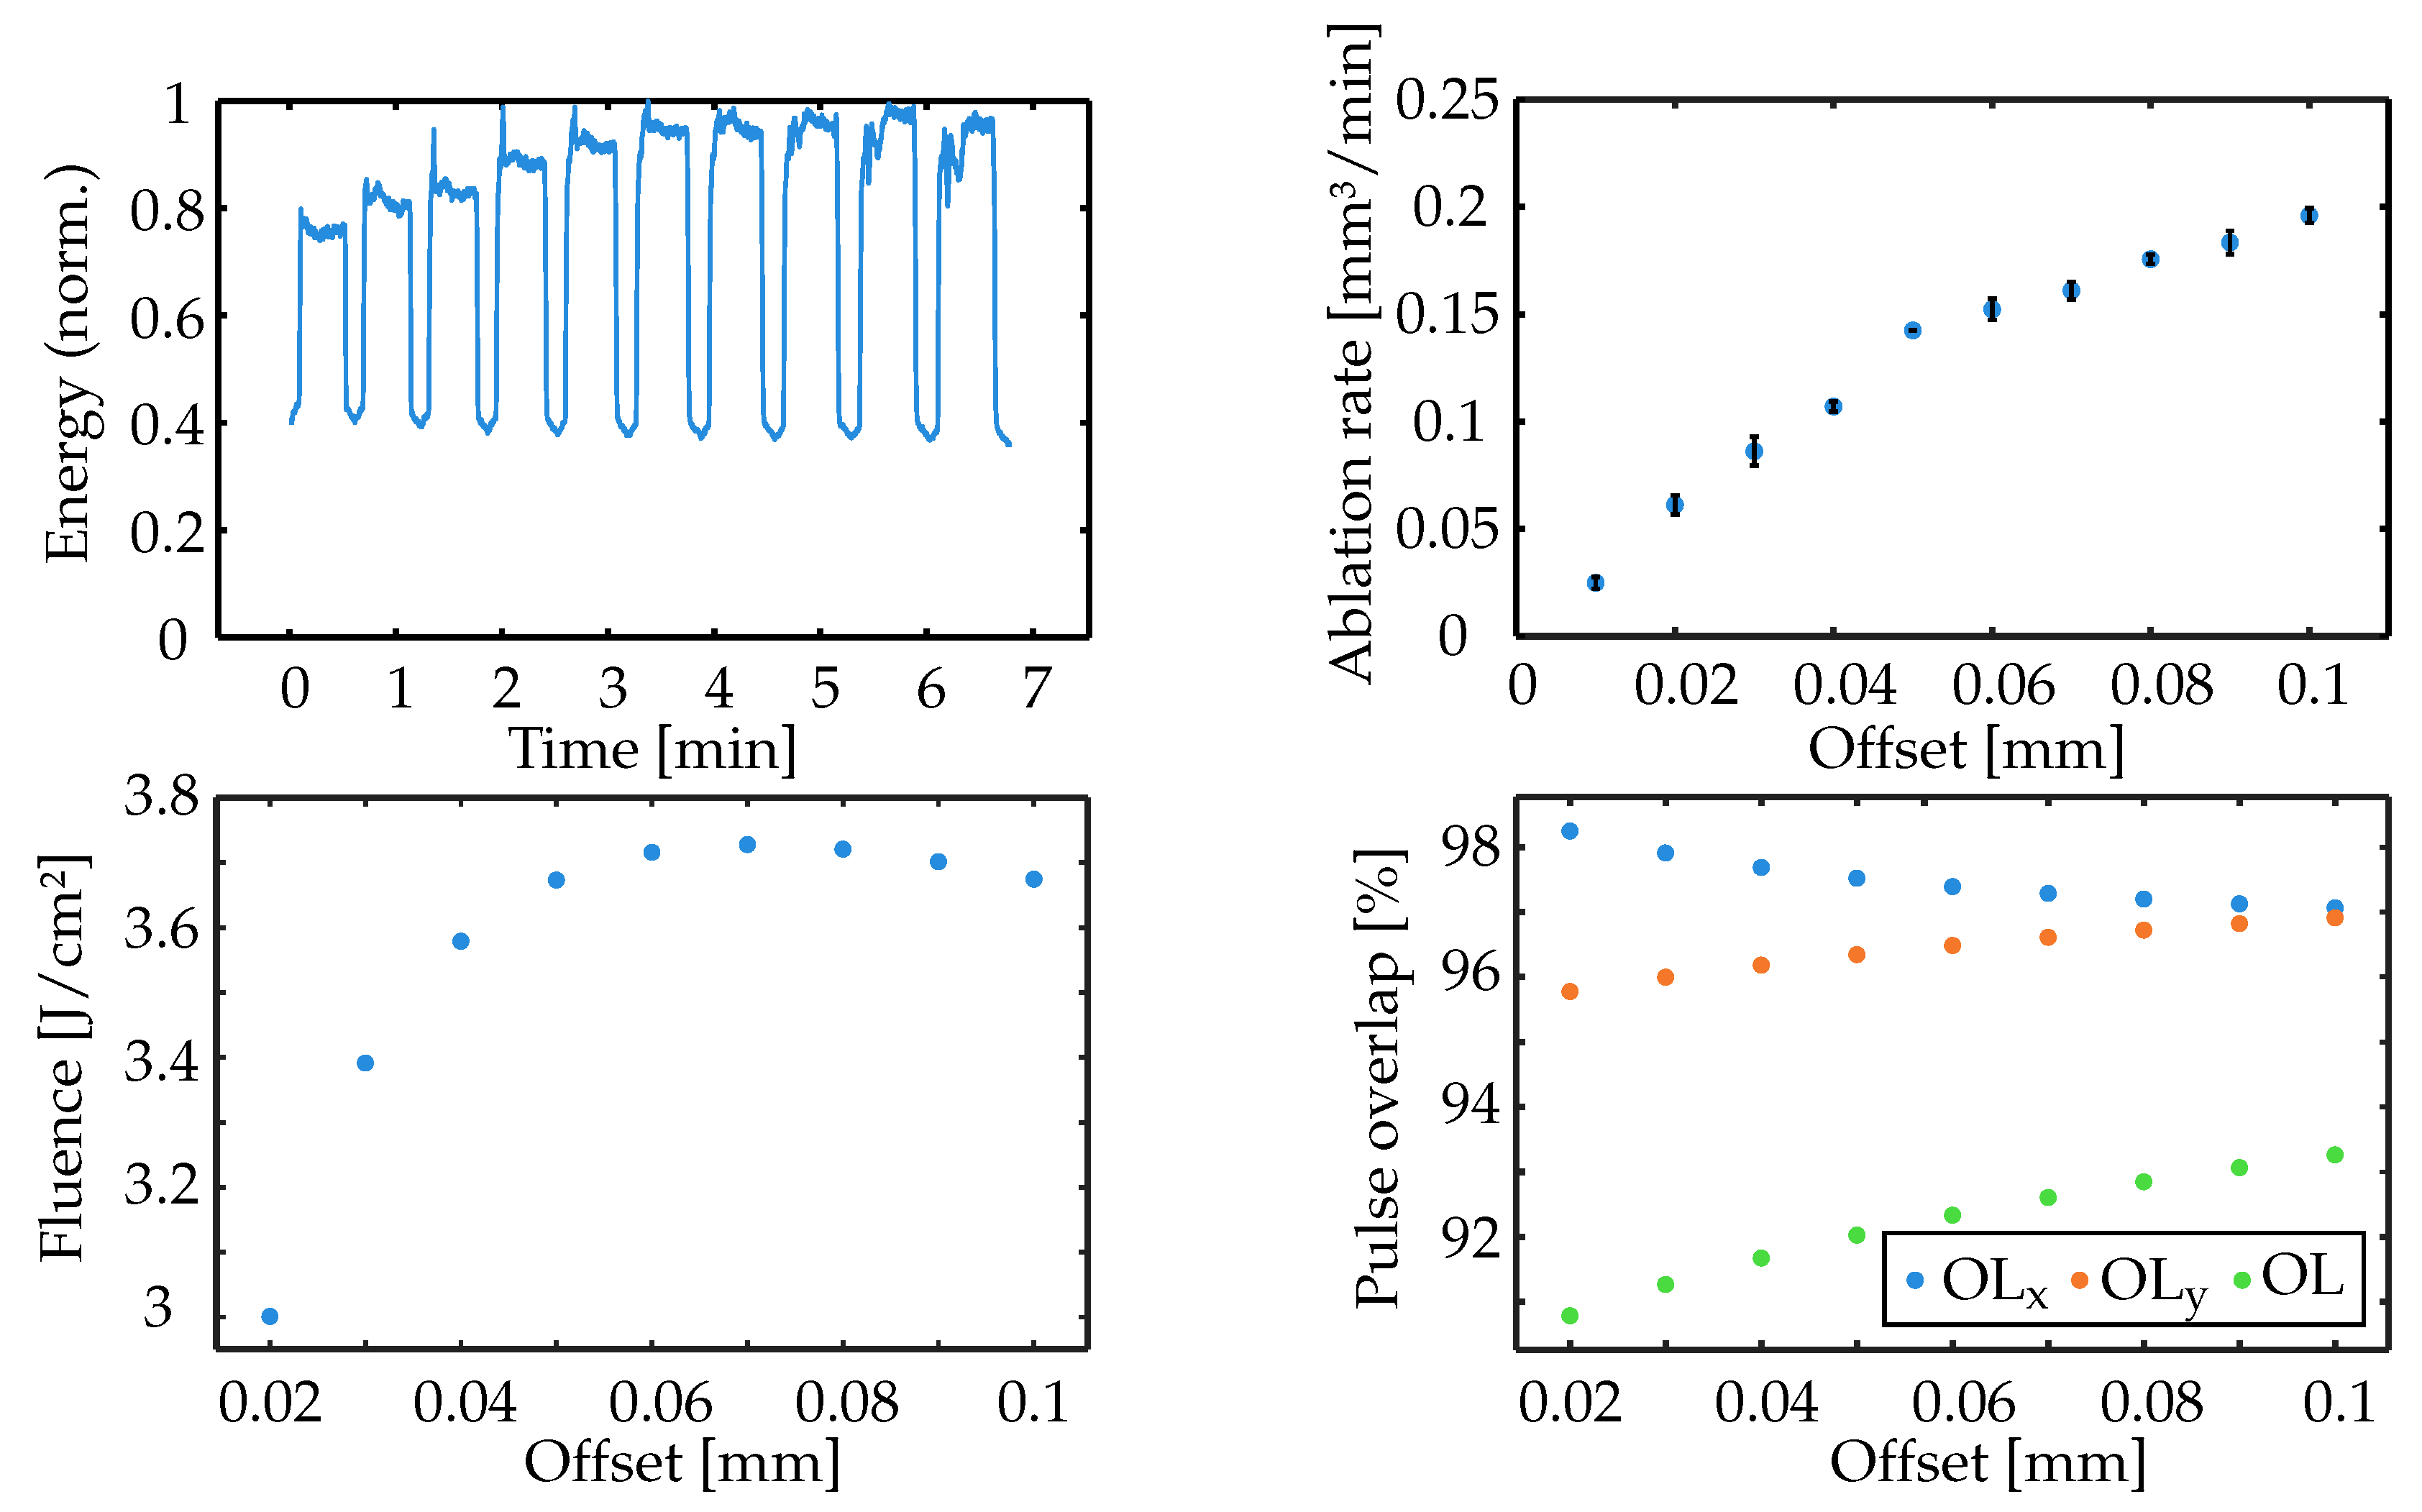
The results of the second set of experiments are summarized in Figure 4. The top left diagram depicts the detected normalized acoustic energy throughout the process. Here, the lower level around 0.4 can again be considered the ambient noise within the laser micromachining station. The upper values indicate laser ablation of the material.
Each individual plateau can be associated with the corresponding offset value, increasing from left to right. The top right diagram shows the measured ablation rate for each individual offset. For an increase in offset from 0.02 mm to 0.1 mm, the ablation rate also increases from 0.02 mm3/min to 0.20 mm3/min. Although the graph shows a constant increase in ablation rate, the energy graph shows, for the last two ablation processes, a decline in the average detected energy. This behavior can be explained by analyzing the actual fluence at the material surface, as shown in the bottom-left diagram. With increasing offset value, the fluence increases at first, peaking at an offset value of 0.07 mm, then starts decreasing. This suggests that the detected acoustic energy is linked to the fluence on the material surface rather than the ablation rate. This assumption is in accordance with the findings of [47]. It is stated that the investigations show a distinct relationship between the acoustic emission and the energy density of the focused ultrashort laser pulse, i.e., fluence. Even though the fluence declines after an offset value of 0.07 mm, the ablation rate keeps rising. This can be explained by examining the pulse overlap values for increasing offset, shown in the bottom-right diagram. There are three different sets of data depicted: the overlap in x-direction (OLx), which represents the overlap value caused by the workpiece rotation, the overlap in y-direction (OLy), which represents the overlap caused by the linear feed rate of the laser movement, and the actual pulse-to-pulse overlap (OL) that takes all relative movements and defocusing effects into account. Within the observed offset region, the overlap in the x-direction declines from initially 98.2% at 0.02 mm to 97.1% at 0.1 mm because of the shift in the laser-irradiated area on a curved surface. Furthermore, the laser-irradiated area on the material surface increases due to defocusing effects. Additionally, higher offset values result in steeper laser impingement angles on the curved surface, reducing the reflectance of the laser intensity. All these factors favor an increase in the ablation rate despite the reduction in fluence. Further details are outlined in [10,11]. The overlap in the y-direction, in contrast, increases with rising offset value, from 95.8% to 96.9%, also due to a shift in the irradiated area. The actual pulse-to-pulse overlap value shows the greatest change according to the amount within the observed offset range, from 90.8% at 0.02 mm to 93.3% at 0.1 mm. This is the reason for the constant increase in the ablation rate, even at higher offset values greater than 0.07 mm, despite the decline in fluence.

3.3. Trepanning

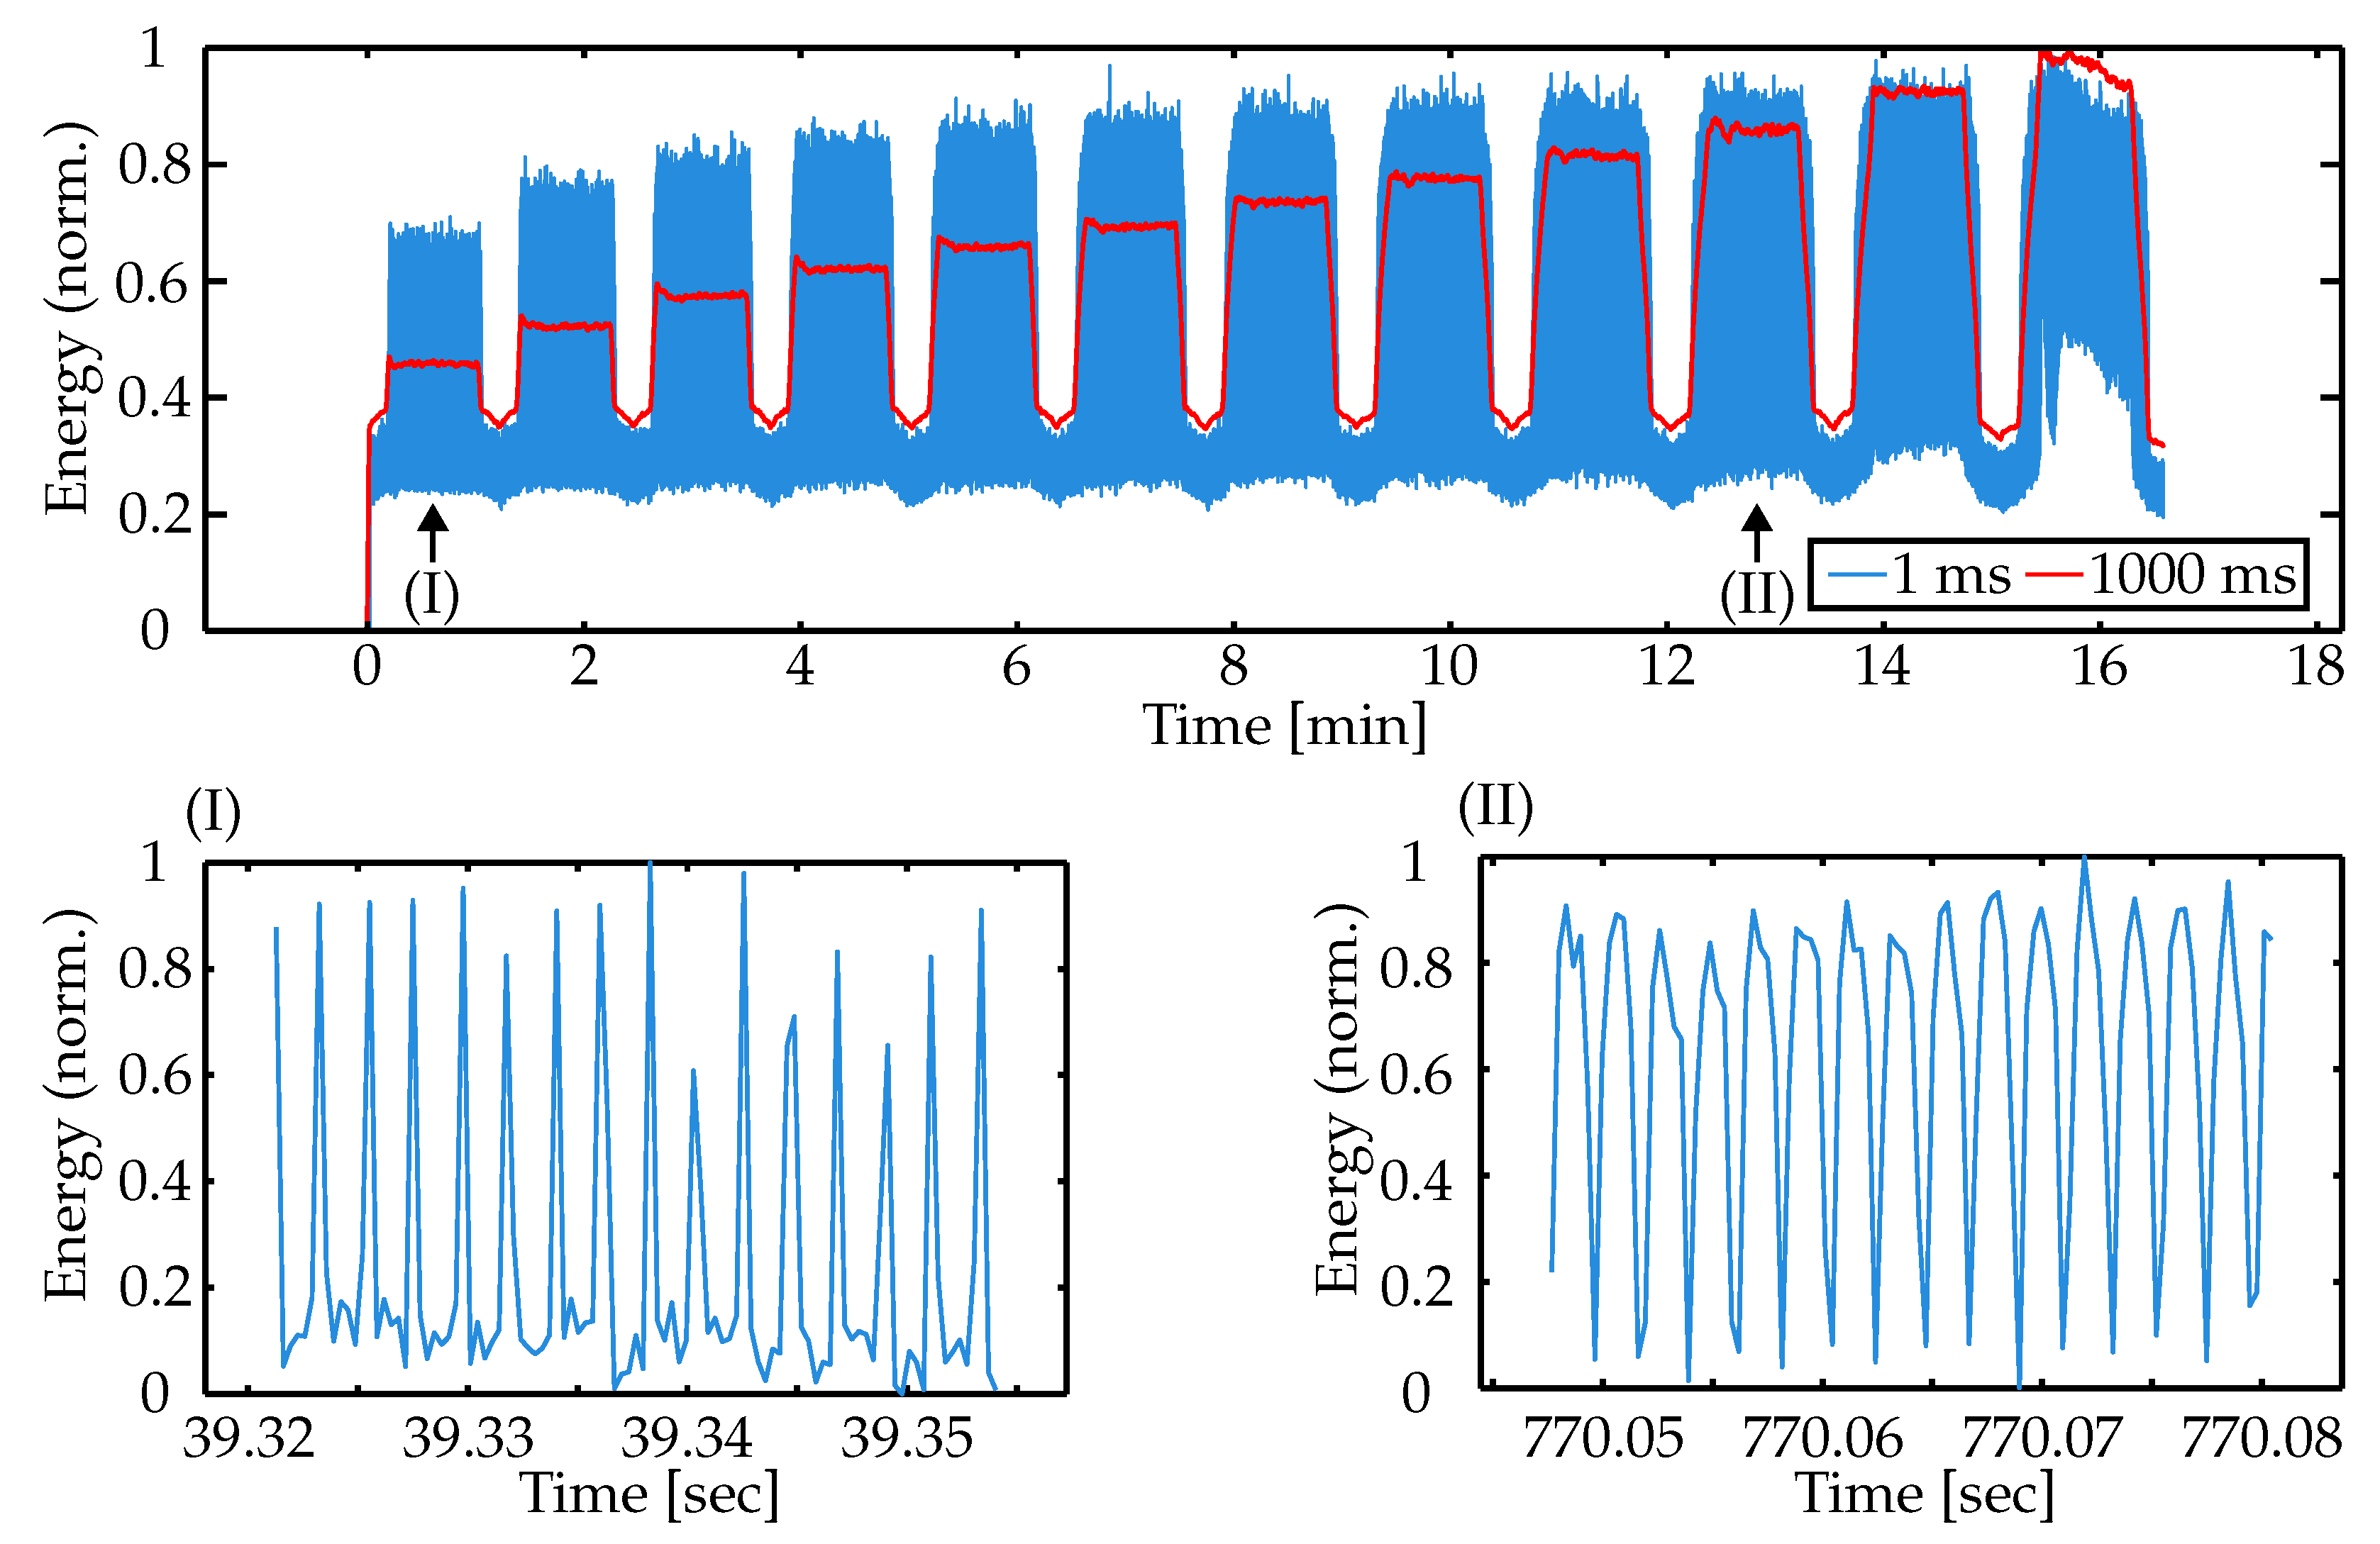
The results of the third set of experiments are summarized in Figure 5. The top diagram shows the normalized acoustic energy throughout the entire process duration. Two data sets are presented: a sampling rate of 3.05 MHz (blue), providing three spectral measurements per millisecond, and an average over 1000 ms (red). Again, the lower level around 0.4 and below can be considered ambient noise within the laser micromachining station. Higher values correspond to material ablation by femtosecond laser pulses.
Each individual plateau of detected acoustic energy from left to right matches the distinct offset value of the trepanning process depicted in Figure 2c). An increase in offset from −0.05 mm (far left) to 0.06 mm (far right) results in an increase in detected acoustic energy. This can be ascribed to two factors. First, the increasing offset value results in an increase in fluence at the material surface, as observed in the second set of experiments. Second, the increasing offset also results in more pulses striking the material within one trepanning rotation, leading to longer periods of high measurement values and gradually increasing the detected acoustic energy. The two bottom graphs also depict the acoustic energy, but within a much smaller time frame of 35 ms. Please note that the depicted acoustic energy in both diagrams is normalized to its range for this time frame. The graph on the left shows an extraction from the first offset value of −0.05 mm, marked (I) in the top diagram. The graph on the right shows an extraction from the tenth offset value of 0.04 mm, marked as (II) in the top diagram. Thus, the left diagram shows the detected acoustic signal from a process where the trepanning motion of the laser barely reaches the material, resulting in single measurement peaks and multiple measurement pits. The right diagram, however, shows a process where the trepanning motion of the laser is located mostly on the material, resulting in multiple measurement peaks and single measurement pits.

4. Discussion

In this contribution, the use of an optical microphone with high sensitivity, bandwidth, and sample rate in the laser turning process with ultrashort laser pulses has been presented. The intention of the experiments was to evaluate the usability of this device as a tool for process monitoring and potentially real-time automated regulation.
While the acoustic emissions, in general, can be attributed to the ultrashort pulsed laser ablation process and associated mechanisms, such as phase explosion and recoil effects during material removal, as well as plasma expansion [45], the particular objective of this contribution is to demonstrate and evaluate the application of the fiber-based optical microphone to monitor laser turning by detecting acoustic emissions in the frequency range of ultrasound.
The first set of experiments clearly demonstrated the ability to detect the state of material removal using the acoustic energy emitted by the femtosecond laser ablation. This property qualifies for an automated regulation of the process by implementing the signals that are detected by the optical microphone into the machining process and the process control. Regarding the energy graph in Figure 3 at 5 repetitions, a threshold in the difference between two consecutive repetitions may serve to determine the final processing step. Furthermore, the level of detected acoustic energy in this particular procedure appears to correlate with the resulting surface roughness Sa, which can also be utilized as a quality indication.
The second set of experiments with increasing offset values revealed that the detected acoustic energy coincides with the laser fluence on the material surface rather than the actual ablation rate. Since the fluence rapidly decreases at very small offset values due to laser spot distortion on a curved surface [11], these findings confirm the results of the first set of experiments. A drop in acoustic energy caused by geometric conditions of the workpiece may well indicate the process limit. In order to serve as an indicator for automated regulation of the process, the detected acoustic signal would need to be synchronized with the current offset value in the process. An established database for comparison would be a promising approach in this case.
The third set of experiments showed that, for a process with trepanning optics, the time the laser strikes the material can be clearly distinguished from the time it misses the material. This performance enables the detection of the current offset value of the process. The chosen trepanning diameter, in combination with the trepanning speed and the timing of striking and not striking the material, allows the exact position of the trepanning center to be calculated, hence the current offset value, provided the offset does not exceed the trepanning radius. Beyond the mere level of acoustic energy, this can serve as an additional measurement to determine the state of the process and, consequently, the current diameter of the workpiece.
Despite the noisy environment inside the laser micromachining system, caused by processing gas and exhaust, the acoustic emissions of the individual laser pulses could be detected reliably by the optical microphone. Due to the continuous reduction in the workpiece diameter during the laser turning process, the processing conditions, particularly the surface fluence, change constantly. Nevertheless, the optical microphone recorded the acoustic emissions from each individual laser-pulse ablation without interruption. These characteristics qualify the system for real-time process monitoring and thus enable the possibility of automated process control.

5. Conclusions

In this contribution, the usability of an optical microphone as a process monitoring device in laser turning with ultrashort laser pulses was demonstrated. Multiple experiments, with an emphasis on different processing strategies, revealed that not only the material ablation itself but also the current state of the process can be determined. This very well qualifies the optical microphone not only as a process-monitoring device but also as a means to establish real-time automated process regulation.

Author Contributions

Conceptualization, J.Z., C.L., and R.H.; methodology, J.Z.; software, J.Z. and C.L.; validation, J.Z. and C.L.; formal analysis, J.Z. and C.L.; investigation, J.Z. and C.L.; resources, R.H.; data curation, J.Z.; writing—original draft preparation, J.Z.; writing—review and editing, J.Z., C.L., and R.H.; visualization, J.Z.; supervision, R.H.; project administration, R.H.; funding acquisition, R.H. All authors have read and agreed to the published version of the manuscript.

Funding

This research was funded by the German Federal Ministry of Research, Technology, and Space (BMFTR, project MOSES), grant number FKZ 13N16330.

Institutional Review Board Statement

Not applicable.

Informed Consent Statement

Not applicable.

Data Availability Statement

Data underlying the results presented in this paper are not publicly available at this time but may be obtained from the authors upon reasonable request.

Conflicts of Interest

The authors declare no conflict of interest.

Abbreviations

The following abbreviations are used in this manuscript:
USPUltrashort laser pulse
OCTOptical coherence tomography

References

  1. Bonse, J.; Krüger, J. Structuring of thin films by ultrashort laser pulses. Appl. Phys. A 2023, 129, 14. [Google Scholar] [CrossRef]
  2. He, Z.; Lei, L.; Lin, S.; Tian, S.; Tian, W.; Yu, Z.; Li, F. Metal Material Processing Using Femtosecond Lasers: Theories, Principles, and Applications. Materials 2024, 17, 3386. [Google Scholar] [CrossRef]
  3. Shin, H.; Kim, D. Cutting thin glass by femtosecond laser ablation. Opt. Laser Technol. 2018, 102, 1–11. [Google Scholar] [CrossRef]
  4. Zhou, J.; Chu, D.; Yao, P.; Jin, X.; Zhao, L.; Li, Y.; Liang, S.; Xu, J.; Qu, S.; Huang, C. Tangential dressing of diamond grinding wheel by femto-second pulsed laser with Bessel beam. Int. J. Abras. Technol. 2023, 11, 212–232. [Google Scholar] [CrossRef]
  5. Ackerl, N.; Warhanek, M.; Gysel, J.; Wegener, K. High-Precision Laser Conditioning of Diamond Grinding Wheels. Mater. Des. 2020, 189, 108530. [Google Scholar] [CrossRef]
  6. Häfner, C.; Hajri, M.; Büttner, H.; Konrad Wegener, J.P. FEM-Design & fabrication of a micro-milling tool by tangential laser machining. Procedia CIRP 2020, 95, 903–908. [Google Scholar] [CrossRef]
  7. Warhanek, M.; Walter, C.; Hirschi, M.; Boos, J.; Bucourt, J.F.; Wegener, K. Comparative analysis of tangentially laser-processed fluted polycrystalline diamond drilling tools. J. Manuf. Process. 2016, 23, 157–164. [Google Scholar] [CrossRef]
  8. Zettl, J.; Klar, M.; Esen, C.; Hellmann, R. Generation of Rotationally Symmetric Micro Tools using Ultrashort Laser Pulses. J. Laser Micro/Nanoeng. 2020, 15, 118–122. [Google Scholar] [CrossRef]
  9. Ackerl, N.; Warhanek, M.; Gysel, J.; Wegener, K. Ultrashort-pulsed laser machining of dental ceramic implants. J. Eur. Ceram. Soc. 2019, 39, 1635–1641. [Google Scholar] [CrossRef]
  10. Zettl, J.; Klar, M.; Rung, S.; Esen, C.; Hellmann, R. Laser turning with ultrashort laser pulses. J. Manuf. Process. 2021, 68, 1562–1568. [Google Scholar] [CrossRef]
  11. Zettl, J.; Esen, C.; Hellmann, R. Fundamental Considerations and Analysis of the Energy Distribution in Laser Turning with Ultrashort Laser Pulses. Micromachines 2023, 14, 1838. [Google Scholar] [CrossRef]
  12. Hosoya, N.; Kajiwara, I.; Inoue, T.; Umenai, K. Non-contact acoustic tests based on nanosecond laser ablation: Generation of a pulse sound source with a small amplitude. J. Sound Vib. 2014, 333, 4254–4264. [Google Scholar] [CrossRef]
  13. Wang, X.; Xu, X. Thermoelastic wave induced by pulsed laser heating. Appl. Phys. A 2001, 73, 107–114. [Google Scholar] [CrossRef]
  14. Raddadi, M.; Mohamed, M.S.; Mahdy, A.M.S.; El-Bary, A.A.; Lotfy, K. Pulsed laser heating-induced generalized thermo-acoustic-elastic waves with two-temperature theory. Arch. Appl. Mech. 2025, 95, 3. [Google Scholar] [CrossRef]
  15. Zhang, H.; Antoncecchi, A.; Edward, S.; Planken, P.; Witte, S. Ultrafast laser-induced guided elastic waves in a freestanding aluminum membrane. Phys. Rev. B 2021, 103, 064303. [Google Scholar] [CrossRef]
  16. Bautze, T.; Kogel-Hollacher, M. Keyhole Depth is just a Distance. Laser Tech. J. 2014, 11, 39–43. [Google Scholar] [CrossRef]
  17. Beck, T.; Bantel, C.; Boley, M.; Bergmann, J.P. OCT Capillary Depth Measurement in Copper Micro Welding Using Green Lasers. Appl. Sci. 2021, 11, 2655. [Google Scholar] [CrossRef]
  18. Dupriez, N.D.; Truckenbrodt, C. OCT for Efficient High Quality Laser Welding. Laser Tech. J. 2016, 13, 37–41. [Google Scholar] [CrossRef]
  19. Kunze, R.; Mallmann, G.; Schmitt, R. Inline Plasma Analysis as Tool for Process Monitoring in Laser Micro Machining for Multi-layer Materials. Phys. Procedia 2016, 83, 1329–1338. [Google Scholar] [CrossRef]
  20. You, D.Y.; Gao, X.D.; Katayama, S. Review of laser welding monitoring. Sci. Technol. Weld. Join. 2014, 19, 181–201. [Google Scholar] [CrossRef]
  21. Wagner, M.; Pietsch, D.; Schwarzenberger, M.; Jahn, A.; Dittrich, D.; Stamm, U.; Ihlenfeldt, S.; Leyens, C. Digitalized laser beam welding for inline quality assurance through the use of multiple sensors and machine learning. Procedia CIRP 2022, 111, 518–521. [Google Scholar] [CrossRef]
  22. Oliveira Lopes, M.; Petring, D.; Arntz-Schröder, D.; Schneider, F.; Stoyanov, S.; Gillner, A. Enhanced Material, Parts Optimization and Process Intensification—Cutting Whistle—An Original Approach for Nozzle Design in Fiber Laser Cutting of Stainless Steel; Springer: Cham, Switzerland, 2021; Volume 96. [Google Scholar] [CrossRef]
  23. Hauser, T.; Reisch, R.T.; Kamps, T.; Kaplan, A.F.H.; Volpp, J. Acoustic emissions in directed energy deposition processes. Int. J. Adv. Manuf. Technol. 2022, 119, 3517–3532. [Google Scholar] [CrossRef]
  24. Wang, F.; Mao, H.; Zhang, D.; Zhao, X.; Shen, Y. Online study of cracks during laser cladding process based on acoustic emission technique and finite element analysis. Appl. Surf. Sci. 2008, 255, 3267–3275. [Google Scholar] [CrossRef]
  25. Fischer, B.; Rohringer, W.; Panzer, N.; Hecker, S. Acoustic Process Control for Laser Material Processing. Laser Tech. J. 2017, 14, 21–25. [Google Scholar] [CrossRef]
  26. Everton, S.K.; Hirsch, M.; Stravroulakis, P.; Leach, R.K.; Clare, A.T. Review of in-situ process monitoring and in-situ metrology for metal additive manufacturing. Mater. Des. 2016, 95, 431–445. [Google Scholar] [CrossRef]
  27. Charunetratsamee, S.; Poopat, B.; Jirarungsatean, C. Feasibility Study of Acoustic Emission Monitoring of Hot Cracking in GTAW Weld. Key Eng. Mater. 2013, 545, 236–240. [Google Scholar] [CrossRef]
  28. Yildirim, K.; Nagarajan, B.; Tjahjowidodo, T.; Castagne, S. Review of in-situ process monitoring for ultra-short pulse laser micromanufacturing. J. Manuf. Process. 2025, 133, 1126–1159. [Google Scholar] [CrossRef]
  29. Schichler, U.; Troppauer, W.; Fischer, B.; Heine, T.; Reich, K.; Leonhardsberger, M.; Oberzaucher, O. Development of an innovative measurement system for audible noise monitoring of OHL. Elektrotechnik Und Informationstechnik 2018, 135, 556–562. [Google Scholar] [CrossRef]
  30. Bricher, D.; Müller, A. Using Multimodal Contextual Process Information for the Supervised Detection of Connector Lock Events. Artif. Intell. Appl. Innov. 2020, 584, 123–134. [Google Scholar] [CrossRef]
  31. Rohringer, W.; Sommerhuber, R.; Csaszar, L.; Panzer, N.; Wald, S.; Fischer, B.; Garrecht, H.; Grüner, F.; Frick, J. Material characterization via contact-free detection of surface waves using an optical microphone. In Fifth International Conference on Sustainable Construction Materials and Technologies; Coventry University: Coventry, UK, 2019; pp. 361–373. [Google Scholar] [CrossRef]
  32. Brauns, M.; Lucking, F.; Fischer, B.; Thomson, C.; Ivakhnenko, I. Laser-Excited Acoustics for Contact-Free Inspection of Aerospace Composites. Mater. Eval. 2021, 79, 28–37. [Google Scholar] [CrossRef]
  33. Rus, J.; Grosse, C.U. Local Ultrasonic Resonance Spectroscopy: A Demonstration on Plate Inspection. J. Nondestruct. Eval. 2020, 39, 31. [Google Scholar] [CrossRef]
  34. Tomcic, L.; Ederer, A.; Grabmann, S.; Kick, M.; Kriegler, J.; Zaeh, M.F. Interpreting acoustic emissions to determine the weld depth during laser beam welding. J. Laser Appl. 2022, 34, 042052. [Google Scholar] [CrossRef]
  35. Authier, N.; Touzet, E.; Lücking, F.; Sommerhuber, R.; Bruyere, V.; Namy, P. Coupled membrane free optical microphone and optical coherence tomography keyhole measurements to setup welding laser parameters. Proc. SPIE 2020, 11273, 1127308. [Google Scholar] [CrossRef]
  36. Koester, L.W.; Taheri, H.; Bigelow, T.A.; Bond, L.J.; Faierson, E.J. In-situ acoustic signature monitoring in additive manufacturing processes. AIP Conf. Proc. 2018, 37, 020006. [Google Scholar] [CrossRef]
  37. Gutknecht, K.; Cloots, M.; Sommerhuber, R.; Wegener, K. Mutual comparison of acoustic, pyrometric and thermographic laser powder bed fusion monitoring. Mater. Des. 2021, 210, 110036. [Google Scholar] [CrossRef]
  38. Prieto, C.; Fernandez, R.; Gonzalez, C.; Diez, M.; Arias, J.; Sommerhuber, R.; Lücking, F. In situ process monitoring by optical microphone for crack detection in Laser Metal Deposition applications. In 11th CIRP Conference on Photonic Technologies [LANE 2020]; Elsevier: Amsterdam, The Netherlands, 2020; Volume 1392, Available online: https://www.lane-conference.org/alt/industrial-contributions-2020/ (accessed on 29 April 2026).
  39. Subasi, L.; Gokler, M.I.; Yaman, U. A comprehensive study on water jet guided laser micro hole drilling of an aerospace alloy. Opt. Laser Technol. 2023, 164, 109514. [Google Scholar] [CrossRef]
  40. La García de Yedra, A.; Pfleger, M.; Aramendi, B.; Cabeza, M.; Zubiri, F.; Mitter, T.; Reitinger, B.; Scherleitner, E. Online cracking detection by means of optical techniques in laser-cladding process. Struct. Control Health Monit. 2019, 26, e2291. [Google Scholar] [CrossRef]
  41. Wei, C.; Li, L. Acoustic Emission and Ultrasound Monitoring in Laser Micro/Nanofabrication. In Handbook of Laser Micro- and Nano-Engineering; Sugioka, K., Ed.; Springer International Publishing: Cham, Switzerland, 2020; Volume 103, pp. 1–24. [Google Scholar] [CrossRef]
  42. Fischer, B.; Sarasini, F.; Tirillò, J.; Touchard, F.; Chocinski-Arnault, L.; Mellier, D.; Panzer, N.; Sommerhuber, R.; Russo, P.; Papa, I.; et al. Impact damage assessment in biocomposites by micro-CT and innovative air-coupled detection of laser-generated ultrasound. Compos. Struct. 2019, 210, 922–931. [Google Scholar] [CrossRef]
  43. Lutz, C.; Sommerhuber, R.; Kettner, M.; Esen, C.; Hellmann, R. Towards process control by detecting acoustic emissions during ultrashort pulsed laser ablation of multilayer materials. Proc. SPIE 2024, 12873, 51. [Google Scholar] [CrossRef]
  44. Lutz, C.; Esen, C.; Hellmann, R. Layer detection in ultrashort pulsed multilayer laser ablation by analyzing ultrasonic process emission. J. Laser Appl. 2025, 37, 022006. [Google Scholar] [CrossRef]
  45. Lewis, L.J.; Perez, D. Laser ablation with short and ultrashort laser pulses: Basic mechanisms from molecular-dynamics simulations. Appl. Surf. Sci. 2009, 255, 5101–5106. [Google Scholar] [CrossRef]
  46. Preisser, S.; Rohringer, W.; Liu, M.; Kollmann, C.; Zotter, S.; Fischer, B.; Drexler, W. All-optical highly sensitive akinetic sensor for ultrasound detection and photoacoustic imaging. Biomed. Opt. Express 2016, 7, 4171–4186. [Google Scholar] [CrossRef] [PubMed]
  47. Geiger, C.; Garkusha, P.; Bernauer, C.; Mehrl, S.; Schirmer, P.A.; Zaeh, M.F. Acoustic process monitoring during the structuring of the diffusion media for fuel cells with Ultrashort Laser Pulses. Procedia CIRP 2024, 124, 51–56. [Google Scholar] [CrossRef]
Figure 1. Illustration of the tangential laser turning process with monitoring by an optical microphone.
Photonics 13 00448 g001
Figure 2. Illustrations of the conducted experiments. (a) Increasing the number of repetitions at a constant offset value. (b) Increase in the offset value for single repetition processing. (c) Increase in the offset value while using a trepanning optic.
Photonics 13 00448 g002
Figure 3. Top left: Detected acoustic energy throughout the process over time. Dashed vertical lines indicate an increase in repetitions. Top right: Surface roughness Sa and diameter reduction of the workpiece corresponding to the number of repetitions. Bottom: Microscope image of the processing result.
Photonics 13 00448 g003
Figure 4. Top left: Normalized acoustic energy throughout the process. Top right: Ablation rate for increasing offset values. Bottom left: Calculated fluence on the material surface for increasing offset values. Bottom right: Pulse overlap values in x- and y-direction as well as direct pulse-to-pulse-overlap.
Photonics 13 00448 g004
Figure 5. Top: Normalized acoustic energy throughout the process. Blue: The size of the energy consideration window is defined as 1 ms (3 spectra). Red: The size of the energy consideration window is defined as 1000 ms (3051 spectra). Bottom left: Extraction from the top graph at point (I), with values normalized to their own ranges. Bottom right: Extraction from the top graph at point (II), with values normalized to their own ranges.
Photonics 13 00448 g005
Disclaimer/Publisher’s Note: The statements, opinions and data contained in all publications are solely those of the individual author(s) and contributor(s) and not of MDPI and/or the editor(s). MDPI and/or the editor(s) disclaim responsibility for any injury to people or property resulting from any ideas, methods, instructions or products referred to in the content.