1. Introduction
The advent of Industry 4.0 and recent technical developments have forced industries to innovate and look for more integration, real-time data communication, and extensive use of new technologies. In this sense, the railway sector stands out due to its strategic significance for economic expansion as well as the pressing need to modernize its networks for passenger transit. Increasing the capacity and safety of railway systems has become a primary priority since precise and effective train detection directly affects operational effectiveness and passenger security.
The ability to detect the presence of trains at level crossings is crucial, as it enhances traffic control, reduces accident rates, and ensures the safety of both passengers and pedestrians. Sensitivity to electromagnetic interference, vibrations, and unfavorable weather conditions are just a few of the major drawbacks of traditional detection techniques, such as track circuits and inductive loops. Additionally, older systems often have limited integration capabilities with contemporary traffic management infrastructures and incur high installation and maintenance costs.
In order to overcome these obstacles, there has been a recent emergence in the development of novel railway traffic monitoring systems. In this study, we present an SMS (Single-mode–Multimode–Single-mode) structure-based optical fiber loop detection method. The SMS configuration consists of a section of multimode fiber spliced between two single-mode fibers, where multimodal interference and self-imaging phenomena occur due to mode coupling and phase redistribution along the multimode segment. This structure sets up a system that detects and analyzes changes in optical intensity brought on by vehicles passing over the rails in real-time by making use of these multimodal interference and self-imaging effects. In addition to improving detection accuracy, the SMS-based method is inexpensive and simple to implement, offering real-time data access via a web-based interface that can be accessed on any device with an internet connection.
Our proposed innovation aims to optimize not only the operation of crossing barriers but also to provide a robust tool for railway traffic management, control, and monitoring. The implementation of such a system can significantly enhance railway safety, enable predictive maintenance, and improve operational efficiency, thereby contributing to safer and more intelligent urban mobility that aligns with Industry 4.0 standards.
Several recent studies have explored the use of optical fiber sensors (OFS) in railway applications. In [
1], the authors describe the use of OFS to detect train-induced vibrations by analyzing frequency-domain signals with a polarization beam splitter (PBS) and monitoring State of Polarization (SOP) changes in the fibers. The data, acquired using a Red Pitaya StemLab 125-14, which is an instrumentation and signal acquisition platform based on the Xilinx Zynq 7010 FPGA from the company Red Pitaya, Solkan, Slovenia, revealed vibration patterns with longer transit times for freight trains due to their slower speeds and heavier loads. Similarly, ref. [
2] presented a train detection and classification system based on distributed acoustic sensing (DAS), using roadside data collection and noise reduction techniques to extract train features. A support vector machine classifier achieved over 97% accuracy in identifying three train types.
Ref. [
3] presents an intensity-based optical fiber sensor installed beneath tram rails to detect bogies and axles through light modulation caused by rail-induced fiber bending. After laboratory optimization, the system was field-tested for 11 months in a Czech tram depot, analyzing over 20,000 passages. It achieved 100% accuracy in bogie detection, which enables reliable train identification and wagon counting, while axle detection averaged 86.1% and was influenced by temperature and operational conditions.
The application of SMS fiber sensors goes beyond the railway sector, so that from vibration measurement, they are able to indirectly measure other parameters such as, for example, seismocardiography (SCG) [
4], flow [
5] and deformation of beams and concrete [
6], which shows the wide application of these sensors and their viability and reliability for measuring vibration.
Ref. [
7] developed and tested an EMI-immune fiber-optic vibration sensor based on a Mach–Zehnder interferometer for railway monitoring, demonstrating reliable train detection and speed estimation in a subway environment. Other works have employed different optical fiber technologies, such as fiber Bragg gratings (FBG) [
8], DAS-based systems [
9], and optical interferometers [
10] for railway traffic control and monitoring, allowing the estimation of parameters such as presence, weight, and train velocity.
This paper presents the design, development, and validation of a low-cost optical sensor prototype for SMS-based Light Rail Vehicle (LRV) detection. The sensor’s performance is evaluated by laboratory testing under various mounting conditions and real-field validation during LRV passage. An embedded system is attached to the sensor in order to collect data. This paper’s remaining sections are arranged as follows: The operating mechanism of the system is described in full in
Section 2. The creation of the sensor setup, packaging, and system integration are covered in
Section 3, laboratory tests, as well as sensor validation are covered in
Section 4. The supervised field tests are covered in
Section 5. Results and discussion are shown in
Section 6. Finally,
Section 7 concludes the paper and outlines future work.
2. System Operating Methodology
Optical fiber technology presents significant advantages for sensing applications due to its intrinsic sensitivity to mechanical vibrations, strain, acoustic signals, and environmental changes. In this work, we employ the principle of multimodal interference (MMI) in a Single-mode–Multimode–Single-mode (SMS) fiber structure to detect dynamic perturbations caused by Light Rail Vehicle (LRV) movement. The sensor is specifically designed to monitor vibration induced by train passages over rail tracks.
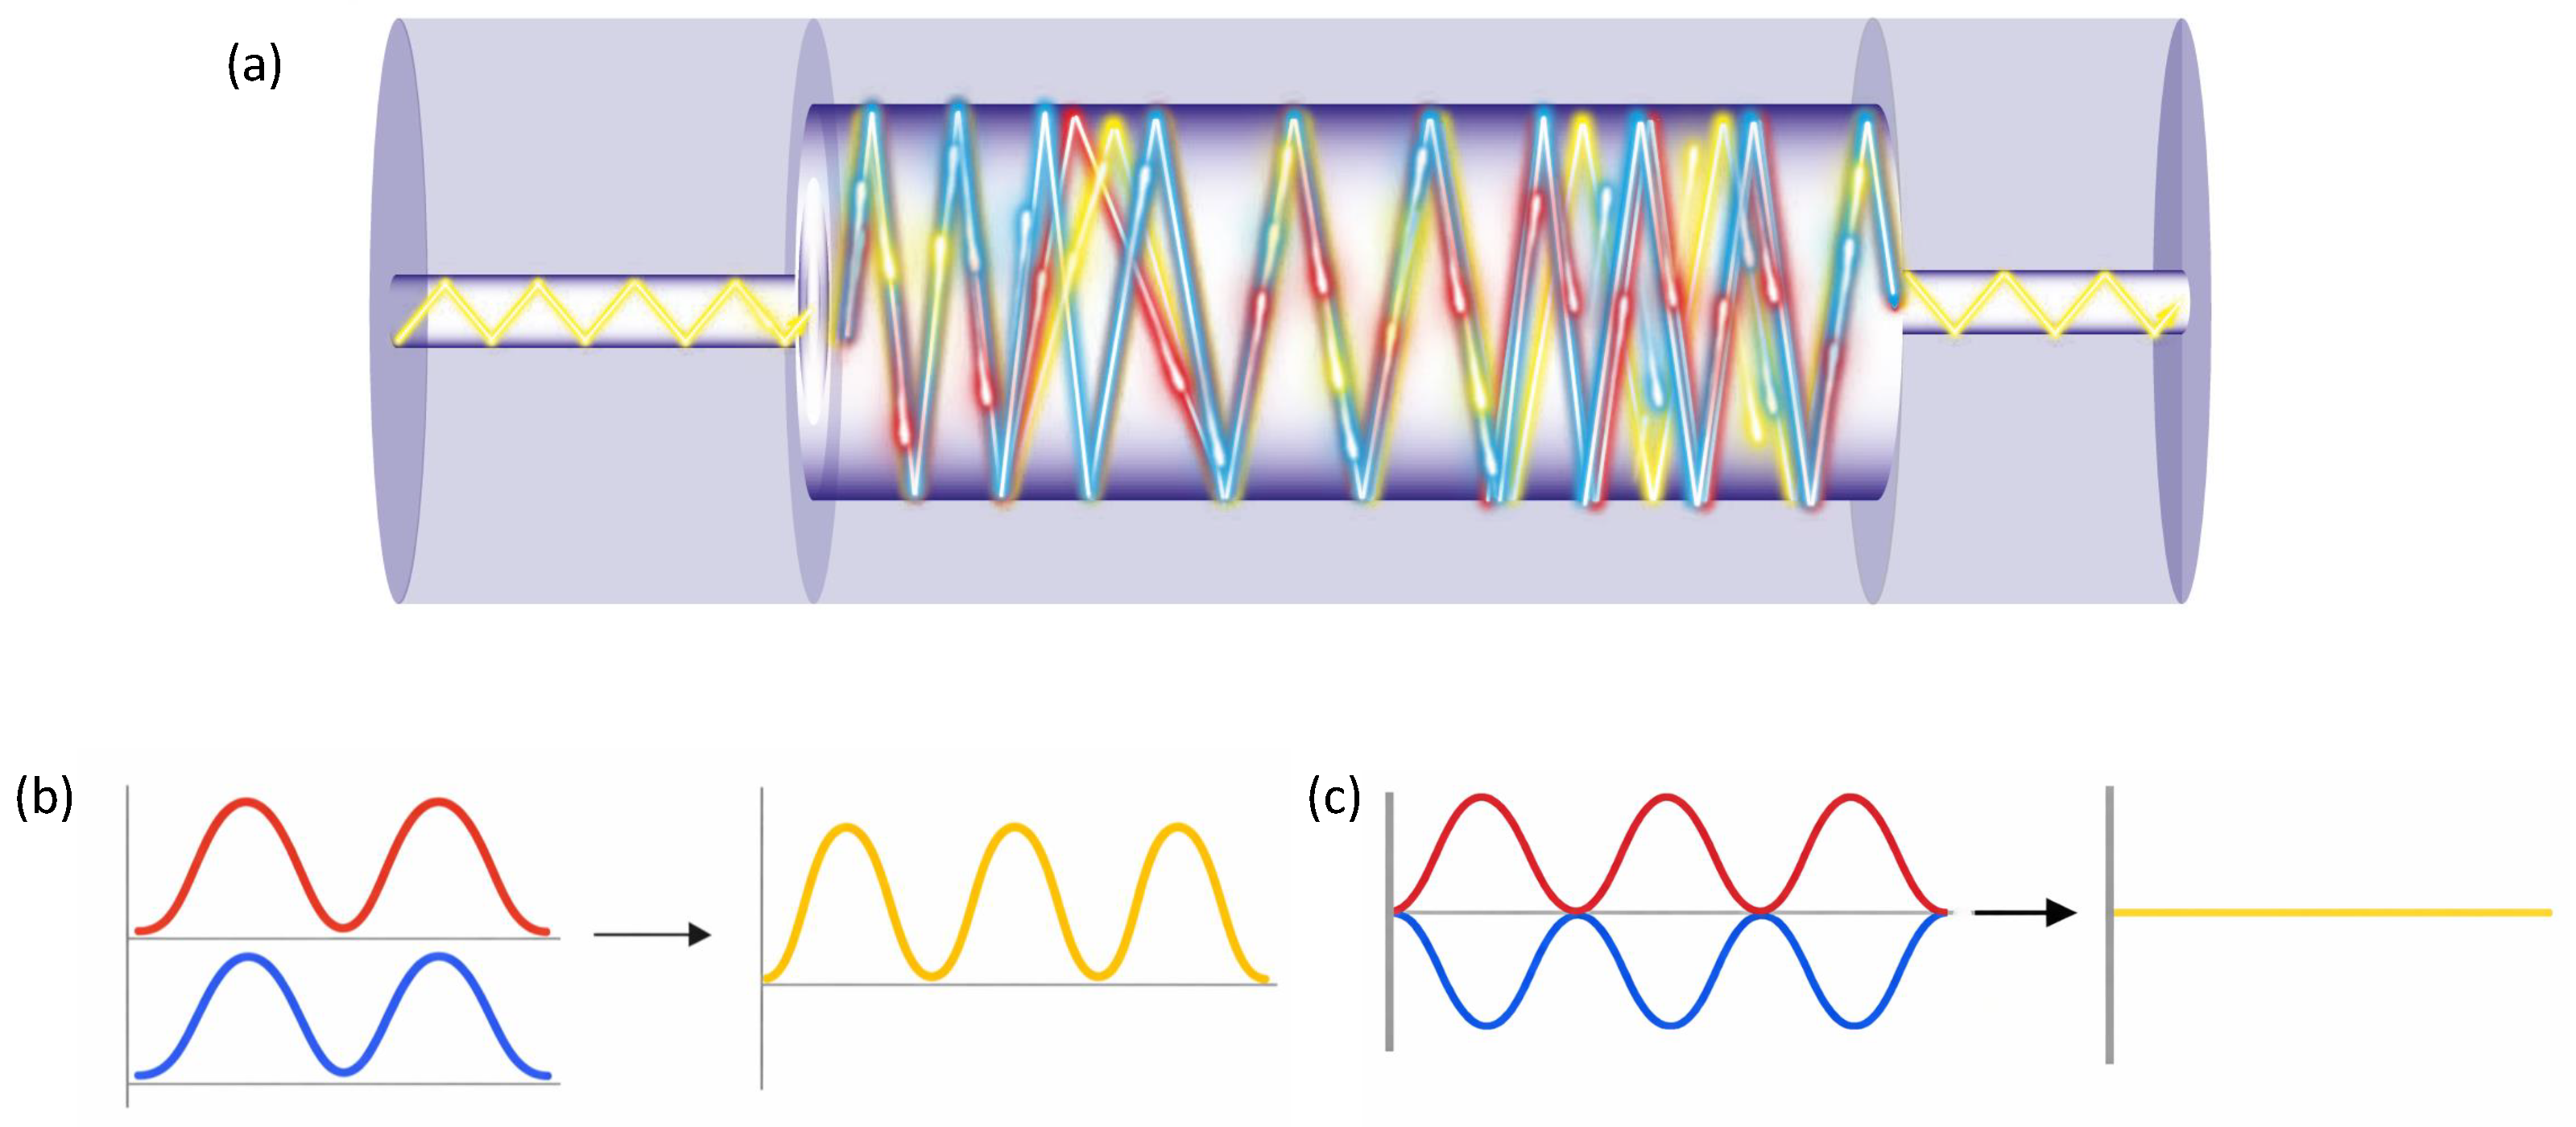
It is important to distinguish between the roles of single-mode and multimode fibers in such systems. Single-mode fibers (SMFs) are highly effective for long-distance optical data transmission due to their low attenuation and ability to propagate only the fundamental mode, which avoids modal dispersion. In contrast to single-mode fibers, whose high resistance to external perturbations makes them less sensitive to environmental changes, multimode fibers (MMFs) support the simultaneous propagation of multiple guided transverse modes, each with a distinct phase velocity, as shown in
Figure 1a. The superposition of these modes, represented in
Figure 1b, leads to constructive interference when they are in phase, increasing the resulting optical intensity, and to destructive interference, represented in
Figure 1c, when they are out of phase, causing partial or total cancellation of the optical field. This multimodal interference produces spatial and temporal intensity fluctuations along the fiber and gives rise to a characteristic optical phenomenon known as self-imaging, in which periodic replicas of the input field are formed along the propagation direction, as shown in
Figure 1. External perturbations such as strain, bending, or vibration modify the relative phase between modes, shifting the self-imaging pattern and establishing a direct correlation between environmental stimuli and changes in the optical signal, which makes MMFs highly suitable for sensing applications.
The operation of our SMS-based sensing system exploits this principle, i.e., when light from a single-mode fiber enters a multimode fiber, multiple guided modes are excited. As they propagate, they interfere constructively and destructively along the fiber’s length, forming spatially periodic self-images, so that any external mechanical disturbance, such as vibrations caused by a train passing over the rail, alters the phase relationships between these modes. This in turn modifies the intensity and profile of the self-imaging pattern, leading to detectable variations in the transmitted optical power.
The propagation of the optical field in the multimode fiber region of the SMS structure can be described by a modal expansion. In this formalism, the total electric field E(r,z) is represented as the weighted sum of the contributions of all guided excitation modes in the multimode fiber, as expressed by [
11]:
where
represents the transverse field distribution of the
m-th guided mode and
is its propagation constant. The total optical intensity at the output of the MMF results from the interference among these modes:
Under static conditions, the relative phase difference between any two modes
m and
n is given by:
where
L is the MMF length. Constructive interference occurs when
satisfies the self-imaging condition, resulting in maximum optical coupling to the output SMF [
12]. When the MMF is mechanically coupled to the rail, vibrations induced by the passage of a train introduce a time-dependent perturbation in the fiber length:
As well as small variations in the effective refractive index of each mode due to strain and photoelastic effects:
As a result, the modal propagation constants become time-dependent:
Substituting (4)–(6) into (3), the phase difference between modes becomes:
This expression shows that vibrations dynamically modulate the relative phase accumulation among guided modes, even for very small mechanical displacements [
11]. The optical intensity modulation is the resulting optical intensity at the output SMF becomes time-dependent:
Indicating that vibration-induced phase modulation directly translates into amplitude modulation of the transmitted optical signal. The photodetector converts this optical intensity variation into an electrical signal:
where
R is the responsivity of the photodiode. During train passage, the mechanical excitation significantly increases
and
, resulting in pronounced temporal fluctuations in
. These fluctuations serve as a reliable indicator of vibration events associated with the presence of a train.
The vibration-induced phase perturbation also causes a shift in the self-imaging condition, ref. [
13] which can be expressed through the wavelength-dependent interference relation:
Showing explicitly that variations in the effective MMF length lead to dynamic displacement of constructive interference peaks and, consequently, to measurable changes in transmitted intensity at a fixed operating wavelength.
Therefore, train-induced vibrations are transduced into measurable optical intensity fluctuations through vibration-dependent modulation of multimode phase accumulation and self-imaging conditions in the SMS fiber structure [
14].
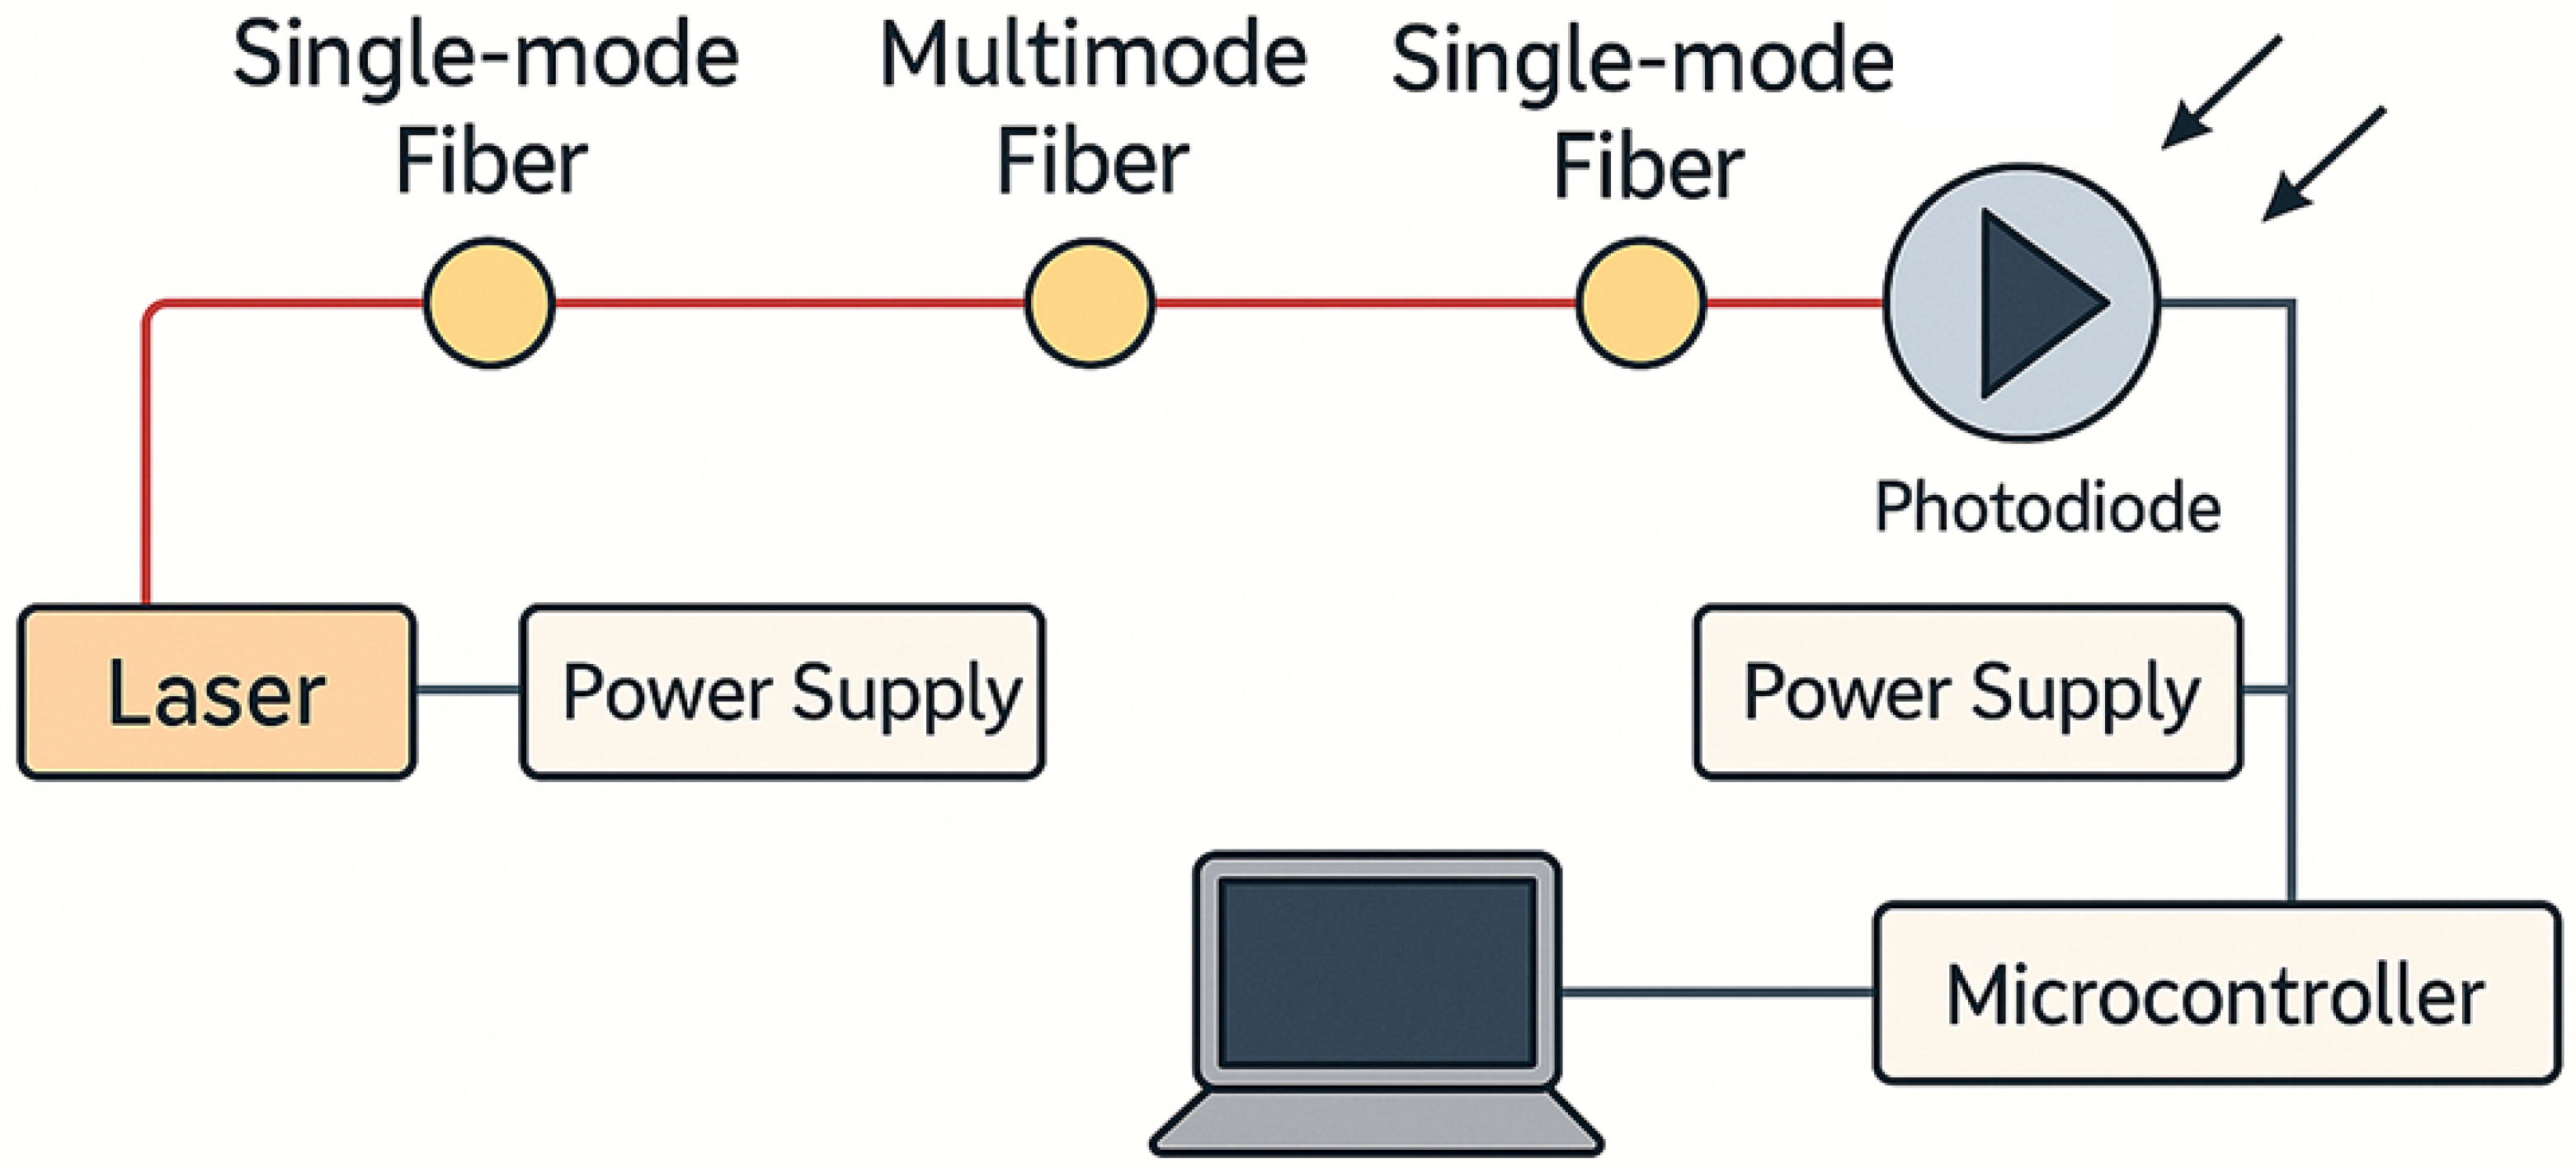
The sensor consists of a standard SMS configuration in which a short MMF segment is spliced between two SMFs. The SMFs, with core diameters of approximately 8.2 µm, carry only the fundamental mode, while the central MMF (core diameter: 105 µm) supports multiple transverse modes, so the interaction of these modes within the MMF defines the sensor’s response, which varies in accordance with changes in environmental conditions along the sensing fiber. The physical separation between sensing (MMF) and transmission (SMF) zones enhances robustness and minimizes susceptibility to environmental noise. Light generated by a near-infrared diode laser is launched into the input SMF, passes through the MMF where MMI occurs, and exits via the output SMF into a photodetector, so that the resulting electrical signal is digitized and processed by an embedded microcontroller system, with visualization handled by a MATLAB (v2023) interface.
The complete system consists of the laser source, SMS sensor, photodetection module, and embedded acquisition electronics, in addition to commercial FC/APC and SC/UPC connectors that ensure low-loss coupling and compatibility. The MMF segment measures approximately 30 cm, while the SMF segments can extend up to 650 m using ANATEL (Agência Nacional de Telecomunicações) certified fiber drop cables for ruggedized deployment.
Figure 2 presents the block diagram of the overall system, illustrating the light path, sensing segment, and data acquisition chain. This design provides a reliable and scalable platform for real-time vibration detection in railway applications.
3. Sensor Construction, Packaging, and System Integration
To construct the SMS sensor, the ends of the single-mode (SM) and multimode (MM) fibers were carefully cleaved and spliced using attaching SC/UPC connectors, forming the SMS configuration in which two SMFs are connected to a short MMF segment to constitute the sensor loop. Cleaving was performed with precision tools to minimize optical losses, while the fusion splicing ensured minimal insertion loss at the joints. Different geometries were tested to evaluate the sensor’s response under various configurations, including straight placement of the MMF, gentle bends, and more complex looped arrangements. The results demonstrated the importance of geometry in tuning the sensor’s sensitivity and ensuring robustness under real-world conditions.
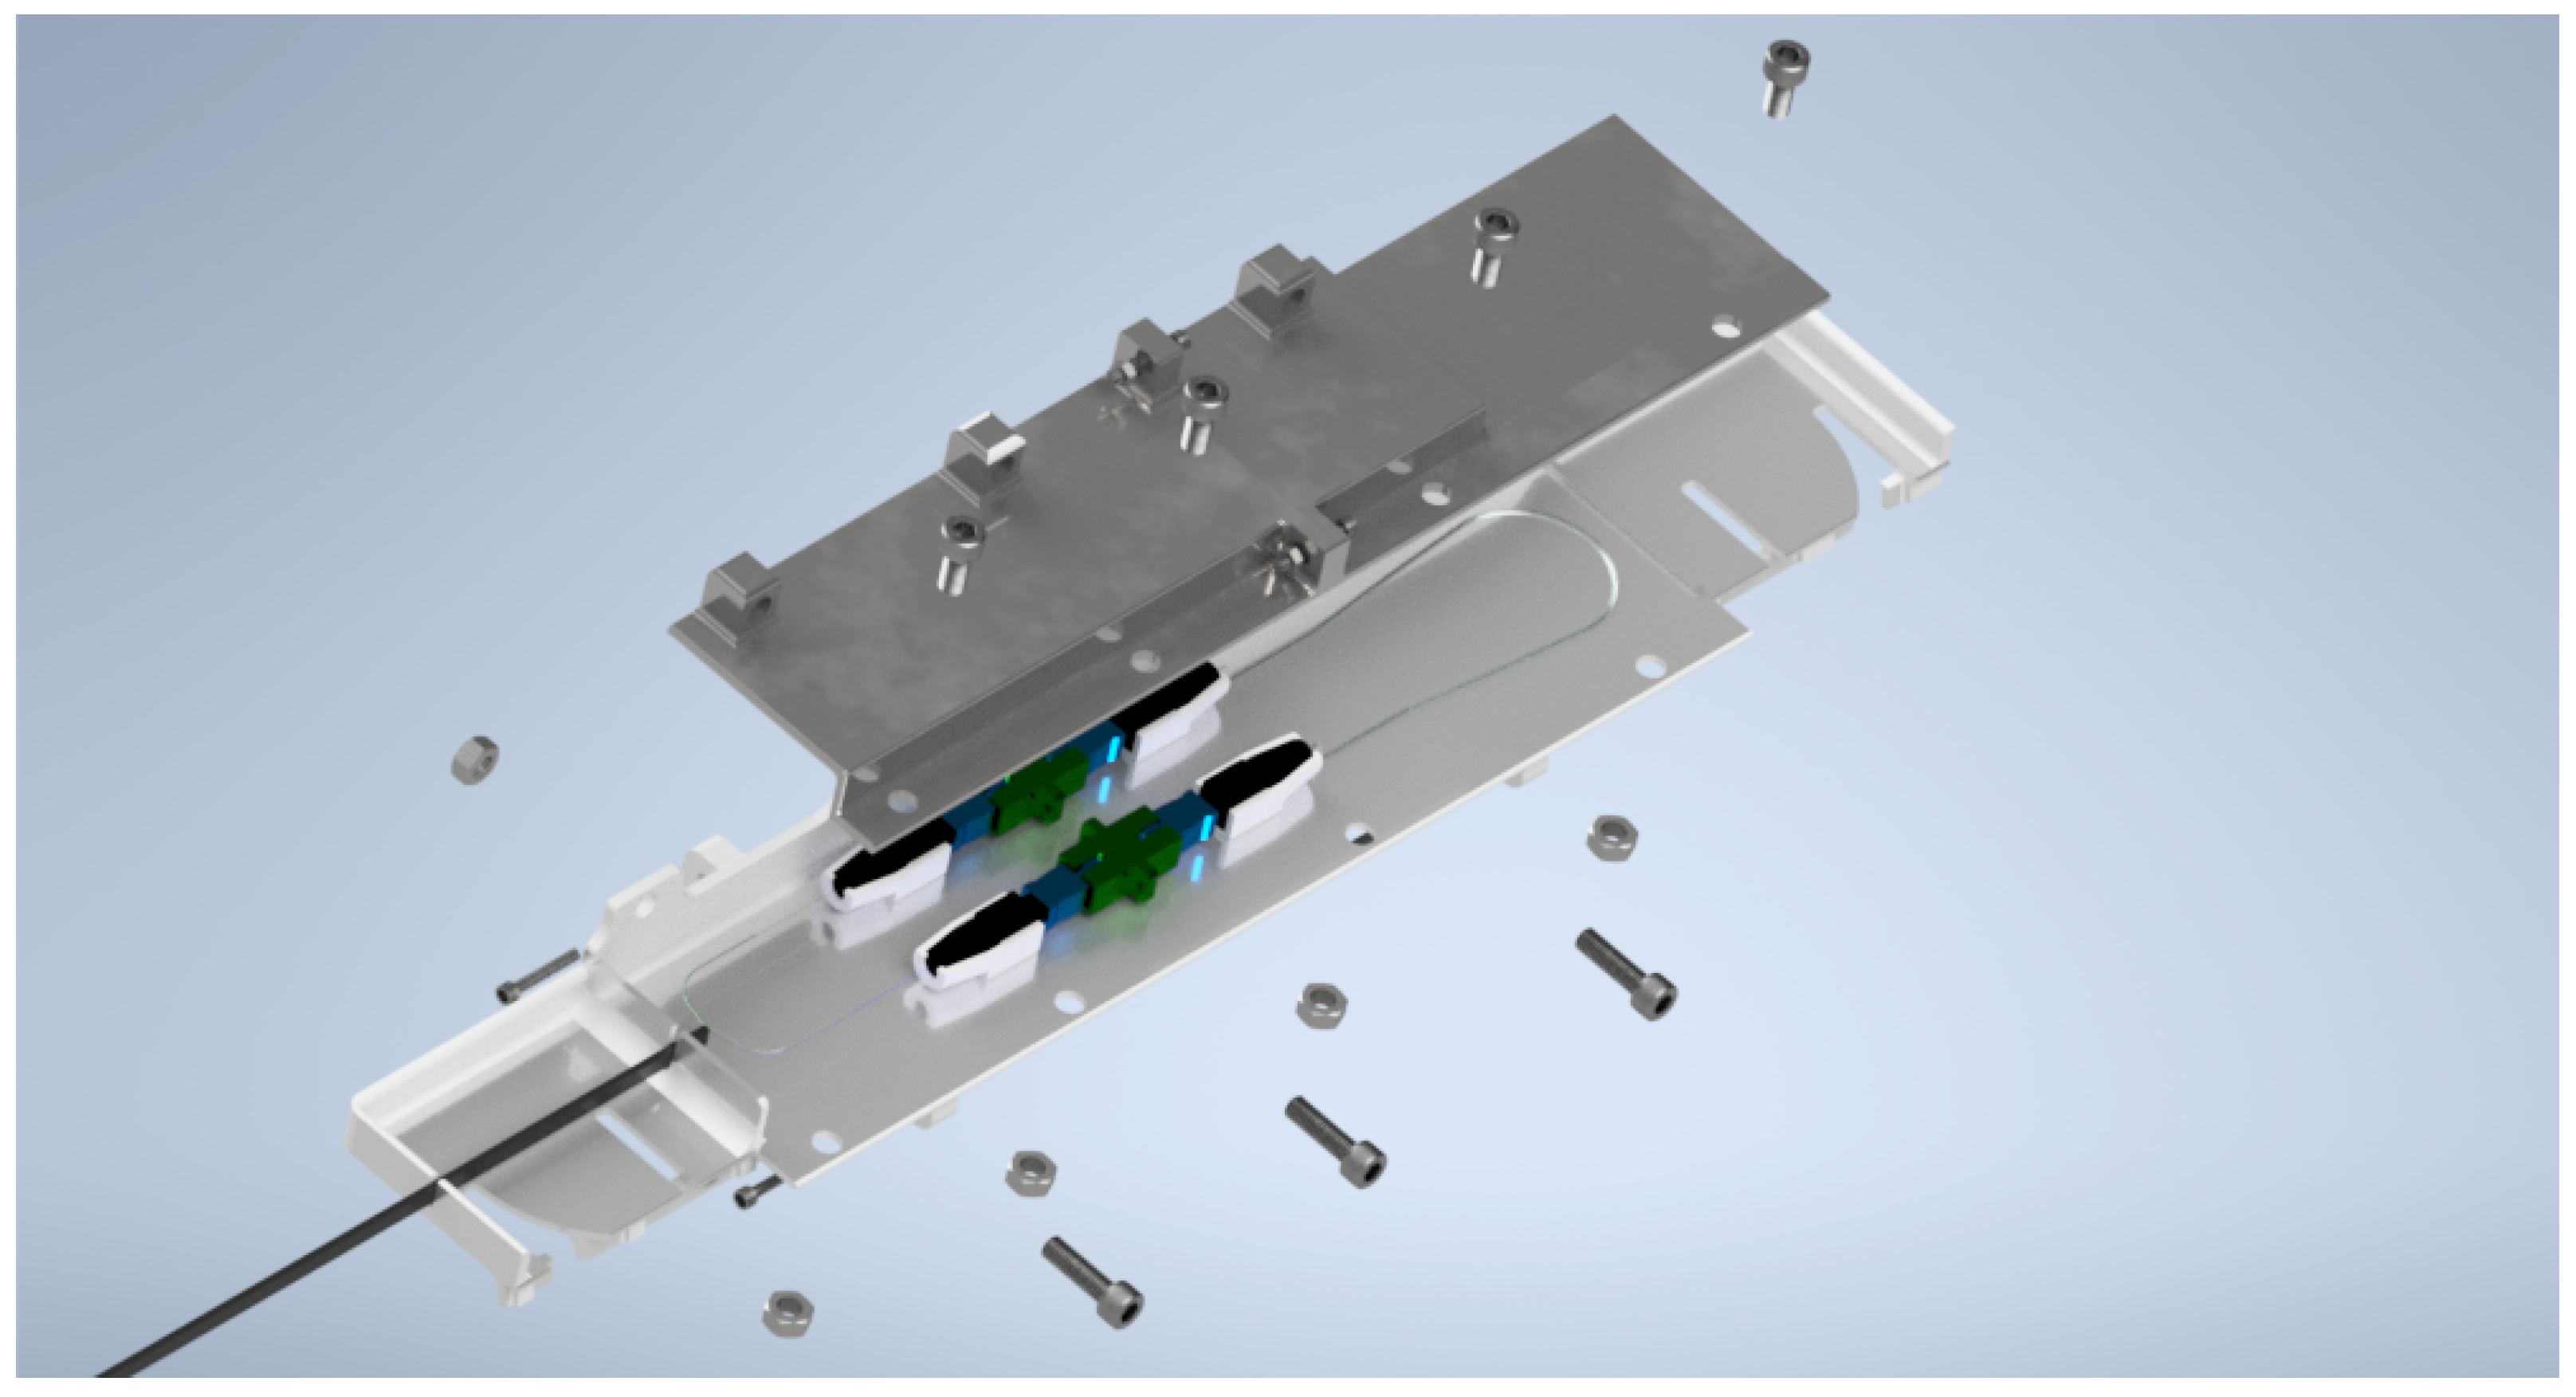
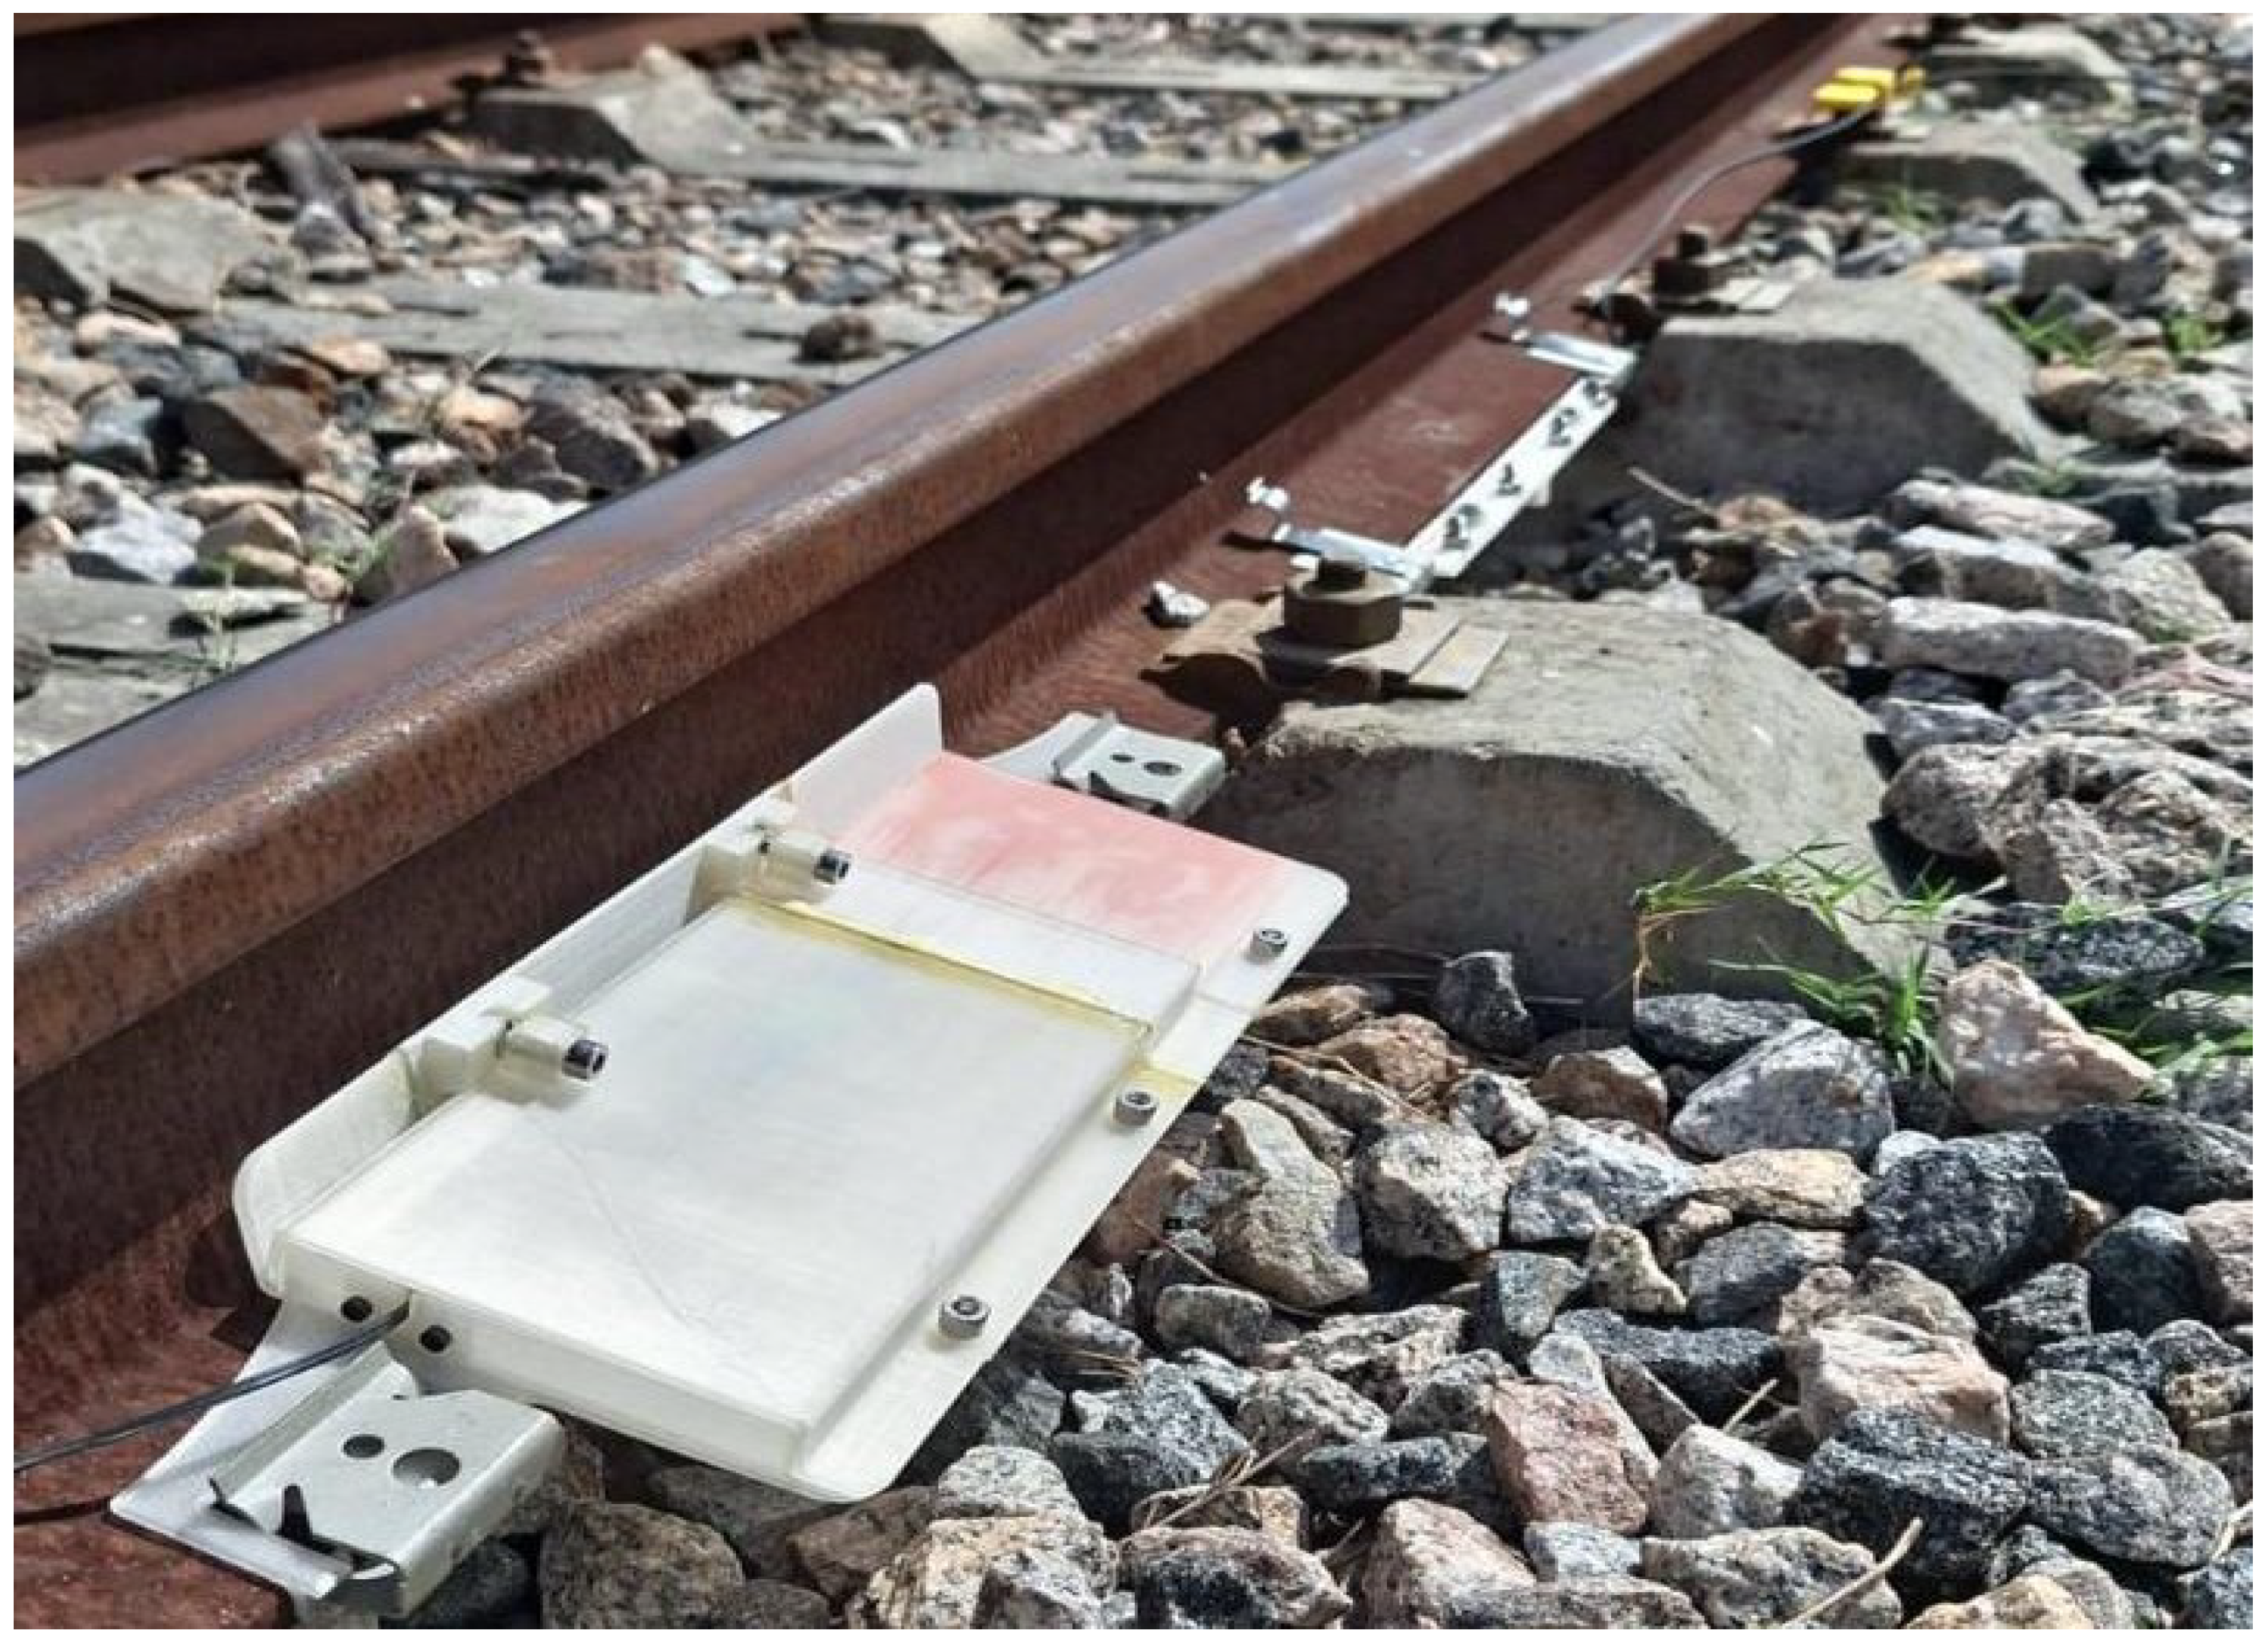
To protect the fiber optic sensor and facilitate deployment, we housed the sensor fiber in a 3D-printed mechanical support structure specifically designed for TR37 rail profiles, in compliance with ABNT (Associação Brasileira de Normas Técnicas) standards. The primary purpose of this support was to protect the sensor and its fiber connections while ensuring optimized fixation, mechanical stability, and adherence to the minimum bend radius of 16 mm, as recommended for short-term handling of MMFs. The structure was modeled using CAD (Computer Aided Design) software (v2023) and consists of five interlocking plates connected with nuts and bolts. These plates feature dedicated cavities for securing the fiber, conical extrusions for attaching SC/UPC connectors, clamps for attachment, integrated cable guides, and specific slots to accommodate connectors, contributing to secure and efficient installation. To facilitate handling, both ends of the support include 45º curved cutouts. Manufacturing was carried out using PLA (Polylactic Acid) based 3D printing, enabling rapid prototyping and easy adaptation to design modifications. The sensor fiber was inserted into the support and fixed with industrial-grade metal clamps during field deployment, and all dimensional aspects were verified to ensure the proper fit and reliability. The final prototype demonstrated robustness and effective accommodation of the sensor under real-world conditions and is illustrated in
Figure 3.
The smooth integration between the optical sensor and the embedded electrical system enabled accurate measurement, processing, and transfer of data. The signal chain begins with the laser driver, followed by the photodetector, amplification stage, microcontroller, and analog-to-digital converter (ADC). After decoding, the microcontroller transfers the data to MATLAB via USB for visualization and storage. The main system components include an laser source, a 5 V supply provided by the microcontroller, a voltage regulator for power stability, and a photodetector with sensitivity in the 800–1800 nm wavelength range. The embedded application handles real-time data transfer, continuous analog signal acquisition, and logging for post-analysis.
The embedded hardware specifically consists of a microcontroller to read, process, and store digital signals, a photodetector that captures the optical output and converts it into electrical voltage, a printed circuit board (PCB) ensuring adequate power distribution and signal conditioning, and a computer for data visualization and analysis. The conditioned voltage signal, derived from light measured at the fiber output, can also be observed with an oscilloscope, allowing signal oscillations caused by external disturbances on the MMF to be analyzed. To mitigate environmental effects and electromagnetic interference, the optical loop and embedded electronics were housed in a junction box containing the main circuit: an optical light source for continuous signal generation, a photodetector, and two voltage regulators—one managing the battery supply voltage and another stabilizing the operating voltage of the light source.
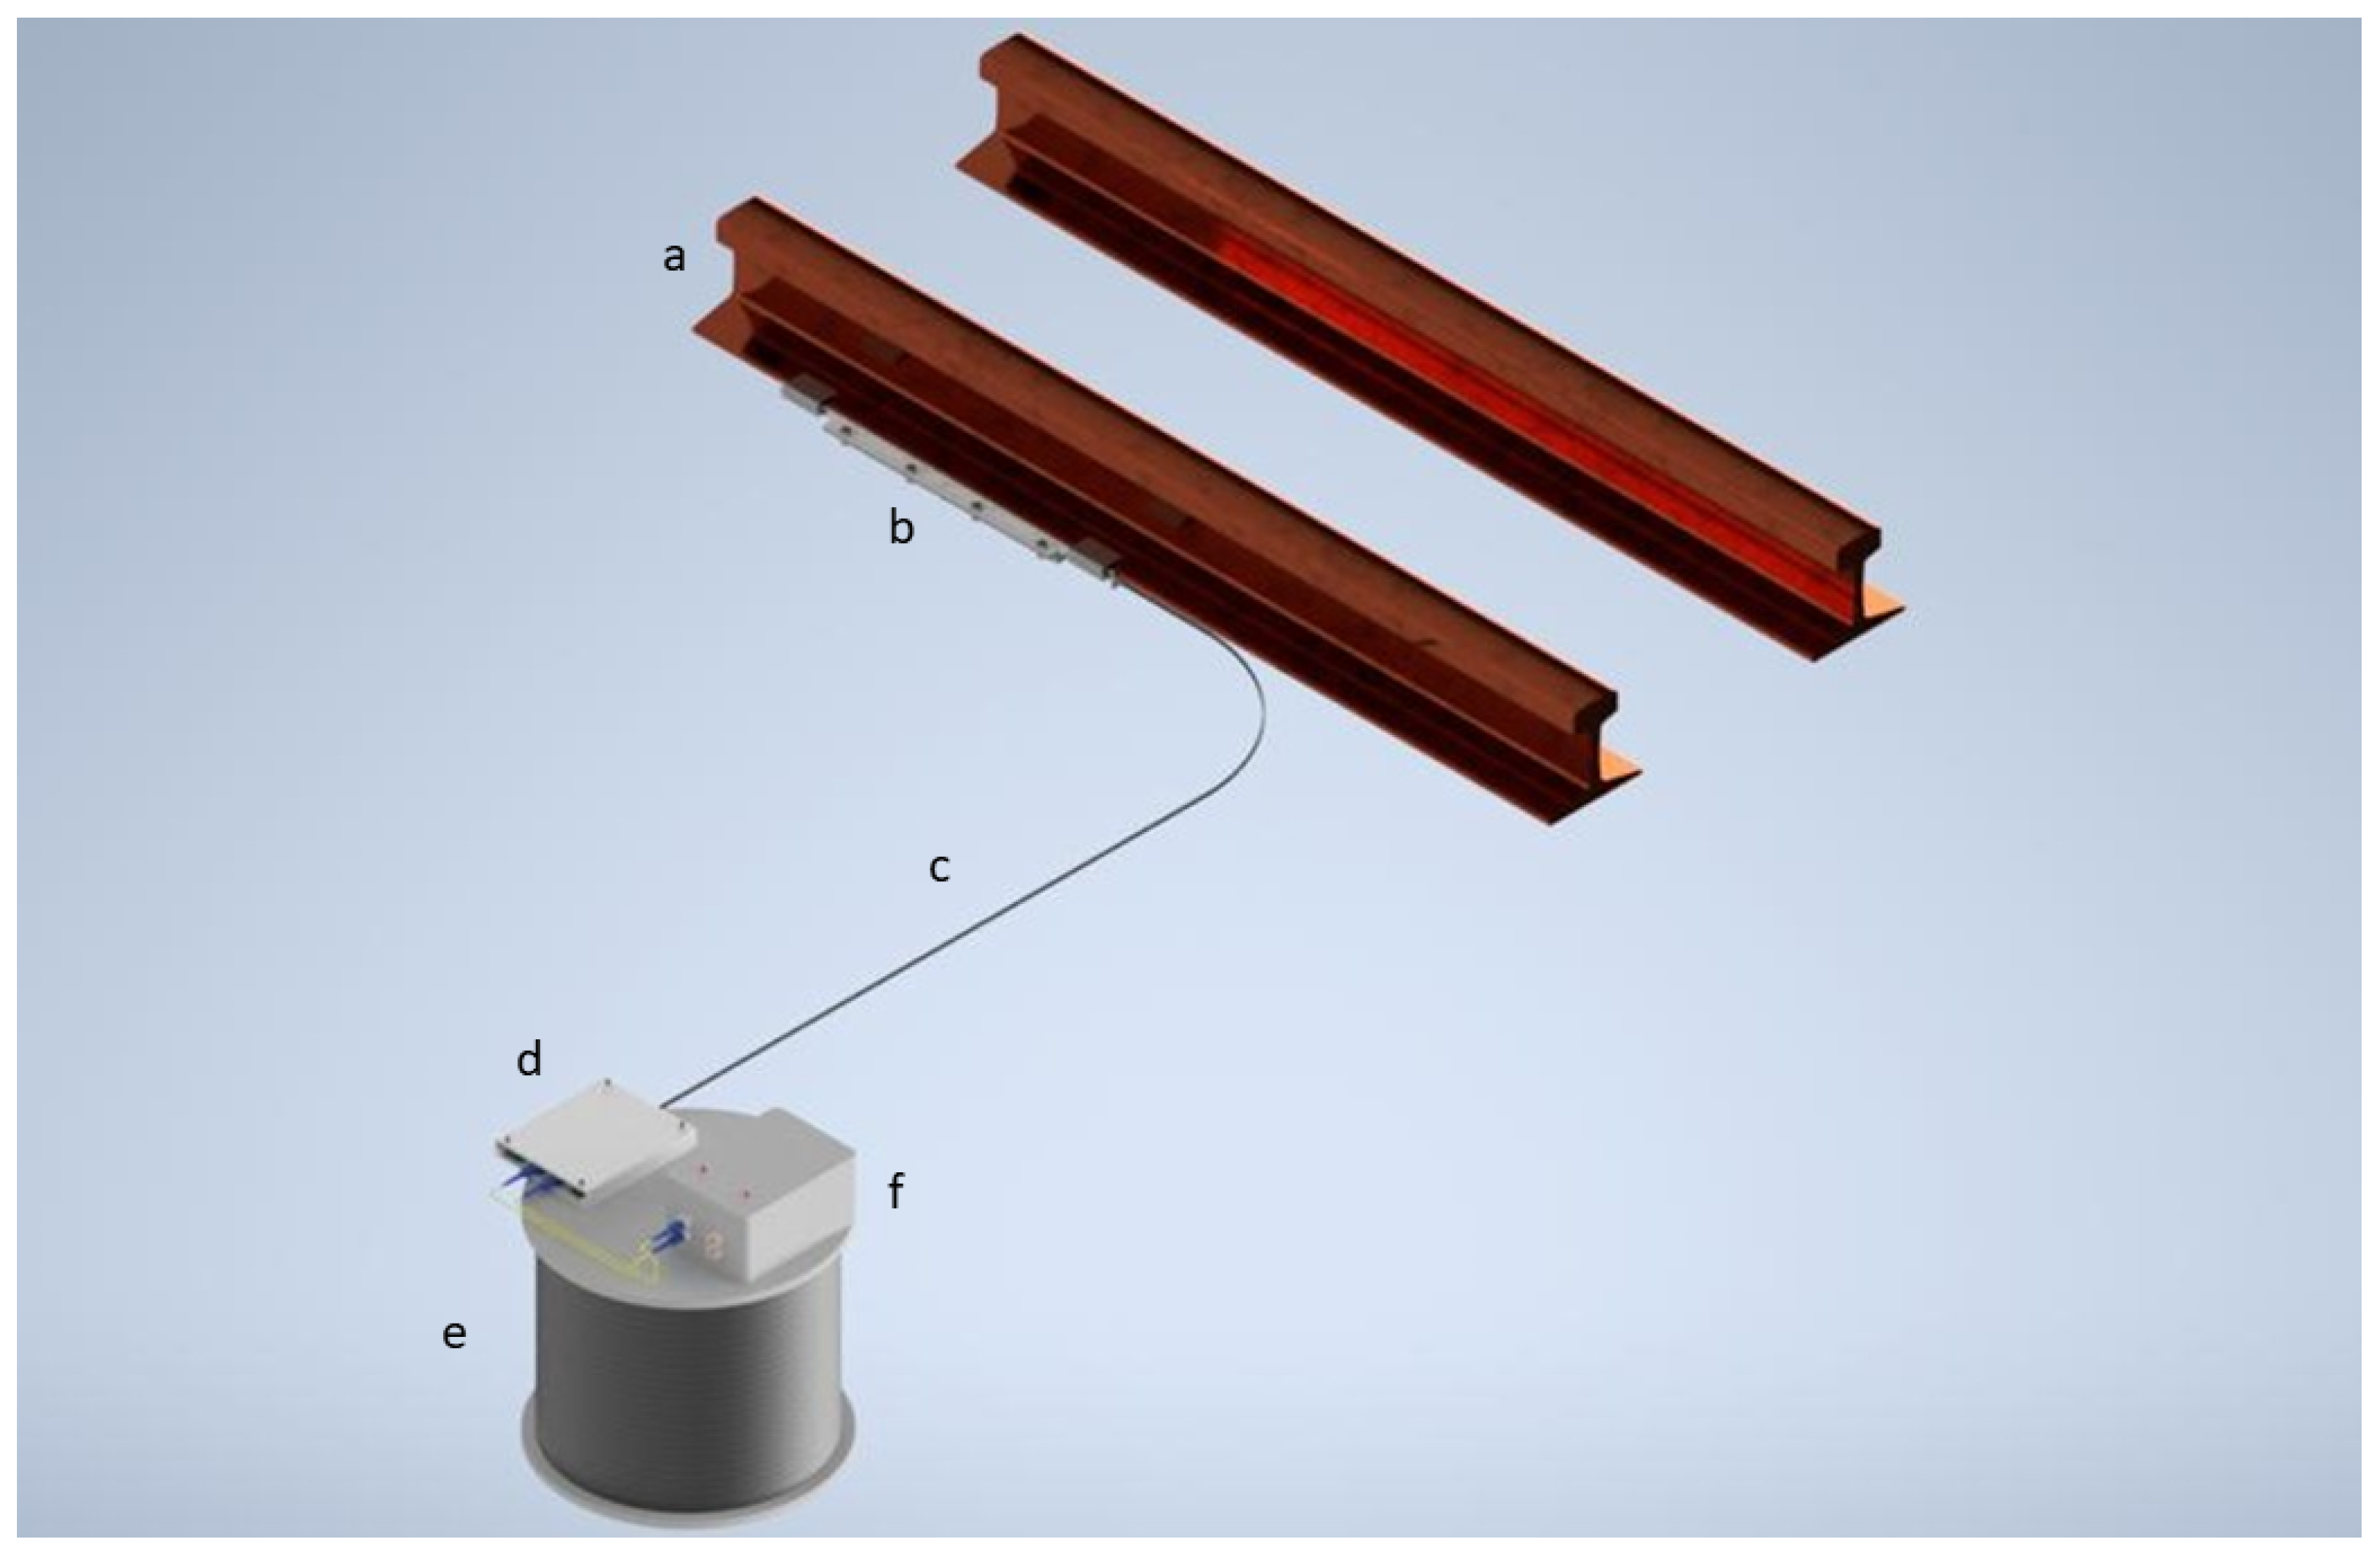
The complete system was mounted on a structural support with a reel of single-mode fiber cable. A robust plastic electronic junction box, positioned on the upper left of the structure, connects to the single-mode fiber via two optical patch cables. This box includes two blue fiber-optic connectors, four corner screws for sealing, external interfaces for power and data acquisition, and two red LEDs on the top surface serving as visual indicators for train detection events. Adjacent to it, a smaller enclosure functions as a passive optical interface, housing the connectors that link the laser source and photodetector within the electronics box to the external single-mode fiber, as shown in
Figure 4.
This compact and modular configuration ensured mechanical stability, simplified maintenance, and preserved optical alignment necessary for consistent sensor performance under field conditions. Integration with external systems was achieved via MATLAB, with future upgrades envisioned to include wireless communication modules and cloud-based storage for deployment in distributed sensing networks.
4. Laboratory Tests and Prototype Validation
We performed extensive and comprehensive laboratory activities to validate the optical, mechanical, and electronic components of the SMS-based vibration sensor and determine the most suitable configuration for field deployment. These tests assessed the sensing architecture, optical sources, SMS fiber structures, coupling methods, photodetectors, acquisition electronics, and the sensor’s response to controlled mechanical excitations, with the goal of achieving optimal stability, sensibility, and cost-effectiveness. The core of the sensing system is the single-mode–multimode–single-mode (SMS) fiber configuration. We used two single-mode fibers (8.2 µm core) for optical transmission and reception, and we tested the multimode fiber in core diameters of 50, 105, and 200 µm; this section acted as the sensing element. Laboratory experiments confirmed the expected behavior: fundamental mode propagation in single-mode fibers and high multimodal interference sensitivity in the multimode segment under external perturbations. These results validate the SMS architecture as the foundation of the prototype, demonstrating low intrinsic loss, repeatability, and high responsiveness to mechanical vibrations.
To systematically identify the most suitable optical configuration, we constructed multiple SMS assemblies using different combinations of fiber types, light sources, and interconnection methods. Two categories of coupling were evaluated: connectorized fibers (SC/UPC, FC/PC, and SC/SC) and fusion-spliced joints (FSJs). The connector compatibility, alignment quality, and coupling efficiency were verified, with commercial connectors and adapters exhibiting low-loss interconnections and adequate mechanical stability. ANATEL (Agência Nacional de Telecomunicações) certified SM drop cables ensured long-distance transmission integrity, whereas the multimode fiber (105 µm core) demonstrated stable modal behavior and compliance with bending radius specifications during handling and installation.
For the optical source, a fiber-pigtailed laser diode (1550 nm) was selected because of its stable performance and favorable cost-to-benefit ratio.
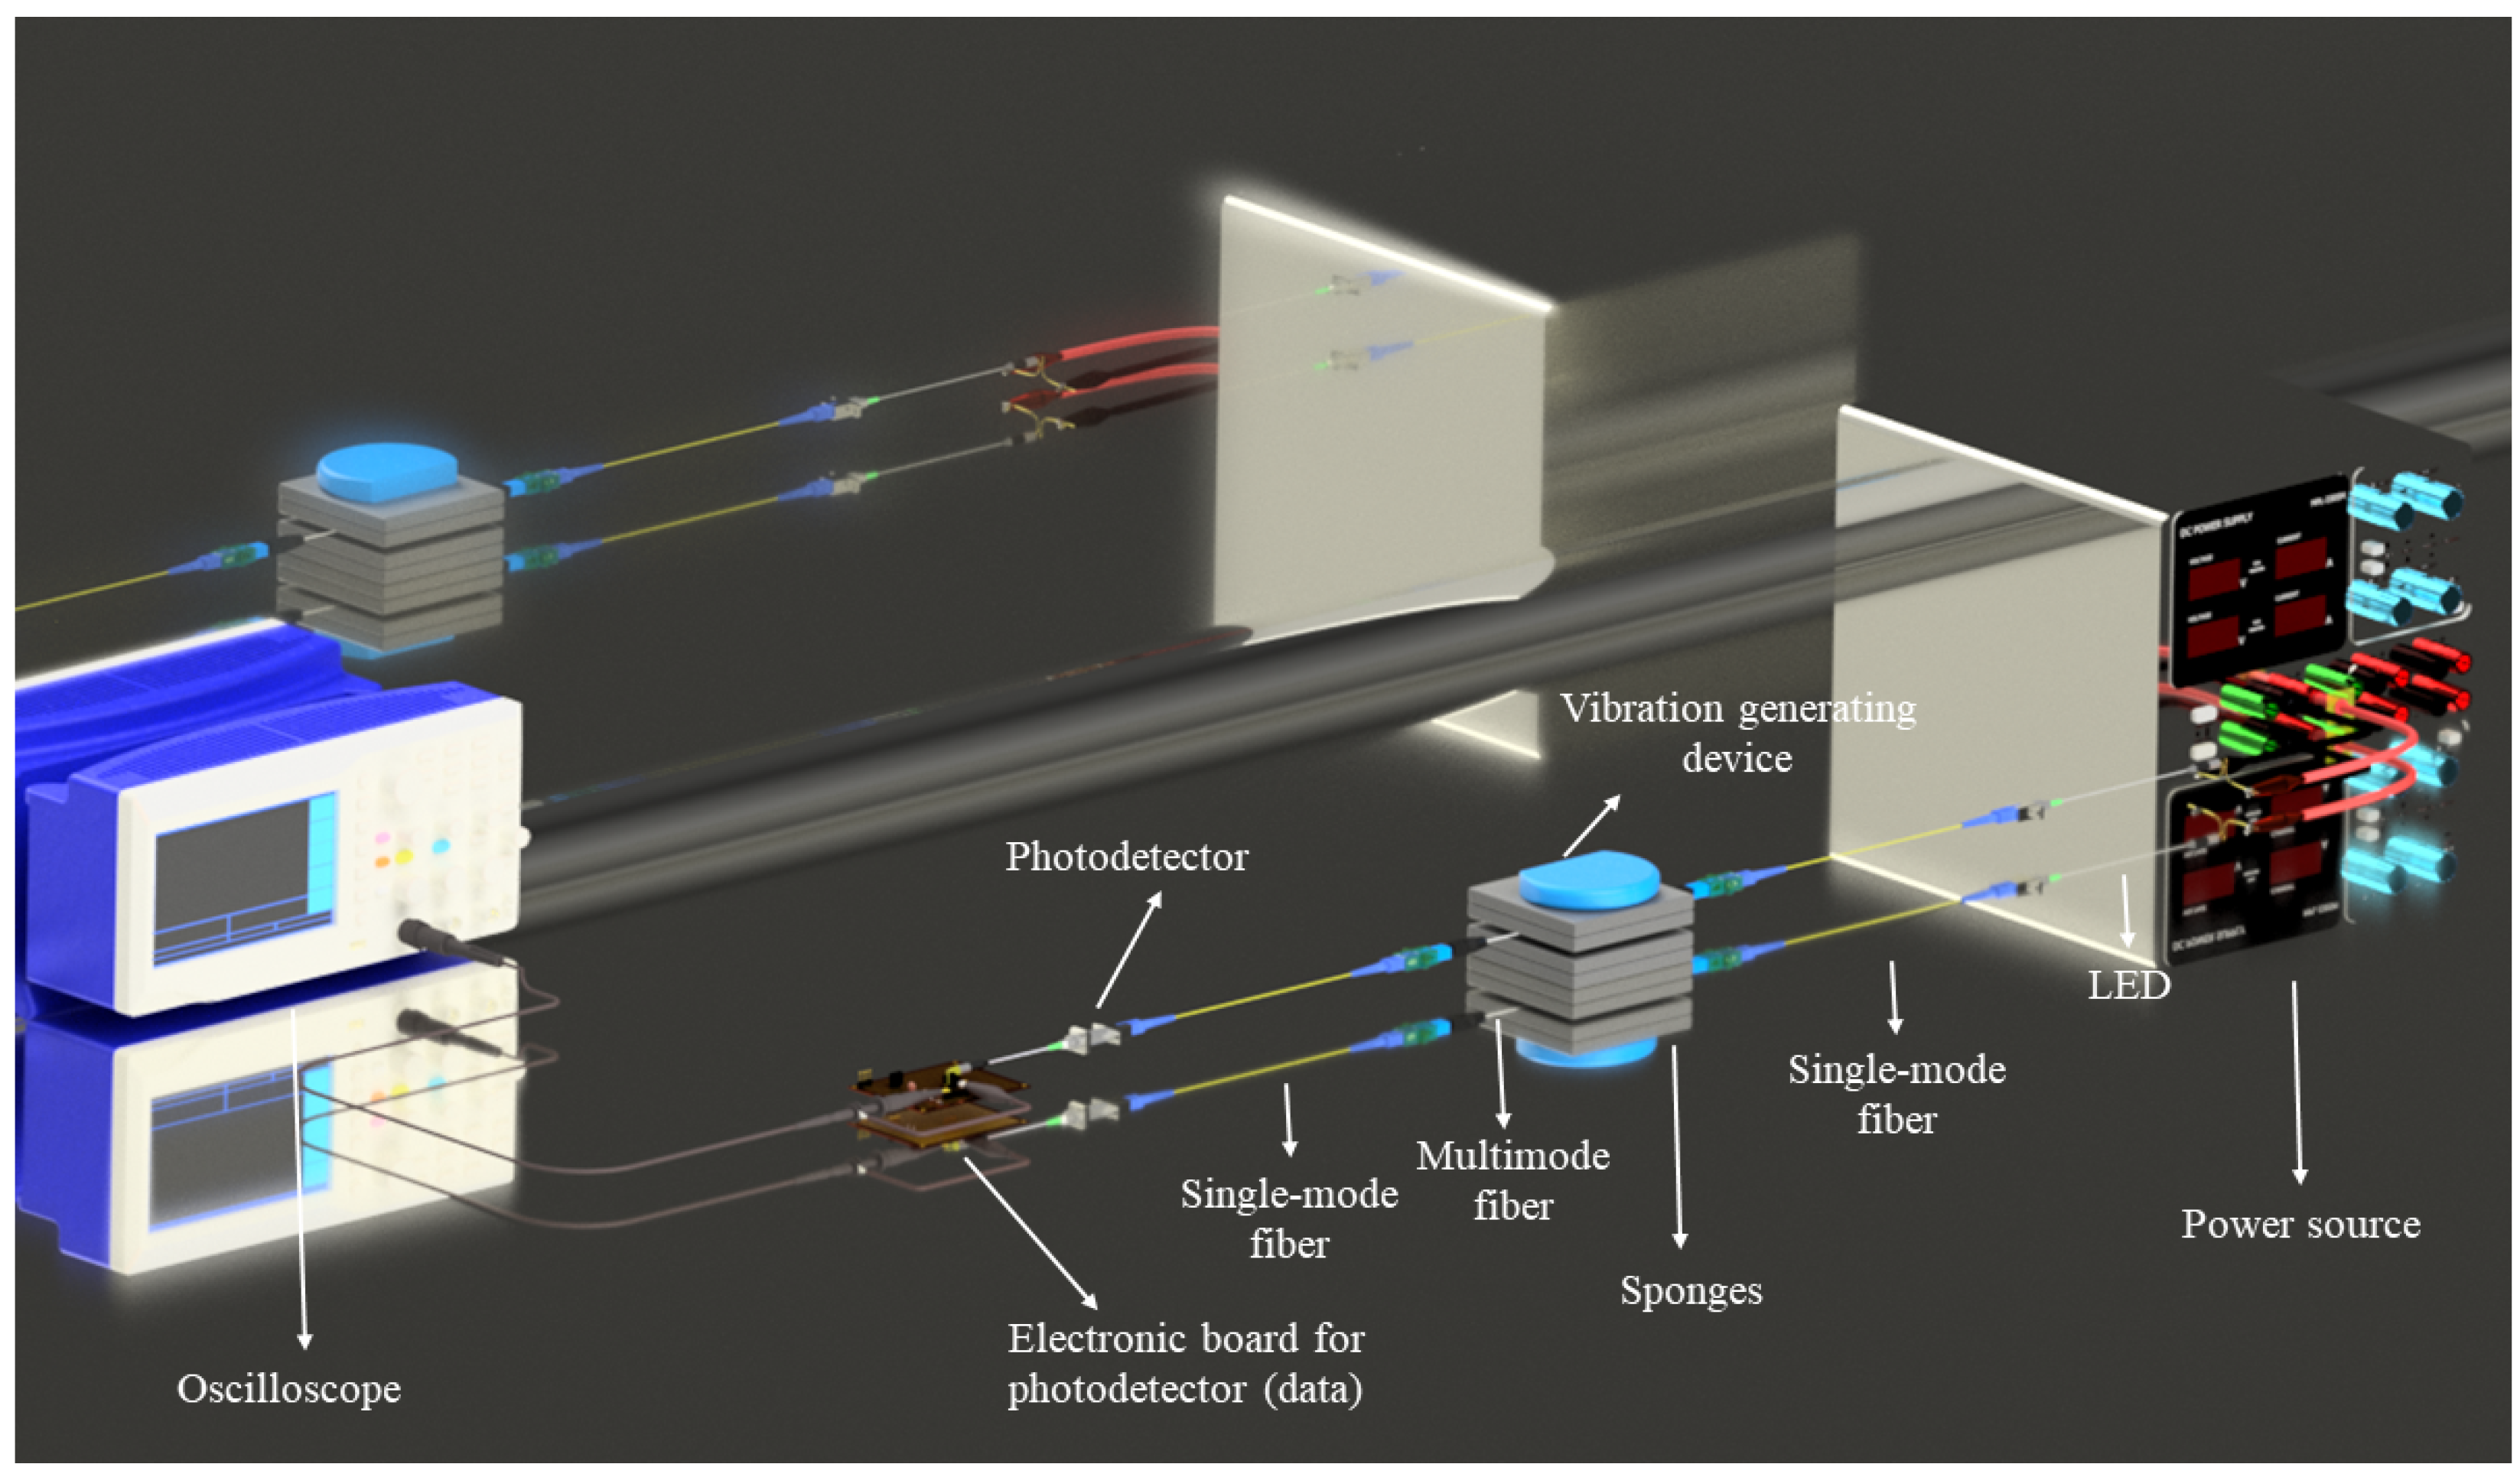
Figure 5 illustrates the laboratory setup used to characterize the SMS-based optical vibration sensor. The system is built around a single-mode–multimode–single-mode (SMS) fiber configuration, in which the multimode fiber (MMF) section acts as the sensing element, while a fiber-coupled optical source (LED or laser diode) is connected to the input single-mode fiber (SMF), ensuring stable light injection into the sensing structure. The optical signal propagates from the input SMF into the MMF segment, where multiple guided modes are excited and interact through multimodal interference. This multimode fiber is submitted to a vibration-generating device and supported by sponges, which provide controlled excitation while minimizing undesired boundary constraints, and that vibration device comes into direct contact with the fiber, generating unstable signals.
The output end of the SMS structure is connected to a second single-mode fiber, which guides the modulated optical signal to the photodetector, which in turn converts the optical intensity fluctuations induced by mechanical vibrations into an electrical signal. This signal is conditioned by a dedicated electronic acquisition board and monitored in real time using an oscilloscope, allowing direct visualization of the temporal response of the sensor. The optical source is powered by an external, stabilized power supply to ensure constant illumination during the experiments. This configuration enables systematic evaluation of the sensor response under controlled vibration conditions, as well as assessment of signal stability, noise levels, and sensitivity associated with multimodal interference in the SMS structure.
We analyzed two powering strategies: an initial voltage divider circuit and a regulated current-control system. Both approaches were proven to be reliable for safe and stable operation during prototype validation. Multiple photodetector units, including a cost-optimized alternative, were characterized in the laboratory. All tested devices exhibited adequate responsivity within the 850–1650 nm range and delivered clean, low-noise electrical signals compatible with embedded acquisition electronics.
The acquisition system, based on an Arduino Mega, we validated for continuous sampling of the photodiode output and for real-time data transmission to MATLAB. Proper shielding, grounding, and board assembly effectively minimized electromagnetic interference, and MATLAB visualization confirmed the accurate and stable tracking of temporal variations generated by controlled mechanical excitations. To support future field deployments, we developed a custom mechanical enclosure following the TR37 rail profile. The design incorporates an internal cavity that respects the minimum bending radius of the multimode fiber, alignment fixtures for optical connectors, and clamp-compatible grooves for secure fastening to the track structures. Laboratory evaluations demonstrated the mechanical robustness, straightforward assembly, and effective protection of the fiber and connectors, ensuring sensor reliability under real-world operating conditions.
The evaluation methodology involved connecting each optical source to one end of the SMS loop, ensuring proper alignment and minimal coupling losses, and then attaching the opposing end of the loop to the photodetector. The optical sources deliver continuous, stable illumination, whereas the photodetectors convert the modulated optical intensity into electrical signals that are visualized either on an oscilloscope or through the embedded data acquisition system. This procedure enabled the direct assessment of the coupling efficiency, intrinsic noise levels, optical power stability, and sensor responsiveness to external mechanical disturbances. Following the static optical tests, the SMS structures were subjected to controlled vibration experiments using a low-frequency portable vibration generator with an adjustable intensity. We investigated three laboratory scenarios investigated.
4.1. Direct Vibration on Multimode-Sensing Fiber
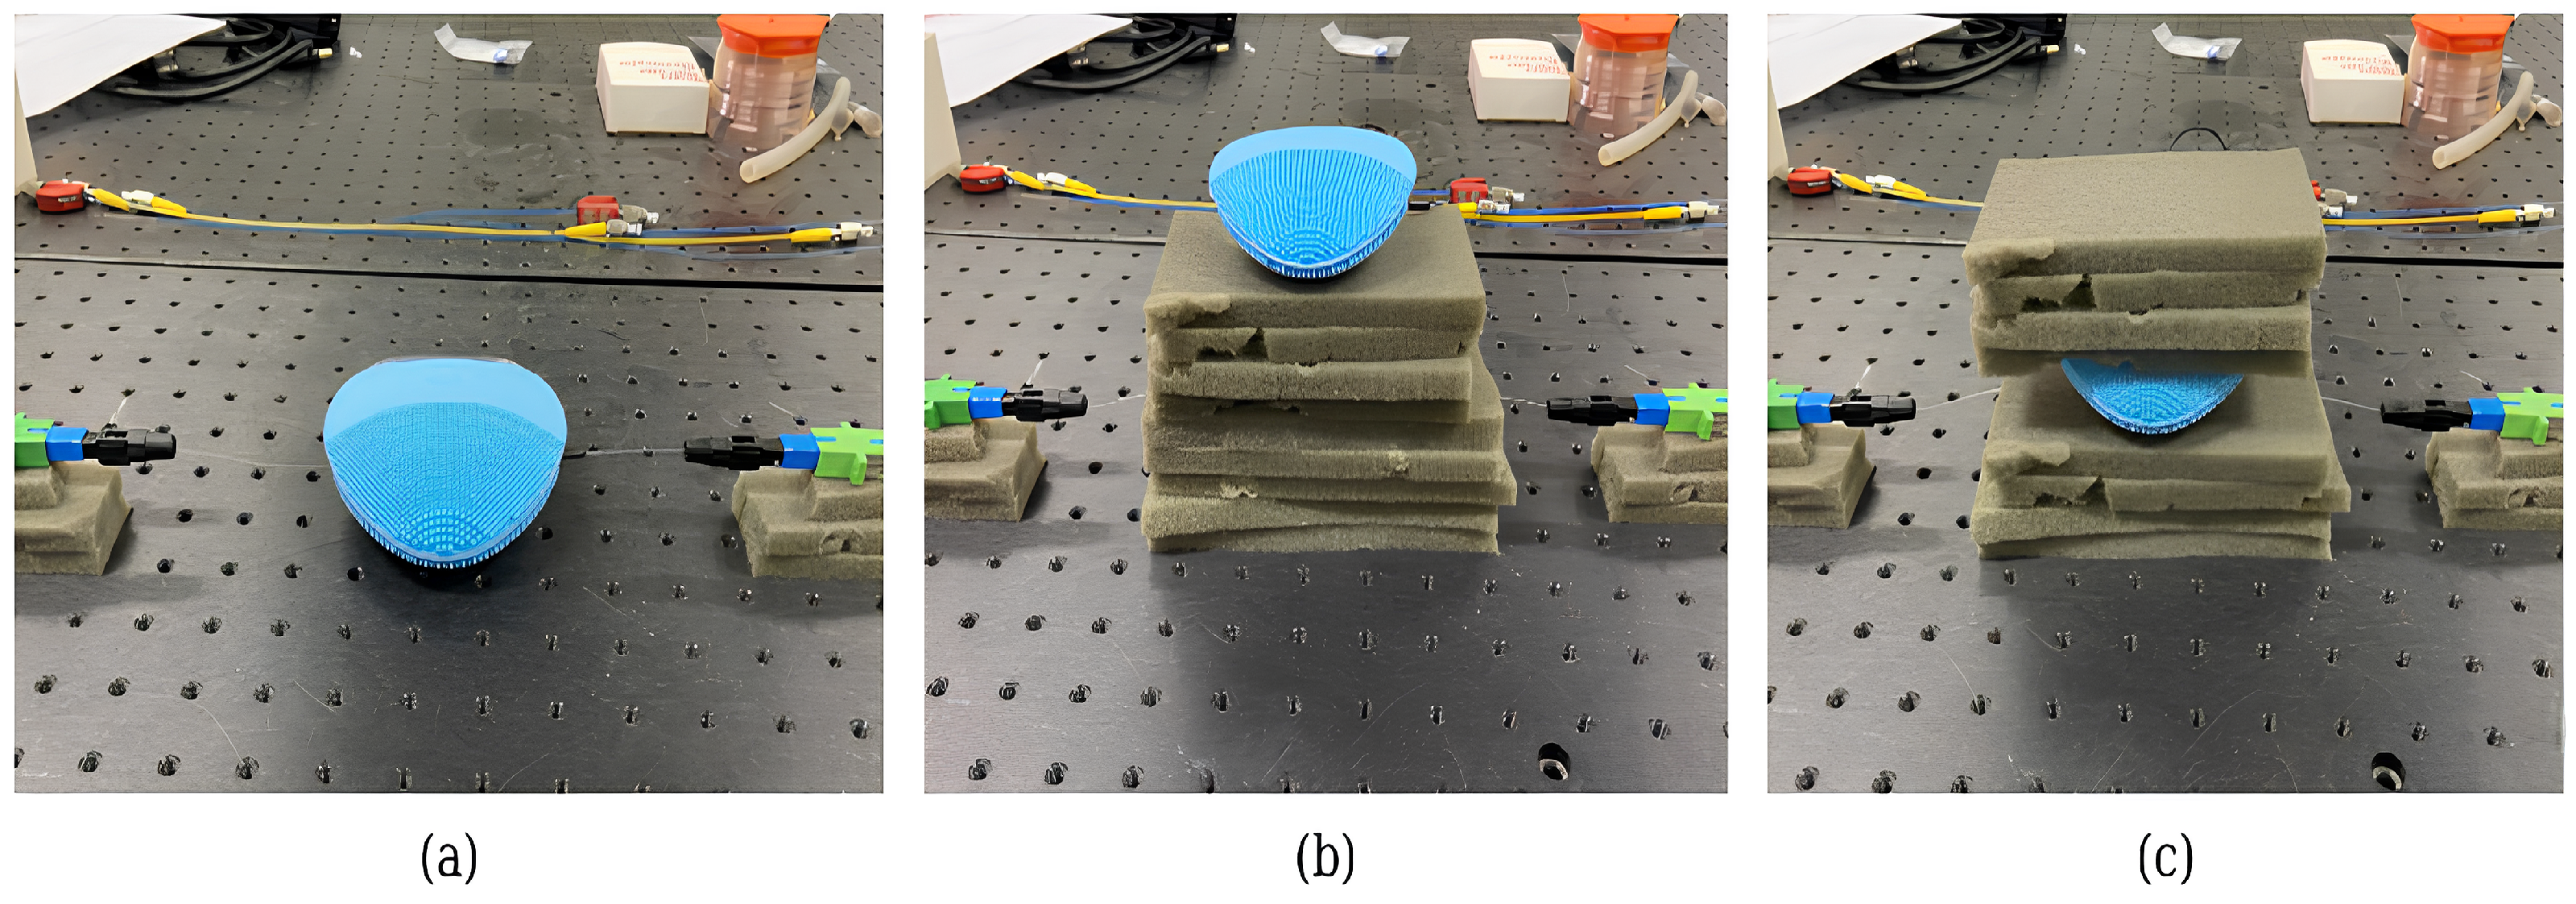
We placed the vibration device in direct contact with the fiber segments, as shown in
Figure 6a. This resulted in strong and rapid fluctuations in the detected signal, demonstrating the high sensitivity of the sensor to mechanical disturbances. However, owing to the movement of the generator, the signal exhibited significant instability, confirming the need for a mechanical support structure in the later stages.
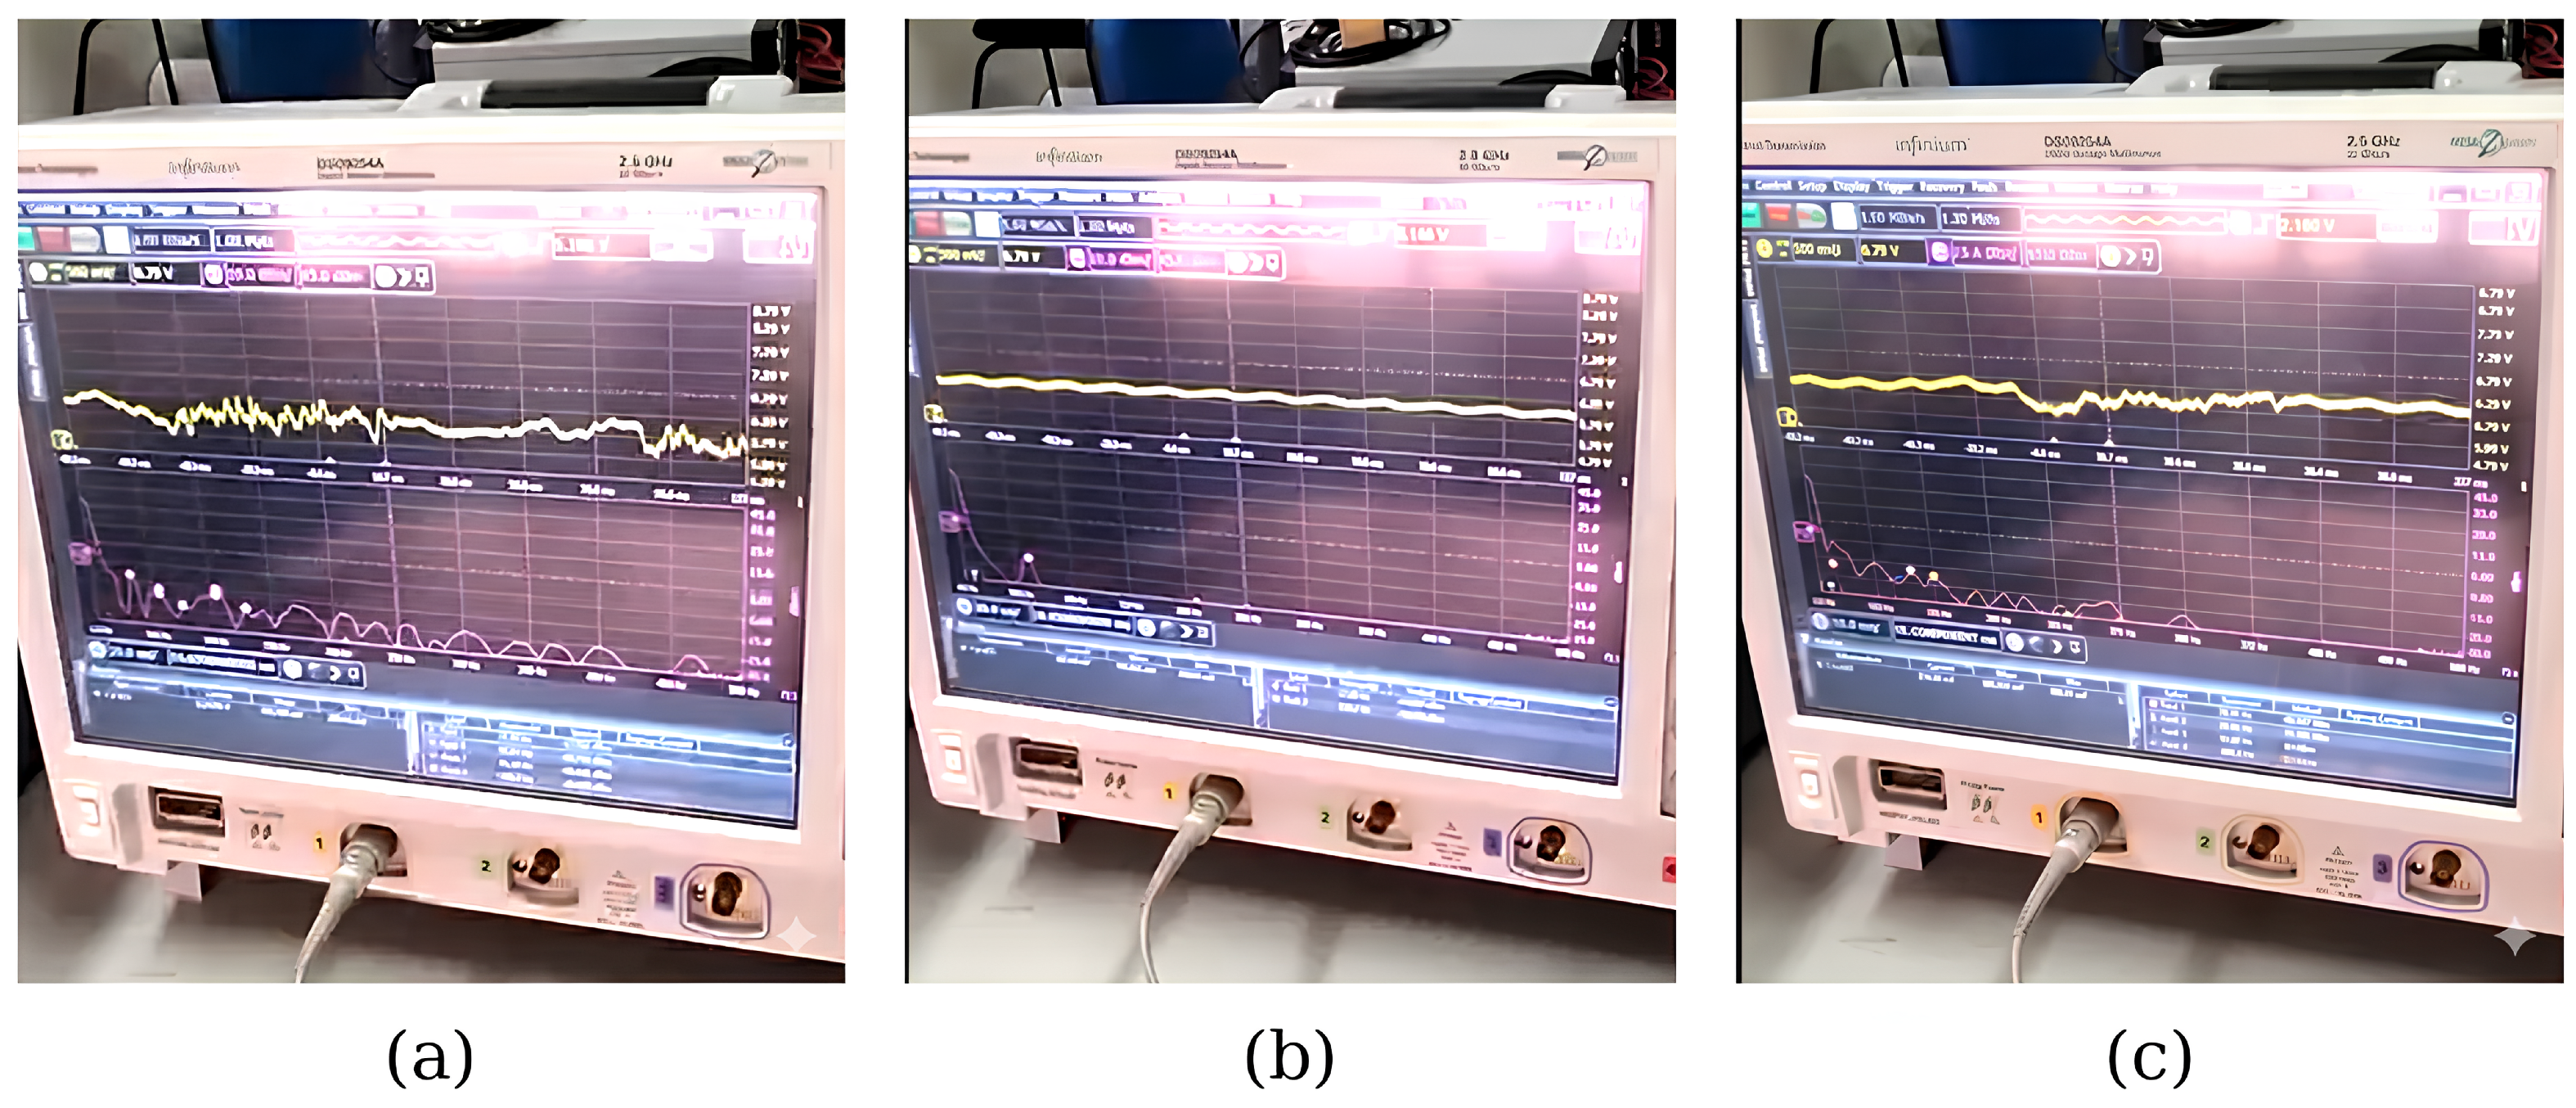
Figure 7a shows the electrical signal obtained by the photodiode when vibration is applied directly to the sensing optical fiber, without the use of sponges or any mechanical damping element. A significant variation in signal amplitude over time is observed, demonstrating the high sensitivity of the optical arrangement to mechanical disturbances. However, the signal exhibits strong instability, with irregular fluctuations and the absence of a well-defined periodic pattern, resulting from the micro-bends and deformations caused in the fiber during the test.
This behavior indicates that, although the absence of damping maximizes the optical response to vibrations, it also intensifies noise and compromises frequency repeatability. Thus, the direct application of vibration to the multimode fiber without mechanical decoupling elements results in a highly responsive signal, but one that is somewhat unstable for reliable field vibration detection.
4.2. Vibration with Multiple Sponge Layers Placed over the Sensing Fiber
To investigate how protective enclosures would affect sensitivity, successive layers of sponge material we placed on top of the fiber as shown in
Figure 6b. As expected, increasing the number of layers (up to ten) progressively attenuated the measured vibration responses. Oscilloscope measurements revealed a reduced signal amplitude proportional to the amount of sponge material, validating that protective housings must be designed to minimize excessive damping.
Figure 7b shows the electrical signal from the photodiode during the application of vibration to the optical sensor fiber when a sponge layer is positioned only over the fiber. It can be observed that the amplitude of the voltage variations is significantly reduced compared to the other configurations tested, indicating that the sponge acts more effectively as a mechanical damping element. As a consequence, the optical intensity coupled to the photodiode undergoes only small fluctuations over time, resulting in a predominantly stable signal.
Although this configuration provides high stability and low noise levels, the system’s response to vibration becomes less pronounced, evidencing a reduction in the sensor’s sensitivity. This suggests that the sponge layer applied only over the fiber absorbs a large part of the incident mechanical energy before the disturbance reaches the core of the multimode fiber, limiting the variation in modal coupling. Therefore, this arrangement exhibits excellent stability, but with a lower capacity for detecting small vibrations when compared to the other configurations evaluated.
4.3. Vibration with Sponge Layers Placed Above and Below the Sensing Fiber
In this scenario, equal numbers of sponge layers were placed above and below the fiber (five on each side):
Figure 6c. Interestingly, this configuration produced a higher variation in the detected voltage than placing the sponge only on top, indicating that symmetrical padding enhances the mechanical coupling between the vibration source and the multimode fiber. Signal measurements showed greater fluctuation and improved detectability of vibration events.
Figure 7c shows the electrical signal obtained by the photodiode when the optical sensor fiber is subjected to vibration while supported between layers of sponge positioned above and below the fiber. It can be observed that the amplitude of the voltage oscillations is lower than that recorded in the case without mechanical damping, showing that the sponge material acts as a partial dissipation element for the vibration. Even so, the signal maintains variations associated with the presence of vibration in the fiber, indicating that the optical response remains sensitive to external disturbances.
In addition to the amplitude reduction, a significant improvement in the temporal stability of the signal is noted, with fewer abrupt fluctuations and more uniform behavior over time. This suggests that the mechanical support provided by the sponge layers reduces the occurrence of micro-bends and random displacements in the multimode fiber, resulting in a more predictable and repeatable response. Therefore, this configuration represents a good compromise between sensitivity and stability for the application of the optical arrangement as a vibration sensor.
Across all test cases, the vibration generator was applied directly to the outer sponge layer, and the vibration intensity was progressively increased and decreased to observe the dynamic behavior of the SMS structure. These experiments validated that only the multimode section of the SMS loop responded to external vibrations, confirming that the single-mode fibers remained insensitive, as expected. The laboratory campaign culminated in a comparative analysis of all the tested setups, considering their sensitivity, stability, optical power levels, and component cost.
Finally, we included the laboratorial validation phase of the embedded acquisition system an Arduino Mega that was used to sample the photodetector output and transmit the data to MATLAB for real-time visualization, so that the system reliably captured the temporal variations induced during the vibration experiments. We also developed a dedicated mechanical support, later used in field trials, and tested to ensure fiber protection and preserve the maximum bending radius recommended for the multimode fiber (16–32 mm depending on exposure time).
Altogether, the laboratory tests established a solid foundation for the prototype, confirming the sensitivity of the SMS configuration, the stability of the selected optical components, the appropriate behavior of the embedded electronics, and the mechanical feasibility of integrating the fiber sensor into a railway environment.
5. Supervised Field Tests
We performed field trials on a functional LRV railway operated by local authorities, providing a realistic environment for system validation. In addition to tests with the light rail vehicle (LRV), a test was carried out using a maintenance train, besides tests were also performed with a freight train at two different speeds (5 km/h and 15 km/h), while maintaining the same load. The sensor was mounted on the rail using the previously developed mechanical support and secured with metal clamps. Fiber routing was managed to minimize stress and preserve optical integrity.
The sensing structure consisted of an SMF–MMF–SMF configuration with a 30 cm multimode Section (105 µm core diameter) spliced between standard single-mode fibers (8.2 µm core). The SMF link length between the sensing head and data aquisition unit was approximately 650 m, in this way, the system detected rail vibration at a distance of 650 m, therefore a minimum range of 650 m was validated.
Data collection occurred during multiple LRV passages, with signal acquisition performed using the embedded system and logged in MATLAB. Each train passage produced distinct signal signatures, allowing clear identification of the event, therefore visual observations, repeat tests and analysis of acquired data ensured data reliability. The operating principle of this sensor, as explained in previous sections, is based on the detection of multimodal interference in an SMS-type fiber optic configuration. The passage of the train introduces mechanical vibrations into the system, which manifest as disturbances in the optical signal. These disturbances are observed as a significant increase in signal variability.
To explore this behavior during field tests, we developed a simple and adaptive algorithm based on statistical signal analysis, in which the central parameter used is the variance, which is directly related to the signal energy; therefore, when the train passes, the vibration causes an abrupt increase in this variance, allowing for clear identification of the event.
An important aspect we observed experimentally is that the average signal level does not remain constant over time. Even in the absence of events, this level can oscillate naturally and, after the train passes, does not always return exactly to the initial value, possibly due to small mechanical deformations, micro-curvatures in the fiber, or rearrangements in the system connectors. For this reason, the algorithm is not based on a fixed absolute threshold.
Our strategy was to ignore the absolute value of the average level and analyze only the signal variation, that is, its rate of change and statistical dispersion within a time interval, in this way, the algorithm becomes robust to level drift and independent of slow shifts in the background signal.
The processing is performed using a sliding time window, composed of a fixed number of samples. Initially, the system collects a set of points corresponding to the size of the window. With each new sample acquired, the oldest point is discarded, keeping the window always updated. Within this window, the variance and a reference average value are continuously calculated.
When the difference between the instantaneous variance and the reference average value exceeds a certain proportional threshold, the algorithm identifies the occurrence of a train passing event. While the disturbance persists, the average level is dynamically updated, allowing the system to track the signal stabilization after the event.
This approach avoids the need for frequent calibration and makes the system capable of operating under different noise conditions, vibration intensity, and signal levels. The same algorithm has proven to work for vehicles with different masses, such as freight trains and maintenance vehicles, indicating that the detection is not very sensitive to weight variations, as long as the vibration generated is sufficient to alter the signal variance.
The development and validation of the algorithm were initially carried out in a MATLAB environment, used for detailed signal analysis and visualization of results. After validating the mathematical logic, the code was ported to an Arduino microcontroller, allowing real-time processing and direct signaling of the detection via Human Machine Interfaces, such as LEDs or Displays. The difference between the implementations lies essentially in the syntax, since the processing logic is the same in both.
Finally, the developed algorithm can be interpreted as an adaptation of classical voice activity detection (VAD) techniques, widely used in communication systems. Just as human speech introduces a significant increase in variance relative to background noise, the passage of the train generates a statistically detectable disturbance in the optical signal. This analogy provides a solid theoretical foundation and can be explored to strengthen the methodological basis of the work.
To validate the operation of the proposed optical sensor under real-world conditions, we perform tests with light rail vehicles, maintenance vehicles and freight vehicles with the objective of assessing its robustness, accuracy, and stability. These experiments were essential for verifying the system’s ability to detect environmental disturbances, particularly those induced by the passage of a light rail vehicle (LRV), and for identifying areas for design and algorithmic improvements.
5.1. Signal-Based Adaptive Detection Algorithm for Train Passage Events
The detection of train passages is performed using a simple and adaptive algorithm grounded in the statistical analysis of the vibration signal measured by the sensor. The central parameter used in the processing chain is the signal variance, which reflects the energy level of the measured vibrations. Under normal operating conditions, when no train is present, the vibration signal contains only background noise and low-amplitude mechanical oscillations, resulting in a low variance level. However, the passage of a train generates strong mechanical excitation in the track structure, significantly increasing the amplitude and energy of the recorded signal. This change manifests statistically as an abrupt rise in signal variance, enabling reliable event detection.
5.1.1. Variance as an Energy-Related Measure
Let
denote the discrete-time vibration signal, acquired continuously at the sensor. For each time instant, the signal is analysed within a sliding window of N samples:
The arithmetic mean of the samples in the window is computed as:
When the signal is approximately zero-mean (or detrended), becomes proportional to the average signal energy, meaning that higher-energy vibrations produce larger variance values. Therefore, monitoring the time evolution of provides an indirect yet robust indicator of vibration intensity.
5.1.2. Adaptive Background Estimation
To ensure robustness to slow changes in environmental or structural conditions, the algorithm maintains a continuously updated estimate of the baseline variance associated with the noise floor. This background level, denoted as
, is updated through an exponential moving average:
where
is the variance computed for the
window, and
is a smoothing parameter that controls the adaptation speed. Importantly, this update is performed only when no event is detected, preventing the baseline from being biased upward during train passages.
5.1.3. Event Detection Logic
The algorithm classifies a train passage event whenever the instantaneous variance significantly exceeds the adaptive background level. This is expressed mathematically by the threshold condition:
where
is a fixed safety margin introduced to minimise false detections due to random fluctuations or transient disturbances.
When the inequality is satisfied, the system flags the beginning of a train passage event. The event remains active as long as the variance continues to exceed the adaptive threshold. Once the variance falls back to levels comparable to the background variance, the algorithm registers the end of the event and resumes normal monitoring.
5.1.4. Practical Interpretation
In physical terms, the variance behaves as a proxy for vibration energy. During normal conditions, this value remains low and stable. As a train approaches and interacts mechanically with the track, the amplitude of measured vibrations increases sharply, leading to a corresponding abrupt rise in variance. This sudden divergence from the background variance produces a clear and reliable detection signature.
5.1.5. Advantages of the Method
This detection strategy is characterised by its computational simplicity, since it relies only on basic arithmetic operations and can therefore be easily implemented on embedded hardware platforms; its adaptivity, as the reference noise level is continuously updated to account for slow changes in operating conditions; and its robustness, because detection is based on statistical energy rather than waveform shape, which makes the method tolerant to noise and environmental variability.
5.2. Field Test with Light Rail Vehicles (LRV)
A supervised field test was conducted with a light rail vehicle (LRV) to validate the sensing architecture and evaluate the real-world performance of the proposed detection system. The experimental setup employed a single-mode drop cable with a total deployed length of 350 m to 650 m, containing four fibers of equal length, providing a validated range between 350 and 650 m for this sensor. Two fibers were used for optical transmission and reception, while the remaining two fibers were reserved as spare channels. With the bidirectional optical path, the total loop length reached approximately 1300 m, excluding the short sensing multimode fiber segment (≈30 cm) attached directly to the rail. During installation, approximately 5 m of the drop cable were uncoiled to accommodate the fiber spool within a vehicle, allowing the electronic acquisition system and notebook computer to be placed inside the cabin for operational convenience. The optical source consisted of a fiber-coupled laser module operating at 1550 nm, delivering a stable output power of approximately 11 mW throughout the test period. The optical signal traveled through the transmitting single-mode fiber, SC/UPC connector transitions, and the sensing multimode fiber with a 105-µm core diameter mounted on the rail shoe.
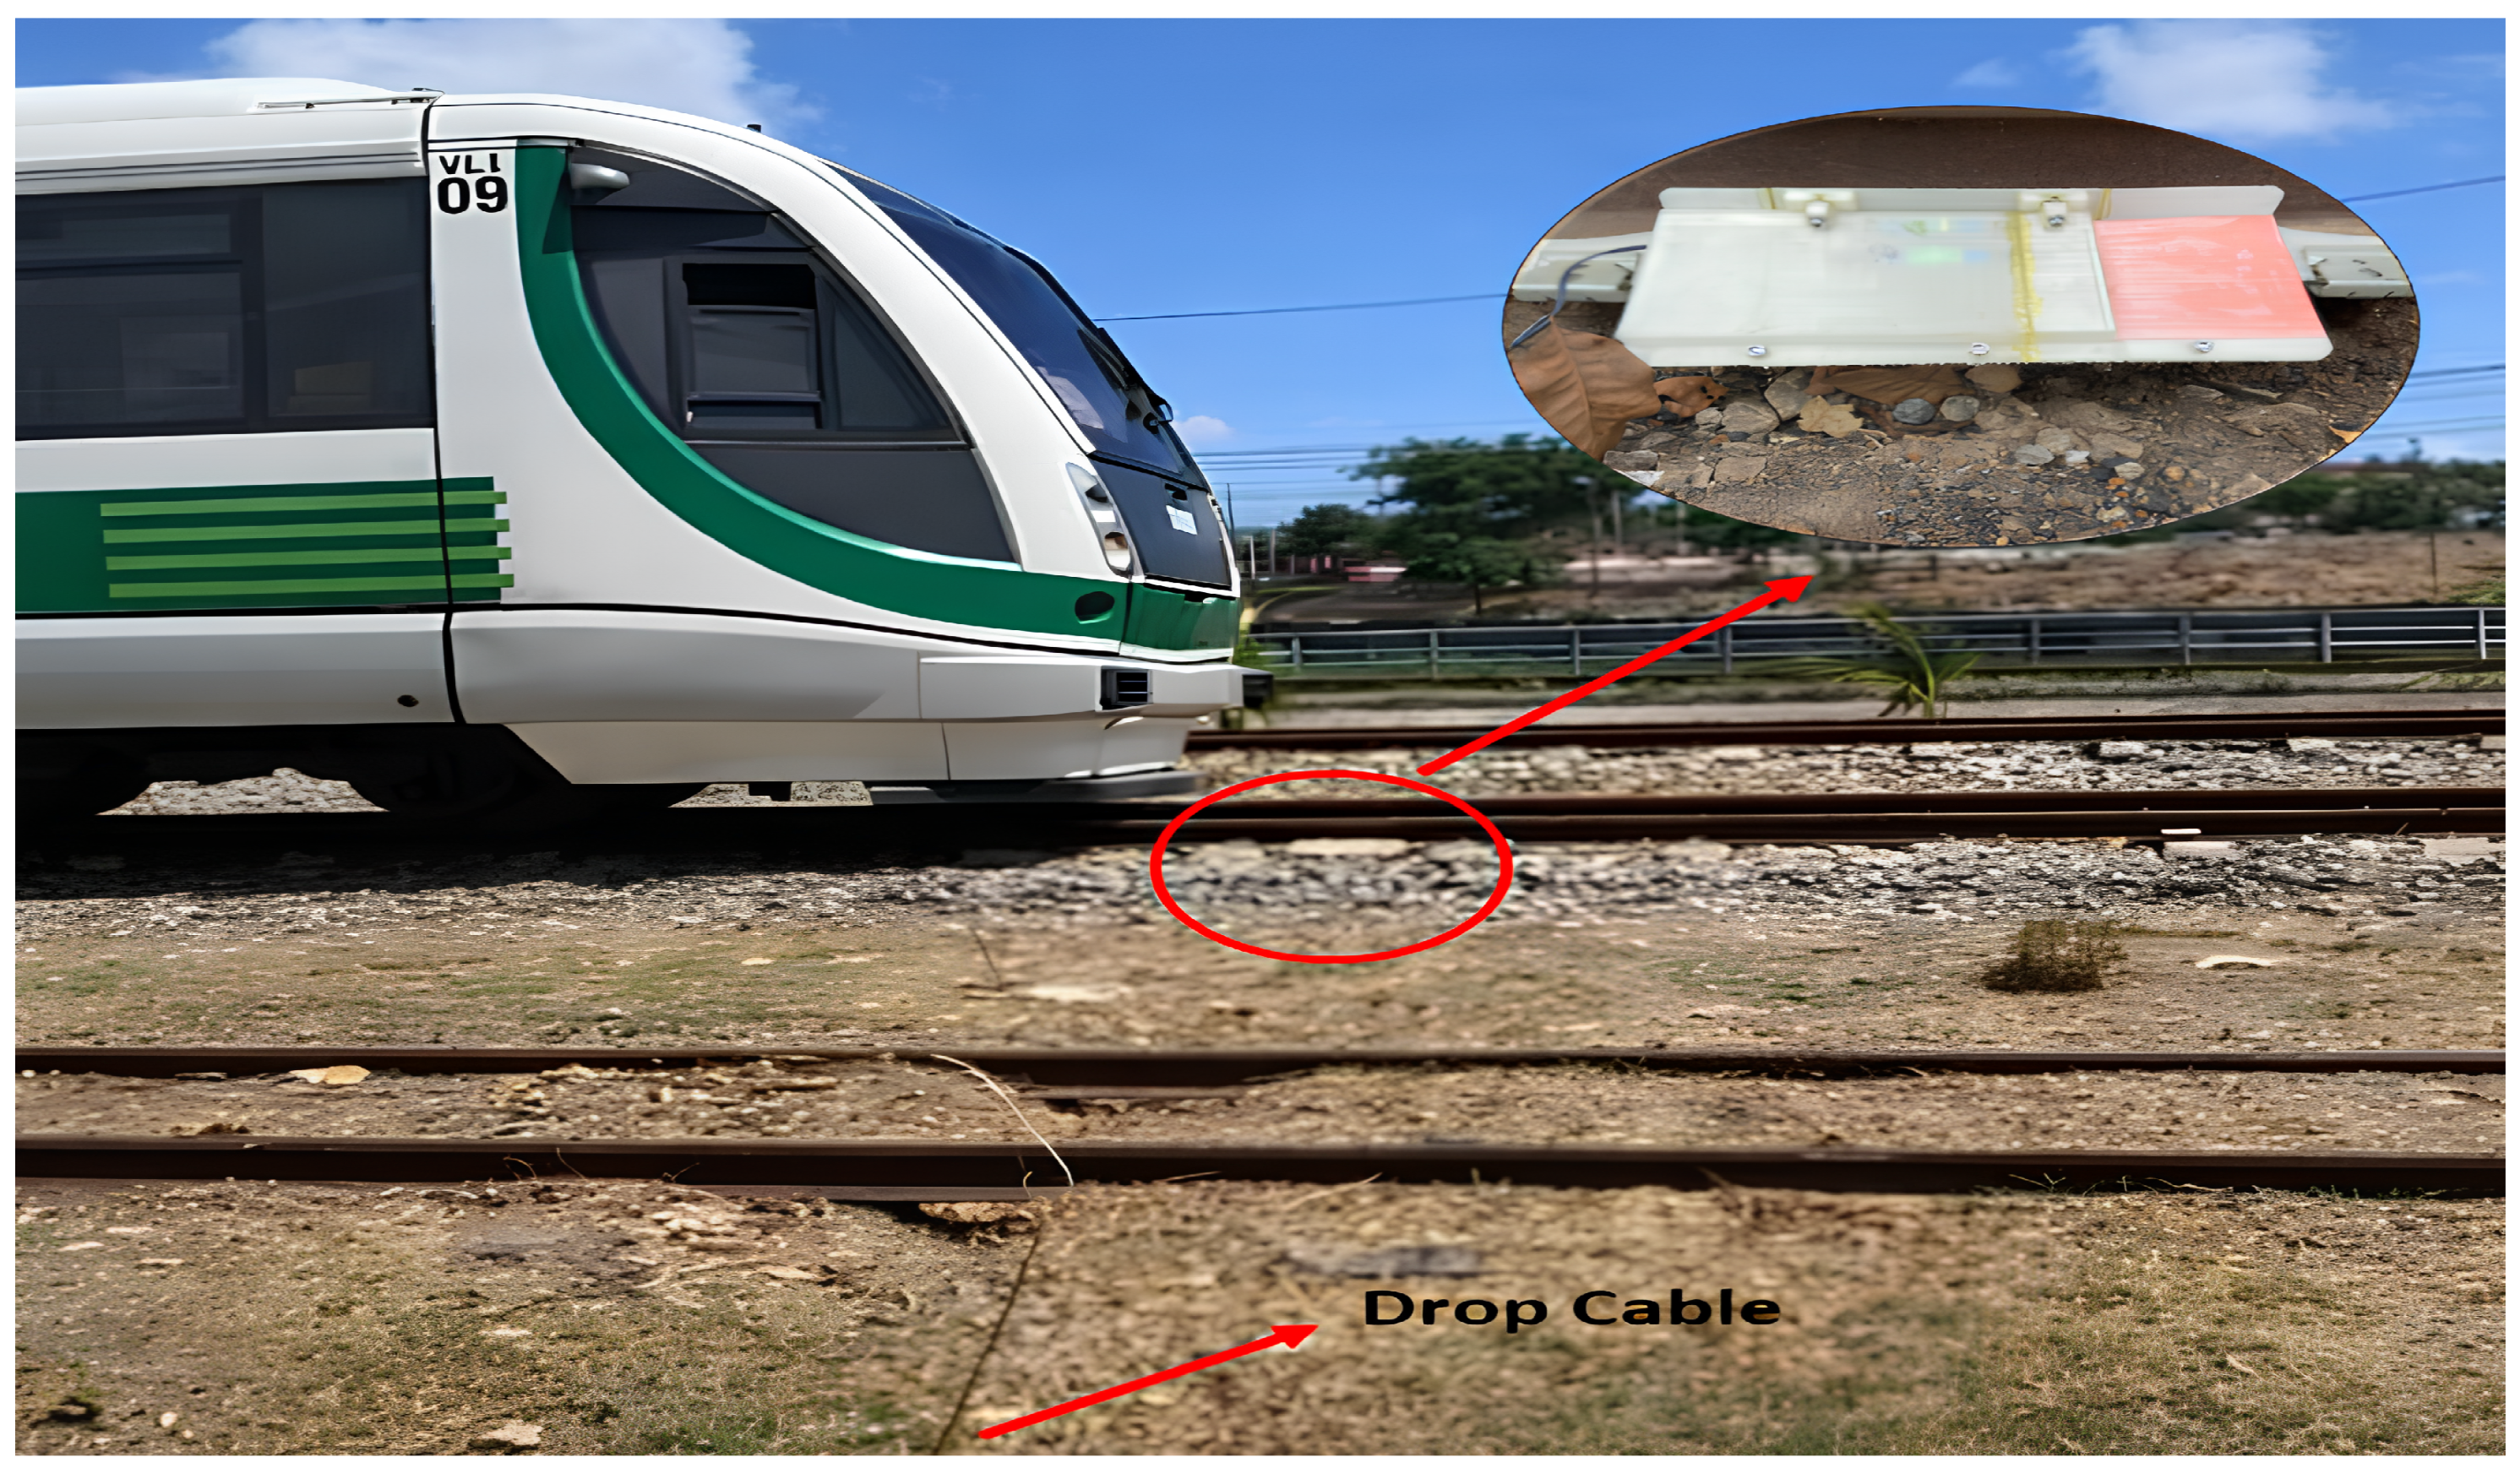
Figure 8 presents the light rail vehicle approaching the sensing area during the field test, at which time the drop cable connected to the sensor, itself attached to the rail, transmitted the information to the onboard system, enabling real-time visualization of the sensor signal during the train passage.
A mechanical support structure was designed to securely couple the multimode fiber to the rail using a compliant sponge interface, improving mechanical contact and energy transfer from rail vibrations. The passage of the LRV induced multimode interference (MMI) variations in the sensing fiber, which modulated the transmitted optical intensity.
Figure 9 illustrates the mechanical prototype installed on the rail, highlighting the support structure that ensured stable coupling between the sensing fiber and the rail surface.
The optical signal at the output was detected using a photodiode, converting optical intensity fluctuations into electrical signals. These signals were fed into an Arduino Mega microcontroller, which transmitted the acquired data in real time to a MATLAB environment for visualization and processing. The MATLAB interface displayed the temporal evolution of the signal, providing clear insight into dynamic vibration events associated with the LRV passage. Despite minor attenuation attributed to cable handling and field deployment, the system maintained sufficient optical power and sensitivity to resolve vibration-induced signal variations. Recorded electrical output levels at the Arduino input typically remained below 500 mV; however, the modulation associated with the rail vibration during LRV transit was clearly distinguishable from the background noise level, confirming the operational viability of the sensing approach.
The field deployment also highlighted practical engineering considerations related to mechanical integrity and protection of the sensing assembly. The support structure was optimized to improve geometric conformity to the rail and enhance mechanical stability under repeated train passages. The compact electronic module, comprising the photodiode, laser source, Arduino interface, optical connectors and USB communication link, was housed inside a dedicated enclosure positioned within the vehicle to facilitate continuous monitoring. Observations during testing identified opportunities for refinement, particularly with respect to cable fixation and ensuring the protection of spare fibers inside the mechanical support, given the intrinsic rigidity of the drop cable and the risk of exposing unprotected during sections handling and vibration loading. Overall, the supervised field test successfully validated the sensing principle, optical configuration, and real-time data acquisition chain under operational LRV conditions, demonstrating the capability of the system to detect vibration events associated with train passage in a real railway environment.
5.3. Field Test with Freight Train
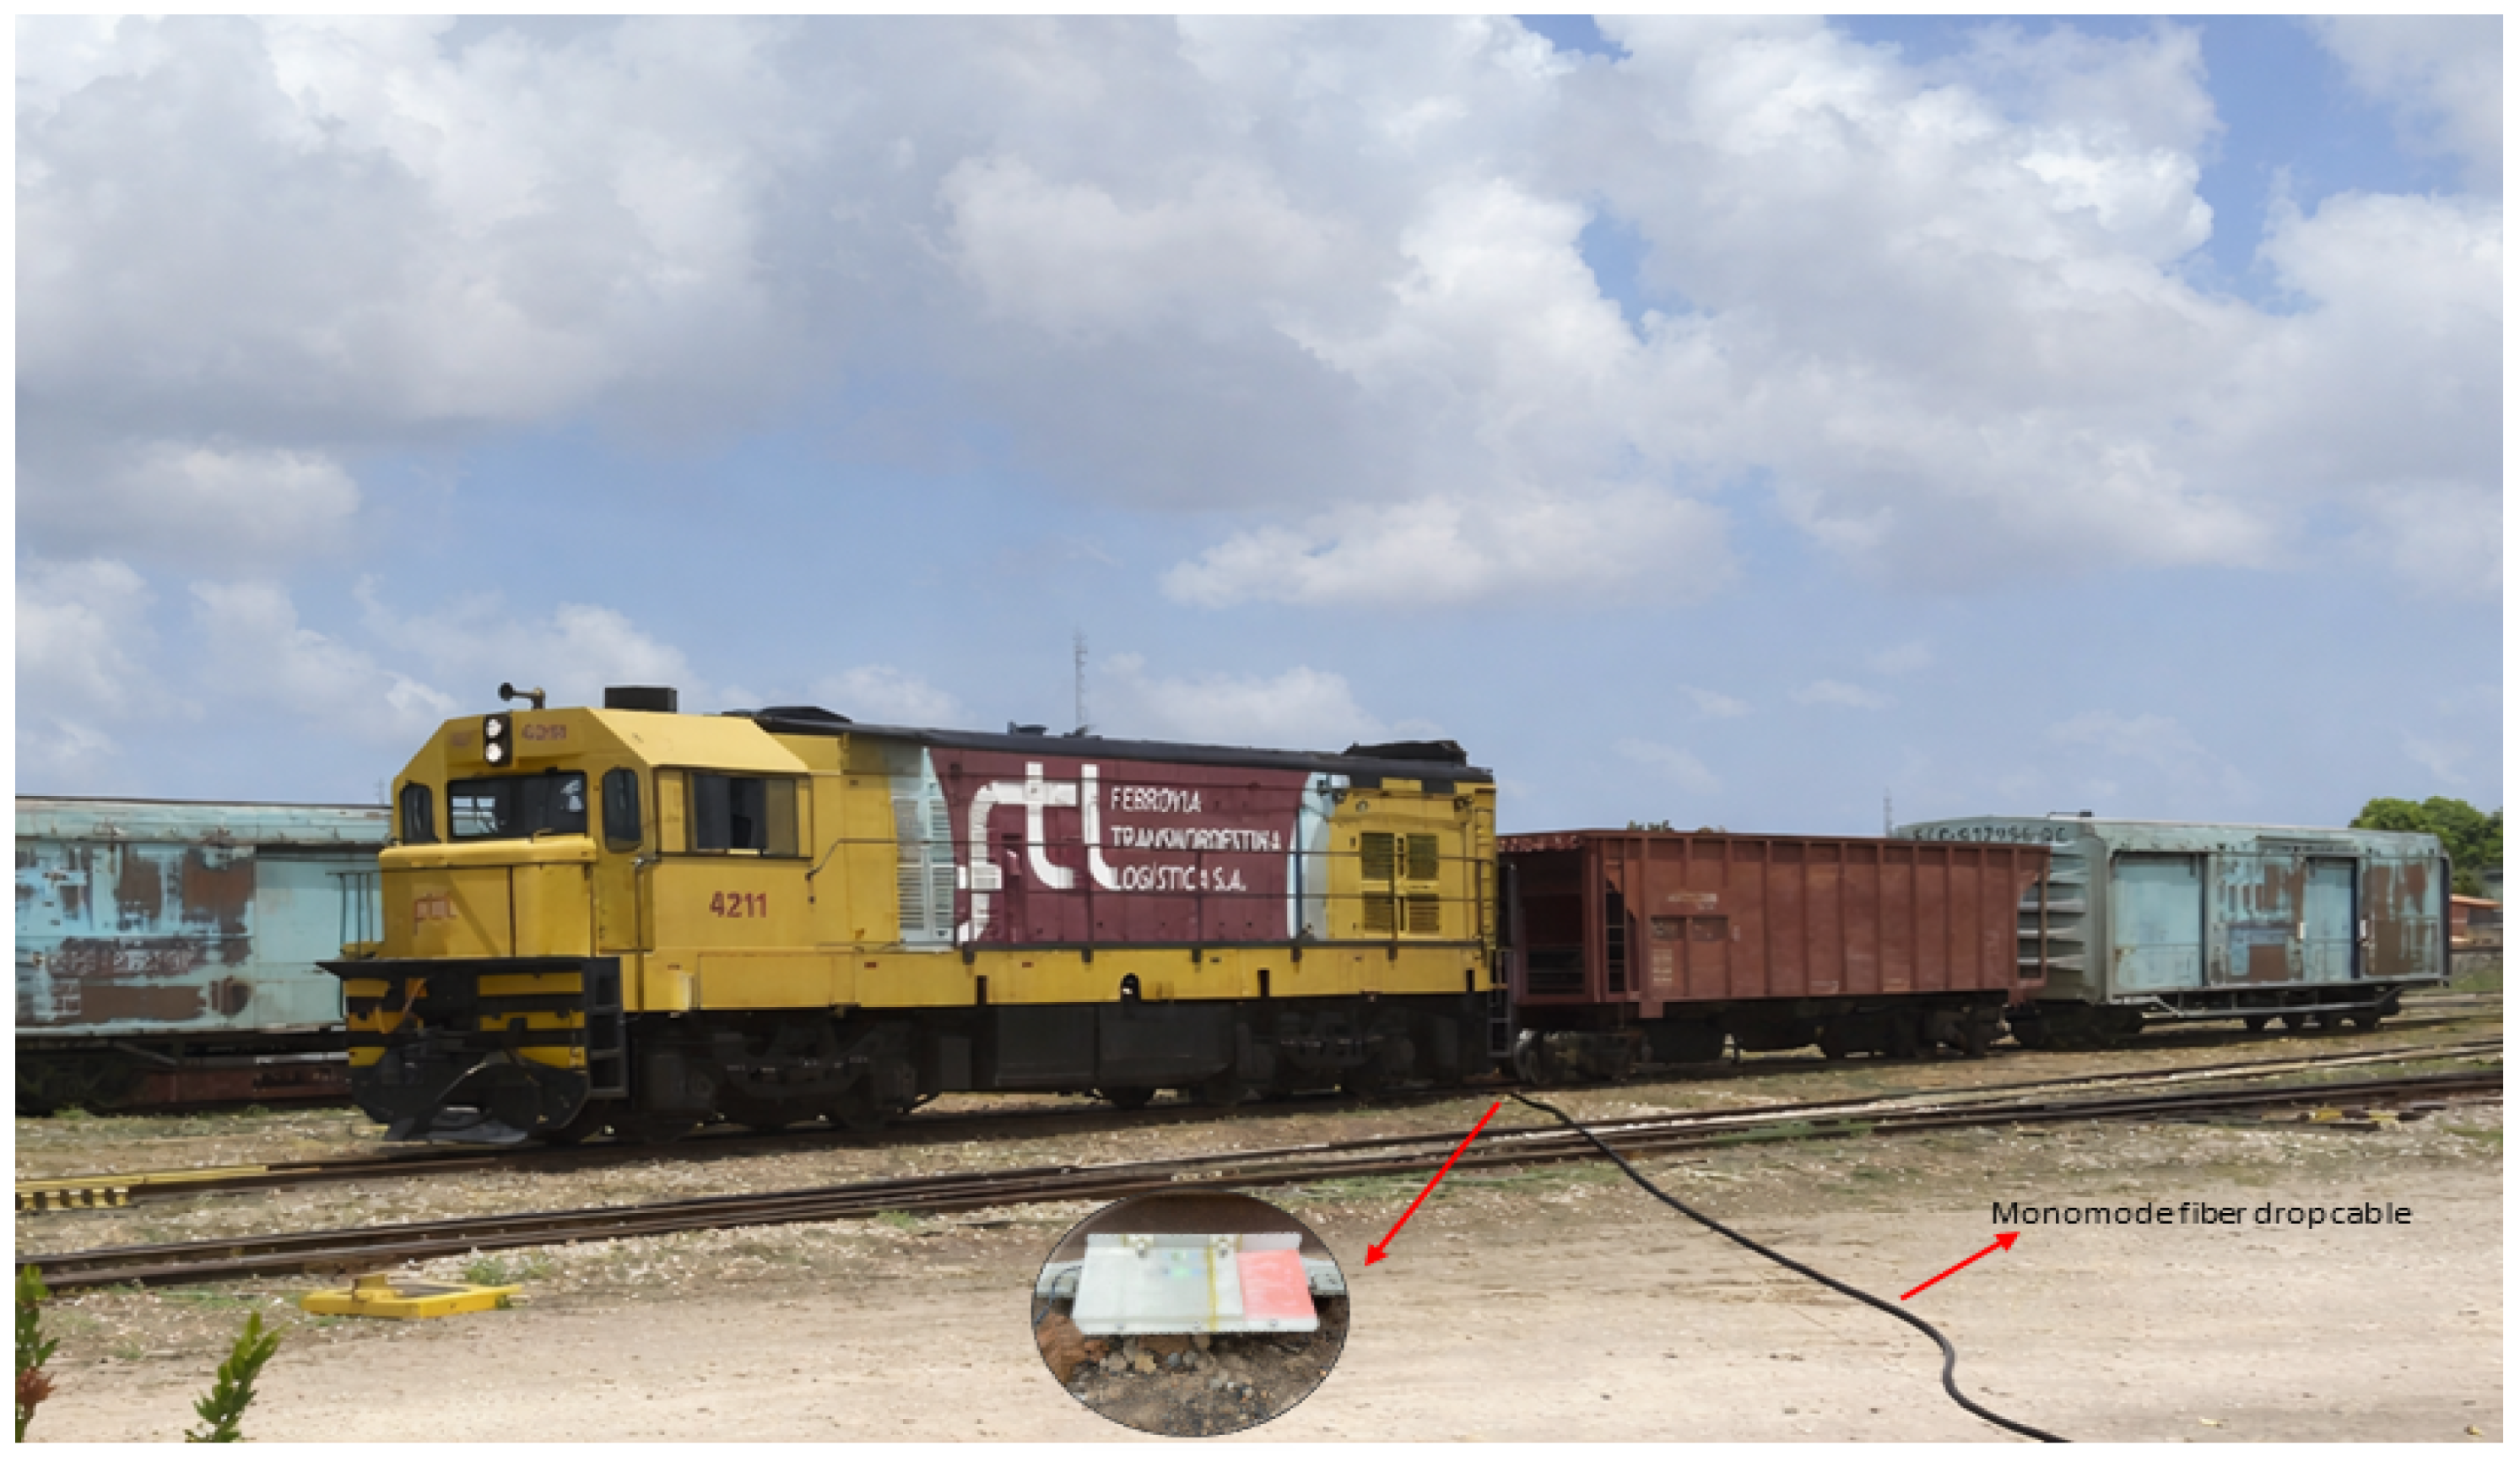
We also conducted field tests in a controlled environment using a freight train,
Figure 10, composed of three distinct sections: a locomotive and two freight wagons each characterized by different mass properties. The locomotive led the train set with a load of approximately 80 tons. It was followed by a red freight wagon with a mass of 16.85 tons and, subsequently, a blue freight wagon with a mass of 20 tons. We installed the sensing fiber directly on the railway rail using a dedicated support to ensure stable mechanical coupling and efficient transfer of strain and vibration induced by the train passage. The sensor was connected to the data acquisition system via a drop cable, providing a reliable and flexible link between the track-mounted fiber and the electronic processing unit as shown in
Figure 10.
During the experimental campaign, we operated the train at two distinct velocities: a low-speed regime of 5 km/h and a higher speed of 15 km/h. These operating conditions were selected to assess the system response under slow and moderate motion scenarios, which are representative of typical operational conditions at railway crossings and in controlled transit zones.
In the current test setup, we employed three optical loops installed along the railway track. Two of these loops were connected to a dedicated data acquisition circuit designed to simulate the operation of a railway crossing barrier system. When the presence of the vehicle over the track was detected, the system activated visual indicators in the form of LEDs, which remained on during the vehicle passage and were switched off after its departure. The electronic circuit and the embedded processing unit responsible for signal acquisition and actuation were housed in a protective enclosure positioned near the track discussed in previous sections.
5.4. Field Test with Maintenance Train
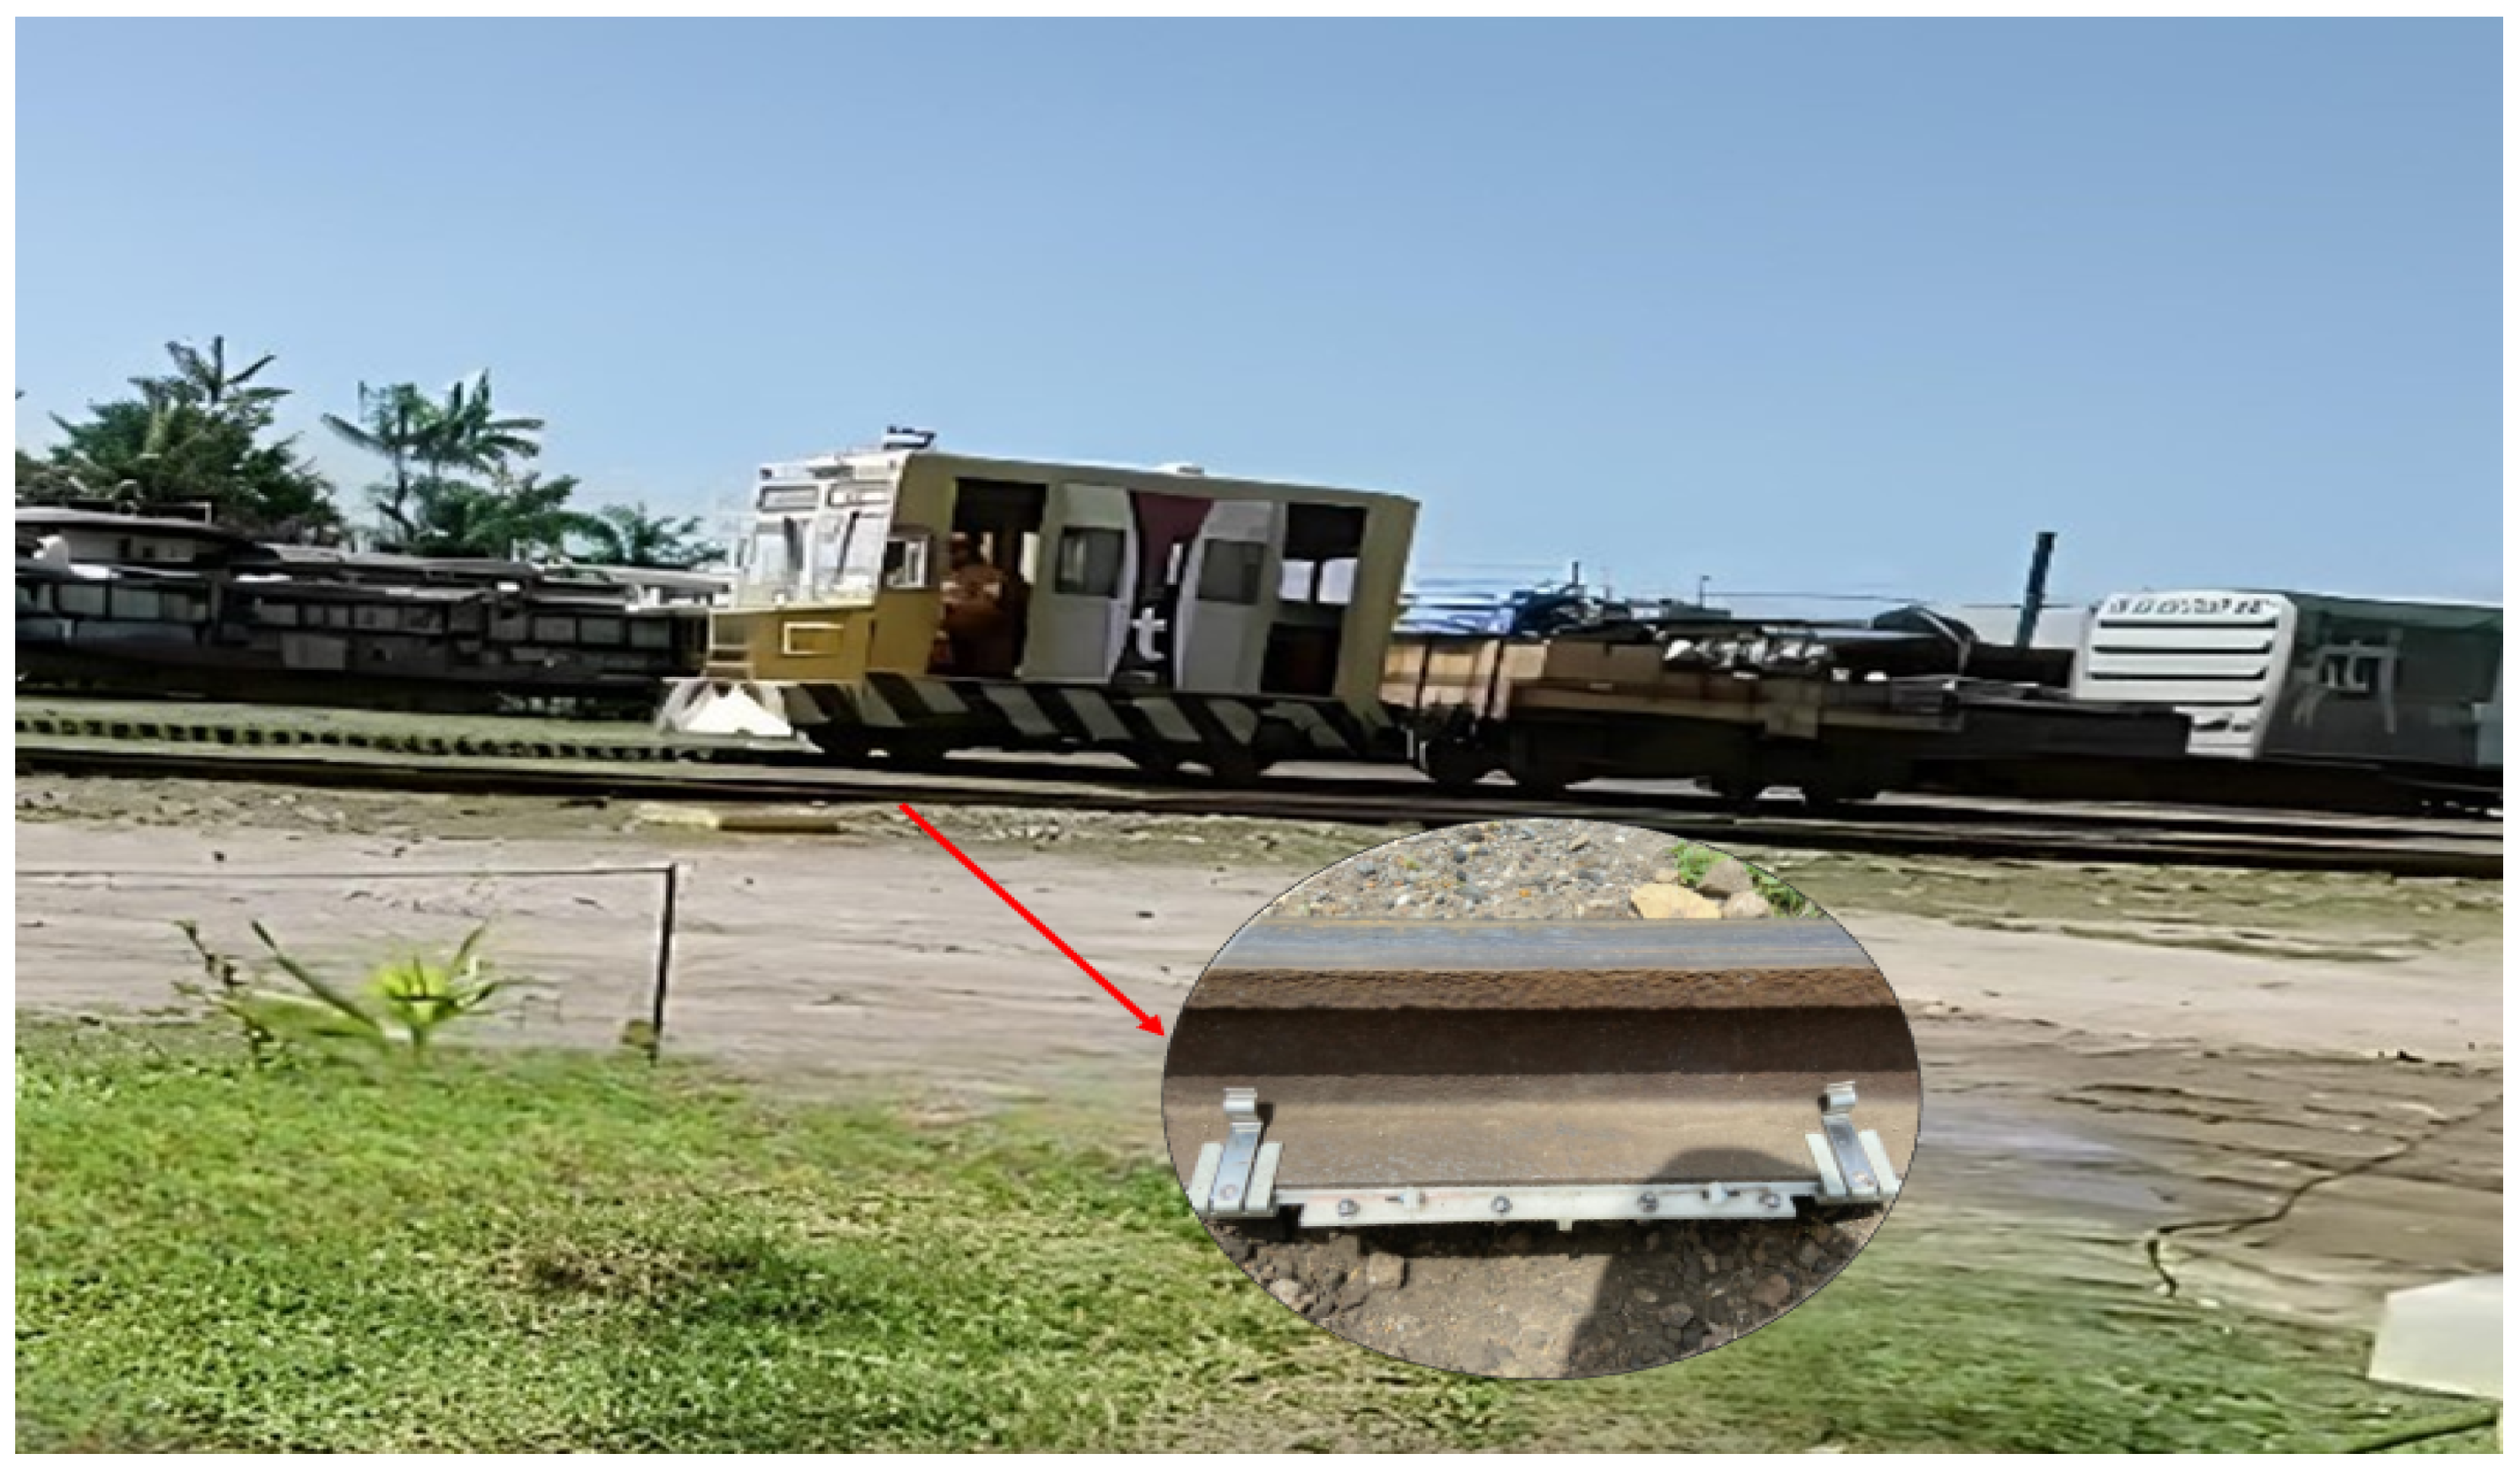
A field test was also conducted using a maintenance train, which is notably lighter than both the freight train previously tested and the light rail vehicle (LRV). In this experiment, we employed the same SMS optical loops and the same data acquisition system used in the freight train tests, ensuring consistency in the measurement conditions, the maintenance train is properly represented in the
Figure 11. The primary objective of this test was to evaluate the vibration signal generated by different railway vehicles, with particular emphasis on variations in signal energy associated with vehicle mass and dynamic behavior. By comparing the measured responses from the maintenance train, the freight train, and the LRV, we aimed to validate the sensor’s capability to reliably detect distinct classes of railway vehicles. The results demonstrate the robustness of the proposed sensing system and indicate its potential for future applications in vehicle-type identification based solely on the measured vibration signatures.
6. Results and Discussion
6.1. Results of Field Test with Light Rail Vehicles (LRV)
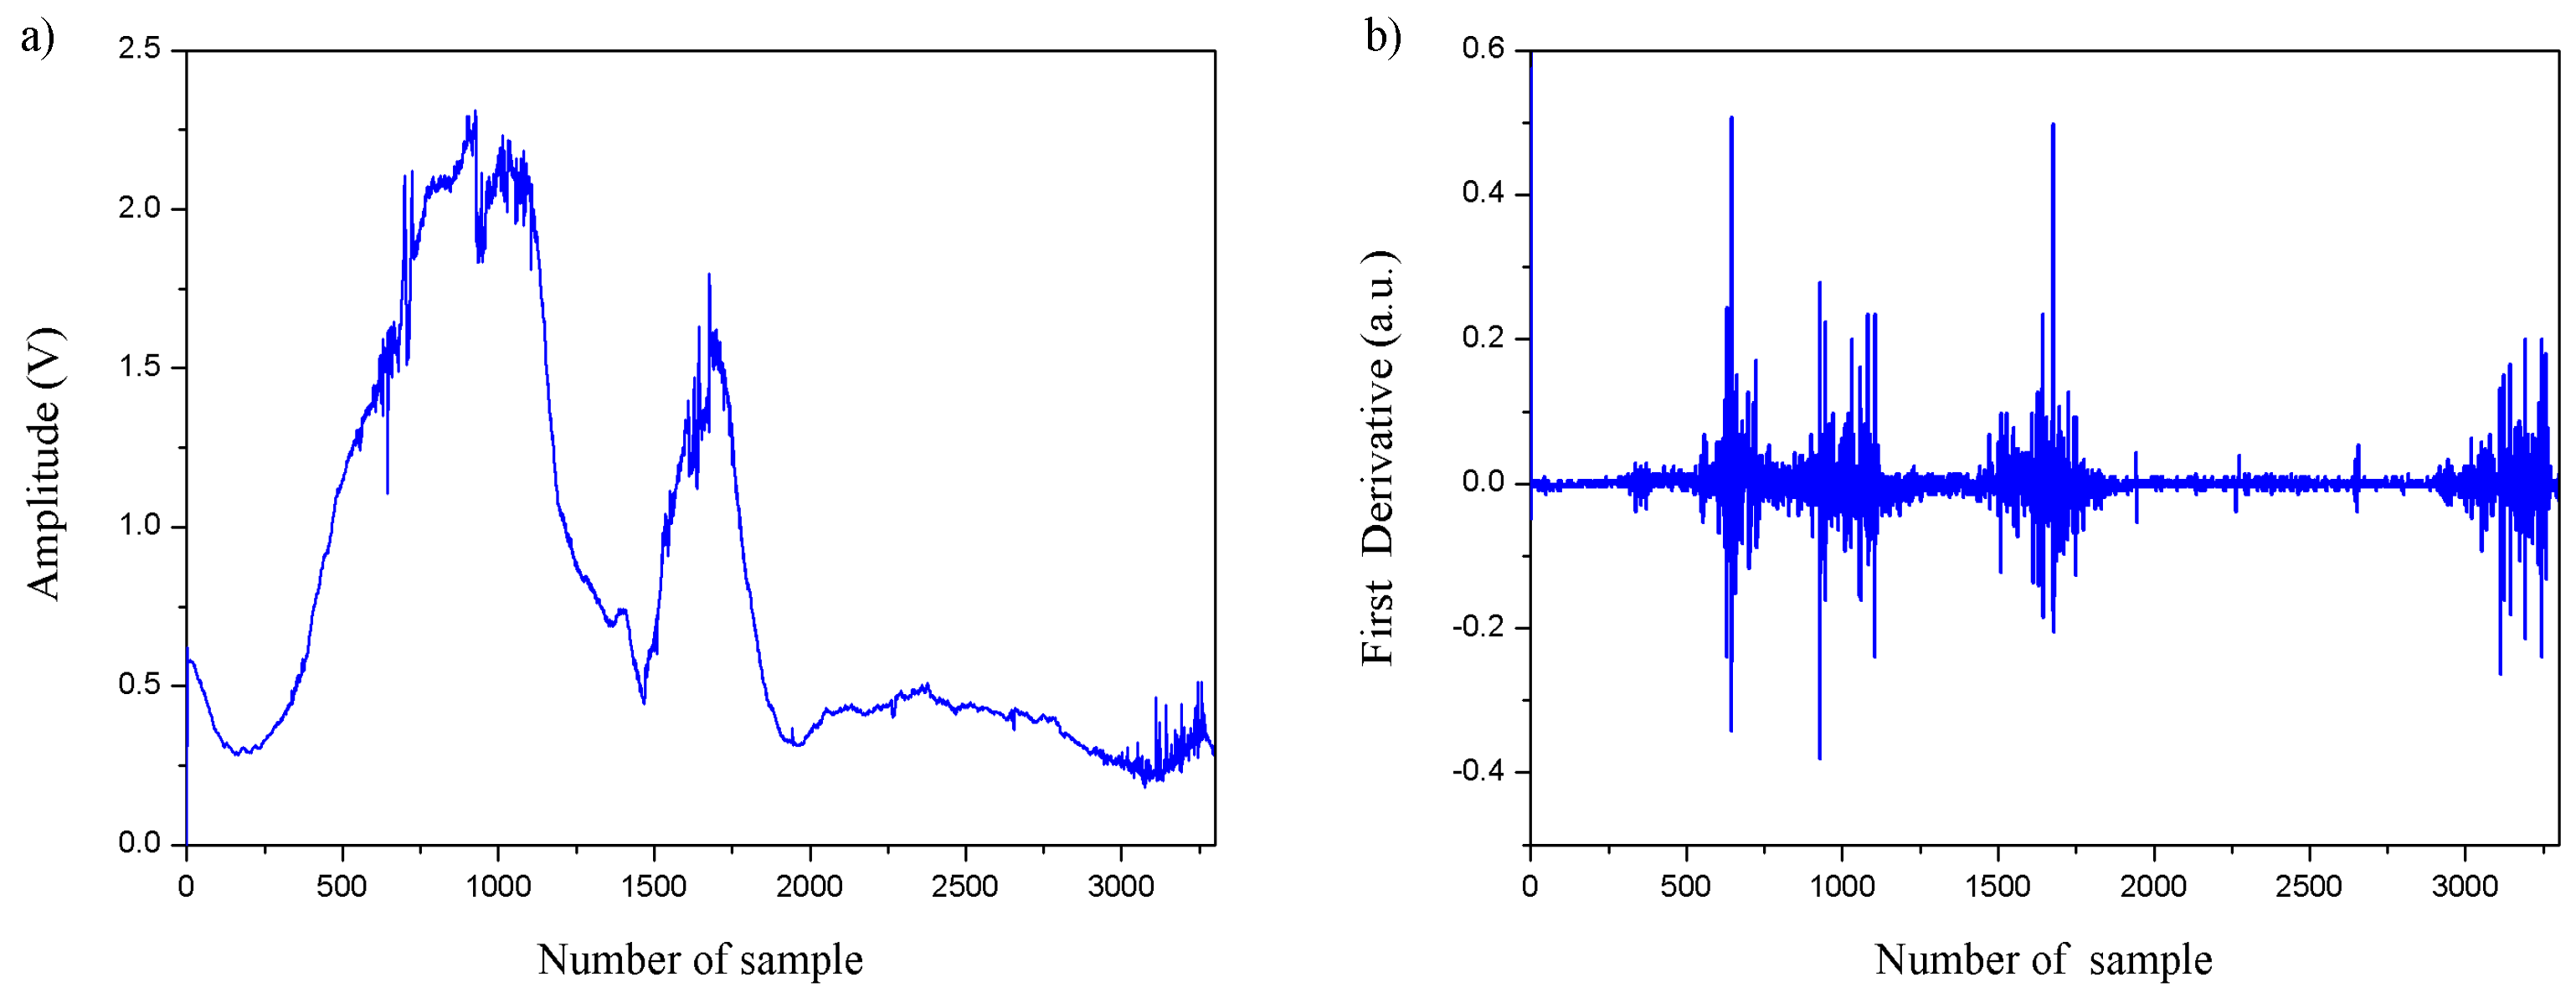
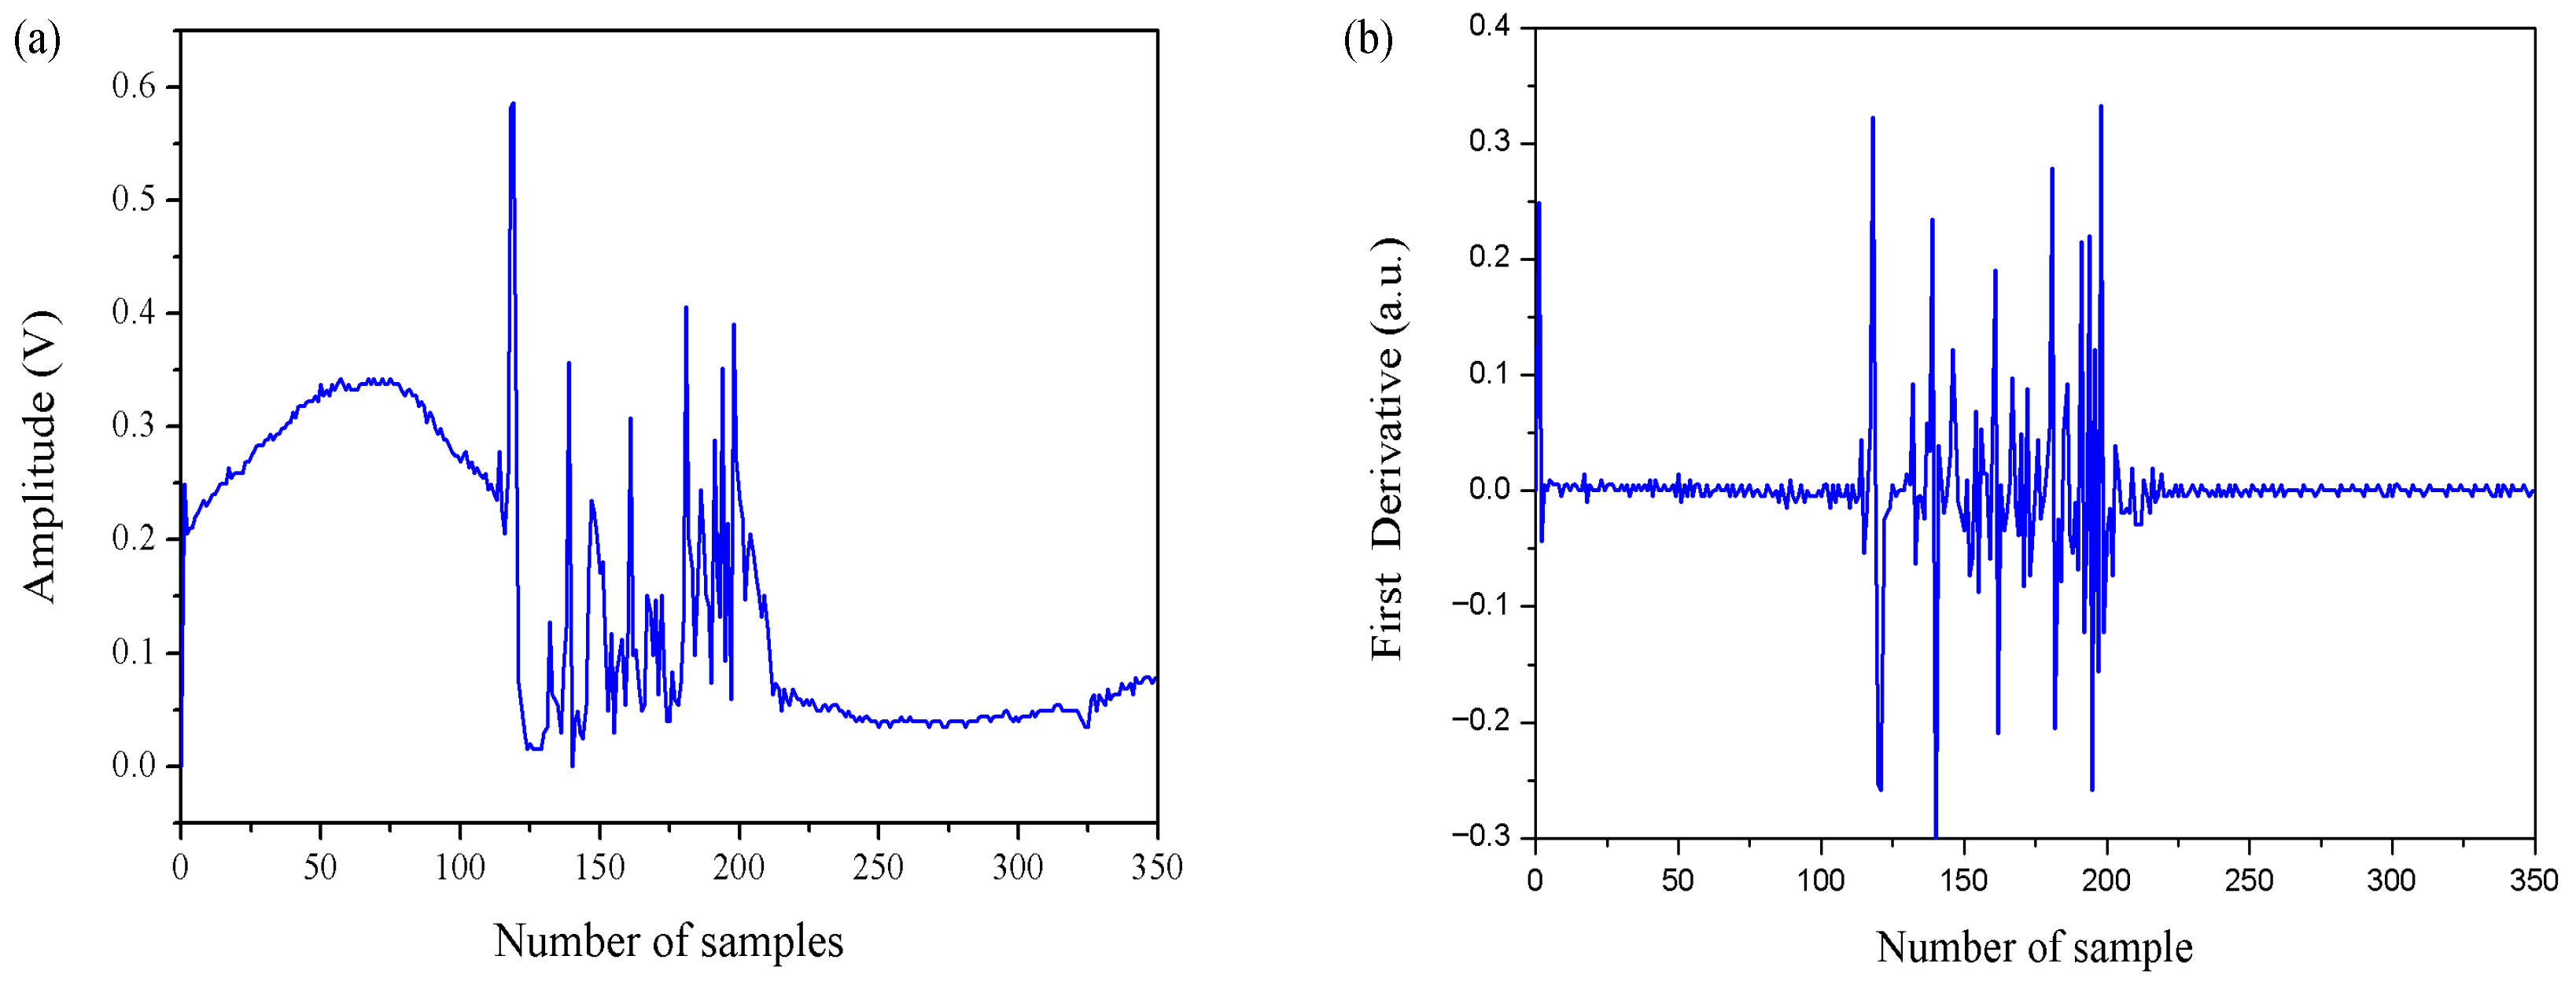
Figure 12a shows the evolution of the electrical voltage measured by the onboard data acquisition system as a function of the number of acquired samples during the first passage of a light rail vehicle (LRV) through the sensing region. In the initial sample range, corresponding to the background condition before the vehicle enters the monitored section, the signal exhibits a relatively smooth behavior with low variability.
As the LRV approaches and reaches the sensing region, a marked change in the signal profile is observed, characterized by a strong increase in amplitude fluctuations and the appearance of pronounced voltage peaks across successive samples. These abrupt variations result from mechanical vibrations induced in the rail by the wheel–rail interaction, which directly affect the multimodal interference in the SMS fiber configuration. After the vehicle leaves the sensing region, the signal amplitude decreases and gradually stabilizes over subsequent samples, reaching a new baseline level that does not necessarily coincide with the initial average value. This residual offset is consistent with experimentally observed effects such as transient mechanical deformation, micro-bending of the fiber, and minor rearrangements of optical connectors following the dynamic event.
Figure 12b presents the first derivative of the same signal, also expressed as a function of the number of samples, to emphasize rapid variations associated with the train passage. During the rest period, the derivative remains close to zero, indicating minimal sample-to-sample variation. In contrast, during the interval corresponding to the LRV passage, the derivative exhibits large positive and negative excursions, reflecting abrupt changes in signal amplitude between consecutive samples due to intense rail vibrations.
Once the vehicle exits the sensing region, the derivative rapidly returns to values near zero, confirming the attenuation of dynamic disturbances. This derivative-based analysis highlights the transient and sample-dependent nature of the event and supports the use of variation-driven metrics, such as variance or rate of change across samples, rather than absolute signal levels, for robust detection under real field conditions.
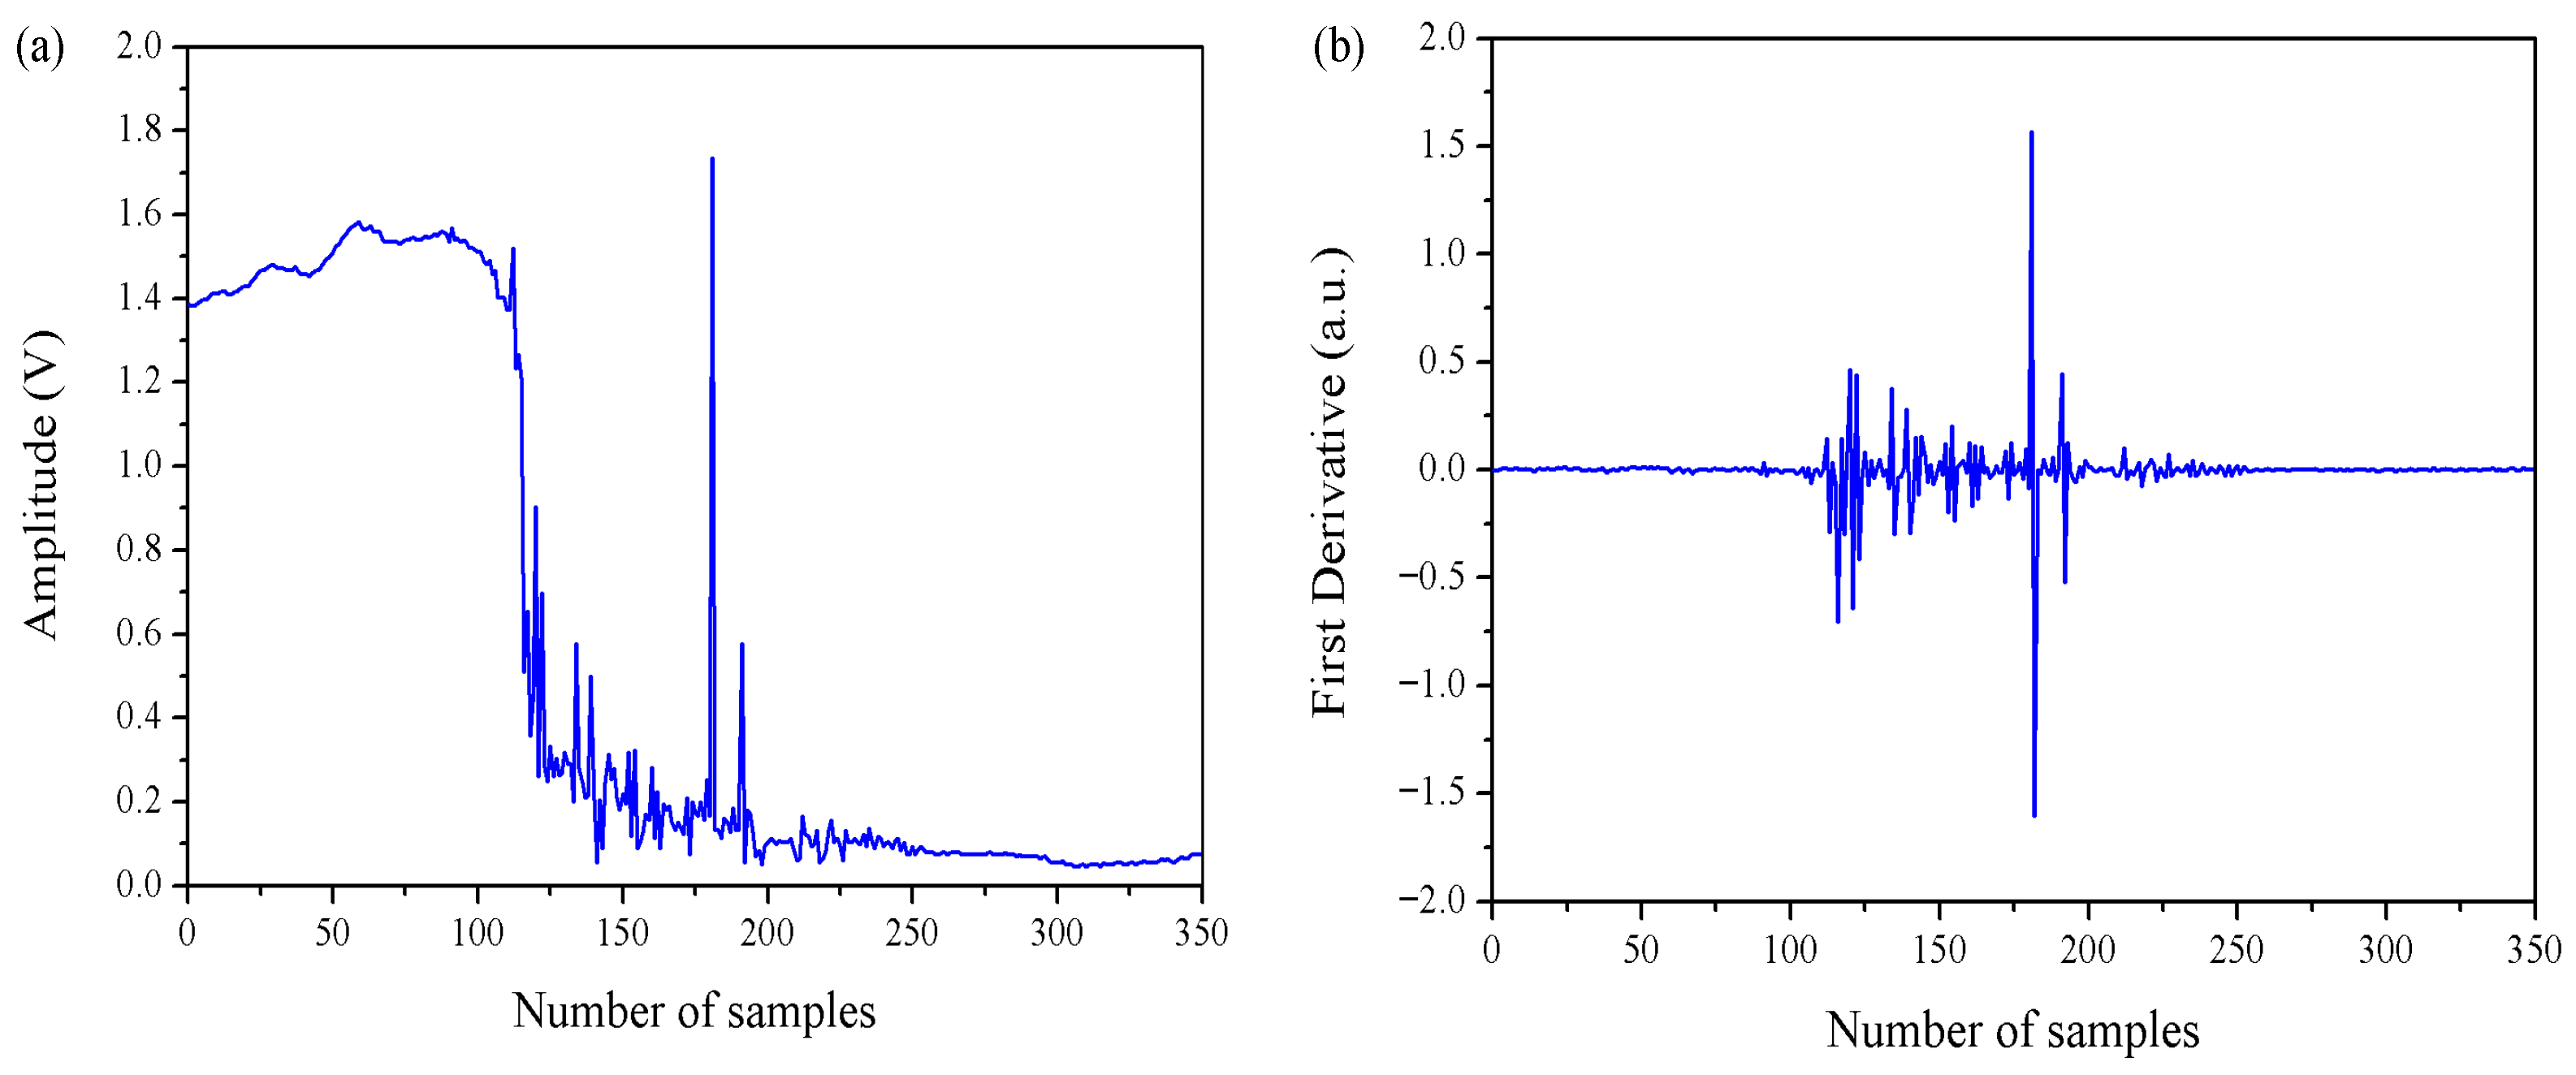
Figure 13a illustrates the evolution of the electrical voltage measured by the onboard data acquisition system as a function of the number of samples during the second passage of the light rail vehicle (LRV), which occurred approximately 40 min after the first event under normal operating conditions. In the initial portion of the signal, corresponding to background conditions, the voltage level is noticeably higher than that observed in the first passage and exhibits slow sample-to-sample fluctuations. This difference in baseline amplitude reflects the non-stationary nature of the system, which may be influenced by residual mechanical stress in the rail–fiber assembly, temperature variations, or gradual rearrangements in the optical path following the previous passage.
As the LRV enters the sensing region, a sharp transition is observed, marked by a sudden decrease in the signal amplitude and a pronounced increase in variability across consecutive samples. This behavior is associated with intense mechanical vibrations induced by the wheel–rail interaction, which strongly perturb the multimodal interference pattern in the SMS fiber configuration. During the vehicle passage, several high-amplitude peaks appear, indicating intermittent excitation modes and localized vibration effects along the rail. After the LRV leaves the sensing region, the signal progressively stabilizes over subsequent samples, converging to a lower baseline level than that observed before the event, further confirming that the average signal level is not preserved after dynamic disturbances.
Figure 13b presents the first derivative of the voltage signal for the second LRV passage, also expressed as a function of the number of samples, to emphasize abrupt variations between consecutive measurements. During the background region, the derivative remains close to zero, indicating minimal changes in the signal. In contrast, during the passage interval, the derivative exhibits large positive and negative excursions, with higher magnitude peaks than those observed in the first passage. These pronounced excursions reflect stronger or more impulsive vibration components acting on the sensing region during this event. Once the LRV exits the monitored area, the derivative rapidly returns to values near zero, indicating the cessation of dynamic disturbances.
The comparison between the first and second passages demonstrates that, although baseline signal levels and detailed waveform characteristics may vary between events, the presence of the LRV consistently produces a clear and statistically distinguishable increase in signal variability and derivative magnitude. This behavior reinforces the robustness of detection strategies based on variation-driven metrics, such as variance or rate of change across samples, rather than absolute voltage thresholds, ensuring reliable operation under real-world and non-stationary field conditions.
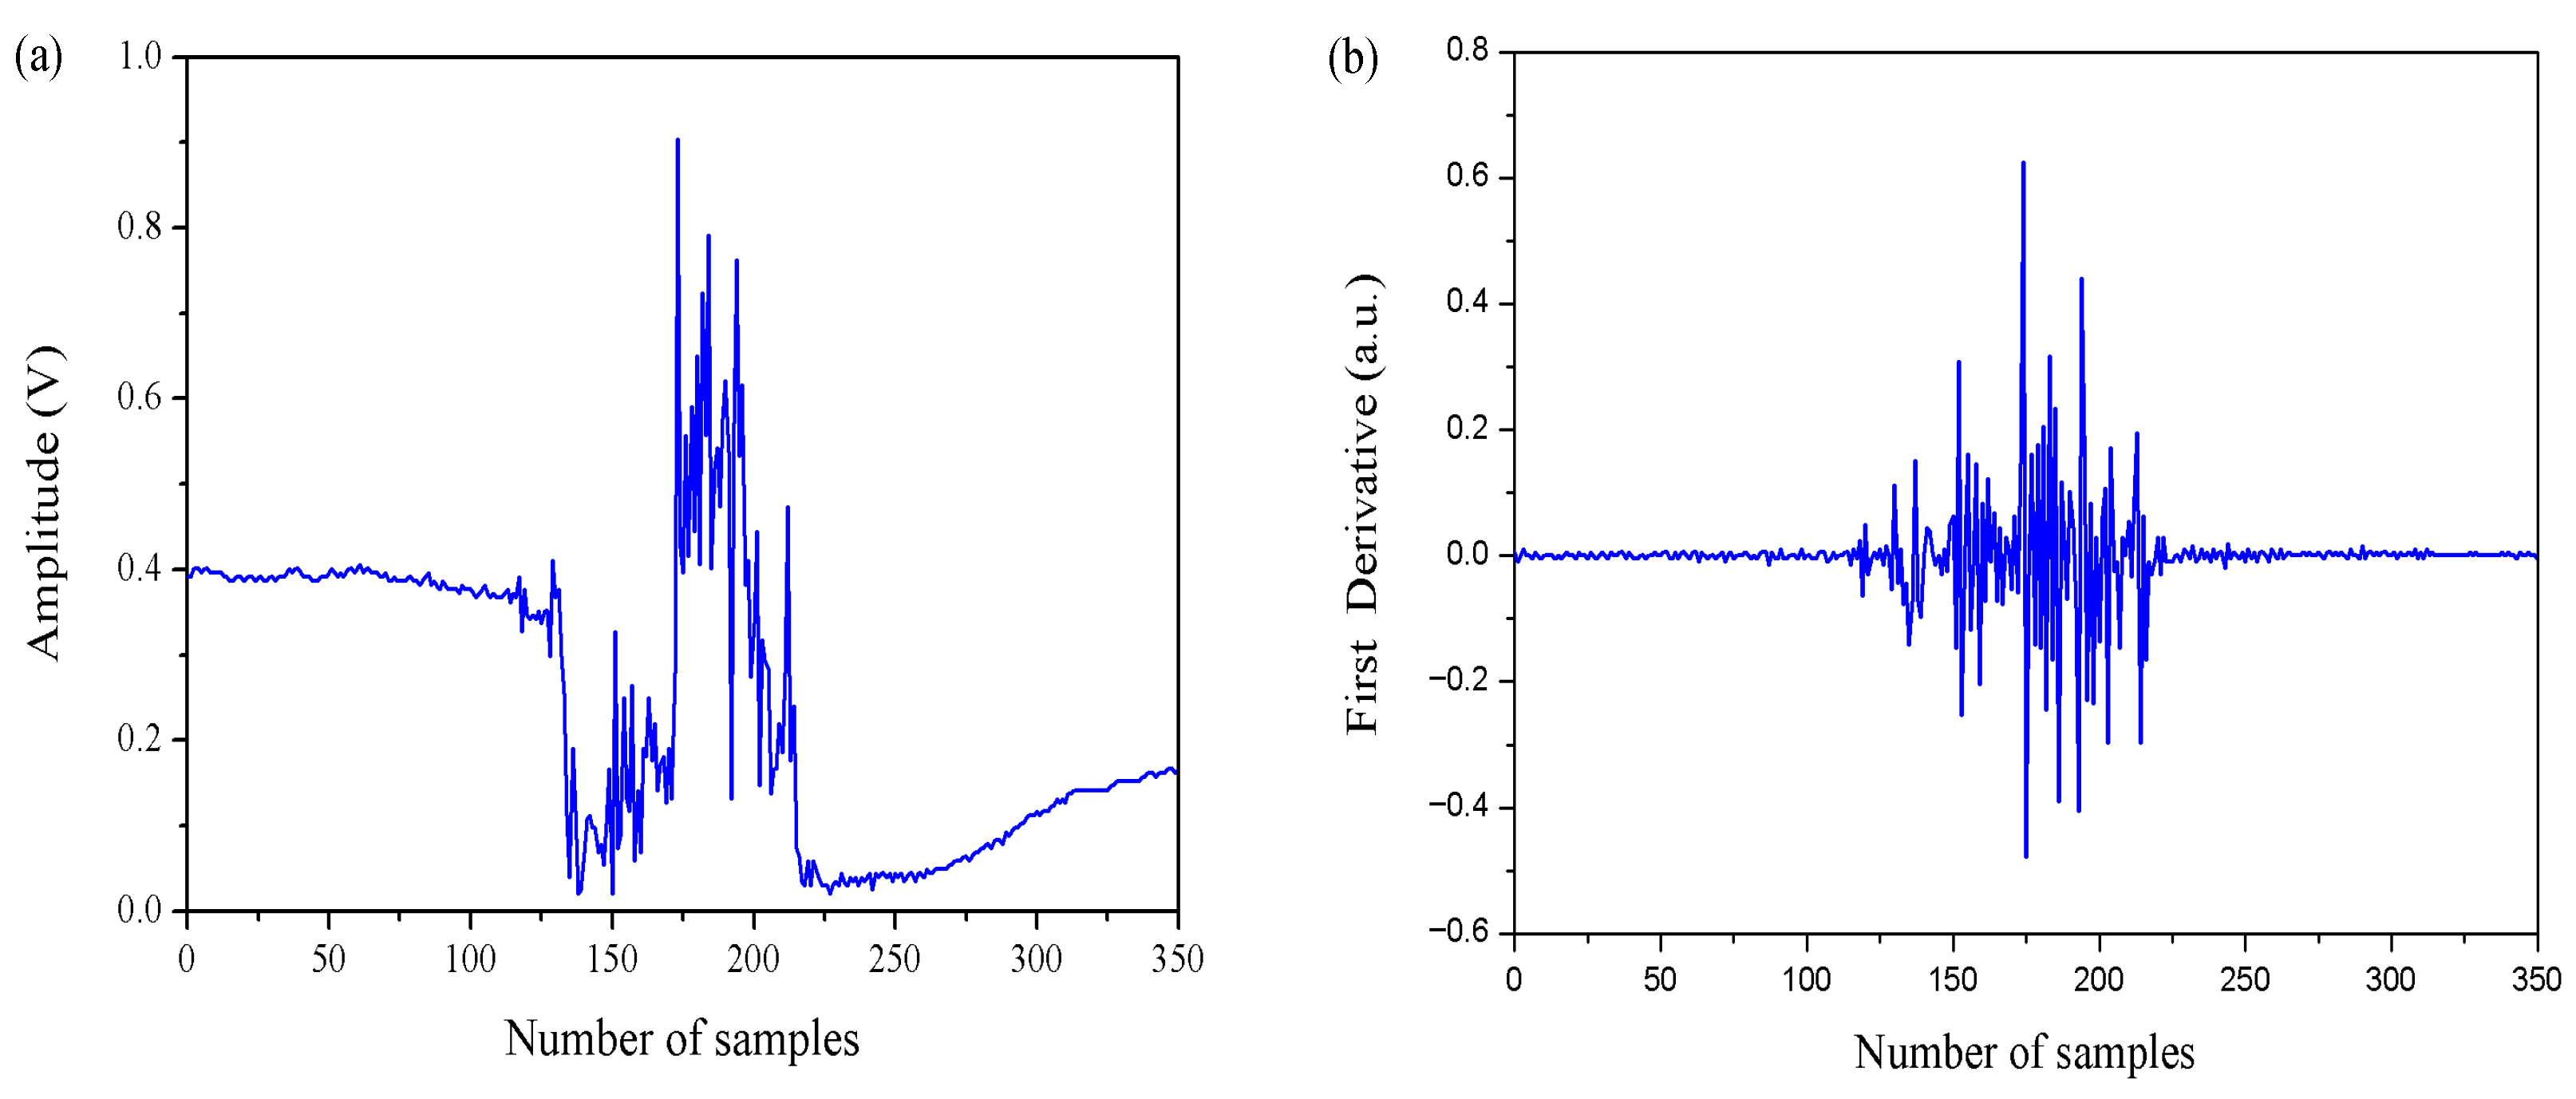
Figure 14a shows the evolution of the electrical voltage measured by the onboard data acquisition system as a function of the number of samples during the third passage of the light rail vehicle (LRV), which occurred approximately 40 min after the second event under normal operating conditions. In the initial portion of the signal, corresponding to background conditions prior to the vehicle arrival, the voltage remains relatively stable around a moderate baseline level, with low sample-to-sample variability. This confirms that, despite the elapsed time between passages, the system preserves a quasi-stationary background behavior in the absence of mechanical excitation.
As the LRV enters the sensing region, a clear disturbance is observed, marked by a sudden increase in signal variability and the appearance of multiple high-amplitude peaks across consecutive samples. These peaks reflect the strong mechanical vibrations induced by the wheel–rail interaction, which perturb the multimodal interference pattern in the SMS fiber sensor. Compared to the previous passages, the third event exhibits a distinct signal profile, with pronounced oscillations and a broader disturbance region, highlighting the non-deterministic nature of real field measurements. After the vehicle leaves the sensing region, the signal amplitude decreases abruptly and then gradually recovers over subsequent samples, stabilizing at a baseline level that differs from both the pre-event value and the baselines observed in earlier passages. This behavior further reinforces the presence of residual mechanical effects, such as micro-bending and stress redistribution in the fiber–rail assembly.
Figure 14b presents the first derivative of the voltage signal for the third LRV passage, also expressed as a function of the number of samples, to emphasize abrupt changes between consecutive measurements. During the background region, the derivative remains close to zero, indicating minimal variation in the signal. During the passage interval, however, the derivative exhibits significant positive and negative excursions, corresponding to rapid and irregular changes in voltage caused by intense vibration components acting on the sensing region. Once the LRV exits the monitored area, the derivative rapidly returns to values near zero, confirming the attenuation of dynamic disturbances and the reestablishment of background conditions.
Overall, the third passage confirms the repeatability of the sensing principle: although baseline levels and detailed waveform characteristics vary between successive events, the presence of the LRV consistently produces a statistically distinguishable increase in signal variability and derivative magnitude. This reinforces the suitability of detection strategies based on variation-driven metrics, such as variance or rate of change across samples, rather than absolute voltage levels, ensuring robust operation under non-stationary and real-world field conditions.
To assess possible external interference, signals were analyzed during the passage of light vehicles, such as cars and motorcycles, near the sensing area. No significant changes were observed beyond the previously characterized background noise. Spectral analysis indicated components concentrated at frequencies close to zero, with low energy and negligible when compared to the vibration signal generated by the passage of the light rail vehicle (LRV). Graphs of these situations were not presented, as there was no measurable variation in the signal that would justify additional representation. It is concluded, therefore, that light vehicles do not compromise the detection of the event of interest.
6.2. Results of Field Test with Freight Train
Figure 15 presents the vibration signals acquired during the passage of the freight train operating at a speed of 5 km/h, showing both the raw sensor output and its first derivative. The detection of train passages is based on a simple and adaptive algorithm, explained in the previous section, grounded in the statistical analysis of the measured vibration signal, where the signal variance is employed as the primary indicator of mechanical activity. This parameter effectively represents the energy content of the signal and provides a robust criterion for event detection.
Under normal operating conditions, when no train is present on the track, the recorded signal exhibits only background noise and low-amplitude mechanical oscillations. Consequently, the signal variance remains at a low and stable level, as observed in the initial portion of the time series. In contrast, the passage of the freight train at 5 km/h induces strong mechanical excitation in the rail structure due to its high mass and sustained wheel–rail interaction forces. This excitation produces a significant increase in signal amplitude and energy, which is clearly reflected by an abrupt rise in signal variance.
As shown in
Figure 15a, the freight train passage at low speed is characterized by a pronounced increase in vibration amplitude, with multiple high-energy peaks associated with the locomotive and the subsequent wagons. This behavior is further highlighted in
Figure 15b, where the first derivative of the signal reveals sharp transient components corresponding to rapid changes in mechanical stress and vibration intensity. Despite the relatively low operating speed, the energy content of the vibration signal remains significantly higher than the background level, demonstrating the strong influence of vehicle mass on the measured response.
The clear separation between background vibrations and train-induced events confirms the effectiveness of the variance-based detection method. Furthermore, the results obtained at 5 km/h provide a valuable baseline for comparison with higher-speed freight operations and lighter railway vehicles, supporting subsequent analyses aimed at vehicle-type identification based on vibration energy signatures.
Figure 16 presents the vibration signals acquired during the passage of the freight train operating at a speed of 15 km/h, including the raw sensor output and its first derivative. As in the low-speed case, train detection relies on a variance-based algorithm that evaluates changes in the energy content of the measured vibration signal. However, distinct characteristics emerge when the train operates at a higher velocity.
Compared to the results obtained at 5 km/h, the freight train passage at 15 km/h occurs over a shorter time interval for the same number of samples, resulting in a higher density of mechanical excitation events within the recorded signal window. As the train moves faster, the wheels interact more frequently with the rail surface over a given period, leading to an increased rate of dynamic loading. This effect produces stronger and more frequent vibration components, which are reflected in the higher signal amplitude and energy levels observed in
Figure 16a.
The increased vibration intensity at 15 km/h is clearly visible in the raw signal, which exhibits more pronounced peaks and a generally elevated amplitude envelope compared to the low-speed case. This behavior is further emphasized in
Figure 16b, where the first derivative reveals a higher concentration of sharp transient events, corresponding to rapid variations in mechanical stress induced by the faster wheel–rail interactions. These transients occur more frequently within the same sampling interval, confirming the influence of velocity on the vibration signature.
It is important to note that the observed increase in signal intensity is not related to changes in the train load, as the total mass of the freight train remains identical for both operating speeds. Instead, the enhanced vibration response is primarily attributed to the higher train velocity, which increases the frequency of wheel contact events and the dynamic forces applied to the rail. These results demonstrate the sensitivity of the proposed sensing system to velocity-dependent effects and highlight its capability to capture distinct vibration patterns under different operational conditions, even when the vehicle mass remains constant.
6.3. Results of Field Test with Maintenance Train
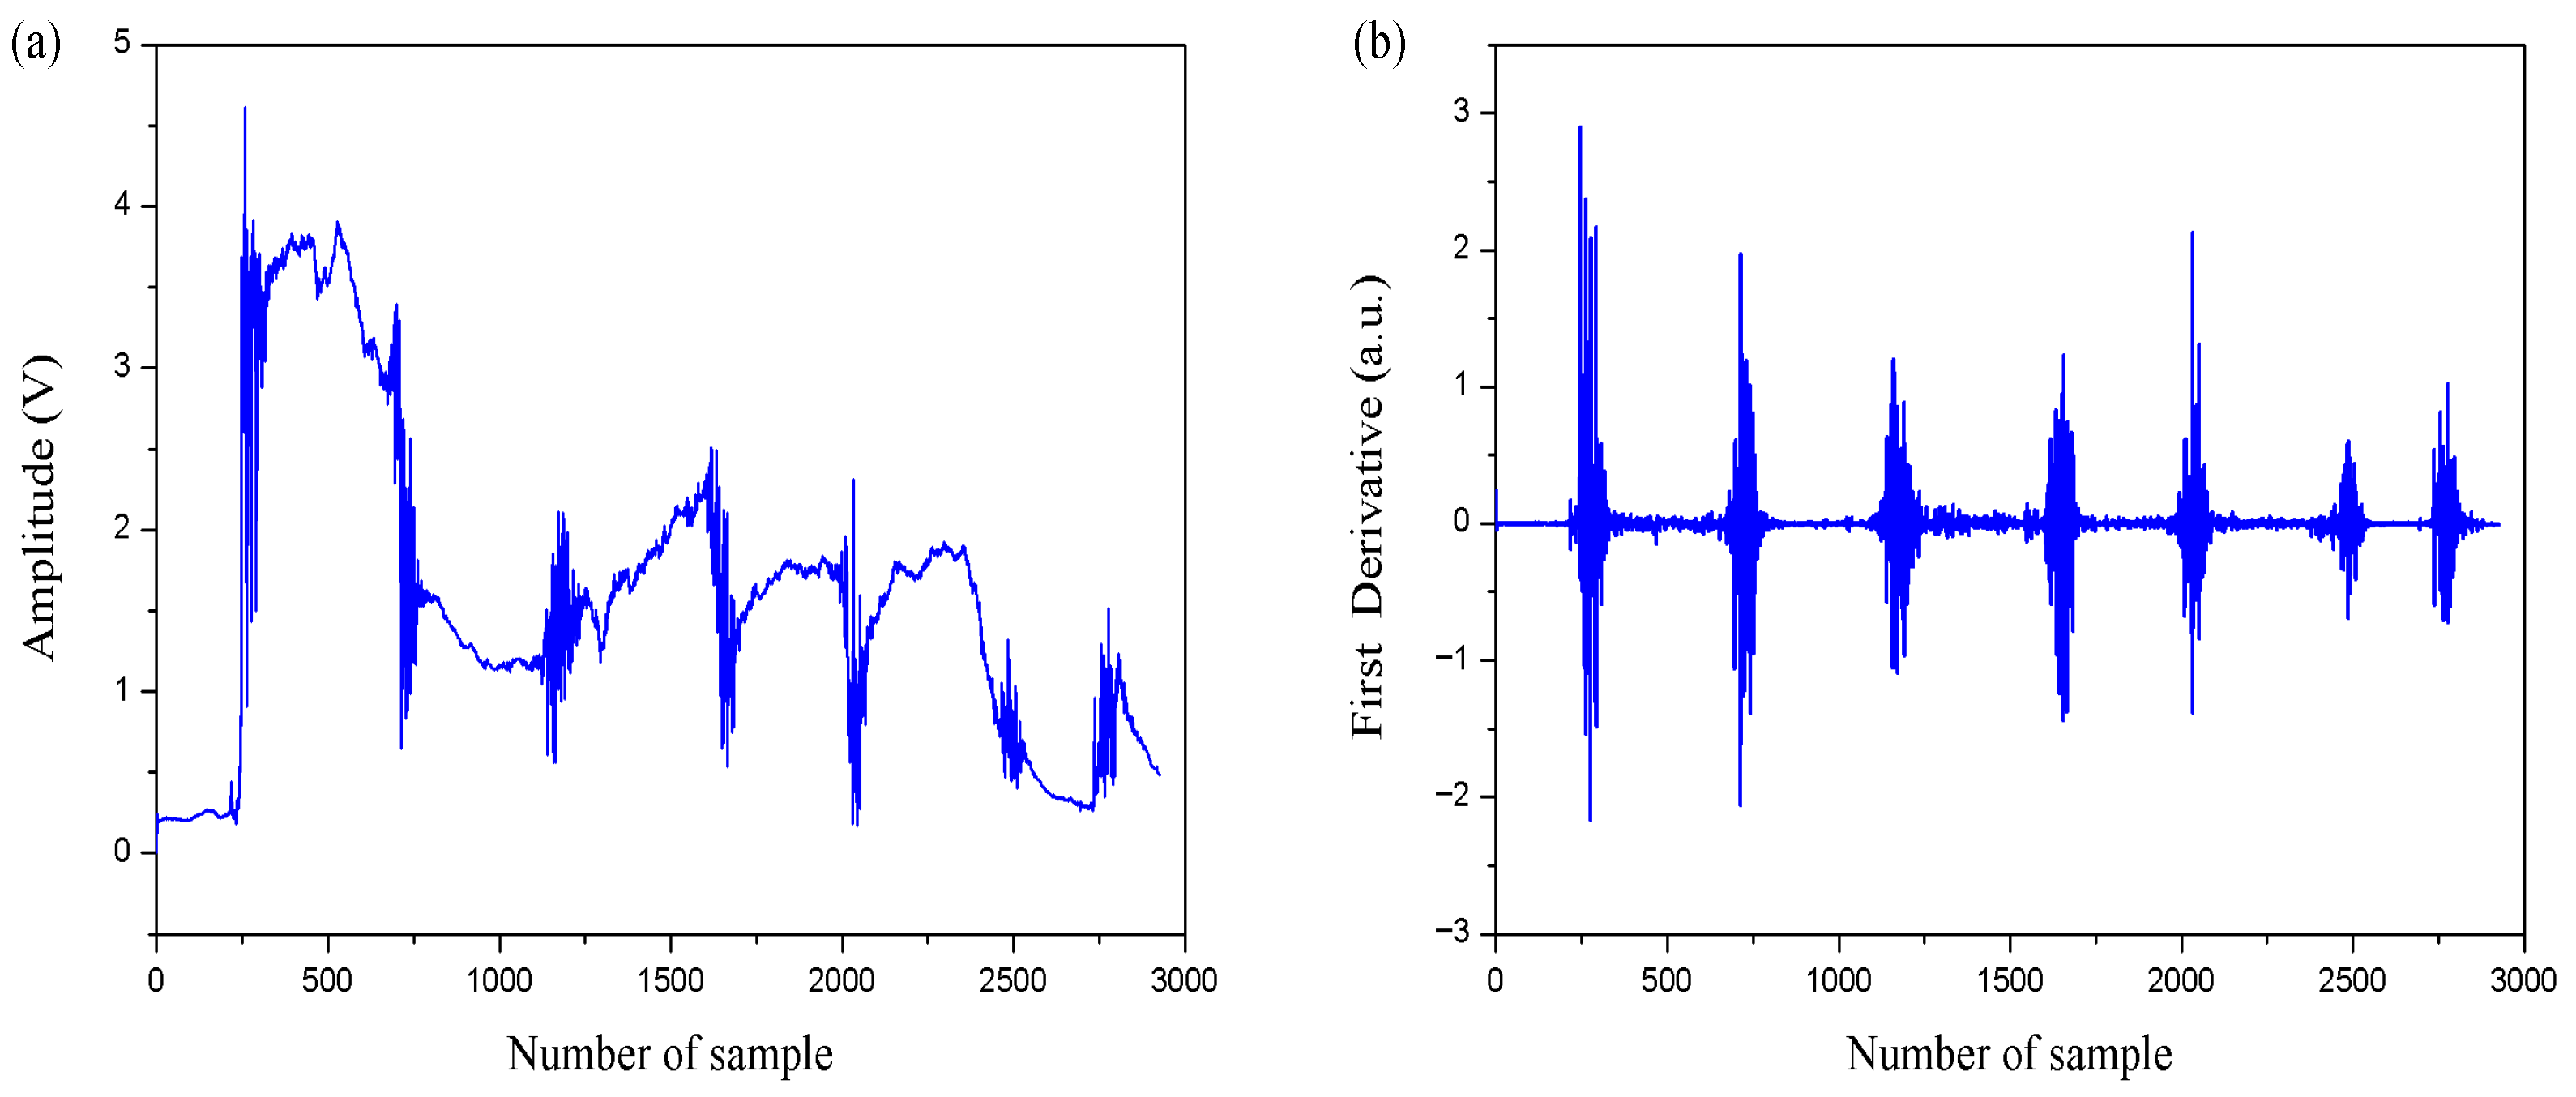
Figure 17 presents the vibration signals acquired during the passage of the maintenance train, showing
Figure 17a the raw sensor output and
Figure 17b its first derivative. As in the previous experiments, train detection is based on a variance-based algorithm that evaluates changes in the energy content of the measured vibration signal. The same SMS optical loops and data acquisition system used in the freight train tests were employed in this experiment, ensuring consistent experimental conditions.
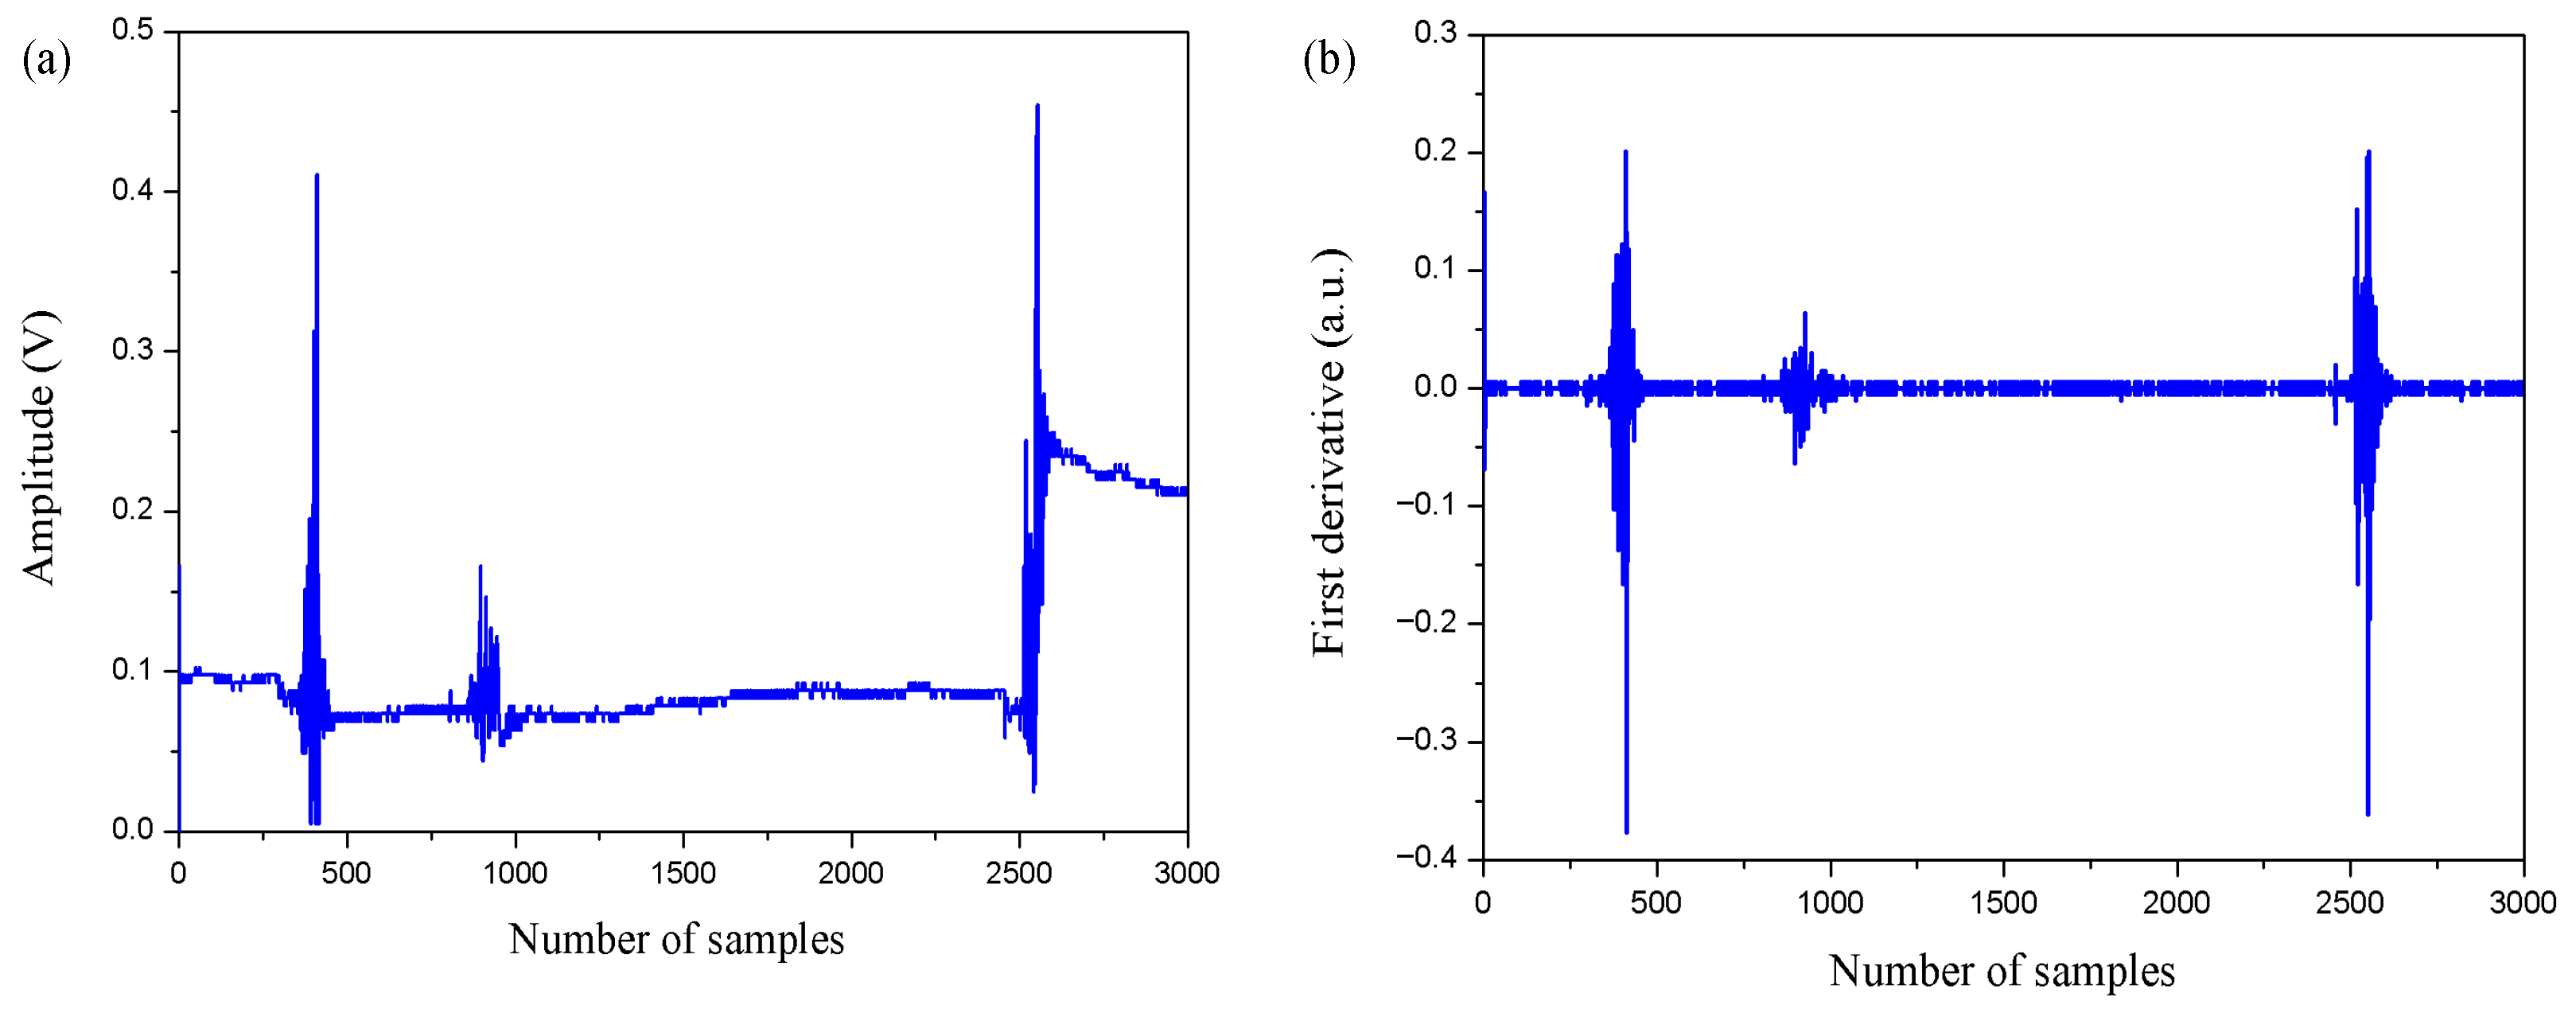
Under baseline conditions, when no vehicle is present on the track, the recorded signal is dominated by low-amplitude background noise, resulting in a low and stable variance level. During the maintenance train test, a clear increase in vibration amplitude and signal energy is observed, enabling reliable detection of the vehicle. In the analyzed time window, corresponding to approximately 3000 samples, the maintenance train passed over the sensor three distinct times, which explains the presence of three well-defined vibration peaks in the recorded signal.
As shown in
Figure 17a, each peak corresponds to an individual passage of the maintenance vehicle over the sensing region. Compared to the freight train results, these peaks exhibit lower amplitude and reduced energy content, reflecting the significantly lower mass and axle loads of the maintenance train. This behavior is further emphasized in
Figure 17b, where the first derivative reveals transient components associated with each passage, although with smaller magnitudes and less intense dynamic variations.
The reduced vibration energy observed in the maintenance train measurements is primarily attributed to the lighter vehicle mass, which leads to weaker mechanical excitation of the rail structure. Despite this lower energy level, the variance-based detection algorithm successfully identifies all three passages, demonstrating the robustness and sensitivity of the proposed sensing system. When combined with the results obtained for the freight train and the light rail vehicle (LRV), these findings confirm the system’s capability to detect multiple classes of railway vehicles and support the feasibility of future applications involving vehicle-type identification based on vibration signal characteristics.
6.4. Frequency Domain Analysis
The
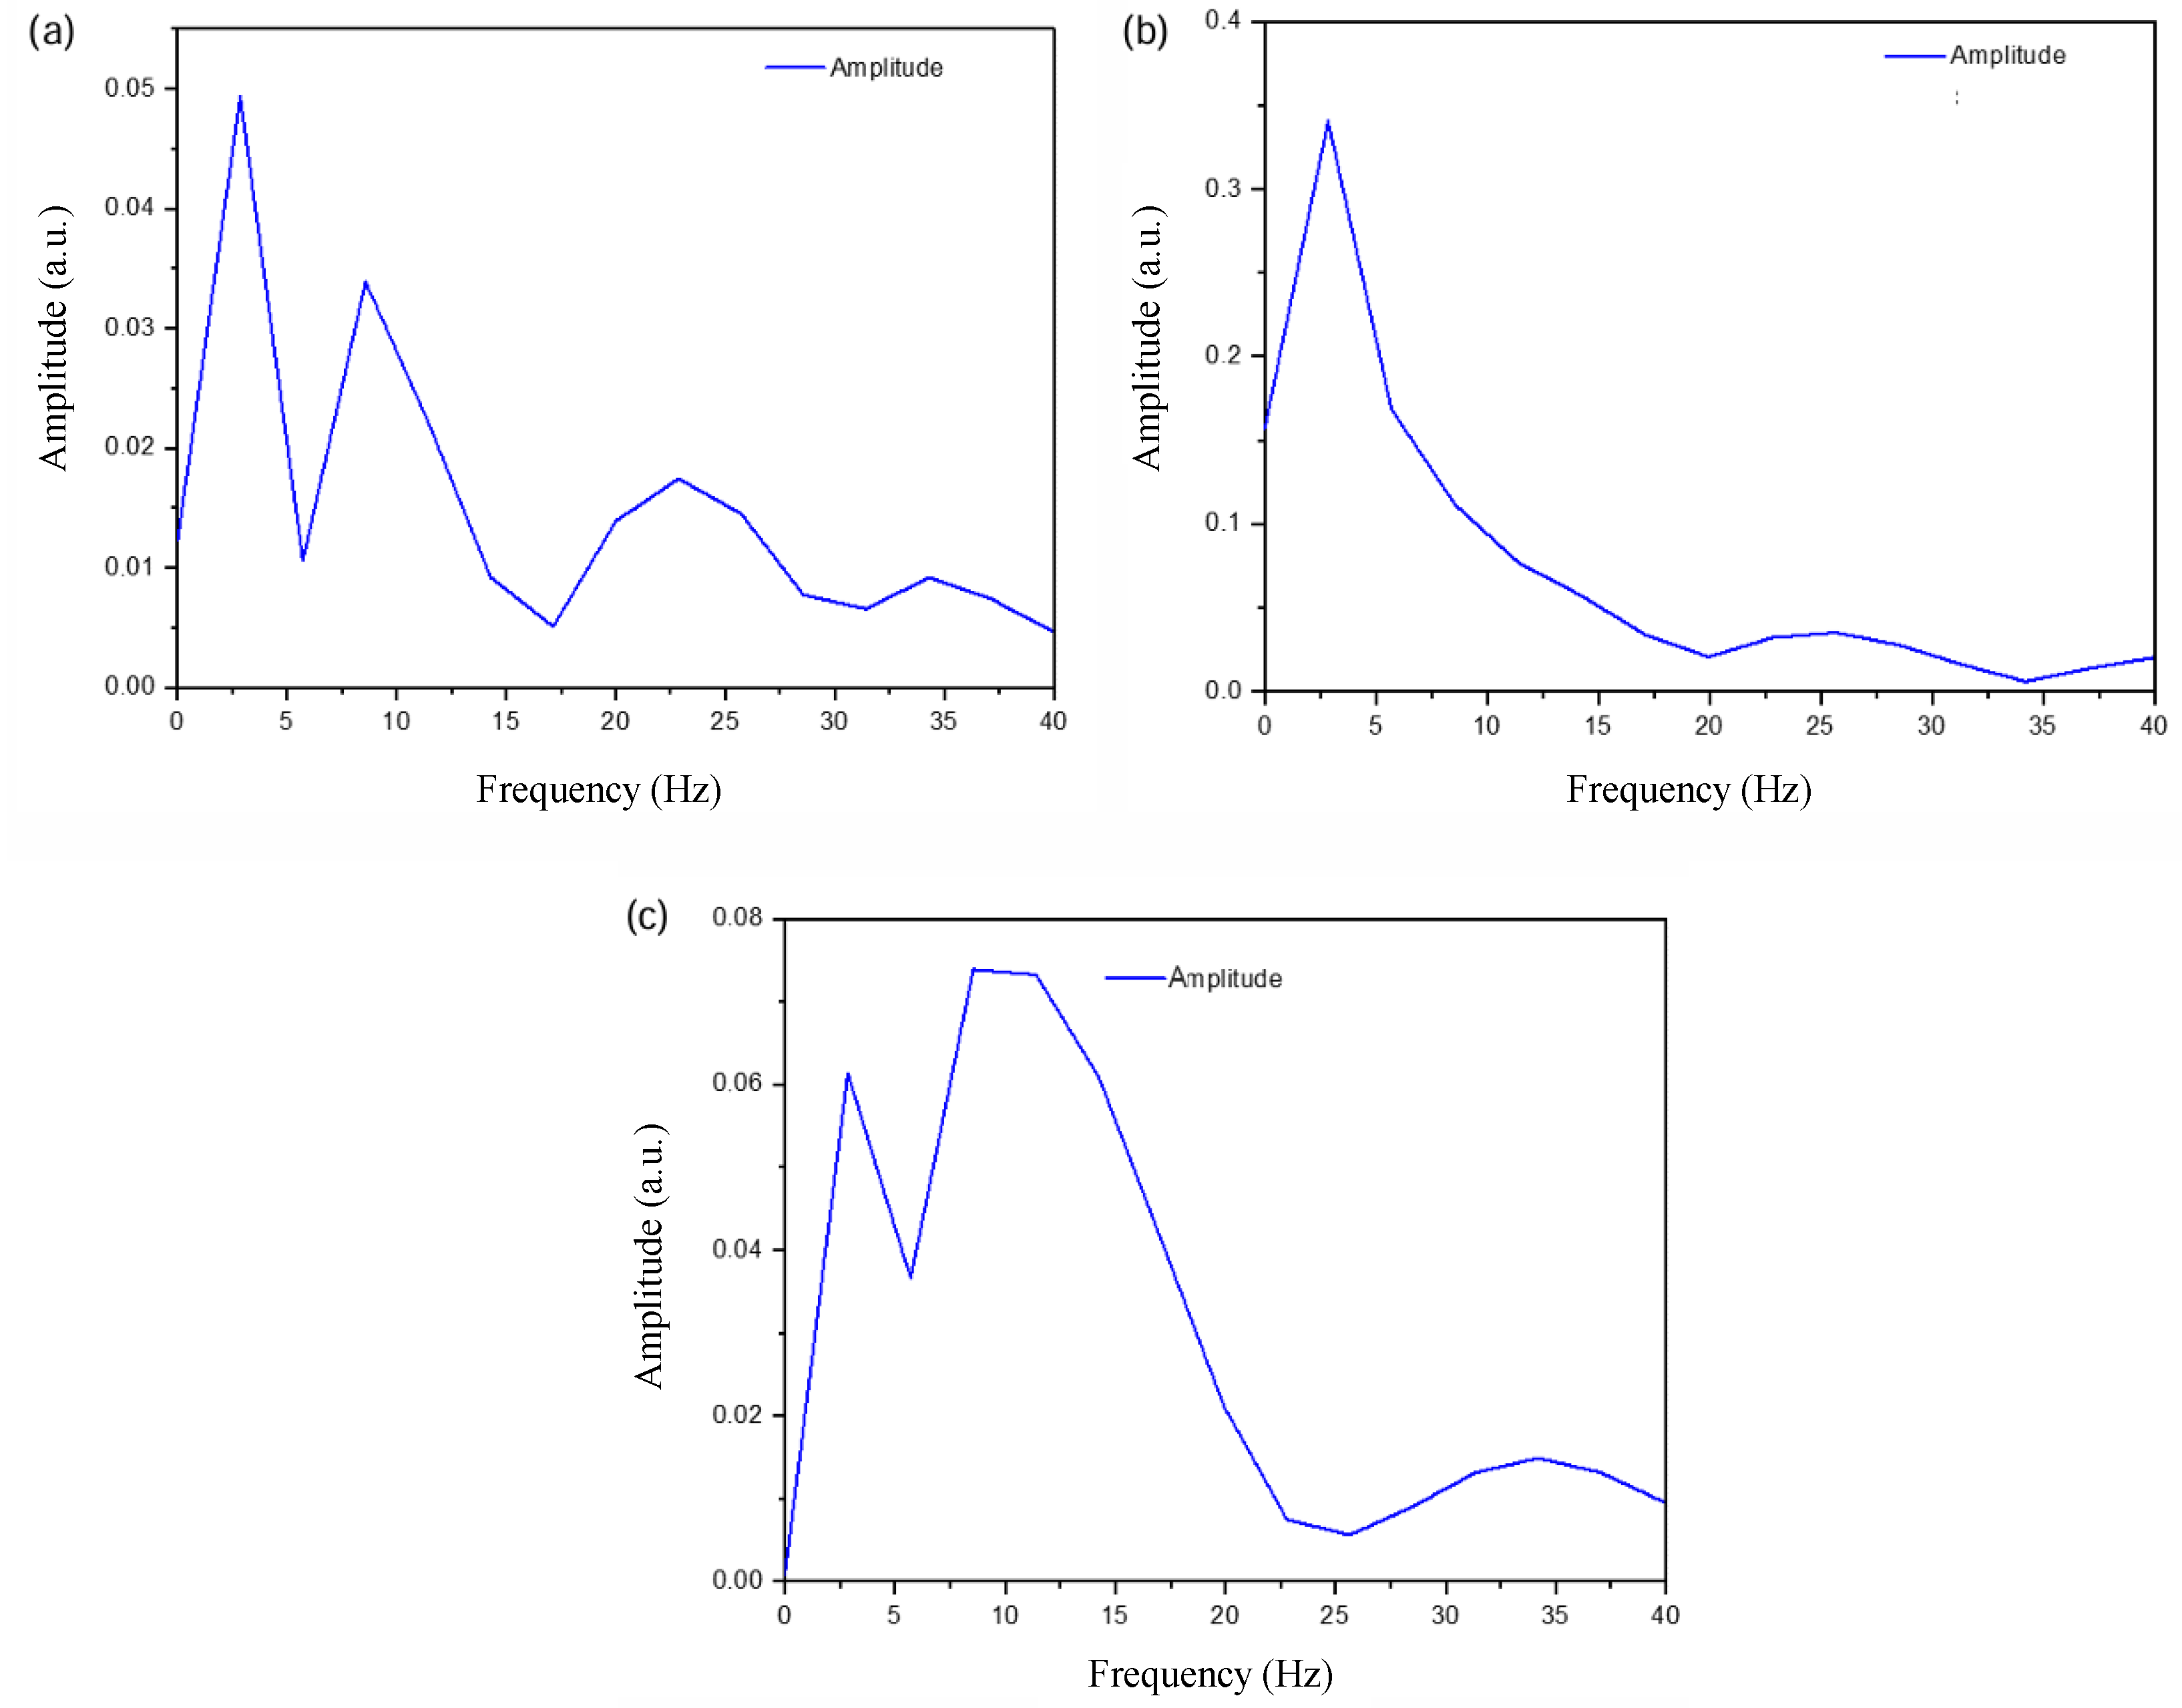
Figure 18 presents the Fast Fourier Transform (FFT) spectra corresponding to three consecutive ligth rail vehicle passages, considering only the low-frequency range up to 40 Hz. The spectra display the vibration amplitude in linear scale, expressed in arbitrary units (a.u.), highlighting the dominant low-frequency content of the measured signals.
In the first pass
Figure 18a, he spectrum exhibits a nonuniform distribution with distinct amplitude variations across the analyzed range. A pronounced peak is observed at low frequencies, followed by a secondary rise around the mid-frequency region, indicating the presence of multiple vibration components contributing to the multimodal interference response. The overall amplitude remains relatively low, suggesting a weaker excitation level during this passage.
The second passage,
Figure 18b, shows a markedly stronger response, with significantly higher amplitudes concentrated at low frequencies. A dominant peak is observed below 5 Hz, followed by a gradual decay as frequency increases. This behavior indicates that the vibration energy is primarily concentrated in the very low-frequency regime, resulting in a smoother and more monotonic spectral profile compared to the first passage.
In contrast, the third passage,
Figure 18c, presents an intermediate behavior, combining higher amplitudes with a more distributed spectral structure. We observed multiple peaks across the low-frequency band, particularly between 5 Hz and 12 Hz, followed by a gradual decrease toward higher frequencies. This pattern reflects a more complex vibration signature, with energy distributed over several low-frequency components.
Overall, the FFT spectra demonstrate that the sensor response is dominated by low-frequency vibration components below 40 Hz, with clear differences in amplitude distribution and spectral structure between consecutive vehicle passages. These variations indicate that changes in operational conditions directly affect the low-frequency vibration content, which is effectively captured through the multimode interference mechanism of the SMS fiber structure.
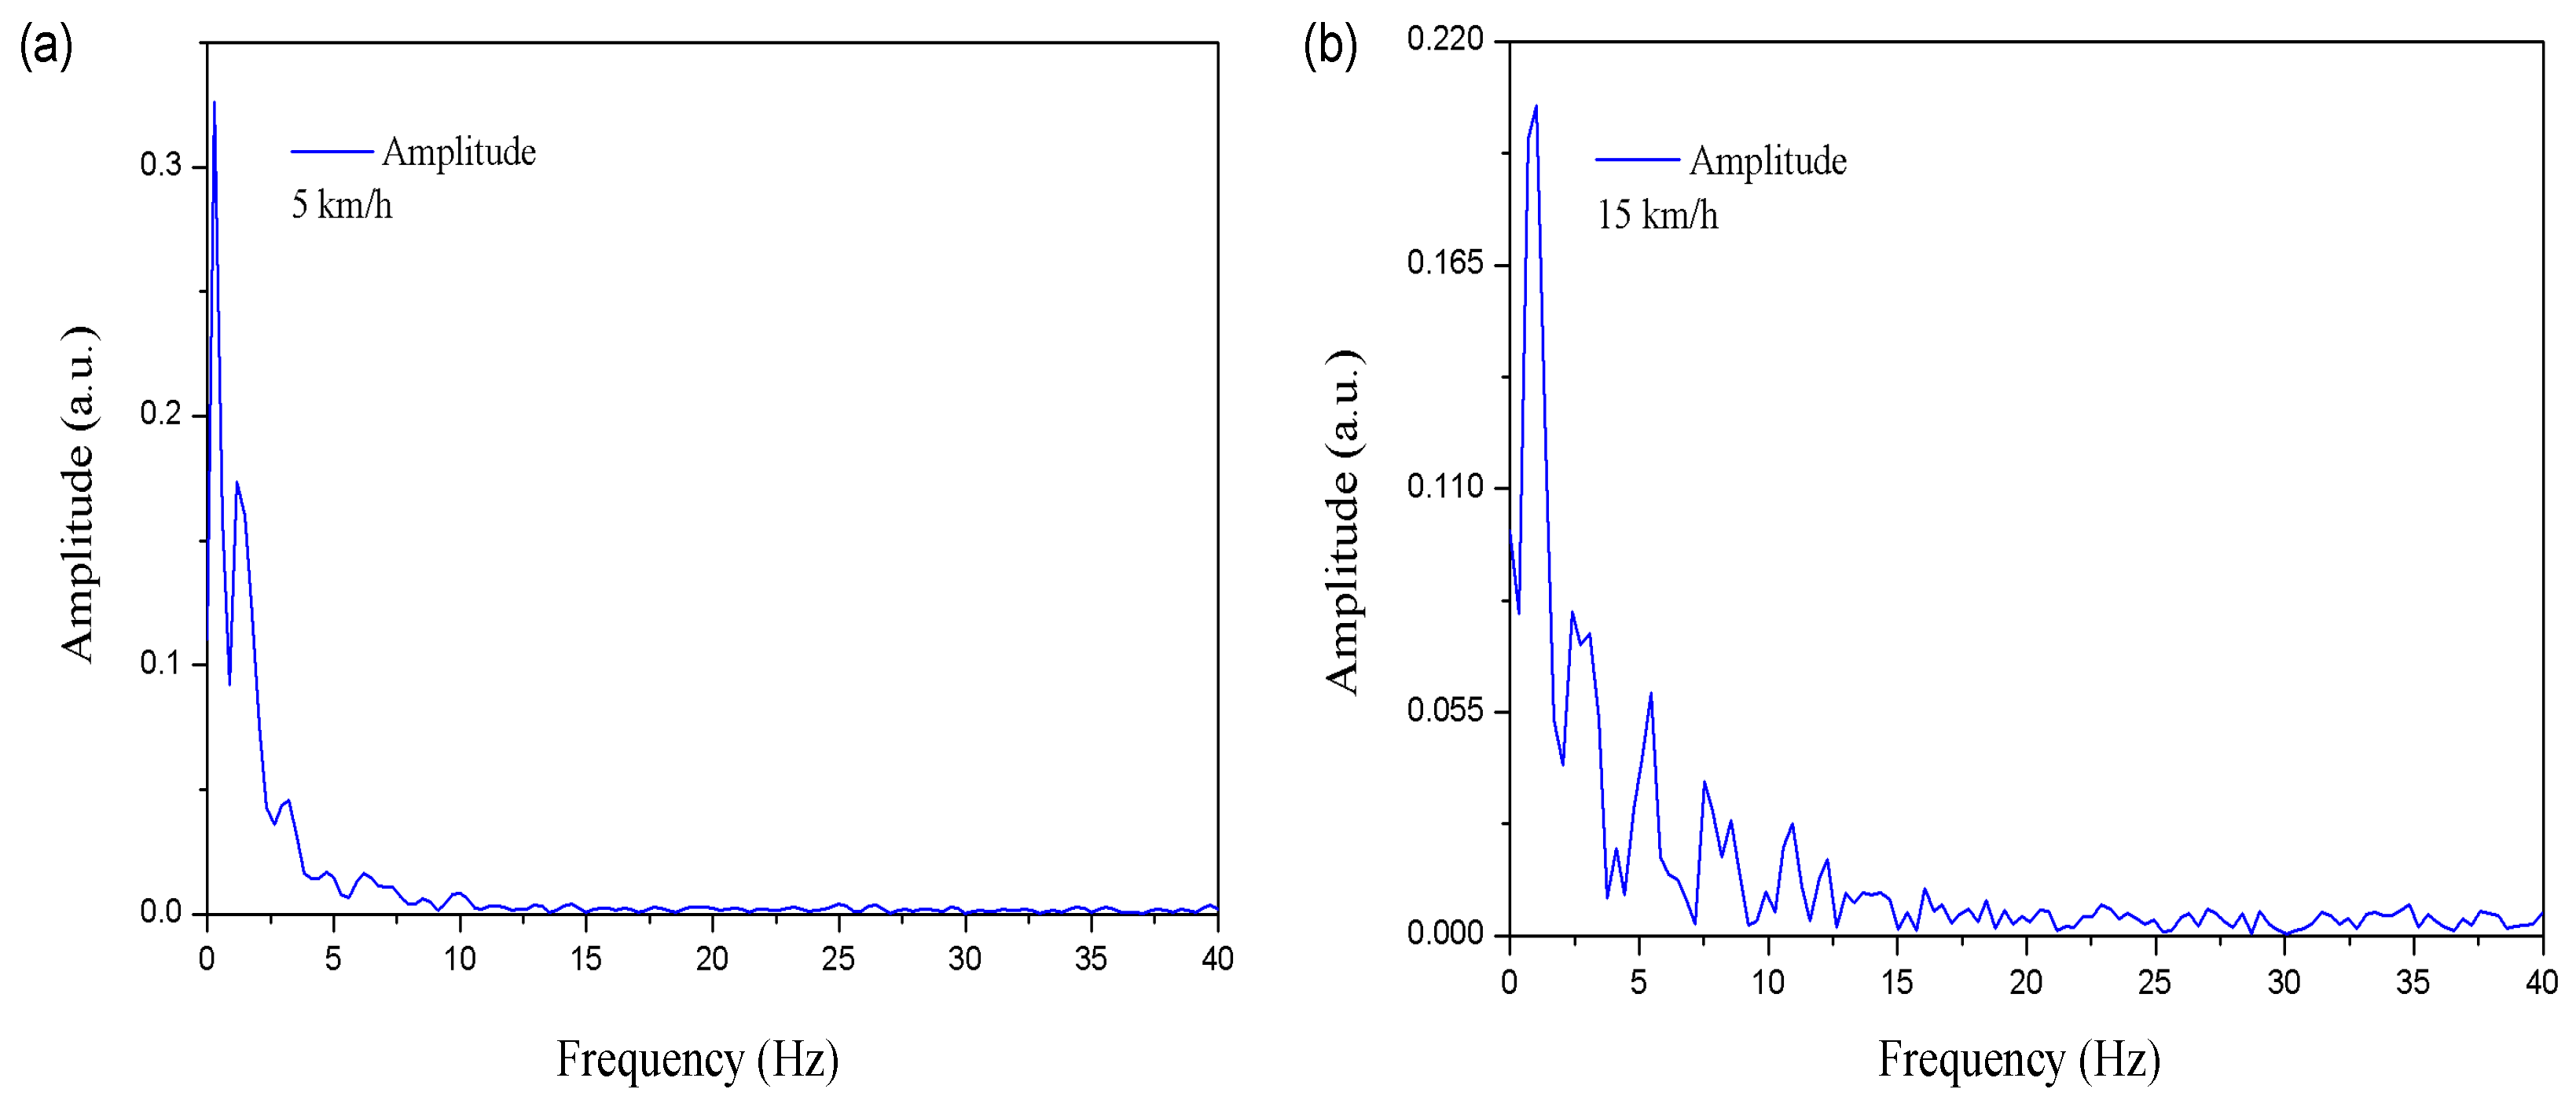
Figure 19 presents the Fast Fourier Transform (FFT) amplitude spectra obtained during the passage of the freight train at speeds of 5 km/h and 15 km/h, considering only the low-frequency range up to 40 Hz. This frequency interval was selected because higher-frequency components exhibited negligible variation and did not contribute significantly to the comparative analysis. The spectra are shown in linear amplitude scale, expressed in arbitrary units (A.U.), emphasizing the dominant low-frequency vibration content induced by the wheel–rail interaction.
At a speed of 5 km/h, the spectrum is characterized by amplitudes predominantly concentrated in the very low-frequency region, bellow 2 Hz. The response exhibits a limited number of spectral components with moderate amplitude levels, reflecting a smoother mechanical excitation associated with the lower operating speed. The spectral profile remains relatively stable across the analyzed frequency range, indicating reduced dynamic complexity.
When the train speed increases to 15 km/h, the spectral response remains strongly dominated by very low-frequency components. A pronounced amplitude peak is observed below approximately 2 Hz, followed by a gradual decay as frequency increases. Although minor fluctuations are present across the 5 and 15 Hz range, no sharply defined spectral peaks are observed, indicating that the vibration energy remains concentrated at the lowest frequencies.
This behavior suggests that the increase in speed primarily enhances the magnitude of low-frequency structural vibrations rather than redistributing energy toward higher-frequency components. The resulting spectral profile reflects a stable dynamic regime dominated by quasi-static and low-rate excitation mechanisms associated with wheel–rail interaction.
Despite the constant mass of the freight train, the observed changes in amplitude distribution and spectral content demonstrate the strong dependence of the vibration signature on operating speed. These results confirm the capability of the SMS fiber sensor to resolve velocity-induced dynamic variations through low-frequency vibration analysis, even when restricted to a narrow frequency window.
The spectral energy is predominantly concentrated at low frequencies, indicating that the dynamic response of the system is governed by structural vibrations with relatively low excitation rates. The absence of sharp or narrowly defined spectral peaks suggests that the vibration energy is distributed over a limited low-frequency band, which is typical of wheel–rail induced structural responses rather than impulsive or high-frequency excitations.
Although the freight train exhibits higher overall amplitude levels compared to lighter vehicles, the spectral content remains smooth and continuous, especially at the lower speed of 5 km/h. This behavior reflects a stable mechanical interaction dominated by quasi-static loading conditions. At 15 km/h, the increase in excitation rate leads to higher amplitudes and a broader distribution of low-frequency components, while still preserving the dominance of low-frequency structural vibrations.
These observations confirm the multimodal interference sensor’s capability to reliably detect and characterize heavy vehicles under different operating speeds using low-frequency spectral features alone. When compared with the spectra obtained from the maintenance train and the light rail vehicle (LRV), the freight train responses exhibit significantly higher spectral energy, demonstrating a strong correlation between vibration amplitude, vehicle mass, and dynamic regime. This reinforces the potential of the proposed sensing system for rail vehicle classification based on low-frequency spectral signatures.
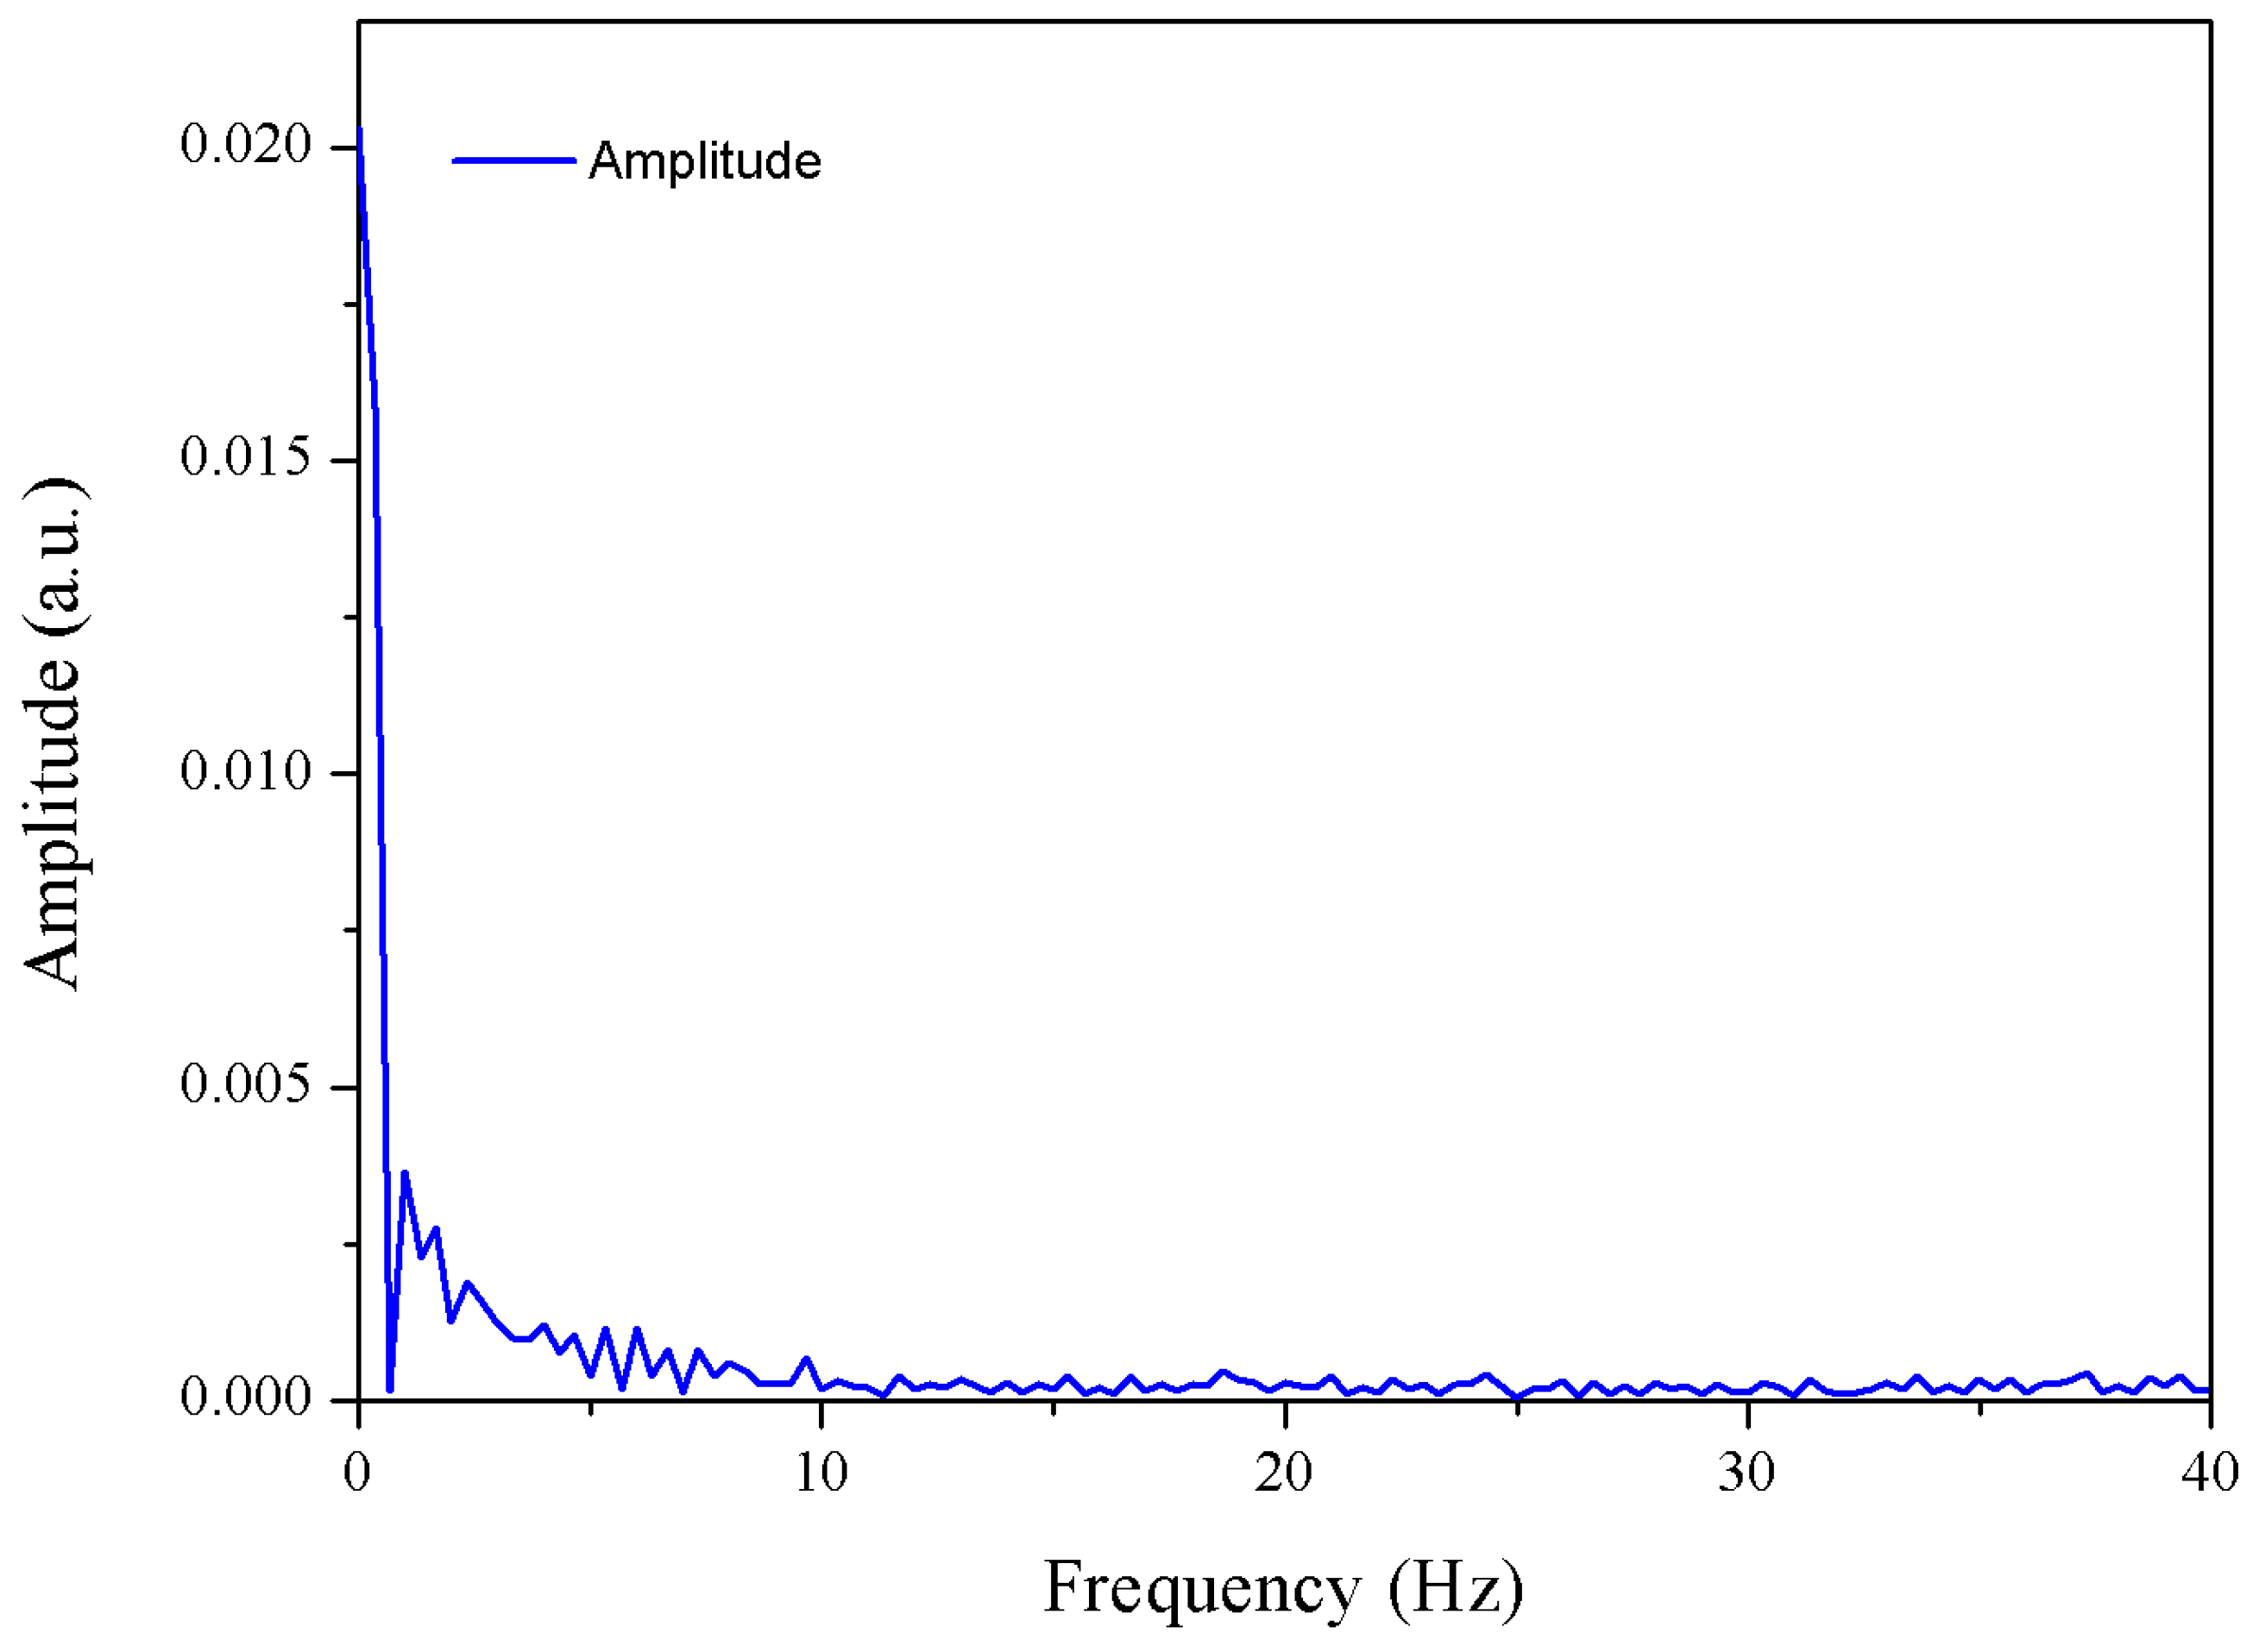
Figure 20 shows the FFT magnitude of the vibration signal in the frequency domain for the maintenance vehicle. The spectrum is strongly concentrated at very low frequencies, with the highest amplitude occurring in the region immediately above 0 Hz. The dominant vibrational content is confined to the very beginning of the spectrum, and a rapid attenuation is already observed around 2 Hz. From this point onward, the spectral magnitude decreases markedly, approaching the noise floor at higher frequencies, which indicates that the measurable vibration content is essentially restricted to the low-frequency region.
Compared with the LRV and the freight train, the maintenance vehicle exhibits relevant vibration components only at significantly lower frequencies. This behavior is primarily associated with the vehicle load: although speed can influence the vibration level, as discussed previously, its contribution is less significant than the effect of weight within the investigated operating regime. Vehicle mass is therefore a key factor governing the induced rail vibration. As a consequence, while the LRV and the freight train show a measurable response extending up to approximately 12 Hz, the maintenance vehicle response is already heavily damped beyond 2 Hz, reflecting the weaker excitation produced by a much lighter vehicle.
6.5. Sensor Sensitivity
The
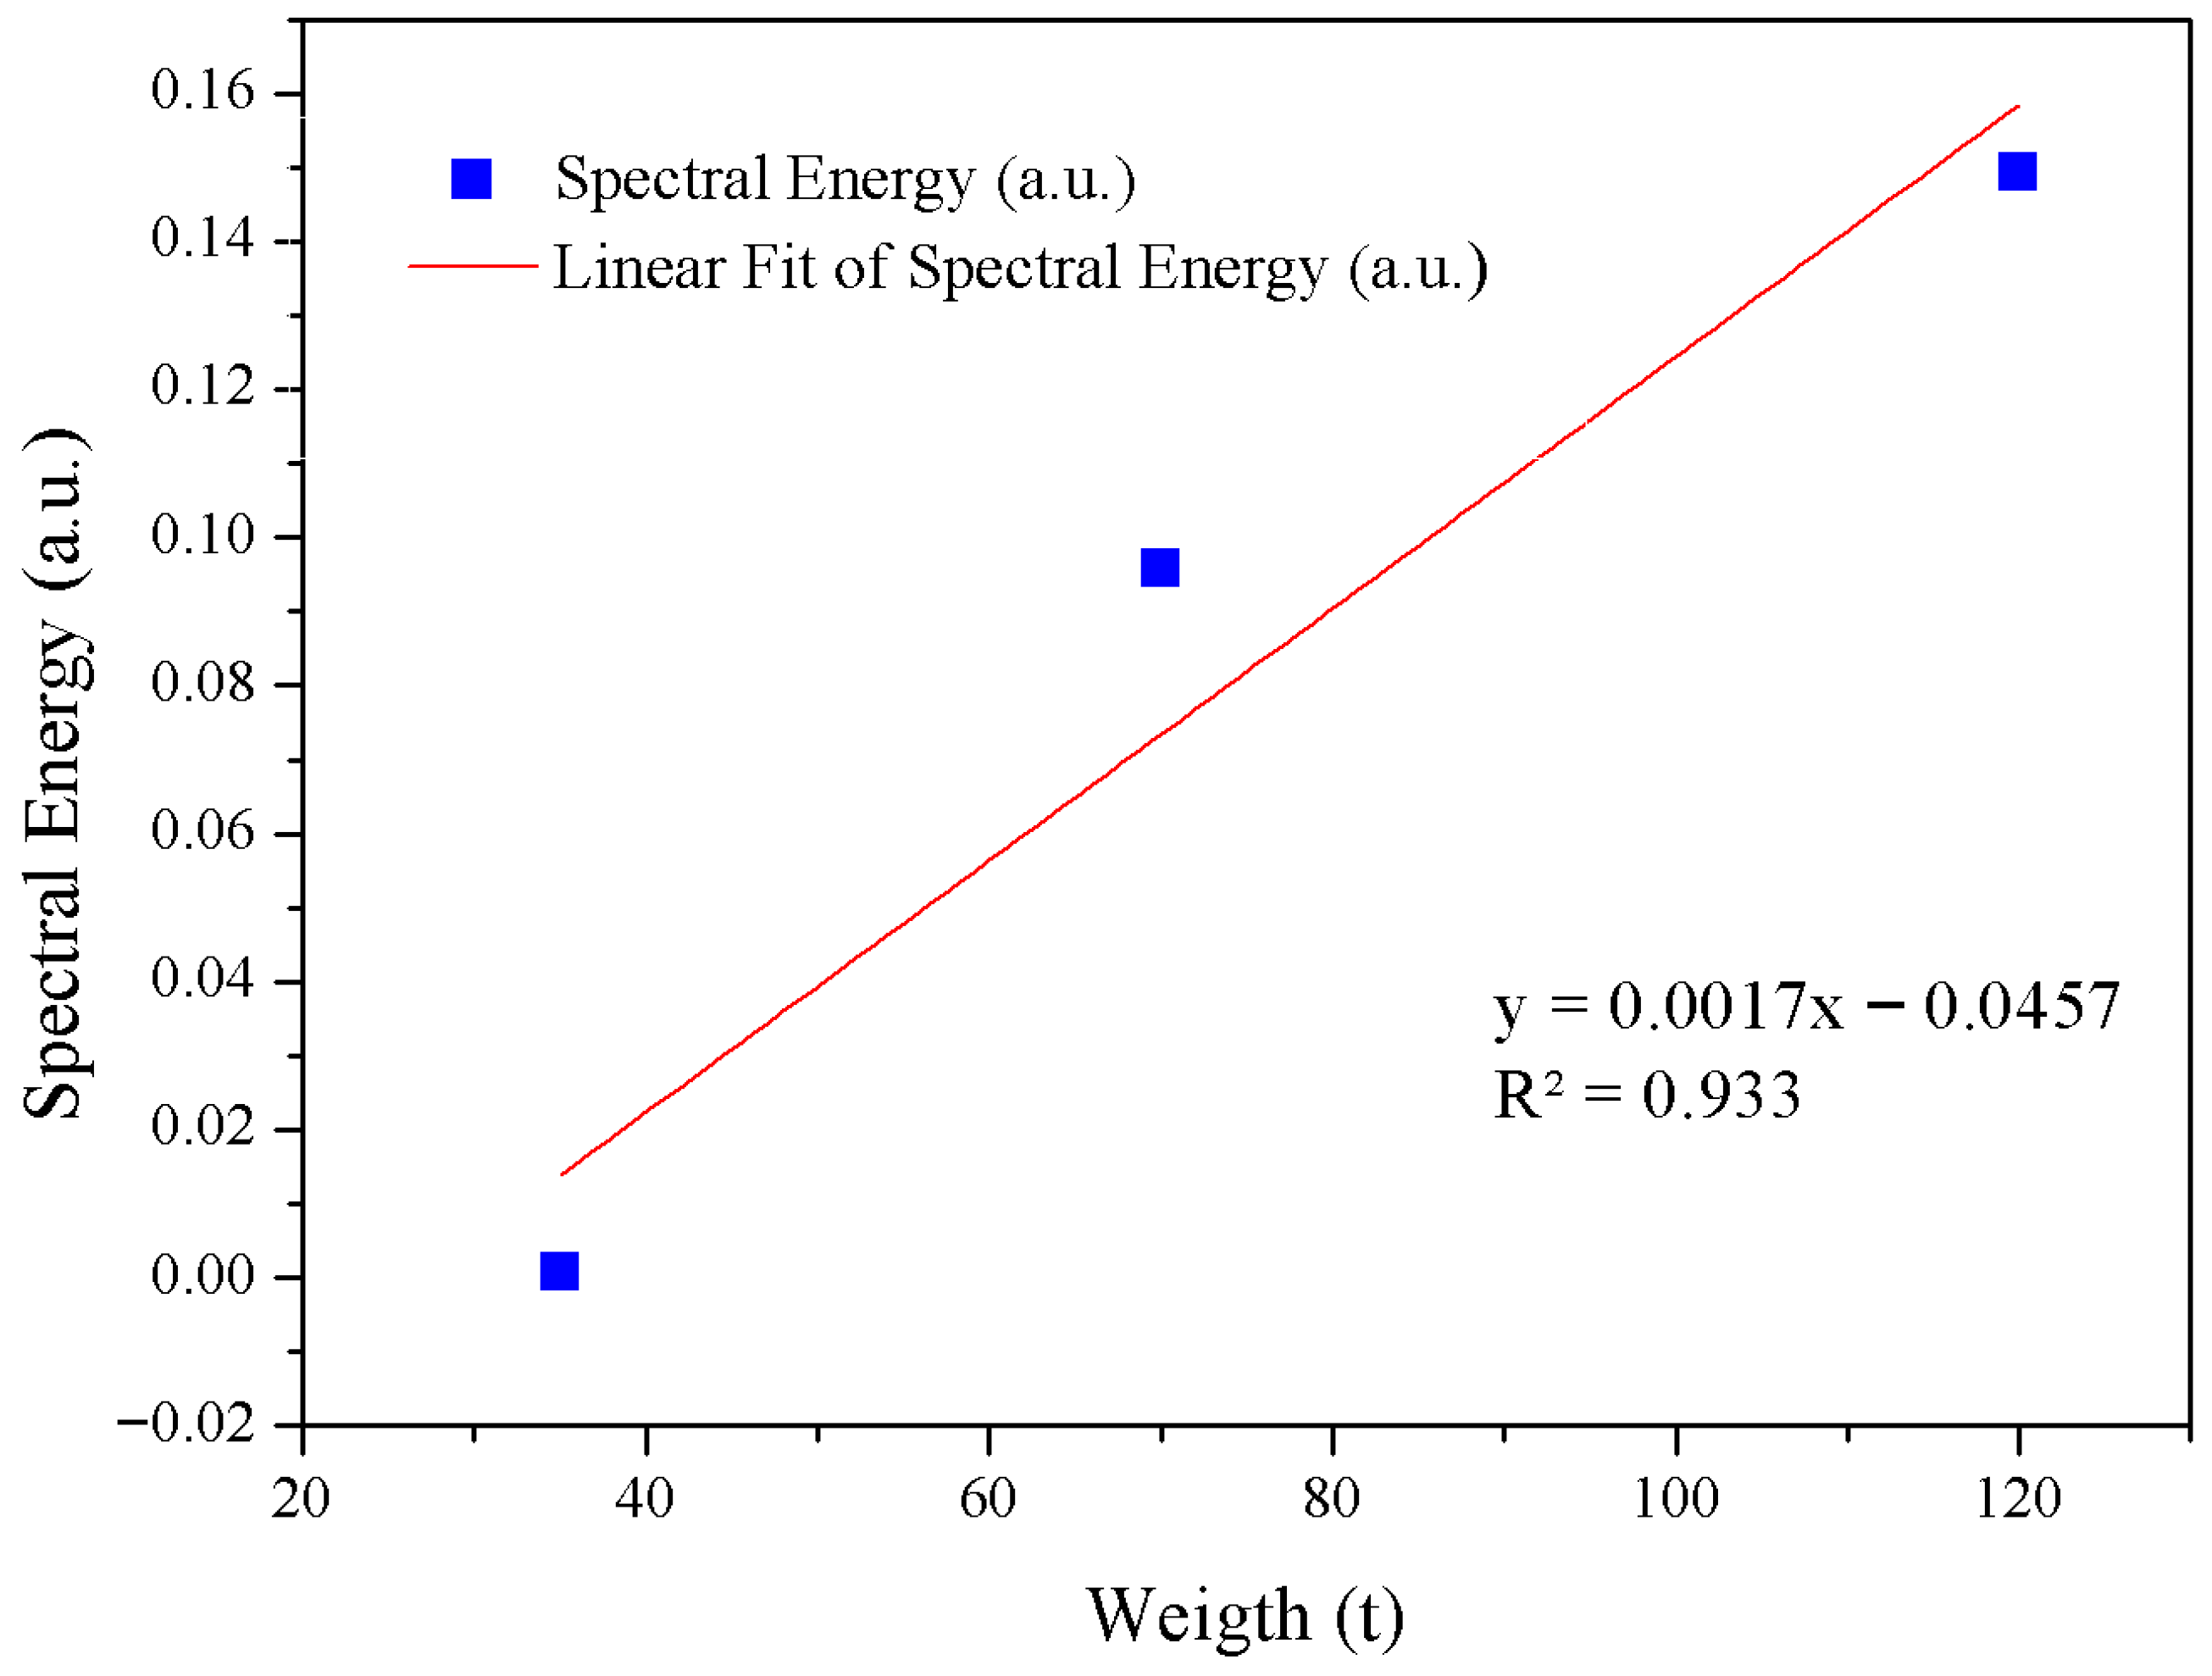
Figure 21 presents the sensitivity analysis of the proposed vibration-based optical sensor, obtained from the correlation between the signal energy and the vehicle weight.
The energy of the vibration signal was defined in the time domain as:
where x(t) represents the measured vibration amplitude, in arbitrary units, acquired by the optical sensor.
According to Parseval’s theorem, the energy computed in the time domain is equivalent to the integral of the squared magnitude of its Fourier transform in the frequency domain. Therefore, in practical implementation, the energy was calculated from the spectral representation as the discrete integral of the squared FFT magnitude within the frequency range of 0–12 Hz.
Only low-frequency components were considered in the analysis because the measured vibration energy is predominantly concentrated in this region. As observed in the spectral response, the signal exhibits progressive attenuation above 12 Hz, with spectral amplitudes approaching the noise floor. This behavior is consistent with the expected dynamic response of rail–wheel interaction at low-to-moderate operating speeds, where structural excitation is dominated by low-frequency vibration modes.
Three types of rail vehicles were analyzed: a maintenance vehicle (35 t), a light rail vehicle (75 t), and a freight train wagon (120 t). The maintenance and freight measurements were conducted under controlled conditions at speeds between 15 and 20 km/h, whereas the LRV data were collected during real operational conditions with an average speed of approximately 40 km/h.
Although vehicle speed influences dynamic excitation, within the investigated low-speed range (15–40 km/h) the effect of vehicle mass is dominant. In this regime, the rail response remains primarily governed by quasi-static load transfer, and the vibration amplitude scales predominantly with applied weight. Consequently, a strong linear correlation between vehicle weight and signal energy is observed. The linear regression shown in
Figure 21 is:
where
E is the spectral energy (a.u.) and
W is the vehicle weight (t). The coefficient of determination
indicates a strong linear relationship.
The slope (0.0017 a.u./t) represents the sensor sensitivity, quantifying the increase in vibration energy per ton of applied load. This confirms that heavier vehicles induce proportionally greater rail vibration, which is accurately captured by the optical sensing system.
The high regression coefficient further demonstrates that, for low-to-moderate operating speeds, vehicle weight is the primary factor governing the measured vibration energy. Therefore, the proposed method enables both quantitative load estimation and practical classification of rail vehicle types based on their spectral energy signatures
7. Conclusions
This study designed, constructed, and experimentally verified a low-cost optical vibration sensor for railway traffic monitoring based on a Single-mode–Multimode–Single-mode (SMS) fiber topology. The sensing method is based on multimodal interference in the multimode fiber segment, where vibrations induced in the rail modify the modal distribution and, consequently, the transmitted optical intensity.
Laboratory tests demonstrated the mechanical stability and sensitivity of the proposed sensor under different mounting and packaging conditions, while field tests conducted on an operational Light Rail Vehicle (LRV) route validated its capability to reliably detect train passages under real conditions. Even in the presence of slow baseline drift, vibration events were robustly identified using signal processing techniques based on first-derivative and sliding-window variance analysis. The recorded time-domain signals exhibited clear modulation during train events, and frequency-domain analysis using the Fast Fourier Transform (FFT) confirmed that the dominant vibrational content is concentrated in the low-frequency range.
Beyond simple event detection, a quantitative relationship between vibration response and vehicle load was established. The spectral energy, computed as the integral of the squared FFT magnitude within the 0–12 Hz band, was correlated with vehicle weight. A strong linear relationship was observed, with a sensitivity of 0.0017 a.u./t and a coefficient of determination . These results demonstrate that the measured vibrational energy scales proportionally with vehicle mass, confirming that load is the dominant factor governing the induced rail vibration within the investigated operating conditions. This finding enables not only train detection but also weight-dependent discrimination and classification based on spectral energy signatures.
The tests performed with freight and maintenance trains further indicated that the proposed sensing approach is not limited to LRV detection, highlighting its applicability to different railway scenarios. The use of commercially available components and a compact embedded acquisition system reinforces the feasibility of practical deployment with reduced installation and maintenance costs.
Overall, the findings show that SMS-based optical fiber sensors constitute a practical and affordable solution for railway monitoring applications. The demonstrated linear sensitivity to vehicle weight expands the functionality of the system beyond traffic detection toward load inference and train-type identification. Future work will focus on long-term field deployment and the development of advanced signal processing and classification techniques, including FFT-based feature extraction and pattern recognition, to enhance automatic vehicle identification and intelligent rail monitoring systems.
8. Patents
A patent application arising from the work reported in this manuscript has been filed. The invention refers to an embedded system for remote monitoring of light rail vehicles using optical sensing, based on an SMS (Single-mode–Multimode–Single-mode) optical fiber vibration sensor. The patent was filed as an Invention Patent (PI) with the Brazilian National Institute of Industrial Property (INPI) under process number BR 10 2026 000193 7, entitled “Sistema Embarcado para Monitoramento Remoto de Veículos Leves sobre Trilho Utilizando Sensoriamento Óptico”, and is currently under examination.



 ,
,