Article

A Multi-Scale Edge-Band-Preserving Phase Restoration Method Based on Fringe Projection Phase Profilometry


Faculty of Intelligent Transportation, Anhui Sanlian University, Hefei 230601, China
*
Author to whom correspondence should be addressed.
Photonics 2026, 13(2), 159; https://doi.org/10.3390/photonics13020159
Submission received: 2 December 2025 / Revised: 2 February 2026 / Accepted: 4 February 2026 / Published: 6 February 2026
(This article belongs to the Section Lasers, Light Sources and Sensors)

Abstract

Phase unwrapping is the decisive factor for achieving dimensional accuracy in phase-shifting profilometry, yet unavoidable phase jumps occur at discontinuities. Existing dual-frequency heterodyne techniques suffer from a narrow measurement range and overly coarse projected fringes due to grating superposition requirements, leading to large errors when scanning objects with hole-like features. To address these issues, this paper proposes an edge-oriented phase-unwrapping error-compensation method based on fringe projection phase profilometry. First, the wrapped phase of the measured object is acquired via phase-shifting profiling. The wrapped phase map is then smoothed at multiple scales using Gaussian filters, and parallel Canny edge detection combined with phase gradient thresholding is applied to comprehensively capture both coarse and fine discontinuities. Morphological closing fills in breakpoints, followed by skeleton thinning and connectivity reconstruction to generate an edge band of defined width. Within this band, edge-preserving smoothing is performed using guided filtering or bilateral filtering, and the result is fused with the original phase through Gaussian weighting based on the distance to the skeleton. Finally, an ordered multi-frequency heterodyne unwrapping restores the absolute phase, maximally preserving true discontinuities while effectively correcting noise and detection errors. Experiments show that this method overcomes edge-induced phase jumps—with jump-error correction rates exceeding 96.7%—exhibits strong noise resilience under various conditions, and achieves measurement precision better than 0.06 mm.

1. Introduction

Phase-shifting profilometry [1,2,3,4,5,6], a widely used structured-light 3D measurement technique, offers non-contact operation, high precision, and low cost, making it suitable for medical imaging, field engineering, and online measurement. It projects a series of sinusoidal fringe patterns with known phase shifts onto the object surface and captures images at each phase step; a phase-shifting algorithm then computes a wrapped phase for each pixel, confined to [−π, π] and lacking global uniqueness, so phase unwrapping is required to recover continuous 3D information. Common unwrapping methods fall into spatial-domain approaches—processing a single wrapped phase map by exploiting phase continuity between neighboring pixels with algorithms, such as quality-guided, tree-cut, region-growing, and minimum-norm, which remove local 2π discontinuities along selected paths or via global optimization—and temporal-domain approaches—acquiring two or more wrapped phases at the same location but with different fringe frequencies (or phase-shift increments) and performing heterodyne unwrapping or multi-step iterative summation to unwrap the entire phase field at once. Among them, the multi-frequency heterodyne unwrapping method, valued for its versatility and high accuracy, is widely adopted; however, its direct application often suffers from local phase jumps caused by environmental noise, fringe-contrast variations, and phase-offset errors introduced by different frequencies. Therefore, compensation strategies such as edge detection, weighted least squares, or weighted global optimization must be applied to finely correct the preliminary unwrapped result and produce a high-precision, jump-free phase map.
Addressing the phase jump that occurs during phase-unwrapping, Li et al. [7] proposed a single-model self-recovering fringe projection profilometry absolute phase recovery method (FPSR-Net), which takes only one high-resolution fringe image as input, generates four self-recovering patterns via a deep network, and recovers the absolute phase in a single step—thereby eliminating the complexity, heavy acquisition requirements, and noise sensitivity of traditional multi-frequency/multi-step methods; however, it depends strongly on large-scale training data and high-performance GPUs, can suffer accuracy degradation under domain shifts between synthetic and real fringes, and may introduce slight boundary artifacts during image patch reassembly. In contrast, Bone et al. [8] introduced a two-dimensional unwrapping algorithm based on Fourier fringe analysis that builds a reliability mask from local phase information to screen out inconsistent regions, enabling fast, simple computation and tolerating average SNRs down to 2:1, even in discontinuous, noisy areas—yet this approximate masking cannot guarantee exact phase recovery in all strong-discontinuity or very low-SNR scenarios and may leave residual errors if mask thresholds are improperly chosen. Wang developed an end-to-end convolutional neural network that unwraps a single-frequency wrapped phase directly into continuous phase, obviating multi-step procedures and improving robustness to noise, contrast variations, and local discontinuities; its drawbacks include reliance on extensive labeled data and GPU resources, unproven generalization to unseen or extreme fringe patterns, and real-time performance and resource demands that hinder industrial deployment. Wang et al. [9] proposes an end-to-end deep learning phase-unwrapping network: by training a convolutional neural network (CNN), it takes only a single-frequency wrapped phase map as input and directly outputs the complete unwrapped phase, thereby eliminating the cumbersome acquisition and iterative computation of traditional multi-frequency/multi-step methods and significantly improving unwrapping accuracy under noise, fringe-contrast variations, and local discontinuities; however, it depends on large volumes of labeled training data and high-performance GPUs for training and inference, its generalization to unseen complex fringe patterns or extreme environments remains to be validated, and its real-time performance and resource demands still hinder industrial adoption. Lei et al. [10] presented a novel reliability-histogram-driven algorithm that computes pixel-wise reliability values, constructs a histogram to auto-select thresholds for adaptive branch cuts, and then unwraps phase along the optimized cutting graph—thereby accurately locating and eliminating 2π jumps caused by noise or discontinuities—though its performance depends on the precision of the reliability metric, histogram binning and thresholding may fail under extremely low SNR or complex phase distributions, and the added histogram computations and iterations increase overhead and limit real-time use. Finally, Huang et al. [11] proposed a parallel branch-cut algorithm using simulated annealing to optimize global cutting paths in large-scale phase fields, addressing the computational explosion and local-optimum traps of traditional methods; however, simulated annealing is sensitive to temperature schedules and iteration parameters, converges slowly, and its parallel implementation incurs significant communication and synchronization overhead, requiring substantial computing resources and yielding limited benefits under resource-constrained or very large-scale conditions. Zhao et al. [12] proposed a quality-guided phase unwrapping framework that computes multiple quality metrics for each pixel in the wrapped phase map—such as phase gradient, signal-intensity pseudo-color, and neighbor-pixel consistency—to generate a quality map, then employed various guiding strategies (e.g., high-to-low first, regional fusion) to plan unwrapping paths. This effectively prevents error propagation in noisy regions and at phase discontinuities, enhancing the robustness and accuracy of the unwrapping. However, its drawbacks are that quality-map construction depends heavily on the chosen metrics and remains sensitive to noise and texture variations; different combinations of quality maps and guiding strategies require extensive empirical tuning; and the computational overhead of path planning and quality evaluation is high, making it hard to achieve ultra-real-time performance. To address jump-type errors in phase unwrapping, Han et al. [13] proposed a correction method based on multi-frequency heterodyne unwrapping. This method computes the local slope from the wrapped phases of adjacent pixels and determines the integer fringe order of the composite pattern; by comparing these two values, it identifies and corrects phase jumps, thereby eliminating them. However, when environmental noise increases, fringe contrast decreases, or the test surface reflectivity is non-uniform, the local slope and integer-order estimates can be misjudged—leading to incorrect corrections—and the method is not suitable for measuring objects with highly uneven surfaces.
In recent years, to address three-dimensional measurement under large depth ranges, constrained acquisition conditions, and complex reflective environments, a number of advanced structured-light reconstruction methods have been proposed from the perspectives of projection strategies and system design. Tan et al. [14] introduced a binary-focusing projection-based 3D reconstruction framework combined with unpaired data learning, which significantly relaxes the strict correspondence between projected fringe patterns and captured images while achieving high-accuracy reconstruction over a large depth range. Su et al. [15] proposed a separable Hadamard single-pixel imaging approach that enables high-resolution reconstruction with reduced measurement complexity, demonstrating strong potential for compressed sensing and resource-limited scenarios. Furthermore, Tan et al. [16] developed a spectral-division multiplexing-based regional projection method for 3D measurement, which effectively suppresses multiple-reflection interference in complex scenes and substantially improves measurement reliability in regions affected by mutual reflections.
Although these methods have considerably advanced structured-light 3D measurement in terms of projection coding, data acquisition, and system robustness, their improvements are mainly focused on the data acquisition and reconstruction framework levels. In measurement pipelines based on fringe projection profilometry, the extraction of the wrapped phase and subsequent phase unwrapping remain critical steps that directly determine reconstruction accuracy. This is particularly true for objects with holes, sharp edges, or strong geometric discontinuities, where phase jumps frequently occur in edge regions and cannot be fully eliminated through projection- or system-level optimization alone.
To address jump-type errors during phase unwrapping, the proposed method first employs fringe-projection profilometry to obtain the wrapped phase map of the object and applies multi-scale Gaussian smoothing. In parallel, Canny edge detection with a phase-gradient threshold is used to capture discontinuities at all scales. Morphological closing then generates a fixed-width edge band; by filling gaps, refining the skeleton, and restoring connectivity, the edge regions are regularized. Within this band, guided or bilateral filtering smooths the phase while preserving edges, and the filter output is fused with the original phase via Gaussian weighting based on skeleton distance, suppressing noise yet retaining true jump details. Finally, an ordered unwrapping is performed using a multi-frequency heterodyne. This approach effectively corrects noise and detection errors while maximally preserving genuine phase jumps, significantly improving the accuracy and robustness of phase recovery and unwrapping in edge areas.

2. Basic Principles and Methods

2.1. Wrapped Phase Determination

The N-step phase-shifting method [17] is currently the most widely used technique for obtaining wrapped phase values. Its principle is to compute, for each pixel, the phase from N fringe images that have known relative phase shifts, and then use these phase measurements to reconstruct the object’s three-dimensional shape. For the special case of four phase shifts, the gray-level intensities at each image coordinate (m,n) are given by Equation (1):
I i ( m , n ) = I ( m , n ) + I ( m , n ) cos [ φ ( m , n ) + β ]
In this expression, Ii(m,n) is the gray-level intensity of the i-th fringe image at pixel(m,n); I′(m,n) denotes the background intensity; I″(m,n) is the fringe modulation amplitude; φ(m,n) is the wrapped phase to be determined; and β is the phase shift increment (initial phase). The phase calculation for the four-step phase-shifting method is then given by Equation (2):
φ ( m , n ) = arctan [ I 4 I 2 I 1 I 3 ]
In this expression, I1, I2, I3, and I4 denote the intensity values of the four phase-shifted fringe images. Due to the principal-value property of the arctangent, from Equation (2) and standard trigonometric identities [18], the computed wrapped phase φ(m,n) lies within [−π, π]. However, the projected fringe pattern spans multiple periods, so phases measured beyond the first period differ from the true phase by integer multiples of 2π. Consequently, the wrapped phase must be unwrapped to obtain a continuous absolute phase map.

2.2. Principle of Heterodyne Phase Solution

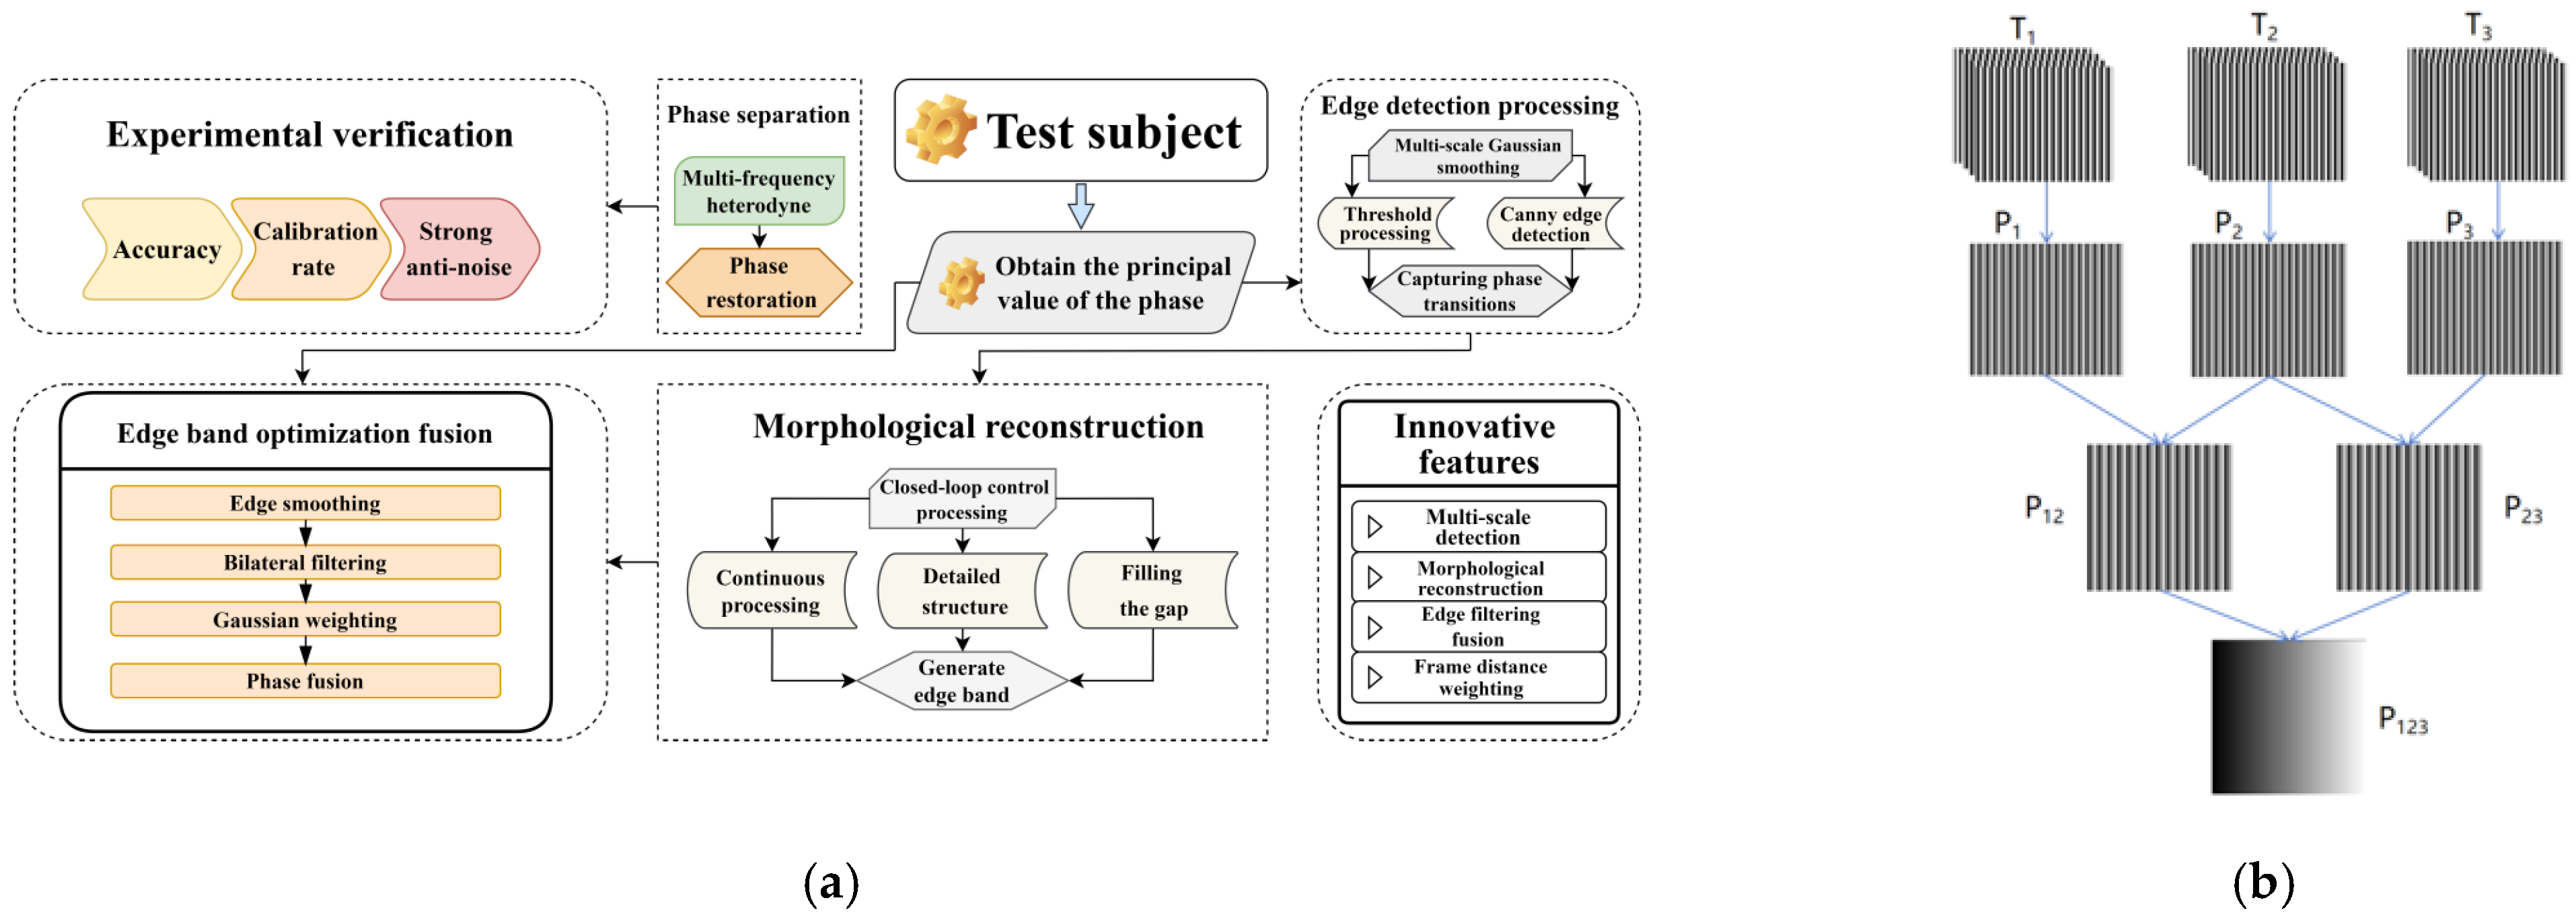
The principle of heterodyne phase unwrapping [19] refers to superimposing fringe patterns of multiple different frequencies to solve for the unique absolute phase across the entire field; in this paper, a three-frequency heterodyne unwrapping is used to obtain the absolute phase, as shown in Figure 1:
First, sinusoidal gratings with pitches T1, T2, and T3 are respectively projected onto the measured object. By superposition, the wrapped phases P1 and P2 generate a grating 12 with pitch P12, and the wrapped phases P2 and P3 generate a grating 23 with pitch P23, where P1 < P2 < P3 < P12 < P23 < P123. According to the dimensions of the measured object, the fringe projection range must be determined so that the object lies in the central region of the projection and the projected fringes fully cover it. The synthetic grating pitch can be calculated by Equation (3); when it is slightly larger than the projector resolution, the synthetic grating will exactly cover the entire field of view.
P 12 = P 1 P 2 P 2 P 1   P 23 = P 2 P 3 P 3 P 2
For any point on the measured object, the following relationship holds:
P 1 n 1 = P 2 n 2 = P 3 n 3 = P 12 n 12 = P 23 n 23
Δ n i = φ i 2 π ,   i = 1 , 2 , 12 , 23 , 123
θ i = 2 π n i = 2 π ( Δ n i + N i ) N i Z
Δ n 12 =         Δ n 1     Δ n 2 , Δ n 1     Δ n 2 Δ n 1     Δ n 2   +   1 ,     Δ n 1   <   Δ n 2 Δ n 12 =                 Δ n 2 Δ n 3 ,       Δ n 2     Δ n 3 Δ n 2   Δ n 3   +   1 ,     Δ n 2   <   Δ n 3
where φi and θi refer to the wrapped phase and absolute phase; ni is the fringe order of the corresponding grating; Δni and N represent the decimal part and integer part of the fringe order, respectively. Grating 123 is generated by the superposition of grating 12 and grating 23. A suitable choice of T1, T2, and T3 allows the grating pitch of grating 123 to cover the full field. At this time, N = 0, so the following applies:
Δ n 123 =           Δ n 12 Δ n 23 ,       Δ n 12 Δ n 23 Δ n 12 Δ n 23 + 1 ,   Δ n 12 < Δ n 23
n 12 = P 23 ( N 123 + Δ n 123 ) P 23 P 12
N12 = floor(n12)
θ 12 = 2 π × N 12 + φ 12

2.3. Multiscale and Gradient Fusion for Edge Detection

2.3.1. Multi-Scale Gaussian Smoothing

Multi-scale Gaussian smoothing [20] is achieved by low-pass filtering the phase map at different scales (different σ values) separately, on the one hand, preserving the fine features and removing the high-frequency noise at small scales, and on the other hand, further smoothing out the medium-scale textures and artifacts at large scales; this multilevel preprocessing can capture both rough and fine edges simultaneously, and also significantly improve the subsequent edge detection and This multi-layered pre-processing can capture both rough and fine edges simultaneously, and significantly improve the robustness of subsequent edge detection and phase restoration, providing a comprehensive and reliable basis for phase jumps of different sizes and intensities. The formula is
G δ ( m , n ) = 1 2 π σ 2 e m 2 + n 2 σ 2 * I ( m , n ) ,     θ δ ( m , n ) = G δ ( m , n ) θ δ ( m , n )
where θ is the absolute phase map, θδ is the Gaussian-filtered image, and where б is the standard deviation of the Gaussian filter, where the larger б is, the more high frequencies are filtered out, and the smaller б is, the more detail is retained.

2.3.2. Multi-Scale and Gradient Fusion

In the scale-space Canny detection, the standard Canny operator is first applied to each Gaussian-smoothed phase map Φσ: the Sobel filter is used to compute, at each pixel, the gradient [21] magnitude and direction. The magnitude represents the rate of gray-level change, and the direction indicates the orientation of that change. The horizontal gradient Gm and vertical gradient Gn are computed as follows:
G m = ( I * G m ) ( m , n ) , G n = ( I * G n ) ( m , n )
Non-maximum suppression is then performed along the gradient direction, retaining only local maxima. Next, a double-thresholding classifies pixels: those above the high threshold are marked as strong edges, those between the high and low thresholds that are connected to strong edges are marked as weak edges, and all others are set to zero. Finally, edge tracking by hysteresis connects weak edges to strong ones, producing a binary edge map at that scale. Repeating this process for all scales and taking the union of the resulting edge maps preserves both the “coarse” edges from large-scale smoothing and the “fine” edges from small-scale smoothing, greatly enhancing the completeness and robustness of the overall edge detection.

2.4. Edge Restoration

After edge detection is complete, morphological dilation using a structuring element [22] is applied to expand the edge regions, ensuring that pixels near each edge are properly restored. The dilation operation can be expressed as
A B = { m , n | ( B ) m n A }
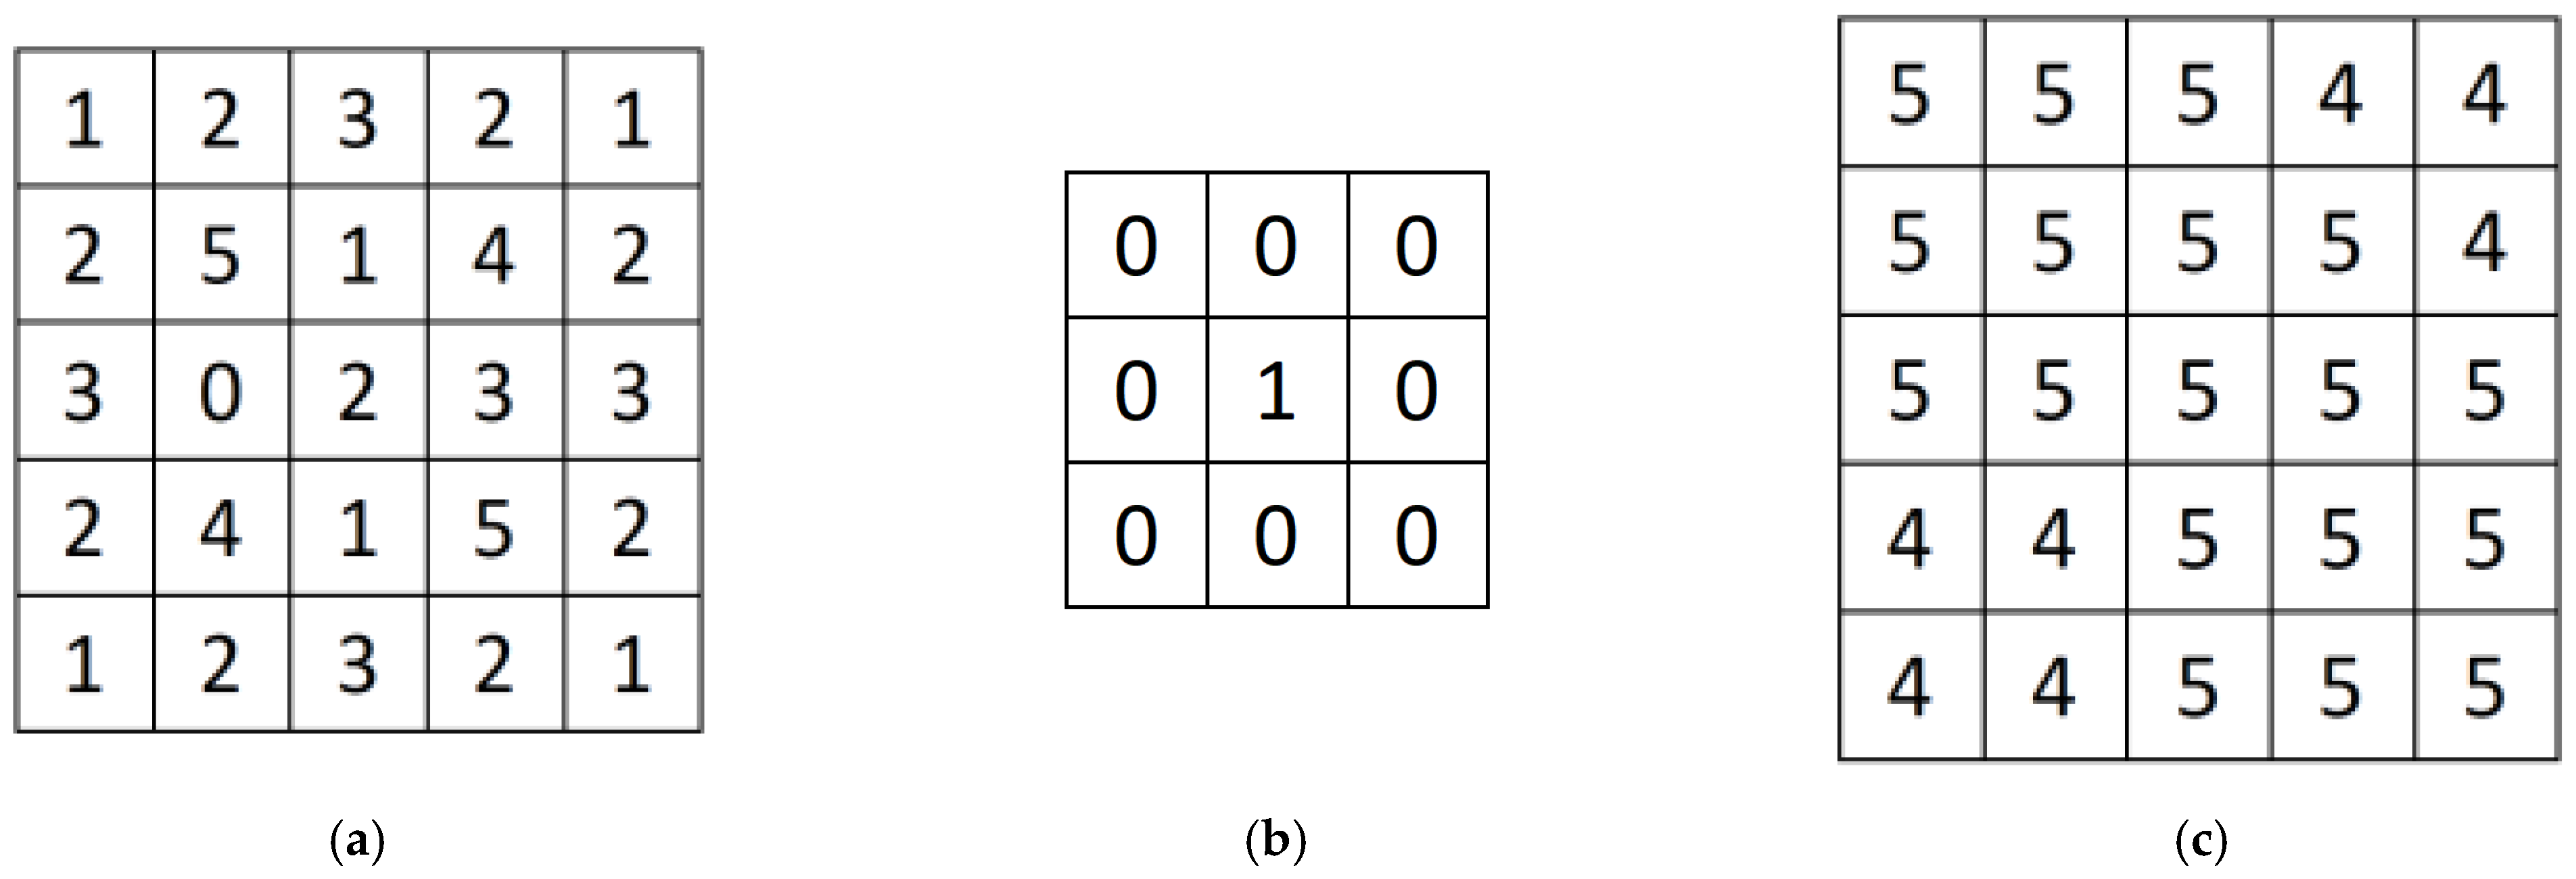
In grayscale morphology, erosion can be analogized to convolution. First, a structuring element B is defined with specific values and a designated origin. During the operation, B is slid over image A. For each position of B on A, the values of B are subtracted from the corresponding values in A to form a new matrix of the same size as B. Then, the minimum value from this matrix is selected and assigned to the position in A corresponding to the origin of B. As a result, the processed region of A is mapped to local minima according to the shape and relative position of B. Figure 2 illustrates the process of grayscale dilation.
After the dilation operation, an adaptive median filter is applied to optimize the edges. The adaptive median filter is a noise-removal technique that preserves edges, making it particularly suitable for eliminating errors introduced by fringe projection and phase calculation. The algorithm starts by selecting a small window—typically 3 × 3—centered on a pixel. Within this window, it computes the minimum, maximum, and median values. It then performs a Level A check: if the median lies between the minimum and maximum, it proceeds to Level B; otherwise, the window size is increased, and the statistics are recomputed. At Level B, if the current pixel value also falls between the minimum and maximum, the pixel remains unchanged; if not, it is replaced by the window’s median. This process is repeated for each pixel in the image until all have been processed, effectively reducing noise while preserving fine details and edges.

2.5. Edge-Band Phase Restoration Based on Guided and Bilateral Filtering

2.5.1. Construction of the Edge Band

In order to perform accurate restoration in regions of high phase discontinuity, the fused binary edge map B(m,n) is first thinned to obtain a single-pixel-wide skeleton S(m,n). This skeleton is then dilated with a circular structuring element Dr of radius r to form the band region:
B(m,n) = S(m,n) |⊕| Dr
where “⊕” denotes morphological dilation, S(m,n) = 1 marks skeleton pixels, Dr is a disk of radius r, and B(m,n) = 1 defines the edge-band region. This operation expands the skeleton from a single pixel to a band of width 2r + 1, precisely localizing the high-gradient discontinuities.

2.5.2. Guided Filter

In the edge band region, the guided filter [23] assumes that the output q and the guidance image I satisfy a linear model over each local window ωk:
q i = a k I i + b k
And the coefficients are determined by minimization:
m i n a k , b k i ω k ( a k I i + b k Φ i ) 2 + ε a k 2
The resulting linear coefficients are
a k = [ ( 1 / | ω k | i ω k I i Φ i μ I , k μ Φ , k ] / ( σ I , k 2 + ε ) ,       b k = μ Φ , k a k μ I , k
Then take the mean values ā , b ¯ for all windows covering pixel i and the final output:
Φ g f ( i ) = ā i Φ ( i ) + b i ¯
where Ii and θi are the intra-window guided map and original phase, respectively; μI,k and μθ,k are the intra-window means; σ I , k 2 is the guided map variance; ε is the regularization term; and |ωk| is the number of pixels in the window, which ensures that the edge-preserving and, at the same time, band-area noise is smoothed.

2.5.3. Bilateral Filter

The maximum effect of bilateral filtering [24] within the edge band utilizes spatial distance weights to ensure that only neighboring pixels are smoothed, and cuts off the filtering naturally at the hopping position through phase difference weights, so that the true phase mutation edges are not blurred, while noise and small errors are effectively suppressed during the filtering process; thus, in phase restoration, the bilateral filtering is able to provide a transition effect that is both smooth and does not damage the geometrical features.
Bilateral filtering combines the dual weights of spatial distance and phase difference to perform weighted averaging of pixel i within the band region:
Φ b f ( i ) = ( 1 / W i ) j Ω i e x p ( | | x i x j | / ( 2 σ s 2 ) ) · e x p ( | Φ ( i ) Φ ( j ) | 2 / ( 2 σ r 2 ) ) · Φ ( j )
where W i = j Ω i e x p ( | | x i x j | / ( 2 σ s 2 ) ) · e x p ( | Φ ( i ) Φ ( j ) | 2 / ( 2 σ r 2 ) ) .
In the above equation, Ωi is the neighborhood, xi and xj are the pixel coordinates, ||·|| is the Euclidean distance, σs controls the spatial extent, σr controls the phase similarity, and Wi is the normalization factor, which ensures that the phase amplitude is not shifted after filtering in order to suppress the noise while protecting the edges.

2.5.4. Restoration Process

Within the band area B, Φgf and Φbf are calculated separately and then fused by proportion λ:
Φ f i l t ( i ) = λ Φ b f ( i ) + ( 1 λ ) Φ b f ( i )
The final output is as follows:
Φ o u t ( i ) = { Φ f i l t ( i ) , ( x , y ) B Φ ( i ) , ( x , y ) B
where λ ∈ [0, 1] controls the balance of filtering weights and B is the edge band region, through which the process can take into account the advantages of the two filters and ensure that the out-of-band region maintains the original phase, realizing accurate and robust phase restoration in the edge band.
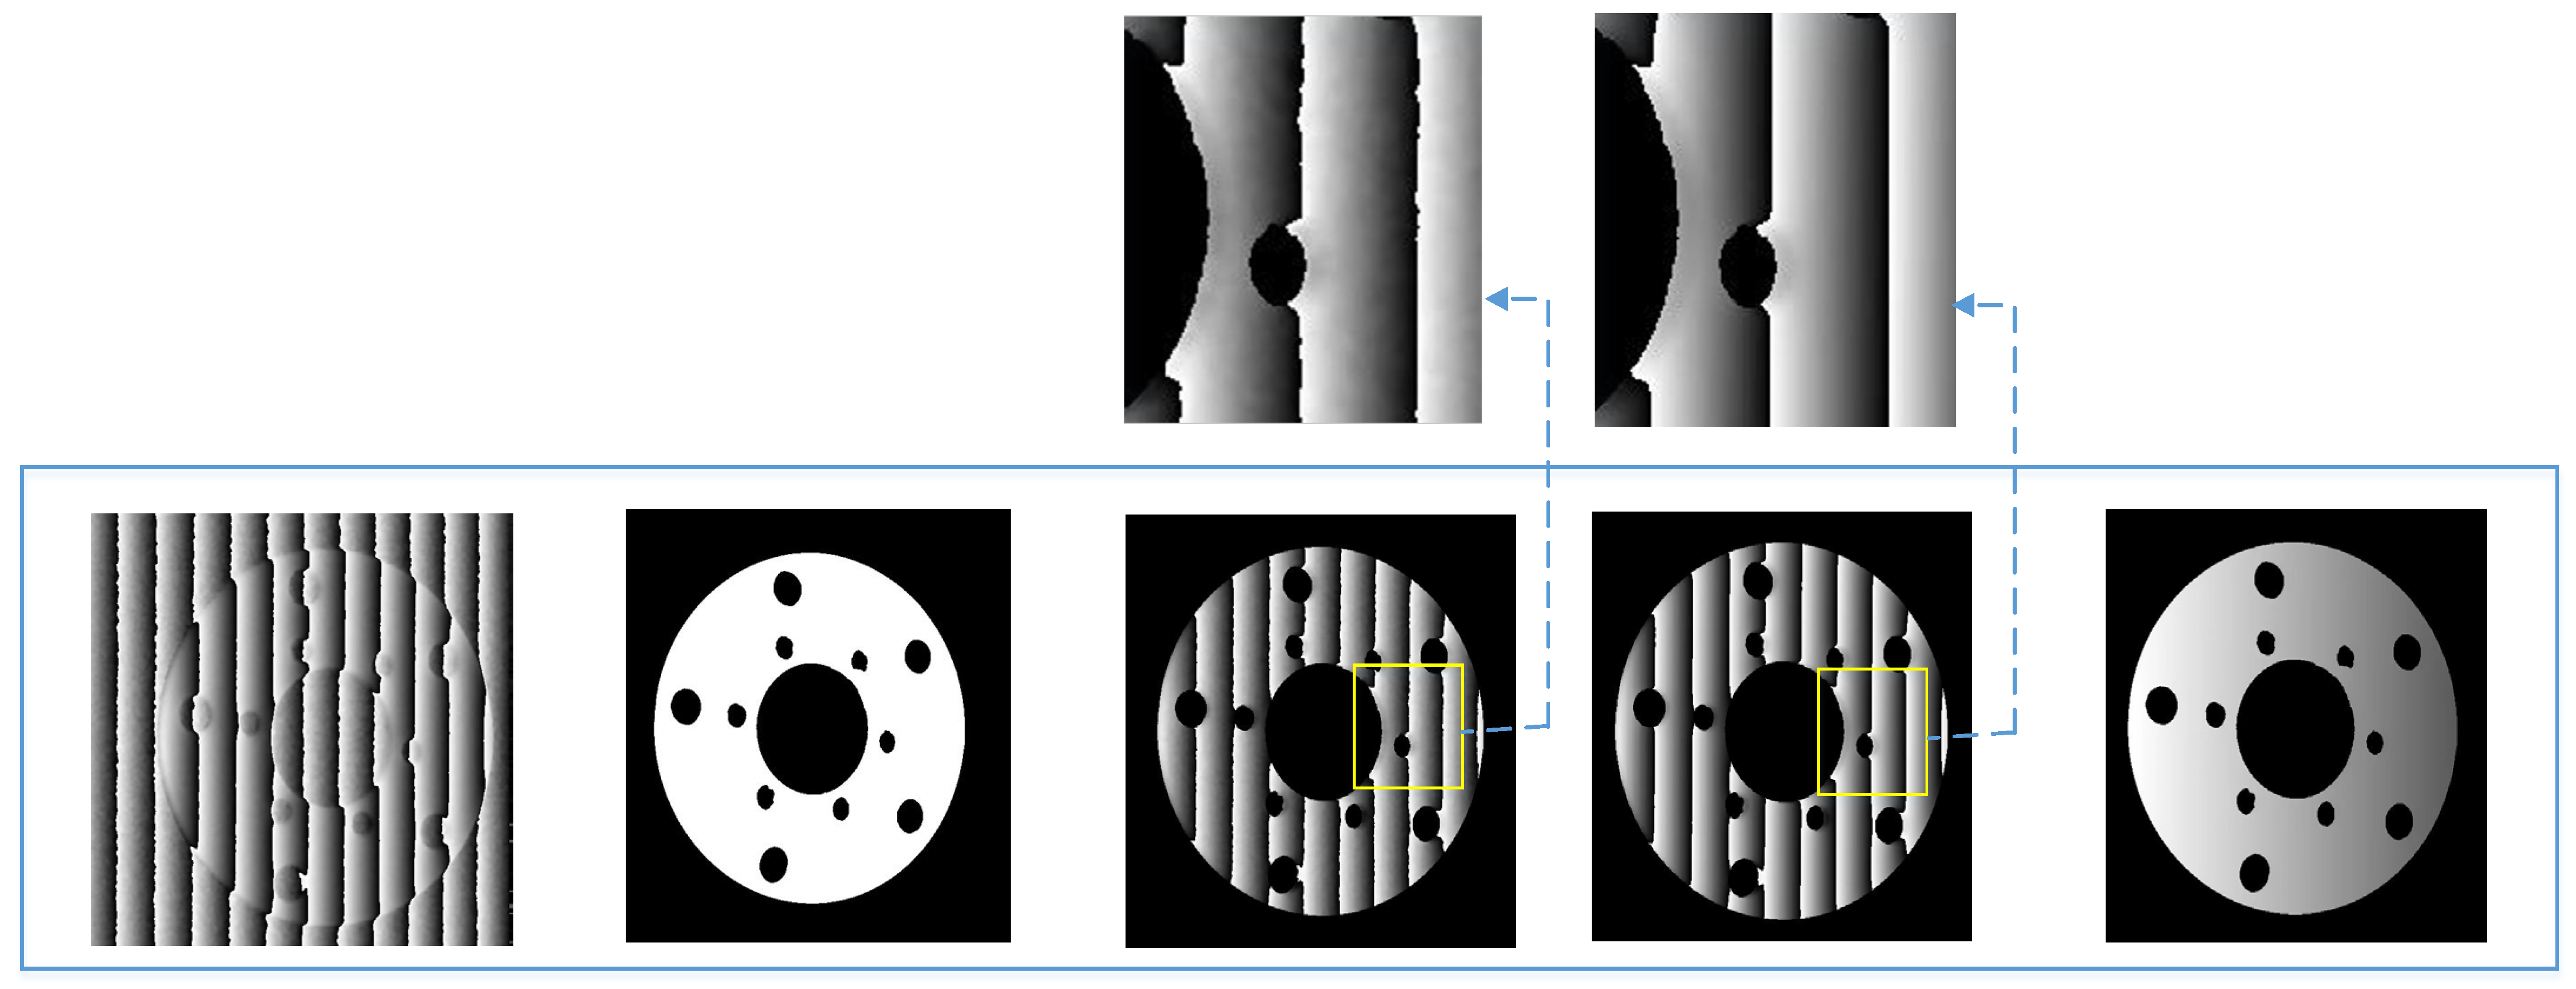
As shown in Figure 3, the first image is the original wrapped phase map, where localized noise spots and discontinuous jumps appear on the object surface; the second image is the edge-band mask generated by multi-scale Canny and phase gradient fusion followed by closing, thinning, and dilation, whose white regions accurately delineate all high-gradient “problem bands”; the third image multiplies this mask with the original phase, retaining only the jumps and noise within the band; the fourth image shows that after applying edge-preserving guides, combined with bilateral filtering within the band, the noise spots have been smoothed out while the true edges remain sharp; in the final step, the filtered band is phase-unwrapped using the multi-frequency heterodyne method, and the resulting restored map both preserves the global shape details and removes edge errors, laying a solid foundation for subsequent high-quality 3D reconstruction.

3. Experiments and Result Analysis

3.1. Simulation Experiments

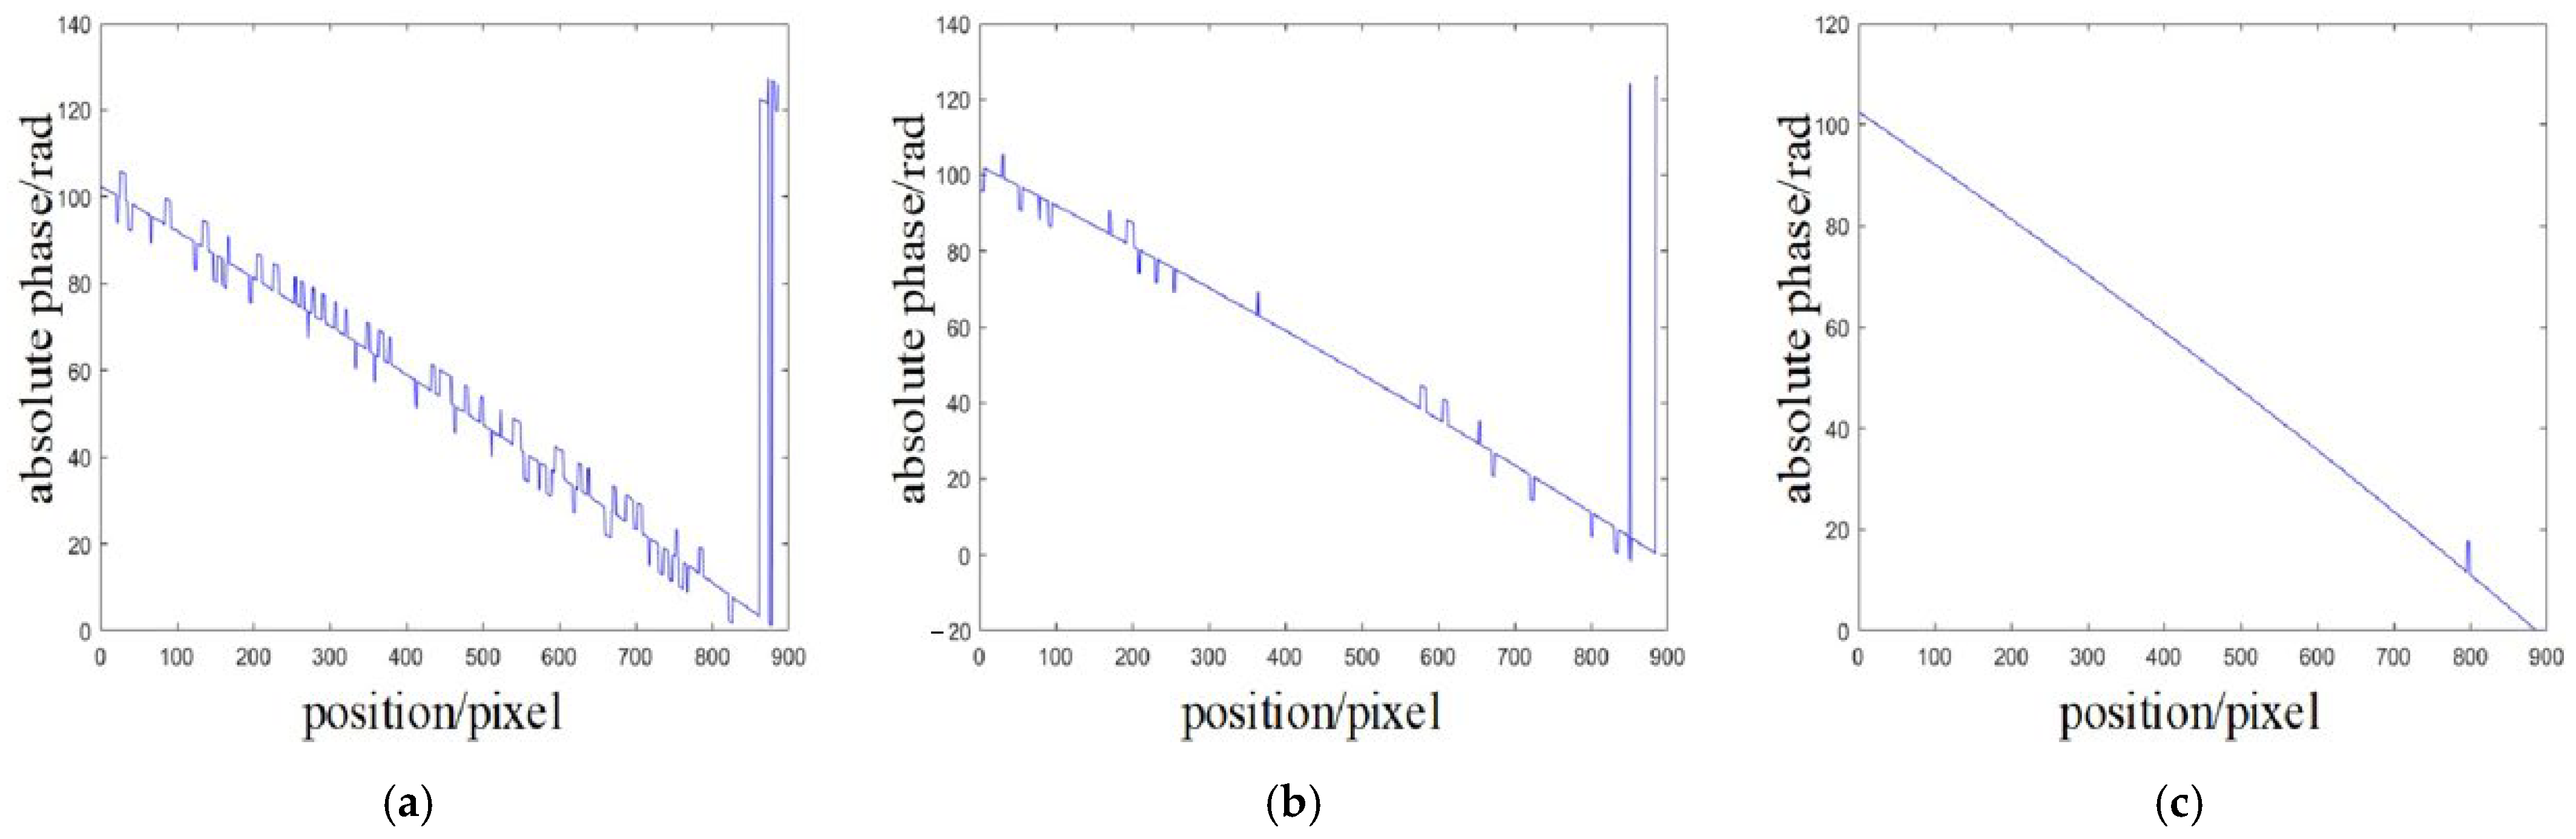
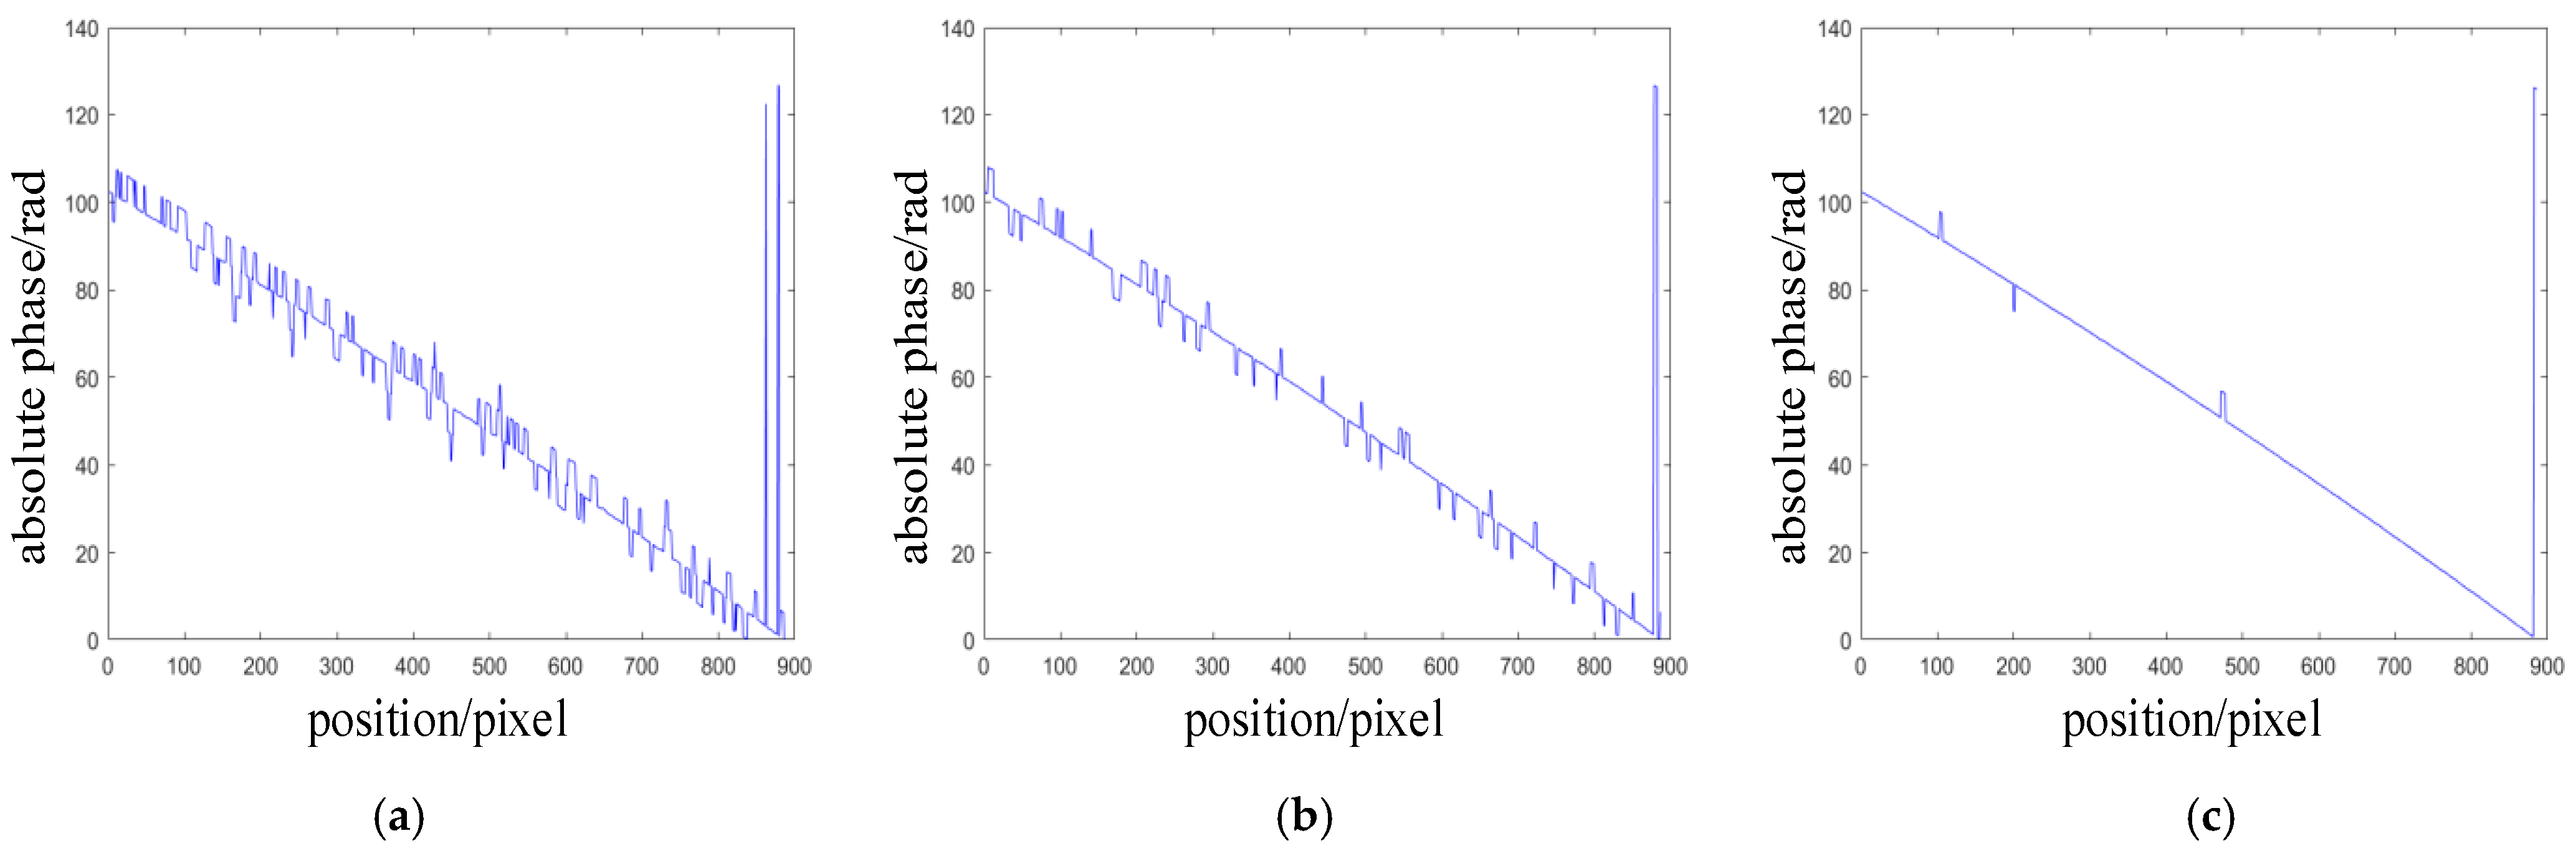
In order to verify the feasibility of the above method, three sets of four-step phase-shift patterns are designed with three grating pitches of 24 pixels, 26 pixels and 28 pixels, respectively. Different random noises are added to the phase-shifted patterns, and the phase principal values of the three groups of gratings are obtained according to the four-step phase-shifting method; then, the three-frequency outlier principle [25,26] is utilized to expand the phase principal values, and the absolute phase is compensated for the error with the method in this paper. The calculated number of jump points is shown in Table 1, and the absolute phase is shown in Figure 4, Figure 5 and Figure 6; the “Traditional method” refers to the standard three-frequency heterodyne method without any error compensation, while the “Method of [13]” is used for comparison as cited in reference [13]:
From Table 1, it can be seen that, compared with the traditional method, the proposed method achieves a jump-correction rate of over 96.7% for absolute phase discontinuities, and when subjected to random noise with varying means and variances, only a small number of jump points remain uncorrected. Moreover, compared with the method in Reference [13], the proposed method corrects a greater number of discontinuities.
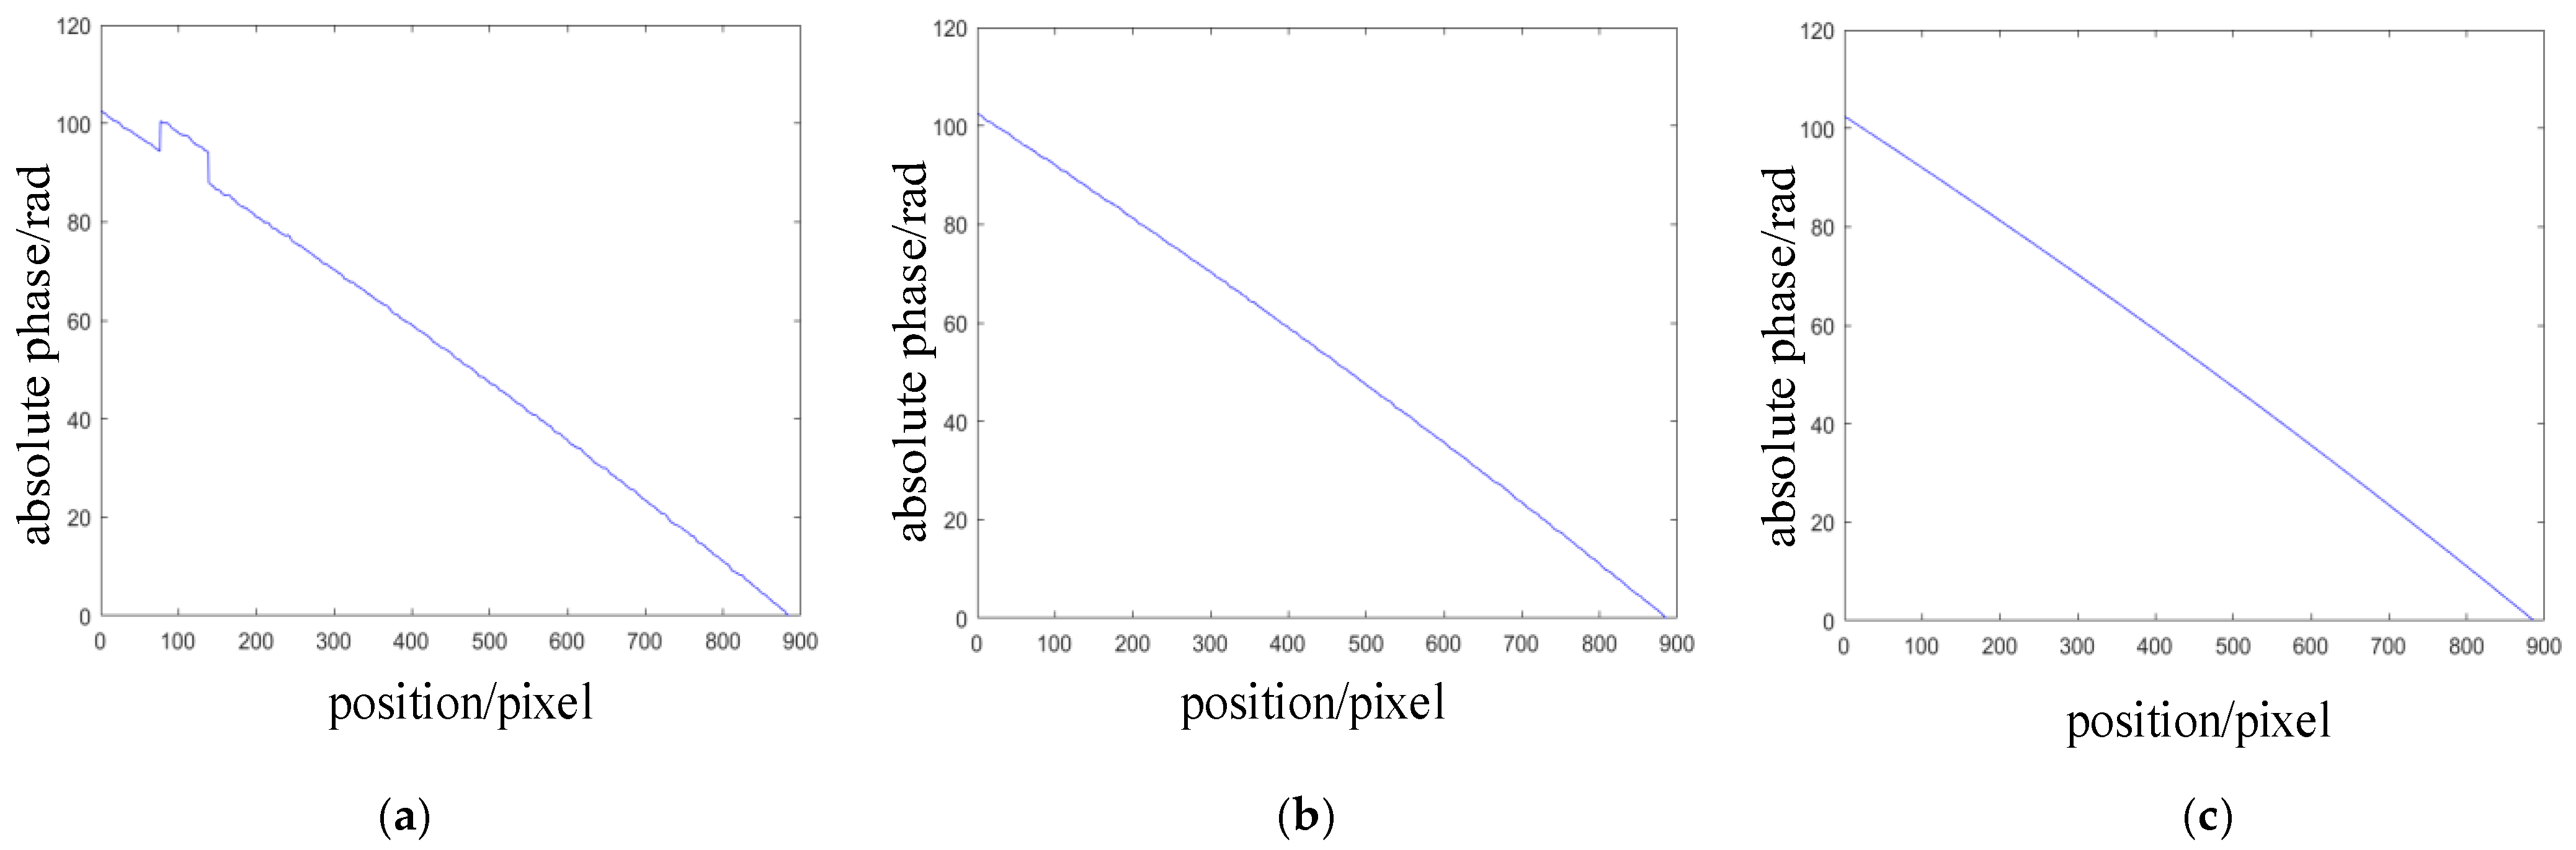
From Figure 4, under noise-free conditions, the traditional phase-unwrapping method still exhibits pronounced jumps and local discontinuities in the curve; while the method of [13] greatly suppresses these jumps and produces a smoother curve, it still leaves slight systematic deviations at the image edges; by contrast, the method proposed here not only completely eliminates phase jumps but also almost exactly overlaps the ideal linear decline curve, achieving high-precision, highly continuous phase unwrapping.
From Figure 5, after adding Gaussian noise with variance 0.01 and mean 0.005, the traditional phase-unwrapping method (subplot a) exhibits numerous jumps and mismatches due to noise interference, with the phase repeatedly jumping up and down at different positions and failing to maintain linearity; the method of [13] (subplot b) suppresses some noise-induced jumps and makes the phase curve smoother, but obvious phase jumps remain at both ends of the image; by contrast, the proposed method (subplot c) demonstrates stronger robustness to noise, with the unwrapped phase curve almost perfectly overlapping the ideal linear descent and only very slight jumps at a few isolated points, achieving high continuity and high accuracy in phase unwrapping.
From Figure 6, when the noise variance increases to 0.02 with a mean of 0.01, the noise robustness of the three methods becomes even more pronounced: the traditional phase-unwrapping method (subplot a) shows dense discontinuities across nearly the entire pixel range, making it impossible to recover the correct linear trend; the method of [13] (subplot b) performs better at suppressing noise-induced jumps but still exhibits multiple phase jumps in the middle and at the end of the curve; by contrast, the proposed method (subplot c) continues to deliver an unwrapped phase that almost perfectly follows the ideal linear descent, with only very slight deviations at a few isolated points, fully demonstrating its superior continuity and high accuracy under stronger noise conditions.

3.2. Measurement of Real Samples

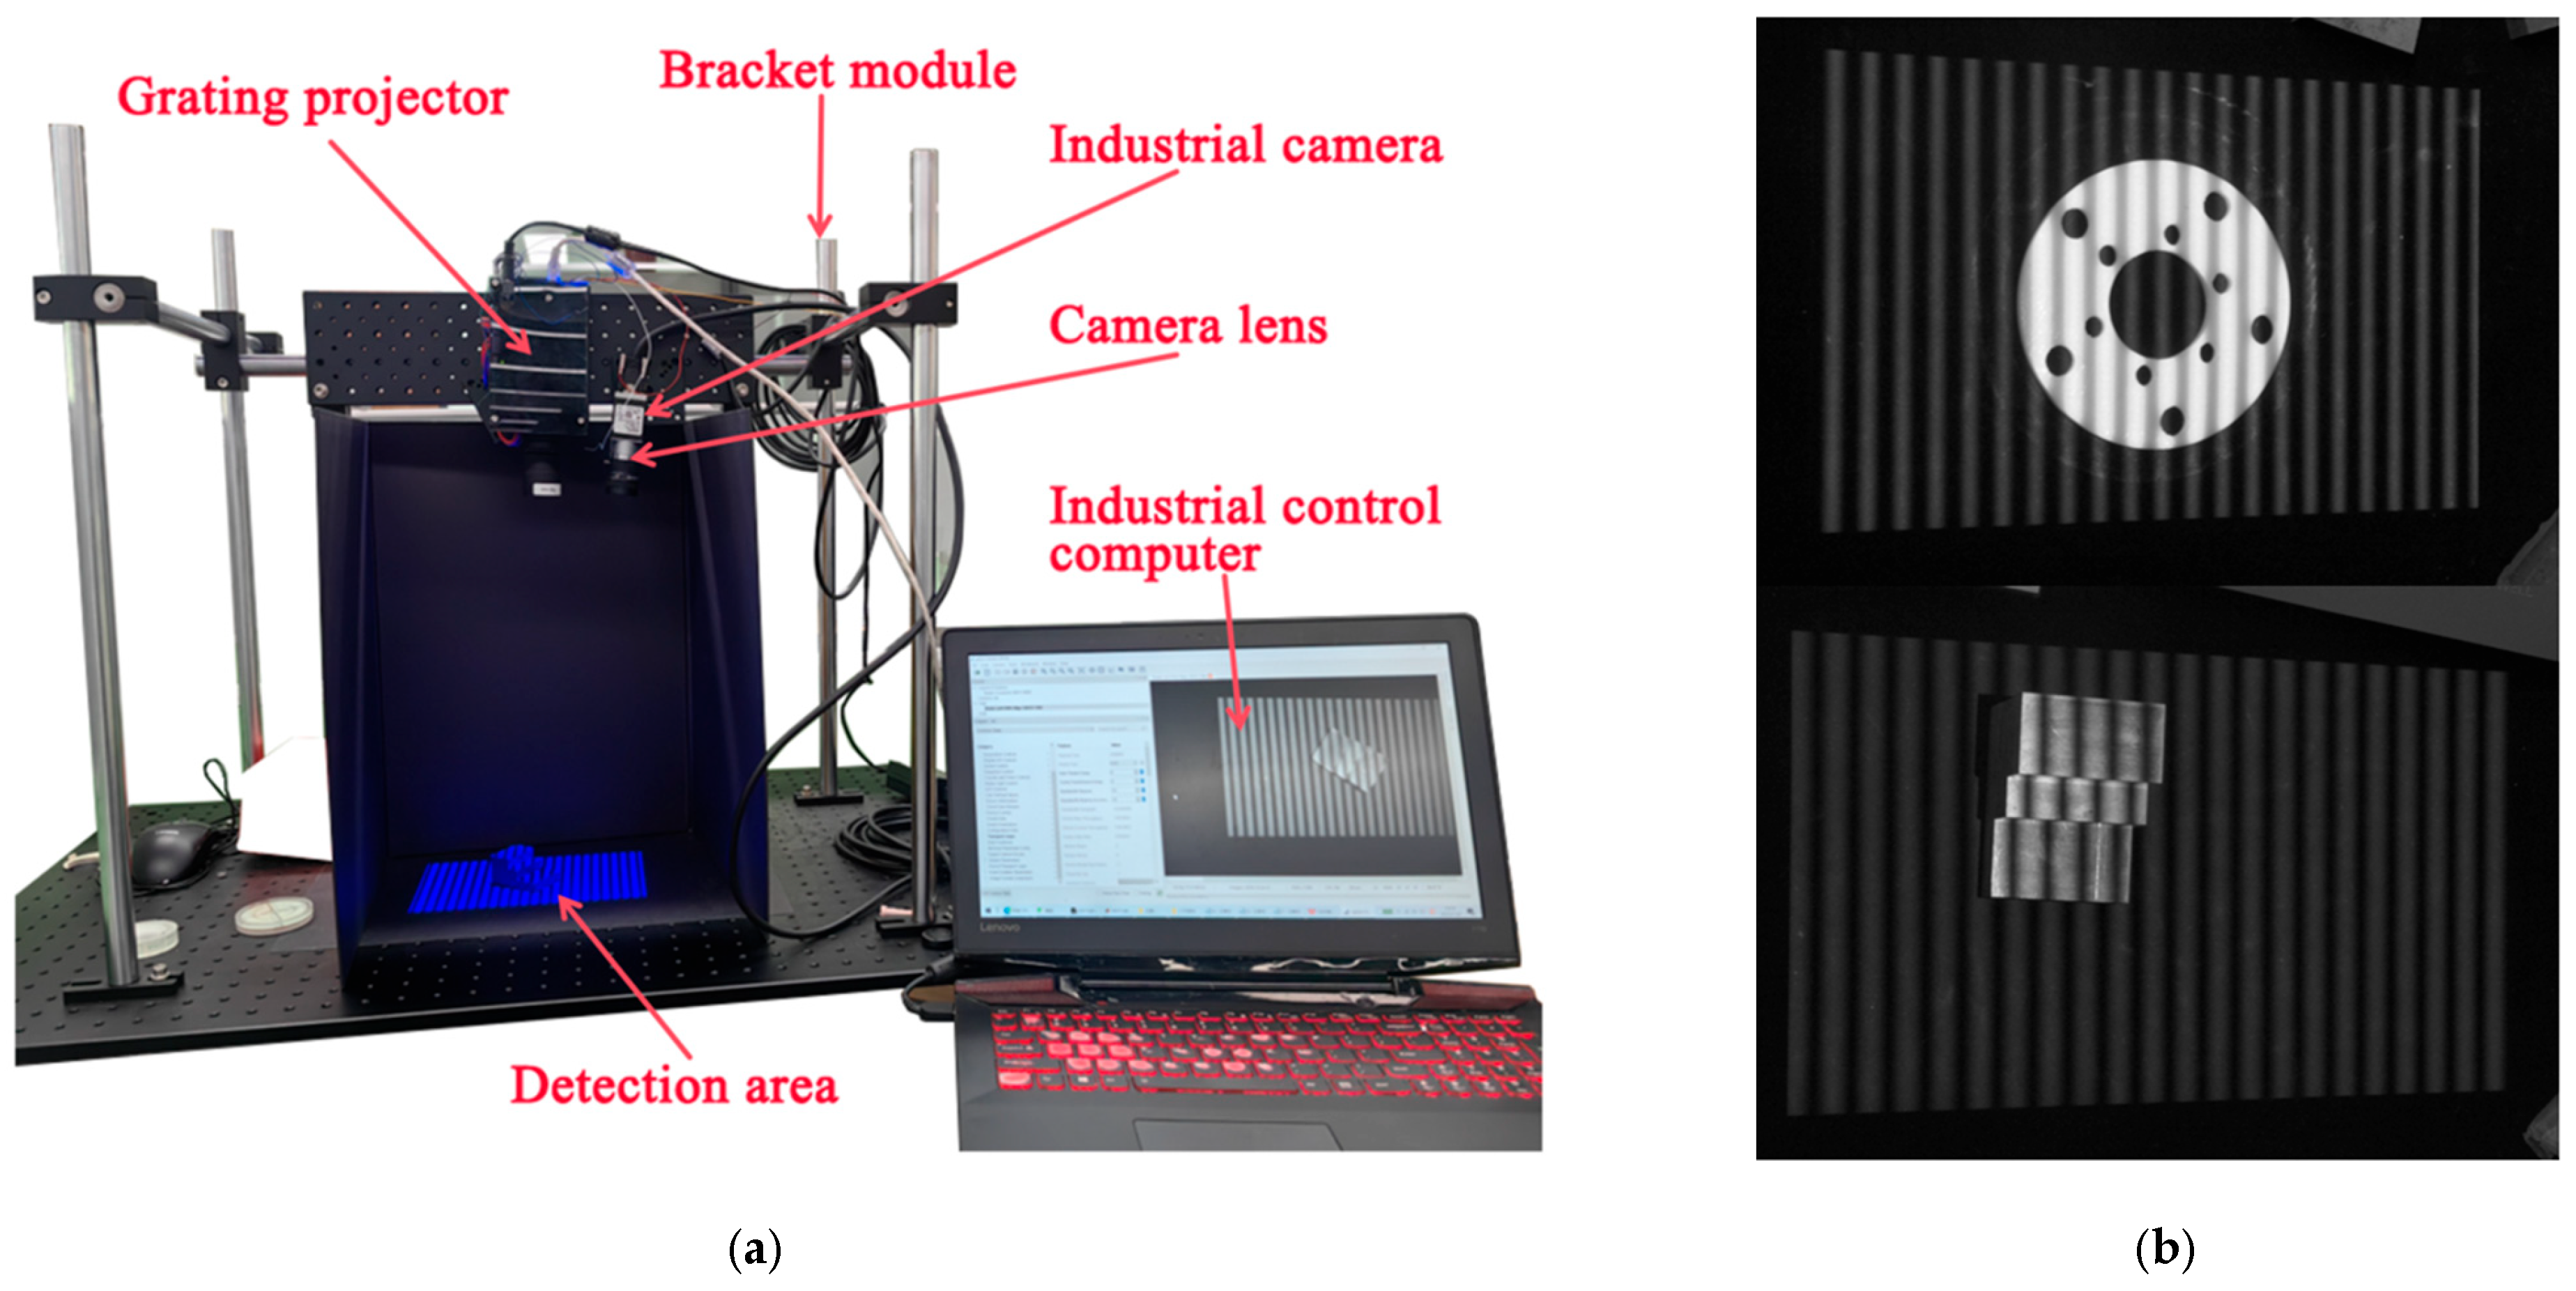
The experimental setup of the three-dimensional structured-light measurement system is shown in Figure 7a. The system mainly consists of a grating projector for fringe pattern projection, an industrial camera equipped with an imaging lens for fringe acquisition, a bracket module for mechanical alignment, and an industrial control computer for system control and data processing. The projector and camera are rigidly mounted on the bracket to ensure stable relative positioning, while the detection area is located within the common field of view of the projection and imaging units.
Figure 7b shows the fringe patterns projected onto the measured objects used in the experiments. Two representative objects were selected: a flange with a complex structured surface containing holes and curved features, and a stepped block with distinct height discontinuities. The flange represents a typical industrial component that requires high phase-calculation accuracy to achieve complete and reliable 3D reconstruction, whereas the stepped block is used to evaluate the robustness of the proposed method against abrupt phase jumps caused by sharp height variations. Together, these two objects comprehensively validate the effectiveness and robustness of the proposed phase restoration approach under different surface characteristics.
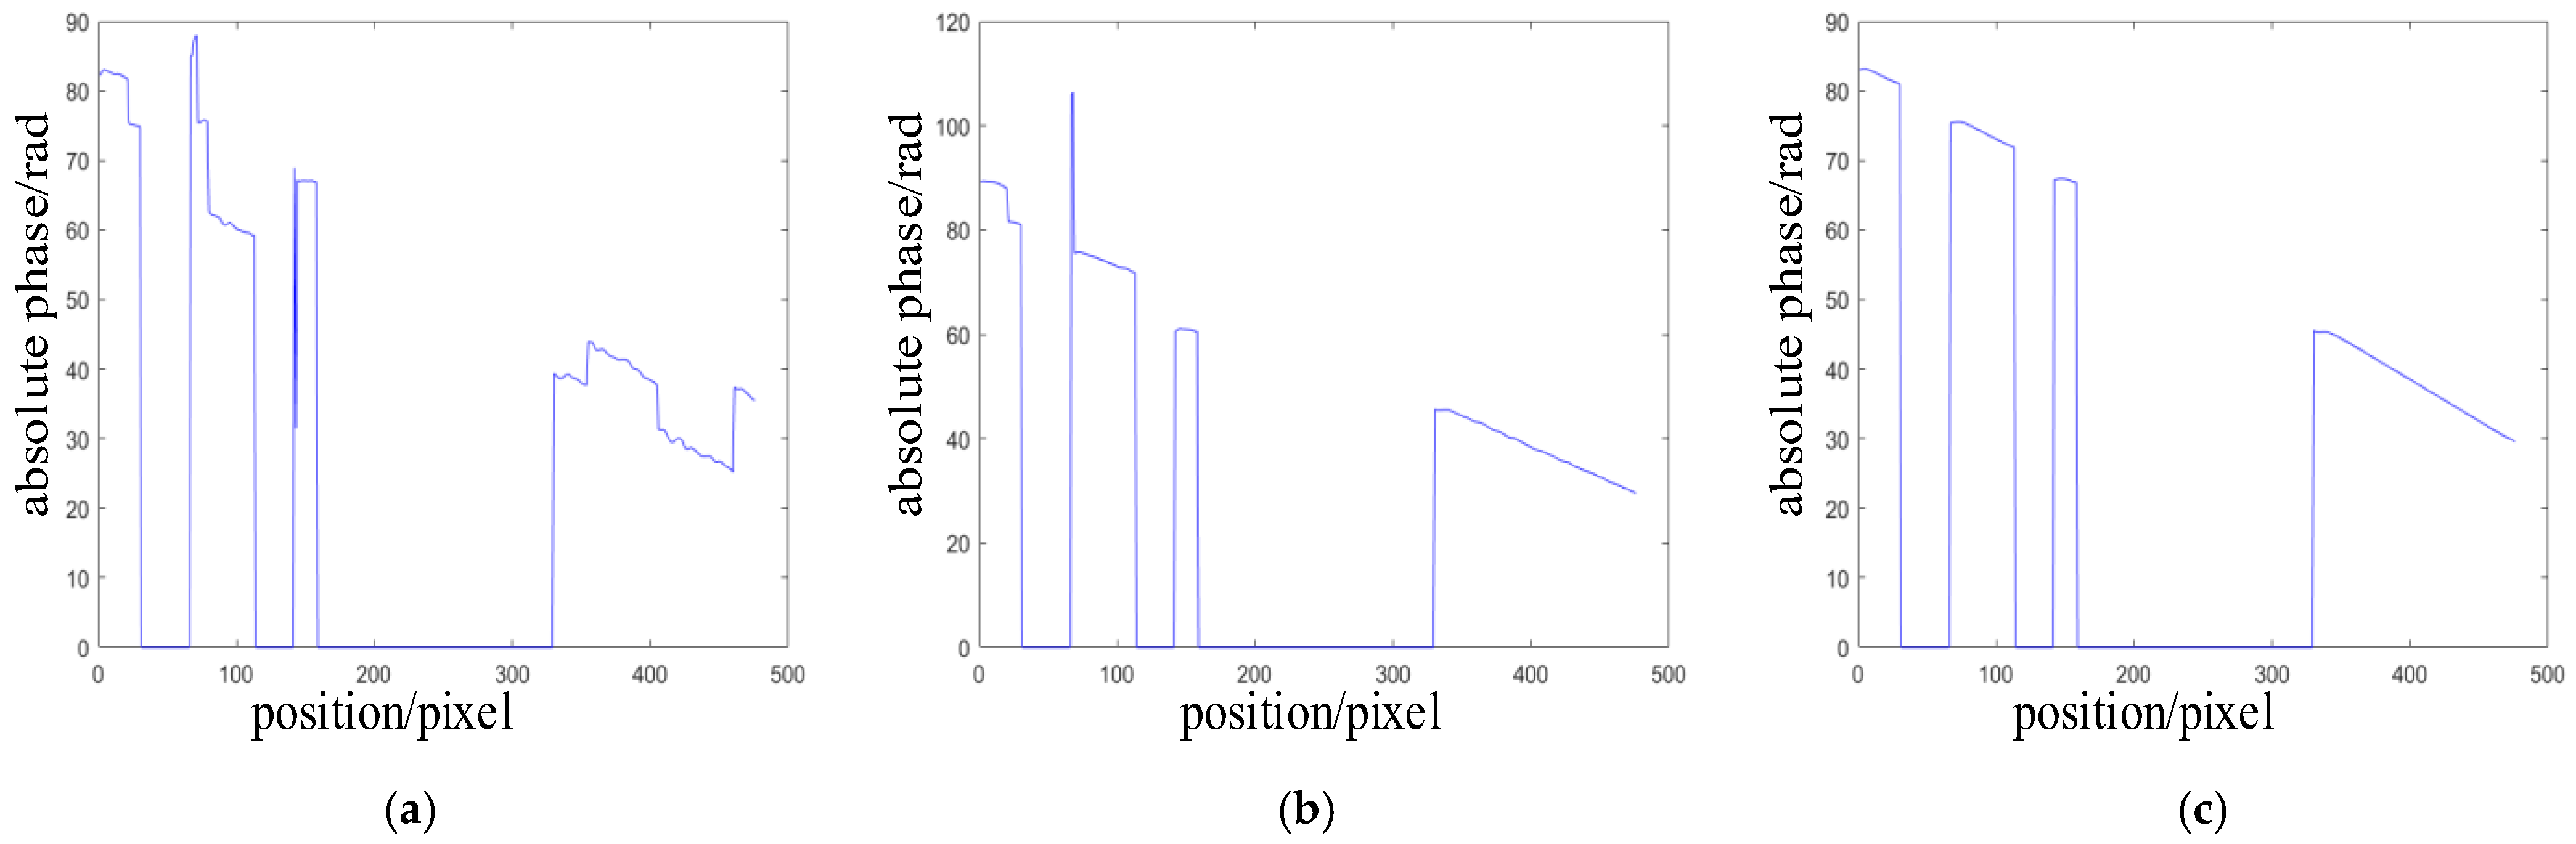
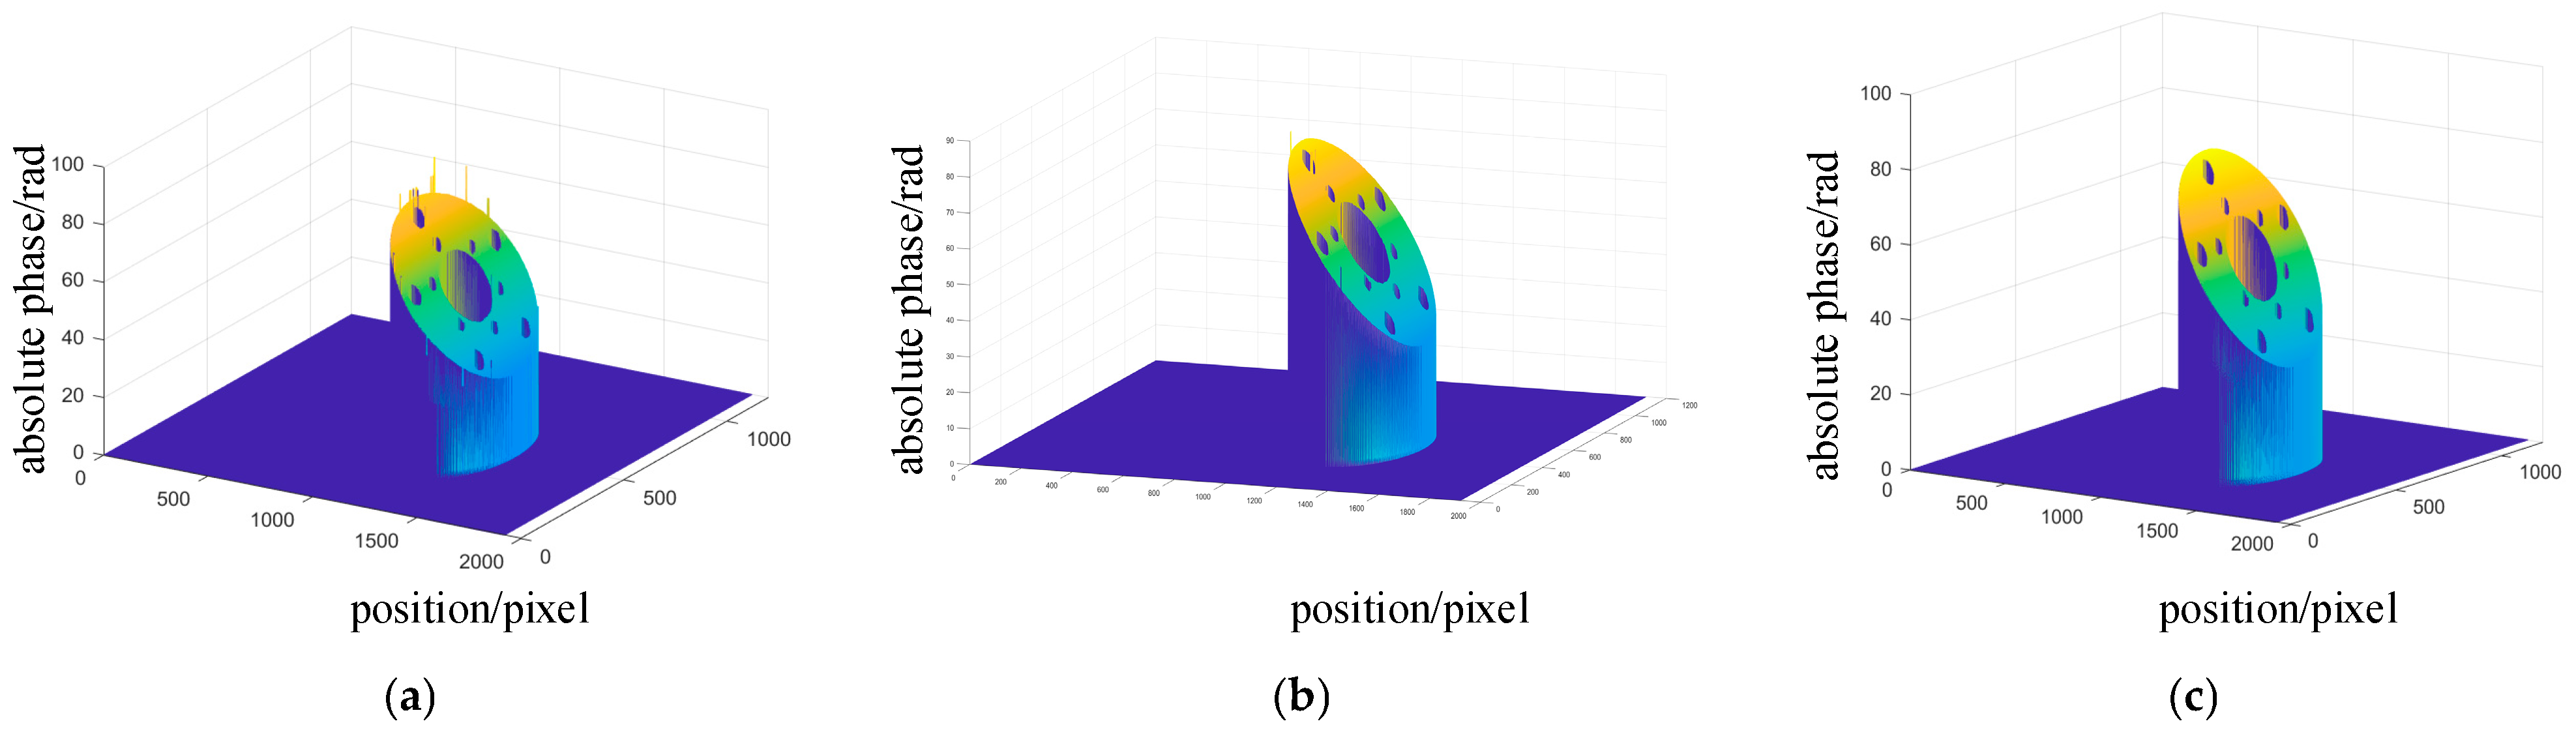
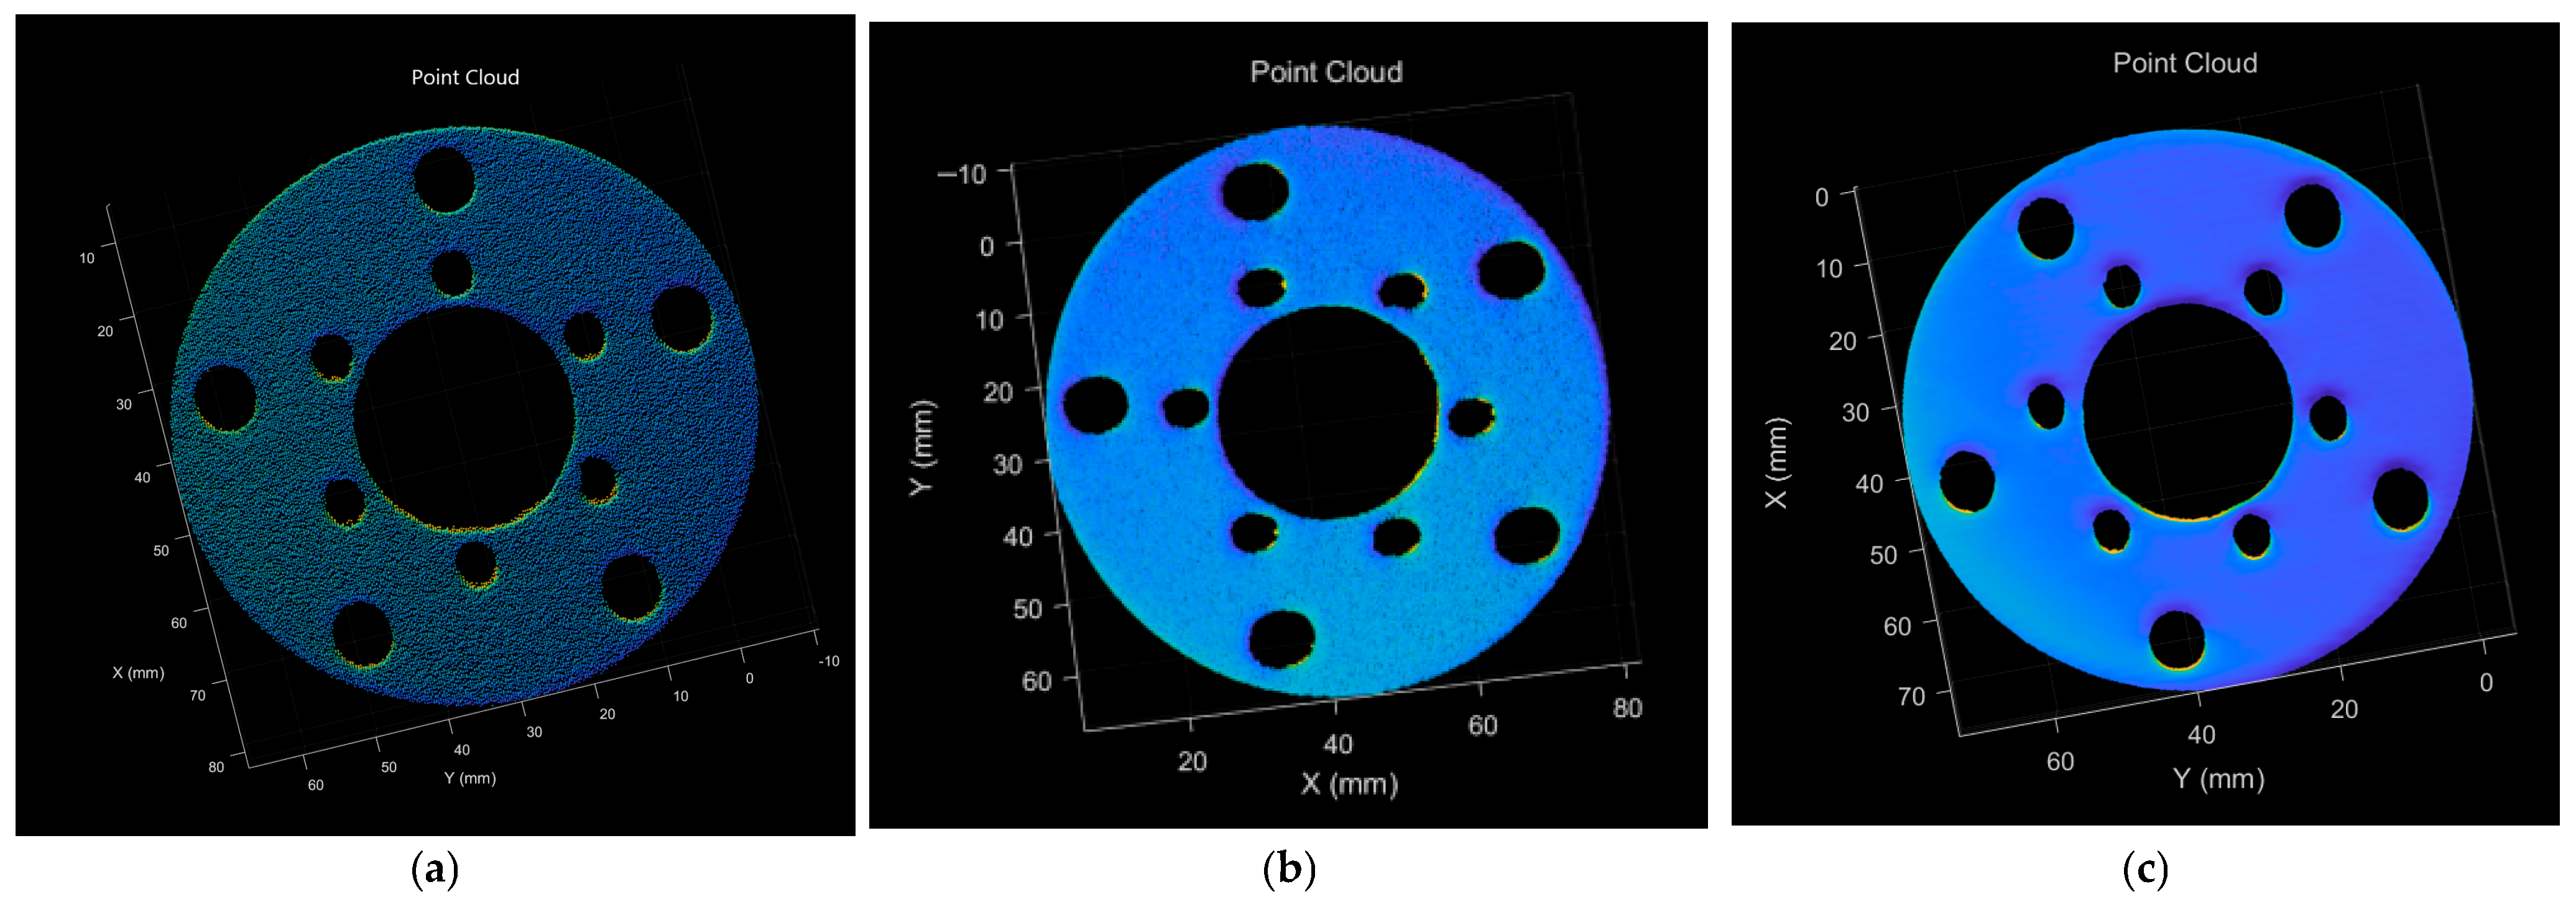
First, the projection system casts fringe patterns with pitches of 24 pixels, 26 pixels, and 28 pixels onto the object. Using the four-step phase-shifting method and the three-frequency heterodyne method, twelve phase-shifted images were acquired. Phase calculation and 3D reconstruction were then performed using the traditional method, the method of [13], and the method proposed in this paper. A single row of data across the center of the object was extracted for absolute phase comparison among the three methods, as shown in Figure 8 and Figure 9 presents the reconstructed 3D point clouds.
In Figure 8, the absolute phase outputs of three different algorithms are sampled along a single row of pixels across the center of the flange: the traditional method (subplot a), although it provides basic gradient information in flat regions, exhibits multiple discontinuous jumps before and after the hole edges, accompanied by sharp noise spikes, indicating inconsistent phase tracking at abrupt edges and highly reflective areas; the method of [13] (subplot b), by introducing a local reconstruction strategy, achieves limited repairs at some breaks, but the curve still shows irregular oscillations at several discontinuities and large local error fluctuations; in contrast, the proposed method (subplot c) produces a smooth and continuous phase curve across the entire pixel range, effectively suppressing noise spikes while preserving the physically correct step jumps at the flange holes and outer edges, fully demonstrating the synergistic effect of multi-scale edge-band smoothing and quality-guided unwrapping.
Figure 9 presents the panoramic absolute phase surface of the same flange under the three methods: the traditional method (subplot a) yields a surface covered with jagged discontinuities and isolated high-frequency noise points, resulting in severe distortion of the 3D shape; the method of Reference [13] (subplot b) reduces some of these discontinuities at a macro level, but the surface still exhibits noticeable ripples and unevenness, especially at hole edges and the junction between the hole and the flange plane; the phase surface generated by the proposed method (subplot c) is smooth and richly detailed, preserving the true geometric jumps along the hole and outer edge while eliminating noise artifacts, thereby providing higher-precision, more coherent phase information for subsequent 3D point-cloud reconstruction.
In Figure 10, the three point-cloud images vividly illustrate the impact of the three phase-recovery and unwrapping algorithms on the 3D reconstruction quality of the flange: in (a), the traditional method fails to suppress phase noise, resulting in a point-cloud surface speckled with random artifacts and burrs—flat regions are sparse and uneven, hole edges are blurred, and numerous outliers and misalignments appear at the junction of the inner hole and outer flange; in (b), the method of [13] shows improved local reconstruction and smoothing, yielding a denser point cloud and more coherent hole contours, but fine granular noise remains on flat areas and edge precision at curvature discontinuities is still insufficient; in (c), our proposed method, through multi-scale edge-band restoration and quality-guided unwrapping, not only achieves a globally dense and uniform point-cloud distribution but also accurately preserves the true geometric steps at hole edges and the flange-plane transitions, striking the optimal balance among noise suppression, edge clarity, and overall coherence. In summary, the proposed algorithm significantly enhances 3D reconstruction quality, laying a solid foundation for high-precision measurement and subsequent reverse engineering.

3.3. Accuracy Verification

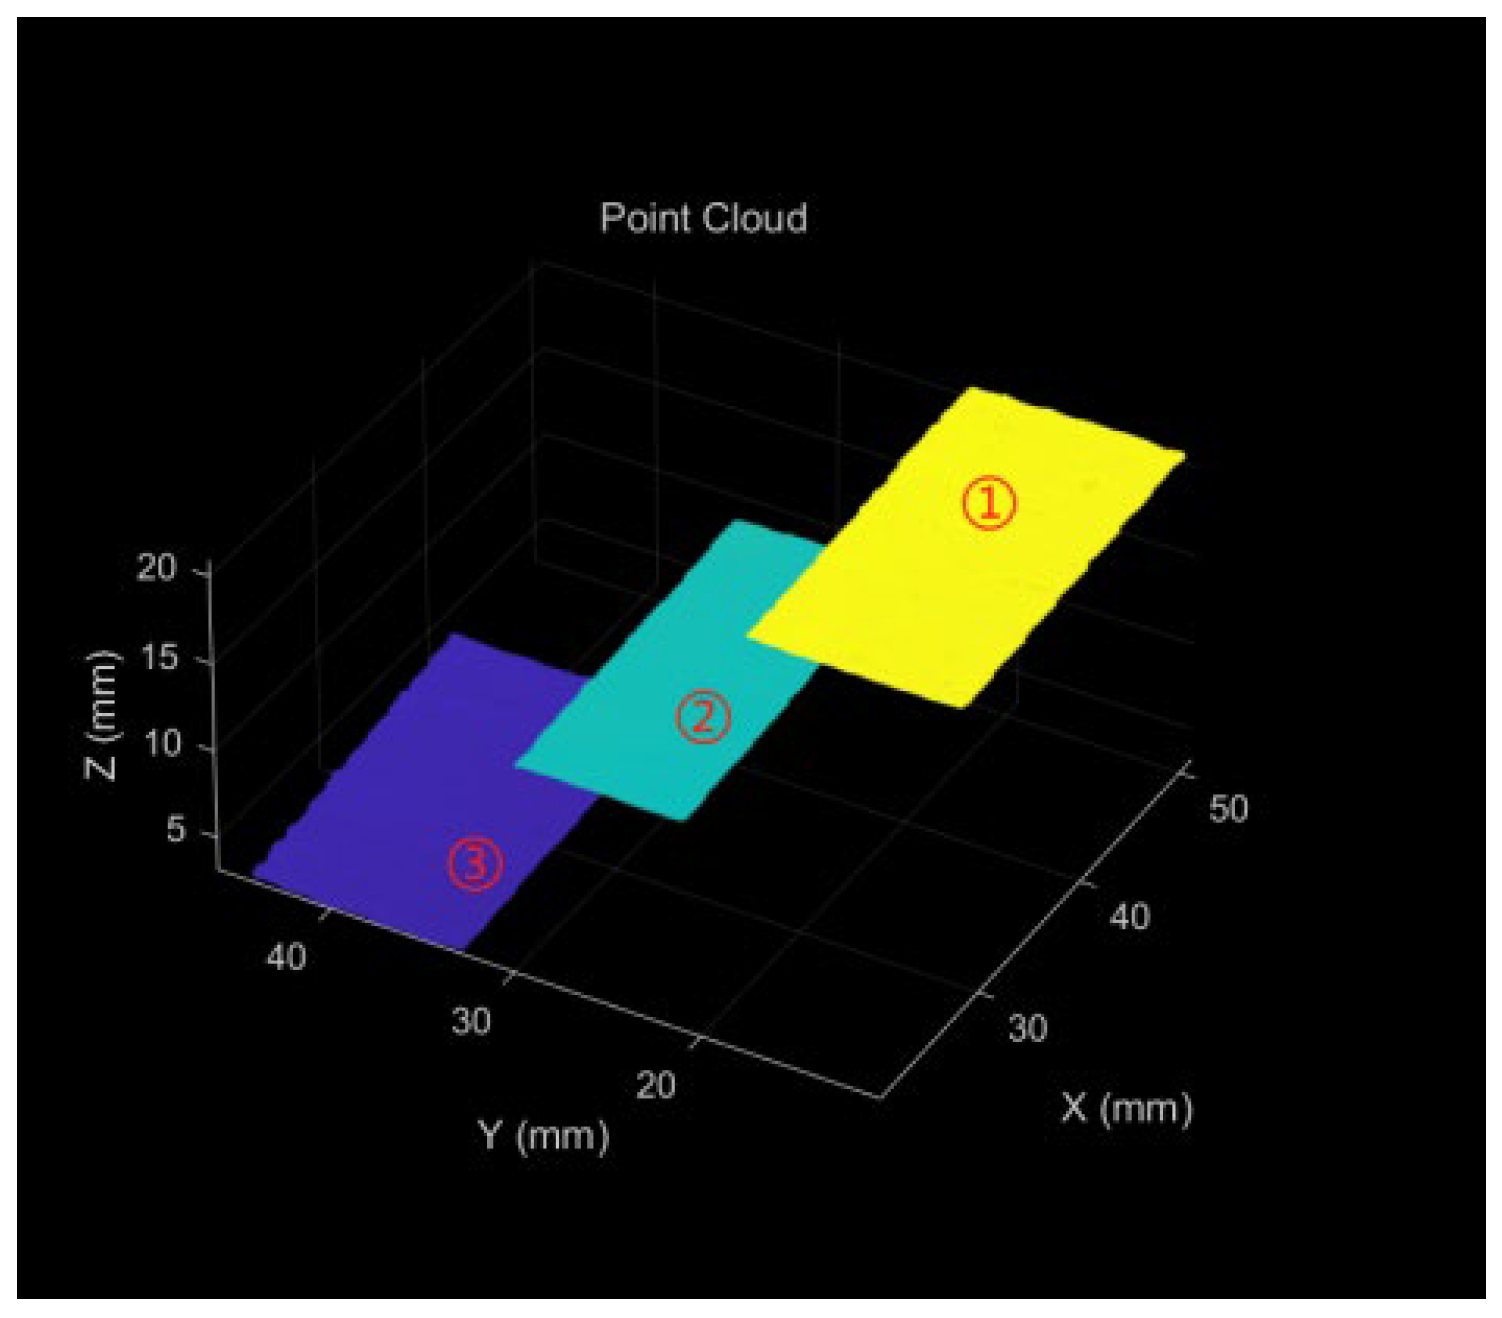
Three 10 mm gauge blocks were stacked to form a step block for accuracy measurement using the proposed method. From top to bottom, the layers are labeled ①, ②, and ③. For each layer, five different regions were sampled, and the average height was computed. The height differences and absolute errors between layers ① and ②, and between layers ② and ③ were then calculated. Figure 11 shows the point-cloud image of the step block from one of the ten measurement trials.
Table 2 presents the height differences between layers ① and ② and between layers ② and ③ of the three-step block. It shows that the proposed method suppresses phase jumps while maintaining an accuracy better than 0.06 mm, thus meeting the requirements of typical industrial measurements.

4. Conclusions

This study presents an edge-oriented phase-unwrapping error-compensation framework for fringe projection profilometry, specifically targeting phase jump artifacts that commonly arise near geometric discontinuities such as holes and sharp edges. By integrating multi-scale edge detection, morphological edge-band construction, and edge-preserving filtering with ordered multi-frequency heterodyne unwrapping, the proposed method effectively suppresses noise-induced errors while preserving genuine phase discontinuities. Experimental results demonstrate that the proposed approach achieves a phase jump correction rate of up to 96.7% and maintains a measurement accuracy better than 0.06 mm under various noise conditions, indicating strong robustness and reliability. These results highlight the method’s suitability for industrial measurements involving complex surface features where conventional unwrapping techniques often fail.
It should be noted that the proposed method is primarily designed for phase-unwrapping scenarios dominated by edge-induced discontinuities and does not aim to replace learning-based or globally optimized unwrapping strategies in all cases. Future work will focus on extending the framework to broader surface classes and further improving computational efficiency for real-time applications.

Author Contributions

Conceptualization, Y.S.; Methodology, Y.Y. and P.F.; Software, Y.Y., L.Q. and Y.S.; Validation, Y.Y.; Investigation, P.F. and Q.Z.; Data curation, Y.Y. and L.Q.; Writing—original draft, Y.Y.; Visualization, Y.Y. and L.Q.; Supervision, P.F. and Q.Z.; Project administration, Q.Z. All authors have read and agreed to the published version of the manuscript.

Funding

This research was funded by the Natural Science Research Project of Colleges and Universities of Anhui Provincial Department of Education (Project No.: 2024AH050508); by the University-Level Natural Science Research Project of Anhui Sanlian University (Project No.: PTZD2024020); and by the Road Traffic Safety Scientific Research Innovation Team Project (Project No.: 2023AH010064). The Article Processing Charge (APC) was borne by the Natural Science Research Project of Colleges and Universities of Anhui Provincial Department of Education.

Data Availability Statement

Data are contained within the article.

Conflicts of Interest

The authors declare no conflict of interest.

References

  1. Zuo, C.; Huang, L.; Zhang, M.; Chen, Q.; Asundi, A. Temporal phase unwrapping algorithms for fringe projection profilometry: A comparative review. Opt. Lasers Eng. 2016, 85, 84–103. [Google Scholar] [CrossRef]
  2. Zhang, S. High-speed 3D shape measurement with structured light methods: A review. Opt. Lasers Eng. 2018, 106, 119–131. [Google Scholar] [CrossRef]
  3. Zuo, C.; Feng, S.; Huang, L.; Tao, T.; Yin, W.; Chen, Q. Phase shifting algorithms for fringe projection profilometry: A review. Opt. Lasers Eng. 2018, 109, 23–59. [Google Scholar] [CrossRef]
  4. Feng, S.; Zuo, C.; Zhang, L.; Tao, T.; Hu, Y.; Yin, W.; Qian, J.; Chen, Q. Calibration of fringe projection profilometry: A comparative review. Opt. Lasers Eng. 2021, 143, 106622. [Google Scholar] [CrossRef]
  5. Palousek, D.; Omasta, M.; Koutny, D.; Bednar, J.; Koutecky, T.; Dokoupil, F. Effect of matte coating on 3D optical measurement accuracy. Opt. Mater. 2015, 40, 1–9. [Google Scholar] [CrossRef]
  6. Zhang, S.; Yau, S.-T. High dynamic range scanning technique. Opt. Eng. 2009, 48, 033604. [Google Scholar] [CrossRef]
  7. Li, X.; Shen, Y.; Meng, Q.; Xing, M.; Zhang, Q.; Yang, H. Single-Model Self-Recovering Fringe Projection Profilometry Absolute Phase Recovery Method Based on Deep Learning. Sensors 2025, 25, 1532. [Google Scholar] [CrossRef]
  8. Bone, D. Fourier fringe analysis: The two-dimensional phase unwrapping problem. Appl. Opt. 1991, 30, 3627–3632. [Google Scholar] [CrossRef]
  9. Wang, S.; Chen, T.; Shi, M.; Zhu, D.; Wang, J. Single-frequency and accurate phase unwrapping method using deep learning. Opt. Lasers Eng. 2023, 162, 107409. [Google Scholar] [CrossRef]
  10. Lei, H.; Chang, X.Y.; Wang, F.; Hu, X.T.; Hu, X.D. A novel algorithm based on histogram processing of reliability for two-dimensional phase unwrapping. Optik 2015, 126, 1640–1644. [Google Scholar] [CrossRef]
  11. Zhao, M.; Huang, L.; Zhang, Q.; Su, X.; Asundi, A.; Kemao, Q. Quality-guided phase unwrapping technique: Comparison of quality maps and guiding strategies. Appl. Opt. 2011, 50, 6214–6224. [Google Scholar] [CrossRef] [PubMed]
  12. Huang, Q.; Zhou, H.; Dong, S.; Xu, S. Parallel branch-cut algorithm based on simulated annealing for large-scale phase unwrapping. IEEE Trans. Geosci. Remote Sens. 2015, 53, 3833–3846. [Google Scholar] [CrossRef]
  13. Han, Y.; Yang, Y.; Su, X. A phase-unwrapping method based on multi-frequency heterodyne. J. Donghua Univ. (Nat. Sci. Ed.) 2021, 47, 105–110. [Google Scholar]
  14. Tan, J.; Liu, J.; Wang, X.; He, Z.; Su, W.; Huang, T.; Xie, S. Large depth range binary-focusing projection 3D shape reconstruction via unpaired data learning. Opt. Lasers Eng. 2024, 181, 108442. [Google Scholar] [CrossRef]
  15. Su, W.; Tan, J.; He, Z.; Lin, Z.; Liang, H. Separable Hadamard single-pixel imaging for high-resolution reconstruction. Opt. Lett. 2025, 50, 7468–7471. [Google Scholar] [CrossRef]
  16. Tan, J.; Zou, T.; Chen, H.; Su, W.; He, Z. Spectral division multiplexing-based region projection for 3D measurement under mutual reflection. Opt. Lett. 2026, 51, 488–491. [Google Scholar] [CrossRef]
  17. He, C.; Lai, R.; Sun, J.; Izui, K.; Wang, Z.; Liu, X.; Zhang, S. Adaptive High-Precision 3D Reconstruction of Highly Reflective Mechanical Parts Based on Optimization of Exposure Time and Projection Intensity. J. Imaging 2025, 11, 149. [Google Scholar] [CrossRef]
  18. Huang, C.-H.; He, S.-C.; Chen, T.-Y.; Cheng, C.-J.; Tu, H.-Y. Three-Dimensional Surface Reconstruction for Specular/Diffuse Composite Surfaces. Sensors 2024, 24, 7942. [Google Scholar] [CrossRef]
  19. Pan, B.; Qian, K.; Huang, L.; Asundi, A. Phase error analysis and compensation for nonsinusoidal waveforms in phase-shifting digital fringe projection profilometry. Opt. Lett. 2009, 34, 416–418. [Google Scholar] [CrossRef]
  20. Sadjadi, E.N.; Sadrian Zadeh, D.; Moshiri, B.; García Herrero, J.; Molina López, J.M.; Fernández, R. Application of Smooth Fuzzy Model in Image Denoising and Edge Detection. Mathematics 2022, 10, 2421. [Google Scholar] [CrossRef]
  21. Wang, L.; Luo, Z.; Gao, L. An Improved Dark Channel Prior Method for Video Defogging and Its FPGA Implementation. Symmetry 2025, 17, 839. [Google Scholar] [CrossRef]
  22. Wang, R.; Tan, D.; Ju, X.; Wang, J. An Object Feature-Based Recognition and Localization Method for Wolfberry. Sensors 2025, 25, 3365. [Google Scholar] [CrossRef]
  23. Liu, W.; Xu, J.; He, S.; Chen, Y.; Zhang, X.; Shu, H.; Qi, P. Underwater-Image Enhancement Based on Maximum Information-Channel Correction and Edge-Preserving Filtering. Symmetry 2025, 17, 725. [Google Scholar] [CrossRef]
  24. Zhan, H.; Zhang, J.; Lan, Y.; Zhang, F.; Huang, Q.; Zhou, K.; Wan, C. Adaptive Enhancement of Thermal Infrared Images for High-Voltage Cable Buffer Layer Ablation. Processes 2024, 12, 2543. [Google Scholar] [CrossRef]
  25. Song, L.; Li, X.; Yang, Y.-g.; Zhu, X.; Guo, Q.; Liu, H. Structured-Light Based 3D Reconstruction System for Cultural Relic Packaging. Sensors 2018, 18, 2981. [Google Scholar] [CrossRef]
  26. Song, M.; Chang, Y.L.; Xi, J.T.; Li, X.J. Phase unwrapping method based on multiple fringe patterns without use of equivalent wavelengths. Opt. Commun. 2015, 355, 213–224. [Google Scholar]
Figure 1. Principle of three-frequency heterodyne phase solution. (a) Overall workflow of the proposed edge-oriented phase-unwrapping error-compensation method. (b) Three-frequency heterodyne phase-solving process.
Photonics 13 00159 g001
Figure 2. Schematic of grayscale expansion operation. (a) Input image. (b) Template. (c) Output image.
Photonics 13 00159 g002
Figure 3. Multiscale edge-band phase restoration example.
Photonics 13 00159 g003
Figure 4. Absolute phase without added noise. (a) Phase unwrapped using the traditional method. (b) Phase unwrapped using the method of [13]. (c) Phase unwrapped using the method proposed in this paper.
Photonics 13 00159 g004
Figure 5. Absolute phase under Gaussian noise (variance = 0.01, mean = 0.005). (a) Phase unwrapped using the traditional method. (b) Phase unwrapped using the method of [13]. (c) Phase unwrapped using the method proposed in this paper.
Photonics 13 00159 g005
Figure 6. Absolute phase under Gaussian noise (variance = 0.02, mean = 0.01). (a) Phase unwrapped using the traditional method. (b) Phase unwrapped using the method of [13]. (c) Phase unwrapped using the method proposed in this paper.
Photonics 13 00159 g006
Figure 7. A three-dimensional structured-light measurement system and the measured object. (a) Schematic of the three-dimensional structured-light measurement system. (b) Fringe pattern image projected onto the measured object.
Photonics 13 00159 g007
Figure 8. Single-row absolute phase profiles of flange. (a) Traditional methods. (b) Methods of [13]. (c) Methods of this paper.
Photonics 13 00159 g008
Figure 9. Full-field absolute phase of flange. (a) Traditional methods. (b) Methods of [13]. (c) Methods of this paper.
Photonics 13 00159 g009
Figure 10. Three-dimensional reconstructed point-cloud of a flange. (a) Three-dimensional reconstruction point-cloud map of the traditional method. (b) Three-dimensional reconstruction point-cloud map of the method of [13]. (c) Three-dimensional reconstructed point-cloud map of the method in this paper.
Photonics 13 00159 g010
Figure 11. Three-layer step block.
Photonics 13 00159 g011
Table 1. Phase jump points.
Gaussian NoiseJumping PointCorrection Rate/%
Mean ValueVarianceTraditional MethodMethod of [13]Method of This Paper
0058,432234186398.5
0.010.005113,5968627335197.1
0.020.01193,04717,652635896.7
Table 2. Accuracy of three-layer step block.
12345
Height difference between layers ① and ②9.9649.9529.9699.9579.961
Absolute error between layers ① and ②0.0360.0480.0310.0430.039
Height difference between layers ② and ③9.9569.9469.9729.9679.951
Absolute error between layers ② and ③0.0440.0540.0280.0330.049
Disclaimer/Publisher’s Note: The statements, opinions and data contained in all publications are solely those of the individual author(s) and contributor(s) and not of MDPI and/or the editor(s). MDPI and/or the editor(s) disclaim responsibility for any injury to people or property resulting from any ideas, methods, instructions or products referred to in the content.