Abstract
Fiber optic technologies have strong potential to augment and improve existing areas of sensor performance across many applications. Magnetic sensing, in particular, has attracted significant interest in structural health monitoring and ferromagnetic object detection. However, current technologies such as fluxgate magnetometers and inspection gauges rely on measuring magnetic fields as single-point sensors. By using fiber optic distributed strain sensors in tandem with magnetically biased magnetostrictive material, static and dynamic magnetic fields can be detected across long lengths of sensing fiber. This paper investigates the relationship between Fiber Bragg Grating (FBG)-based strain sensors and the magnetostrictive alloy Metglas® 2605SC for the distributed detection of static fields for use in a compact cable design. Sentek Instrument’s picoDAS system is used to interrogate the FBG based sensors coupled with Metglas® that is biased with an alternating sinusoidal magnetic field. The sensing system is then exposed to varied external static magnetic field strengths, and the resultant strain responses are analyzed. A minimum magnetic field strength on the order of 300 nT was able to be resolved and a variety of sensing configurations and conditions were also tested. The sensing system is compact and can be easily cabled as both FBGs and Metglas® are commercialized and readily acquired. In combination with the robust and distributed nature of fiber sensors, this demonstrates strong promise for new means of magnetic characterization.
1. Introduction
Fiber optic sensing technology has recently garnered attention in structural health monitoring (SHM) applications. By using FBGs and interferometers as strain sensors and imaging devices, damage and degradation precursors can be detected and dealt with before failure occurs in structures [1,2]. Fiber also has the distinct advantages of being compact and robust, all while being immune to electromagnetic interference (EMI). Optical fiber-based sensors are able to withstand extreme conditions such as high temperatures or corrosive environments that many traditional electronic sensing mechanisms could not. However, existing FBGs used in such applications usually gather information from just strain or temperature-induced changes [3,4]. Prior innovations in magnetic sensing using fiber optic strain sensors have successfully demonstrated static and dynamic field detection with bonded magnetostrictive materials, but still lack in general sensitivity and distributed capabilities [4]. And while interferometers are well suited for detecting small variations in surface topography, internal structural damage or failure cannot be resolved. Substitute sensors able to maintain the advantages of fiber optics while being capable of detecting internal structural damage would be a large improvement in the sensing field.
Specifically, in SHM, corrosion remains a significant obstacle in preventing infrastructure failure. Costs of corrosion-related damage and repair make up around 3% of global GDP, or just over 2 trillion USD. Structural corrosion often cannot be avoided, and it is not a question of if it will happen, but instead of when it will occur [5,6]. Thus, improved corrosion monitoring methods are critical for solving this problem. Non-destructive evaluation (NDE) techniques are implemented to combat this, such as inspection gauges. These gauges are installed on bridges, metal supports, and pipelines, and use high-strength magnetic fields to saturate permeable materials [7]. If corrosion begins to cause pitting or material loss defects in the magnetically saturated area, it will then become oversaturated as the applied magnetic field can no longer be contained by the region. Magnetic flux leakage (MFL) is the result. A Hall effect magnetic sensor detects the change in magnetic flux, which is then correlated to material loss and corrosive behavior [8,9]. While effective and capable of continuous real-time measurements, these inspection gauges are costly and use single-point magnetic sensors. Hall effect sensors are also only able to resolve magnetic field amplitudes larger than hundreds of microTesla. When deployed on bridges or supports, such devices can only measure small areas at a time. For in-line pipeline inspection gauges (PIGs), the sensing apparatus is instead put inside the pipe and funneled down the line. MFL is used to determine material loss across the desired length of pipeline [7,9]. While able to characterize long lengths of structure over time, this process is tedious and expensive, as the pipe needs to be disassembled. The PIG also moves slowly and only characterizes the immediately surrounding pipe circumference. Being able to nonstop monitor an entire pipeline externally for material loss and corrosion would be significant [5,6]. Also, having a means of characterizing long lengths of bridge and support structures continuously would be similarly substantial.
Ferromagnetic object detection for defense applications is another area that takes advantage of magnetic sensing. Sensing mechanisms such as walk-through metal detectors, g-ant magneto-resistive (GMR) sensor arrays, and magnetometers are all used as effective detection methods [10]. GMR-based sensors can detect magnetic fields below a microTesla, while standard magnetometers can resolve magnetic fields in the nanoTesla regime and below. Ferromagnetic materials influence magnetic field lines, which these sensors take advantage of for recognition. These devices emit an alternating magnetic field at a known strength and frequency from a “search” coil. Due to the high magnetic permeability while demagnetized or remanent magnetization of ferromagnetic material, field lines from the “search” coil are distorted. This distortion is then picked up by the sensor and recognized as a ferromagnetic object [10,11]. While practical and widely used, none of these options offer distributed capabilities and can require a larger physical profile. This is a problematic drawback and makes traditional magnetic sensors impractical if a large area needs to be monitored or if discretion is required. Having a fully distributed, small-profile magnetic sensor would be monumental for ferromagnetic monitoring.
Previously, in our research group, we have demonstrated two distributed magnetic sensor designs able to resolve alternating magnetic field amplitudes with high resolution. The first configuration consists of a specialty sensing fiber with magnetostrictive wires drawn into the cladding of a distributed acoustic sensing (DAS) optical fiber [12]. The entire sensor is contained within a 125 μm diameter acrylate-coated fiber, presenting a compact and elegant method for magnetic field sensing. With this design, a minimum magnetic field amplitude of 500 nT was able to be detected using an in-cladding Metglas® wire. The second method relies simply on a magnetostrictive ribbon set underneath a DAS fiber. By implementing Metglas® ribbon instead of the cladding wire for the second magnetic sensor, the sensitivity was greatly improved, with 3 nT being the minimum resolvable magnetic field strength [13]. Both methods operate by characterizing the magnetically induced strain vibration from the wire and ribbon, respectively, using the distributed sensing fiber. While the initial configurations show strong promise for distributed magnetic sensing, they rely on an alternating magnetic signal to create the acoustic vibration for the sensing mechanism. This means they cannot detect static magnetic fields, which limit their applicability and potential [13,14,15]. Expanding on the success of these sensor designs while addressing their shortcomings, this study looks at developing a method for detecting static magnetic fields. An initial known AC magnetic field is applied to the magnetostrictive material, and the effects of varied external static fields are evaluated with Sentek’s engineered optical fiber.
2. Materials and Methods
Two multi-material optical fiber sensor configurations were investigated at different magnetic field conditions. The first design is a multi-material sensing fiber with a Metglas® 2605 SC wire inclusion running the length of the fiber. The sensor type is fabricated by using a stack and draw technique. A Metglas® wire, around a millimeter in diameter, was first added to an optical fiber preform stack in a fused silica capillary draw tube. The preform was drawn on a commercial scale draw tower into a fiber optic cable with a diameter of 125 microns and coated with UV-cured acrylate. The drawn fiber is then exposed to a periodic laser to create broadband fiber Bragg gratings with a gauge length of two meters. A more detailed process description is given in [12,16]. The Metglas® wire inclusion measures 10 microns in diameter, and a fiber cross-section and EDS spectrum captured by an SEM are shown in Figure 1.
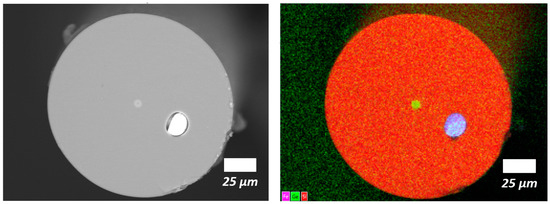
Figure 1.
SEM backscatter diffraction image and EDS dot map of the Metglas® multi-material fiber sample.
In the EDS dot map, Fe is colored in purple, Ge in green, and Si in red. For the second sensor type, Metglas® ribbon is used in combination with an acoustic sensing single-mode fiber (SMF) from Sentek Instrument, where it is fabricated commercially. This optical fiber also uses broadband FBGs that are inscribed every 2 m (the spatial resolution of the sensing fiber). The gratings contain a periodic index variation, and the fiber itself is designed to transmit light at a wavelength of 1550 nm. The 2-m spaced gratings form Fabry-Perot interferometer pairs, allowing for distributed sensing capabilities, also referred to as DAS. The DAS fiber is placed on top of a Metglas® ribbon measuring 25 mm wide and 0.025 mm thick. Further description of the setup is given in [13].
After both sensor types have been fabricated, they are paired with a magnetic field source. A waveform generator and amplifier are connected to a current-carrying wire, which is characterized by a magnetometer. The static field strengths in this study include the magnetic field from the earth, which is already on the order of 5 μT in the tested location and orientation. The applied AC magnetic field interacts with the Metglas®, producing a vibration that is imparted to the DAS fiber. The sensing fiber is aligned such that a designated FBG pair is positioned directly in the center of a 2.2-m-long region exposed to a uniform magnetic field. The respective optical fibers are then connected to Sentek’s picoDAS interrogator to characterize the strain imposed on the fiber. The system measures dynamic strain based on changes in optical path difference (OPD) between FBGs, outputting a 3-dimensional matrix of strain, position, and time. The interrogator operates at a sampling rate of 37 kHz with a sensitivity below 0.25 nano strain. An R2024B MATLAB script is used to analyze the matrix with a fast Fourier transform (FFT), producing a frequency/intensity spectrum of the desired 2-m-long sensor. The intensity spectrum correlates to the sinusoidal amplitude constituents for an indicated frequency (analyzed range of 0 to 20 kHz). A more detailed description of the interrogator and strain characterization is given in [12,13].
The magnetostrictive material used in the sensor fabrication, Metglas® 2605SC, is a soft magnetic amorphous alloy engineered for high magnetostrictive response at low magnetic fields. It has a chemical composition of Fe81B13.5Si3.5C2 [17]. Magnetostrictive materials such as Metglas® are composed of anisotropic magnetic domains in various orientations. When a magnetic field is applied, these polar domains begin to align with the field. Their degree of alignment is related to the magnetic field strength as well as the magnetostrictive behavior of the material [17,18].
The greatest change in length a material can undergo from magnetostriction occurs at the saturation field strength of Hs. Increasing the applied magnetic field past this point will no longer cause the material to strain further. Metglas® has a saturation magnetostriction coefficient of around 27 ppm. A simple quadratic relationship (Equation (1)) is used to approximate this magnetostrictive behavior when the applied magnetic field is much less than the saturation magnetic field strength for a given material:
where ε is the resultant strain, C is a material magnetostrictive coefficient, and H is the applied magnetic field. The strain relates to the scalar quantity of the magnetic field strength rather than the vector, as the relationship is symmetric across the strain axis, as shown in Figure 2a. Thus, if an AC magnetic field is applied, the main frequency component of the strain response is doubled in relation to that of the applied magnetic field [19]. Both the maximum and minimum field strengths of a sinusoidal magnetic signal correspond to identical strain responses, which gives this doubling effect as indicated by the blue lines in Figure 2a.
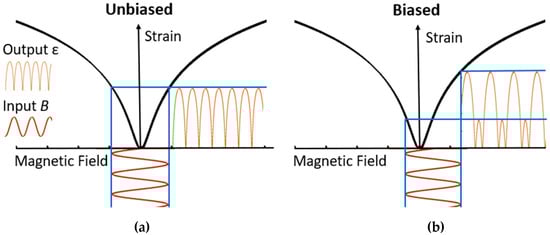
Figure 2.
Unbiased (a) and biased (b) magnetostriction curves with an applied AC magnetic field.
If a bias is applied such that the midpoint of the magnetic sine wave is no longer zero, a change in frequency response occurs. This is shown in Figure 2b, where the minimum and maximum (blue lines) of the input AC magnetic signal no longer correlate with the same strain. This causes the output strain sinusoid to be composed of both the driving frequency component as well as the doubled. If the bias is increased even further so that the min and max of the signal are both positive values, the doubling effect diminishes altogether, and the output signal begins to look closer to that of the input. By taking advantage of this relationship, static fields can be characterized by the output strain response derived from both the AC magnetic field and the applied bias or static field. This is done by relating the input frequency component of the output strain response to the doubled input frequency component of the output strain response. The resultant vibration from this magnetically induced strain can be measured by an acoustic sensing fiber, allowing for both distributed sensing capabilities and static field detection.
3. Results
Two different magnetic fiber sensor designs are evaluated to investigate the effect of added DC magnetic bias on Metglas® 2605SC for static field detection. The first iteration looks at a more compact and elegant design consisting of a 125-micron DAS fiber with a 10-micron diameter Metglas® wire inclusion contained within an air-core solenoid. The solenoid produces a 100 Hz sinusoidal magnetic field, vibrating the Metglas® in the fiber. To ensure magnetic field uniformity along the sensing length, the 2.2 m long solenoid was characterized with a magnetometer. Static magnetic fields are then added to the system to change the frequency response and amplitude of the vibration, which is detected by the DAS fiber. The FFT used to analyze the picoDAS interrogator strain, position, and time output matrix is taken, and the 100 and 200 Hz peaks are denoted for the desired FBG sensor. A sample FFT frequency spectrum is shown in Figure 3 at two different static magnetic field strengths.
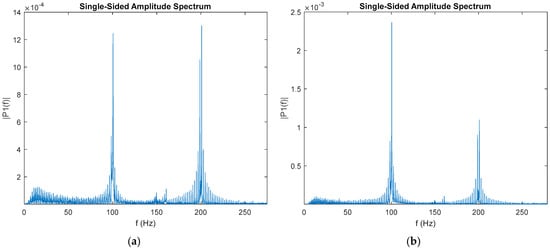
Figure 3.
Fourier transform frequency spectrum at an AC amplitude of 11.4 μT, and an applied DC offset field of 48 μT (a) and 96 μT (b).
The applied AC magnetic field at 100 Hz produces two main frequency components in the strain response imparted to the fiber at both the driving frequency of the magnetic field and at the doubled frequency. When the applied static magnetic field is changed, the heights of these two peaks also change accordingly (Figure 2). As the DC component of the magnetic field increases, the driving frequency component will also increase. Conversely, the doubled component will decrease in height relative to the driving peak, as shown in Figure 3. Using the multi-material Metglas® wire inclusion fiber and an air core solenoid, this process was repeated across varied static magnetic fields, and the 100 Hz and 200 Hz peaks were recorded and graphed. The ratio of the doubled frequency response to the driving frequency was also taken and plotted against the magnetic field. The FFT intensity at 100 and 200 Hz of the DAS fiber strain response vs. magnetic field is shown in Figure 4a, with the ratio of the two in Figure 4b.
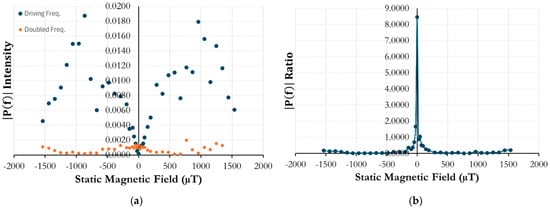
Figure 4.
Metglas® multi-material fiber sensor at 11.4 μT AC magnetic field amplitude, (a) 100 and 200 Hz amplitude spectrum intensity vs. static magnetic field strength, (b) 200 Hz to 100 Hz spectrum intensity ratio vs. static magnetic field strength.
The Metglas® wire inclusion sensor was tested at DC magnetic field step sizes as small as 25 μT. In Figure 4a, between −50 μT and +50 μT, the doubled frequency response of the strain remains higher than that of the driving frequency. However, after this point, the 100 Hz peak becomes dominant. This gives a well-defined peak in Figure 4b as the ratio between the two frequencies. Past 1000 μT on both the positive and negative magnetic field axes, the consistency and general increasing trend become more volatile. It is surmised that the acoustic energy generated in the Metglas® wire is large enough after this point to create variability in the strain imparted onto the fiber. The saturation point of the Metglas® is also being approached as the field is continually increased, leading to a drop in peak intensity. Additional environmental noise, including acoustic sources and ambient magnetic fields, could also contribute to these inconsistencies. However, at lower fields, there remains a distinct “V-curve” for the driving frequency, allowing for a potential means of characterization for static magnetic fields. The peak pattern in Figure 4b also shows promise for higher resolution measurements, as well as being able to remove noise floor discrepancies, as taking the ratio normalizes added interference.
The same test for the Metglas® wire magnetic sensor was repeated with an increased AC magnetic field amplitude of 17.1 μT instead of 11.4 μT to investigate the frequency response relationship. A smaller step size was also used, with 10 μT being the minimum instead of 25 μT. The driving and doubled strain FFT intensities were again plotted against static magnetic field strength, shown in Figure 5a, and the ratio of the two in Figure 5b.
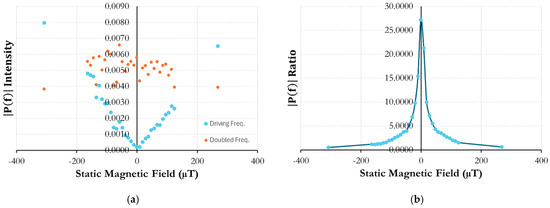
Figure 5.
Metglas® multi-material fiber sensor at 17.1 μT AC magnetic field amplitude, (a) 100 and 200 Hz amplitude spectrum intensity vs. static magnetic field strength, (b) 200 Hz to 100 Hz spectrum intensity ratio vs. static magnetic field strength.
A similar trend is shown as with the 17.1 μT amplitude AC signal. However, the strain intensity response for the doubled frequency peak is around 4 times higher at the lower magnetic fields in comparison to the prior test. The data still experiences some discrepancies, especially with the doubled frequency. Because the doubled response is dominant when there is no applied static field, it is also more sensitive to magnetic noise as any additional field will shift the response behavior (Figure 2). This may be why the 200 Hz trend with a static magnetic field has a larger error, especially when its initial response is higher. However, the “V-curve” pattern of the driving frequency response remains almost identical to when the AC amplitude was 11.4 μT. The overlay of the two driving frequency plots is shown in Figure 6. The ratio of the doubled frequency response to the driving response again shows a distinct peak, though the height is much higher, with a maximum of 27 vs. 8.5 from the 11.4 μT amplitude AC signal test. This shows that changing the applied AC magnetic field signal strength can allow for modifying the effective resolution of the sensor. This would make a distributed magnetic sensor using this form incredibly versatile and easily tailored towards different applications.
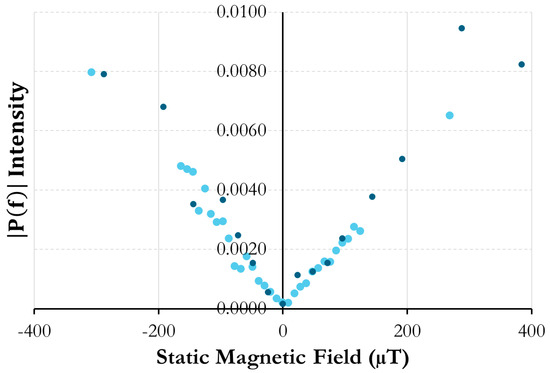
Figure 6.
Metglas® multi-material fiber sensor at 100 Hz and an AC magnetic field amplitude of 17.1 μT in light blue and 11.4 μT in dark blue, both plotted against static magnetic field strength.
The overlay demonstrates the sensor’s consistency in relation to the driving frequency strain response, as well as showing the potential for repeatable static field characterization.
The second sensing configuration tested uses the Metglas® ribbon coupled with DAS fiber instead of the wire inclusion. In the first static field test with this sensor, an air-core solenoid is again used to enclose the fiber and ribbon, allowing for an AC magnetic field to be applied. The same method of exposing the setup to varied static magnetic fields, characterized by a magnetometer, is carried out. Figure 7a shows a driving frequency and doubled frequency response plot vs. magnetic field strength, and Figure 7b, has the ratio of the two.
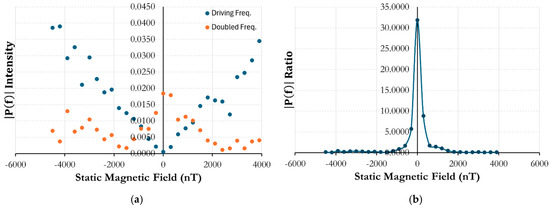
Figure 7.
Metglas® ribbon and DAS fiber at 100 Hz and 15 μT amplitude AC magnetic field, (a) 100 and 200 Hz amplitude spectrum intensity vs. static magnetic field strength, (b) 200 Hz to 100 Hz spectrum intensity ratio vs. static magnetic field strength.
The test using the Metglas® ribbon instead of the multi-material fiber allowed for better sensitivity, able to resolve static magnetic field changes below 300 nT. The characteristic “V-curve” is again well defined with the driving frequency response. The doubled frequency response, however, has an almost periodic appearance. As the AC magnetic field range approaches saturation via a DC bias, the doubled frequency strain will increase again as the gradient of the magnetostriction curve changes and then decrease as the curve ultimately levels out due to the nature of magnetostrictive behavior (Figure 2). This cyclic behavior is influenced by the AC magnetic field amplitude, the material properties relating to magnetostriction, as well as remanent magnetization and hysteresis. More work needs to be done to successfully characterize this behavior. However, the ratio between the doubled and driving frequencies still presents the same peak pattern with an even higher intensity of 32. With an improved resolution in the nanoTesla regime while still showing the same trending behavior with static magnetic field strength, this sensor design also shows potential for a new means of distributed magnetic characterization.
To demonstrate the distributed detection capabilities of the sensor, the DAS fiber was tested in a series of three air-core solenoids following the same setup. A magnetostrictive ribbon was centered in each of the three solenoids, with the sensing fiber lying on top of each one. Three separate “sensors” (all along the same fiber) were coupled with each ribbon, respectively, and then exposed to a uniform magnetic field. A software capture is shown in Figure 8 of this setup. A more in-depth discussion of the setup can be found in [13] for AC magnetic field measurements.
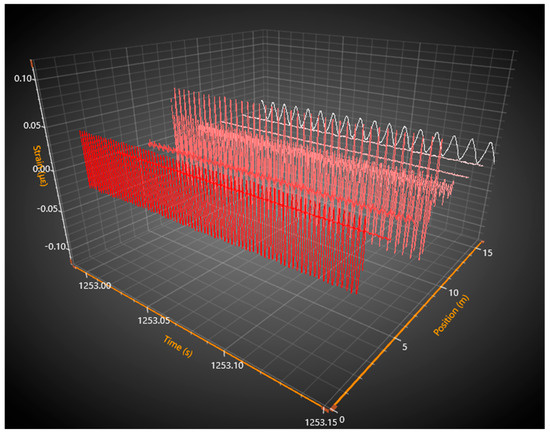
Figure 8.
3-dimensional software capture of 8 FBG pairs along 16 m of fiber showing position, strain, and time with three air core solenoids as magnetic field sources (centered at 6 m, 10 m, and 16 m, respectively).
Each colored signal represents a separate 2-m sensing length from an FBG pair all along one DAS fiber. The three largest sinusoidal strain responses correspond to a different solenoid and magnetic field source at varied frequencies and amplitudes (100 Hz is no longer solely used so that the unique magnetic fields at each source can be easily seen). The first is shown in red at the 6 m position. The second solenoid is positioned such that the contained sensing length is centered at 10 m, shown in pink, and the third at 16 m in white. At the 10-m position, both the driving and doubled frequency components (caused by a static magnetic field bias) can be seen, while the other two solenoids show a strain response composed primarily of one frequency component. It is clear from the capture that separate magnetic fields can be independently resolved across the sensing fiber. While this test only shows distributed magnetic sensing along 16 m worth of fiber, it still demonstrates the distributed capabilities of the magnetic sensor. The DAS system in question is capable of measurements along tens of kilometers with low loss, while other commercial systems can even take measurements over 100 km of optical fiber [3].
Work was done with this sensor design, investigating a different means of producing the AC magnetic field on the Metglas® ribbon. Instead of an air-core solenoid to produce the field, a current-carrying wire running parallel to the DAS fiber, placed on the Metglas® ribbon, was used as shown in Figure 9.
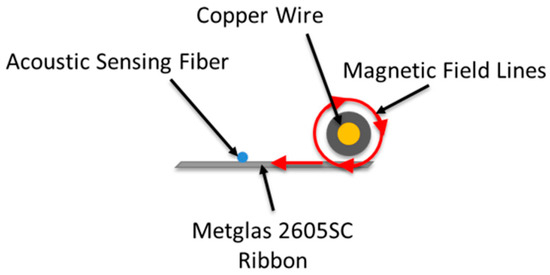
Figure 9.
Metglas® ribbon and DAS fiber with current-carrying wire sensing setup.
The current-carrying copper wire from the right-hand rule produces a magnetic field concentrically out from the center of the wire. While the produced field is not nearly as uniform as when using an air-core solenoid, a different orientation can be tested this way. It rotates clockwise when the current is moving into the shown wire cross-section (demonstrated in the figure) and counterclockwise when moving out of the cross-section. This will produce a similar strain response in relation to the air-core solenoid but along an axis perpendicular to the Metglas® ribbon. This will change the magnetostrictive behavior as the easy axis of the Metglas® runs with the length of the ribbon, such that the applied field is now rotated 90 degrees. An AC current at 100 Hz was applied to the wire, and the driving frequency peaks were recorded for a varied static field produced by offsetting the AC current with a DC signal. Figure 10 shows the corresponding plot.
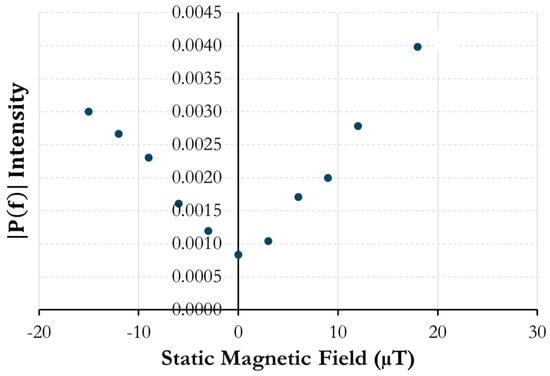
Figure 10.
Metglas® ribbon, DAS fiber, and copper wire sensor configuration at 100 Hz AC magnetic field frequency with 100 Hz strain response plotted against static magnetic field strength.
The plot still shows a definitive “V-curve” with a resolution of around 3 μT. This is an order of magnitude lower than when using the air-core solenoid to generate the field. The easy axis of the Metglas® corresponds to easier magnetic domain movement and thus higher strain response for a given applied magnetic field, so this lower resolution follows this material property. The result is consistent with fractional magnetization volumes reported for the x (0.39) and y (~0.55) in-plane directions and the out-of-plane z direction (0.06) in [17]. While not as sensitive, using a wire to generate the magnetic field instead of a solenoid lends itself to a compact and streamlined cable design for a distributed magnetic sensor.
Many magnetic sensing applications, such as structural health monitoring for particle accelerator magnets, require operation at cryogenic temperatures [20]. To determine the feasibility of static field detection in extreme conditions, the Metglas® ribbon and DAS fiber, using a small solenoid to produce the magnetic field, were tested completely submerged in liquid nitrogen. The liquid nitrogen, contained in a cryostat, had a temperature of around 77 K, and the response of the submerged sensor was plotted against static magnetic field strength at the driving frequency of 100 Hz. A diagram of the setup is shown in Figure 11 along with the plot.
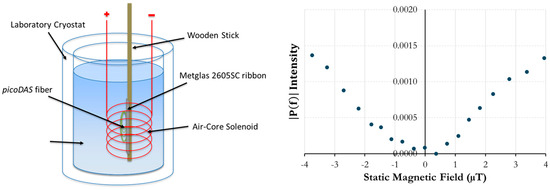
Figure 11.
Coiled DAS fiber and Metglas® ribbon submerged in liquid nitrogen and static magnetic field plot of 100 Hz strain response.
Since the cryostat was only about 40 cm in length, the 2-m spatial resolution of the DAS fiber was not small enough to fit on the shortened strip of Metglas®. Instead, the FBG pair was coiled (about 4 cm in diameter) and then placed on the ribbon so that it could fit in the cryostat while being contained by the air-core solenoid. Despite the changes in setup, the response showed a resolution of around 5 μT at 100 Hz and a similar “V-curve” shown in the other conducted testing.
Both sensing configurations demonstrated strong promise for detecting static magnetic fields using a distributed sensing technology. The first configuration presents a DAS fiber already containing the Metglas® in the form of in-cladding wires. As the multi-material fiber is only 125 microns in diameter, pairing this with a magnetic field source and cabling the sensor would be easy and compact. The second variant, using Metglas® ribbon external to the fiber, while not as compact, has much better sensitivity. Compared to the multi-material fiber, using the ribbon, magnetic field strengths roughly 30 times smaller at 300 nT can be resolved as opposed to 10 μT. 100 Hz was used as the magnetic driving frequency across all testing to keep the study concise and consistent for the purpose of comparison. While discrepancies existed in the plotted data, in general, the “V-curve” behavior of the driving frequency responses across testing and the distinct peaks shown in the strain response ratio showed similar patterns and remarkable consistency. However, these characteristic responses describe multivalued functions. This could make magnetic field characterization ambiguous, as directionality may not be able to be determined with just this methodology. For the scope of this study, an initial characterization method is presented, but future testing could be conducted to work around this. For example, adding a small periodic magnetic pulse or square wave with a known direction and strength through the magnetic field source would remove the ambiguity. The pulse would temporarily push the response in one direction relative to the magnetic field strength axis. Based on whether the strain response intensity (or ratio intensity, but the effect would be reversed) increases or decreases, the direction of the measured external field would be known.
Acoustic noise in the lab environment, as well as ambient magnetic fields from lab equipment or electrical wiring, could both be contributing factors for error in the experiments. Temperature changes can also affect the OPD in the DAS fiber, further contributing to sensor variation. However, because the magnetic field detection method relies solely on two specific frequencies (the driving source and double), which can be readily changed, steps can be taken to remove some of these factors to better accommodate commercial application potential. The applied AC frequency, for example, could be significantly increased where the effective noise floor is lower and ambient vibrations or external periodic magnetic fields will no longer be as prevalent. Another option could look at adding a second identical DAS fiber to the sensing system without coupling to the magnetostrictive material. By cross-correlating the two fiber sensors, which are both similarly affected by acoustic noise and temperature, the strain response only derived from the magnetic field could be resolved without adverse changes. Because the Metglas® is not bonded to the DAS fiber, shifts in orientation during testing could also skew the strain coupling and resultant response measured by the fiber. Using the copper wire instead of a solenoid for magnetic field generation allows for some nonuniformity, which may have affected the data additionally. Despite this, the results of the study demonstrate the feasibility of a distributed static magnetic sensor with a small physical profile. Future work and experimentation with the sensor designs could allow for better sensitivity, consistency, and commercial viability. Improvements to the optical fiber interrogation system could further reduce the noise floor, allowing for the detection of smaller magnetic fields. Similarly, magnetically shielding and acoustically isolating the sensor setup would bring about similar progress. A more in-depth characterization of applied AC magnetic field amplitudes, either experimentally or by using simulated models, could pinpoint areas where changes in static fields are more apparent. Thermal magnetically annealing the Metglas® would enhance the strain response to improve sensing resolution as well [21]. Data processing techniques such as implementing high and low pass frequency filters or even machine learning models could also help resolve lower field amplitudes [11]. Even with these potential improvements, the scope of this work establishes a means of novel distributed static magnetic field sensing with high resolution.
4. Conclusions
A unique fiber optic-based sensing design was investigated for low-level static magnetic field detection in this study. With distributed sensing resolution below 300 nT, cryogenic temperature resilience, and means for tailoring the sensitivity in real-time by modifying the applied AC magnetic signal, the FBG magnetic sensors show significant promise for a variety of sensing applications. The relative sensitivity shows similar performance to commercial options such as GMR, magnetometers, and Hall effect sensors. DAS fiber is also easily acquired, Metglas® is a well-established commercial product, and the multi-material inclusion fiber can be scalable for kilometers worth of fiberization. This, in combination with the small profile of the sensor, means that cabling the technology would be commercially feasible and further lend itself to being well-suited in SHM fields and ferromagnetic object detection. In future research, equipment advancement, data analysis improvements, magnetostrictive property manipulation, and shielding could lead to further improvements of the technology. SHM could now be possible in real-time across kilometers of structure. Ferromagnetic object detection could also be set up along huge perimeters, with other magnetic sensing applications improved upon, given the distributed static field detection capabilities. The sensor designs demonstrated in this paper establish significant potential across a variety of applications where magnetic sensing is critical.
Author Contributions
Z.D.: data curation, formal analysis, investigation, and writing—original draft. D.H.: conceptualization, data curation, formal analysis, and investigation. L.T.: investigation, software, and validation. A.W.: conceptualization, methodology, resources, and validation. G.P.: conceptualization, methodology, funding acquisition, validation, and supervision. All authors have read and agreed to the published version of the manuscript.
Funding
This research was funded by the Department of Energy under award number DE-SC0024788 as an SBIR project.
Institutional Review Board Statement
Not applicable.
Informed Consent Statement
Not applicable.
Data Availability Statement
The raw data supporting the conclusions of this article will be made available by the authors on request.
Acknowledgments
The authors would like to acknowledge Stephen McCartney at the NCFL at Virginia Tech for his invaluable assistance in operating the SEM for imaging and EDS.
Conflicts of Interest
Anbo Wang is the Clayton Ayre Professor in the College of Engineering at Virginia Tech and serves as the Director of the Center for Photonics Technology and Professor. Authors Daniel Homa, Logan Theis and Anbo Wang were employed by the company Sentek Instrument LLC. The remaining authors declare that the research was conducted in the absence of any commercial or financial relationships that could be construed as a potential conflict of interest.
References
- Kouhrangiha, F.; Kahrizi, M.; Khorasani, K. Structural health monitoring: Modeling of simultaneous effects of strain, temperature, and vibration on the structure using a single apodized π-Phase shifted FBG sensor. Results Opt. 2022, 9, 100323. [Google Scholar] [CrossRef]
- Jiang, T.; Ren, L.; Jia, Z.-g.; Li, D.-s.; Li, H.-n. Pipeline internal corrosion monitoring based on distributed strain measurement technique. Struct. Control Health Monit. 2017, 24, e2016. [Google Scholar] [CrossRef]
- He, Z.; Liu, Q. Optical Fiber Distributed Acoustic Sensors: A Review. J. Light. Technol. 2021, 39, 3671–3686. [Google Scholar] [CrossRef]
- Zhang, J.; Wang, C.; Chen, Y.; Yudiao, X.; Huang, T.; Shum, P.P.; Wu, Z. Fiber structures and material science in optical fiber magnetic field sensors. Front. Optoelectron. 2022, 15, 34. [Google Scholar] [CrossRef] [PubMed]
- Thompson, N.G.; Yunovich, M.; Dunmire, D. Cost of corrosion and corrosion maintenance strategies. Corros. Rev. 2007, 25, 247–262. [Google Scholar] [CrossRef]
- Harsimran, S.; Santosh, K.; Rakesh, K. Overview of corrosion and its control: A critical review. Proc. Eng. Sci 2021, 3, 13–24. [Google Scholar] [CrossRef]
- Xia, R.; Zhou, J.; Zhang, H.; Liao, L.; Zhao, R.; Zhang, Z. Quantitative Study on Corrosion of Steel Strands Based on Self-Magnetic Flux Leakage. Sensors 2018, 18, 1396. [Google Scholar] [CrossRef] [PubMed]
- Usarek, Z.; Warnke, K. Inspection of gas pipelines using magnetic flux leakage technology. Adv. Mater. Sci. 2017, 17, 37–45. [Google Scholar] [CrossRef]
- Peng, X.; Anyaoha, U.; Liu, Z.; Tsukada, K. Analysis of Magnetic-Flux Leakage (MFL) Data for Pipeline Corrosion Assessment. IEEE Trans. Magn. 2020, 56, 1–15. [Google Scholar] [CrossRef]
- Tian, G.Y.; Al-Qubaa, A.; Wilson, J. Design of an electromagnetic imaging system for weapon detection based on GMR sensor arrays. Sens. Actuators A Phys. 2012, 174, 75–84. [Google Scholar] [CrossRef]
- He, W.; Xu, K.; He, G. A Method of Ferromagnetic Object Identification Based on Magnetic Sensor and Machine Learning. In Proceedings of the 2023 IEEE 16th International Conference on Electronic Measurement & Instruments (ICEMI), Harbin, China, 9–11 August 2023; pp. 446–451. [Google Scholar]
- Dejneka, Z.; Homa, D.; Buontempo, J.; Crawford, G.; Martin, E.; Theis, L.; Wang, A.; Pickrell, G. Magnetic Field Sensing via Acoustic Sensing Fiber with Metglas® 2605SC Cladding Wires. Photonics 2024, 11, 348. [Google Scholar] [CrossRef]
- Dejneka, Z.; Homa, D.; Theis, L.; Wang, A.; Pickrell, G. Acoustic Sensing Fiber Coupled with Highly Magnetostrictive Ribbon for Small-Scale Magnetic-Field Detection. Sensors 2025, 25, 841. [Google Scholar] [CrossRef] [PubMed]
- Minggan, L.; Zhang, W.; Huang, W.; Xi, X. Optical Fiber Magnetic Field Sensors Based on 3 × 3 Coupler and Iron-Based Amorphous Nanocrystalline Ribbons. Sensors 2023, 23, 2530. [Google Scholar] [CrossRef] [PubMed]
- Rostami, A.; Wahaab, F.A.; Soleimani, H.; Sikiru, S.; Khosravi, V.; Yusuff, A.O.; Hamza, M.F. Advances in fibre Bragg grating technology for magnetic field sensing: A review. Measurement 2023, 221, 113482. [Google Scholar] [CrossRef]
- Dejneka, Z.; Homa, D.; Buontempo, J.; Crawford, G.; Theis, L.; Wang, A.; Pickrell, G. Magnetic field sensing via acoustic sensing fibers with submicron magnetostrictive cladding inclusions. Opt. Fiber Technol. 2024, 84, 103701. [Google Scholar] [CrossRef]
- Savage, H.T.; Spano, M.L. Theory and application of highly magnetoelastic Metglas 2605SC (invited). J. Appl. Phys. 1982, 53, 8092–8097. [Google Scholar] [CrossRef]
- Lachowicz, H.K.; Szymczak, H. Magnetostriction of amorphous magnetic materials. J. Magn. Magn. Mater. 1984, 41, 327–334. [Google Scholar] [CrossRef]
- Zhou, N.; Blatchley, C.; Ibeh, C. Design and construction of a novel rotary magnetostrictive motor. J. Appl. Phys. 2009, 105, 07F113. [Google Scholar] [CrossRef]
- Kang, D.; Kim, H.-Y.; Kim, D.-H.; Park, S. Thermal characteristics of FBG sensors at cryogenic temperatures for structural health monitoring. Int. J. Precis. Eng. Manuf. 2016, 17, 5–9. [Google Scholar] [CrossRef]
- Rao, K. Temperature and annealing dependencies of magnetostriction constant in a Co-rich zero-magnetostrictive metallic glass. IEEE Trans. Magn. 1986, 22, 451–453. [Google Scholar]
Disclaimer/Publisher’s Note: The statements, opinions and data contained in all publications are solely those of the individual author(s) and contributor(s) and not of MDPI and/or the editor(s). MDPI and/or the editor(s) disclaim responsibility for any injury to people or property resulting from any ideas, methods, instructions or products referred to in the content. |
© 2025 by the authors. Licensee MDPI, Basel, Switzerland. This article is an open access article distributed under the terms and conditions of the Creative Commons Attribution (CC BY) license (https://creativecommons.org/licenses/by/4.0/).