Article

Passive Time-Division Multiplexing Fiber Optic Sensor for Magnetic Field Detection Applications in Current Introduction

1
China Electric Power Research Institute, Wuhan 430077, China
2
School of Optical and Electronic Information, Huazhong University of Science and Technology, Wuhan 430074, China
3
State Grid Jiangsu Electric Power Research Institute, Nanjing 211100, China
*
Author to whom correspondence should be addressed.
Photonics 2025, 12(5), 506; https://doi.org/10.3390/photonics12050506
Submission received: 4 April 2025 / Revised: 9 May 2025 / Accepted: 10 May 2025 / Published: 19 May 2025
(This article belongs to the Special Issue Optical Fiber Sensors: Design and Application)

Abstract

Under the dual impetus of the “Dual Carbon” goals and the construction of smart grids, the development of new energy power infrastructure has been fully realized. The All-Fiber Optical Current Transformer (FOCT), leveraging its unique advantages, is in the process of supplanting traditional current transformers to become the core component of power system monitoring equipment. Currently, to achieve higher precision and stability in magnetic field or current detection, FOCT structures frequently incorporate active components such as Y-waveguides and phase modulators, and closed-loop feedback systems are often used in demodulation. This has led to issues of high cost, complex demodulation, and difficult maintenance, significantly hindering the further advancement of FOCTs. Addressing the problems of high cost and complex demodulation, this paper proposes a passive multiplexing structure that achieves time-domain multiplexing of pulsed sensing signals, designs a corresponding intensity demodulation algorithm, and applies this structure to FOCTs. This enables low-cost, simple-demodulation current sensing, which can also be utilized for magnetic field detection, showcasing vast application potential.

1. Introduction

A Current Transformer (CT) is a device used for measuring direct/alternating current, which operates on the principle of electromagnetic induction to convert high currents into lower, measurable currents [1,2]. In the realm of magnetic field detection, there is a close relationship between current transformers and the detection of magnetic fields, as CTs essentially measure electric current by detecting the magnetic field generated around a current-carrying conductor. When current flows through a conductor, it produces a magnetic field that is proportional to the current. Current transformers harness this phenomenon by capturing the magnetic field with an internal magnetic core and windings, converting it into a corresponding electrical signal, thereby achieving indirect measurement of the current. Consequently, the current transformer represents a specific application of magnetic field detection technology within power systems. It relies on variations in the magnetic field to reflect changes in current and is an indispensable component in power monitoring and protection systems [3,4,5].
The variety of fiber optic magnetic field sensor solutions each comes with its own advantages and disadvantages [6]. When selecting a solution, it is necessary to weigh the options based on specific application scenarios, such as measurement range, accuracy, cost, and environmental conditions. For instance, power system monitoring typically opts for solutions based on the Faraday effect [7] or fiber Bragg gratings [8], whereas biomedical detection may lean more towards magnetic fluid [9] or SPR (Surface Plasmon Resonance) [10] based solutions.
After decades of development, the All-Fiber Optical Current Transformer (FOCT) has reached a relatively mature stage in terms of theoretical foundations, and related products have been deployed in places such as substations [11,12]. The FOCT is based on the Faraday magneto-optic effect for sensing. According to the different sensing structures, it can be divided into Sagnac Interferometer (SI) FOCTs and reflective FOCTs. The reflective FOCT is based on a single optical path for sensing and indirectly obtains current by detecting the Faraday phase shift of orthogonal circularly polarized light. SI FOCT is based on the Faraday phase shift between light propagating in opposite directions in the SI ring for sensing. However, despite significant progress, FOCT still faces numerous challenges and issues in practical applications, which limit its broader promotion and utilization.
One major issue is the conflict between anti-interference capabilities and hardware complexity. While the high sensitivity of FOCT is a notable advantage, it also makes the system susceptible to external environmental interference. Factors such as external vibrations, temperature fluctuations, and mechanical stress can induce birefringence in the optical fiber, significantly affecting measurement accuracy [13]. Although compensation methods exist, most increase hardware complexity, limiting applicability. Therefore, it is necessary to optimize anti-interference solutions to balance the trade-off between interference resistance and hardware complexity [14].
Additionally, the increased hardware complexity contributes to the high cost of FOCT systems. Current mainstream stable closed-loop FOCT solutions rely on active components such as Y-waveguides and lithium niobate phase modulators, which are costly [15]. In practical applications, these active components are prone to failure, increasing maintenance difficulties and hindering long-term stable operation. Thus, it is essential to minimize the use of active components when designing system structures, which would help reduce costs and simplify maintenance [16].
Another challenge lies in the limitations of complex demodulation algorithms. As hardware structures become more complex and active components are incorporated, the demodulation algorithms for FOCT have also grown increasingly intricate. Existing closed-loop demodulation systems often employ digital phase-locked loop architectures, requiring simultaneous handling of complex processes such as carrier generation, phase modulation, and quadrature demodulation. The complexity of these demodulation algorithms restricts the real-time performance of FOCT, posing significant challenges for large-scale adoption. Therefore, it is crucial to further optimize the demodulation algorithms to reduce costs and complexity [17].
This study explores a novel passive technical approach. In the system design of the FOCT, passive fiber optic components are utilized as much as possible to reduce application costs. In the design and optimization of the demodulation algorithm, the intensity demodulation algorithm is used to only utilize the strength of the sensing signal, while ensuring excellent stability and anti-interference ability of FOCT. This paper conducts an in-depth investigation into the passive optical path design and optimization of the FOCT, focusing on improvements in system solutions and the optimization of demodulation algorithms, ultimately achieving a passive, low-cost FOCT design.

2. Principles and Structures

The proposed FOCT structure based on a 3 × 3 coupler and a passive multiplexing configuration (hereinafter referred to as the 3 × 3 coupler-based FOCT) is illustrated in Figure 1. This scheme requires experimental components such as a pulsed light source (Fby, HMM-SM-FC/APC), optical circulators (OC2, OC3, and OC4), single-mode fiber delay lines (DF1, DF2, DF3, and DF4), quarter-wave plates (QWP1 and QWP2), sensing fiber (polarization-maintaining fiber), coil, a DC power supply (HAMEG, HMP4040), a photodetector (avalanche photo diode, LIGHT PROMOTECH), and an oscilloscope (RIGOL, MSO5102). The 3 × 3 fiber couplers (OC1, OC5, and OC6) are used to construct the passive multiplexing structure. Since the 3 × 3 coupler OC5 is a single-mode coupler, two polarizers (P1 and P2) are added to the SI loop to achieve polarization. The multiplexing structure and the Sagnac sensing structure do not employ active components, resulting in relatively low system costs. In the structure shown in Figure 1, different colors are used to distinguish fiber types: yellow for single-mode fiber, purple for polarization-maintaining fiber, and green for polarization-preserving fiber. The constructed passive multiplexing structure consists of OC1, OC2, OC3, OC4, OC5, OC6, DF1, DF2, DF3, and DF4, utilizing fiber delay lines of varying lengths to separate the optical pulse signals. The SI structure, composed of OC5, P1, P2, QWP1, QWP2, and polarization-preserving fiber, is used for current sensing. Under the action of the passive multiplexing structure, a single optical pulse signal emitted by the light source can generate nine sensing signals. The phase difference caused by the Faraday effect can be demodulated from the intensities of these nine sensing signals, thereby obtaining the information of the measured current.
Firstly, Ijk is used to denote the nine acquired sensing signals, which can be expressed in the following form:
I j k = s j d k ρ j k
  • sj represents the loss factor of the optical signal in the transmission path before entering the coupler OC5.
  • dk represents the loss factor of the path from the output of OC5 to the reception by the photodetector.
  • ρjk denotes the phase characteristics of the signal.
For example, I33 corresponds to the optical pulse that enters OC5 via the path OC1 → DF2 → OC4 and exits OC5 via the path OC4 → DF4 → OC6.
Assuming the phase difference caused by the Faraday effect is θ2. For the 3 × 3 coupler, there is a phase difference of 120° between the output signals of the three ports, which is determined by the output characteristics. Therefore, the phase factors of the nine sensing signals can be expressed as follows:
ρ 11 = ρ 22 = ρ 33 = A + B cos ( θ 2 ) ρ 12 = ρ 23 = ρ 31 = A + B cos ( θ 2 + 2 π 3 ) ρ 21 = ρ 32 = ρ 13 = A + B cos ( θ 2 2 π 3 )
In Equation (2), A and B represent the DC and AC components of the sensing signals, respectively. Nine sensing signals are divided into three groups, each with the same phase factor.
Therefore, every three pulses with different paths share the same phase characteristics. By combining them, three synthesized intensities with a common factor can be obtained, as shown in Equation (3):
I 1 = I 12 I 23 I 31 1 3 = s 1 s 2 s 3 d 1 d 2 d 3 1 3 ρ 12 ρ 23 ρ 31 1 3 I 2 = I 21 I 32 I 13 1 3 = s 1 s 2 s 3 d 1 d 2 d 3 1 3 ρ 21 ρ 32 ρ 13 1 3 I 3 = I 11 I 22 I 33 1 3 = s 1 s 2 s 3 d 1 d 2 d 3 1 3 ρ 11 ρ 22 ρ 33 1 3
The three synthesized intensities all share a common factor ( s 1 s 2 s 3 d 1 d 2 d 3 ) 1 3 . This factor incorporates the effects of losses in the transmission path. Using the arctangent demodulation scheme in the 3 × 3 coupler demodulation algorithm, the phase information can be extracted. The calculation process for the tangent signal is as shown in Equation (4). By performing the arctangent calculation on the result, the relevant information of the current to be measured can be obtained.
1 cos 2 π 3 2 sin 2 π 3 I 1 I 2 I 3 I 1 + I 2 / 2 = tan θ 2
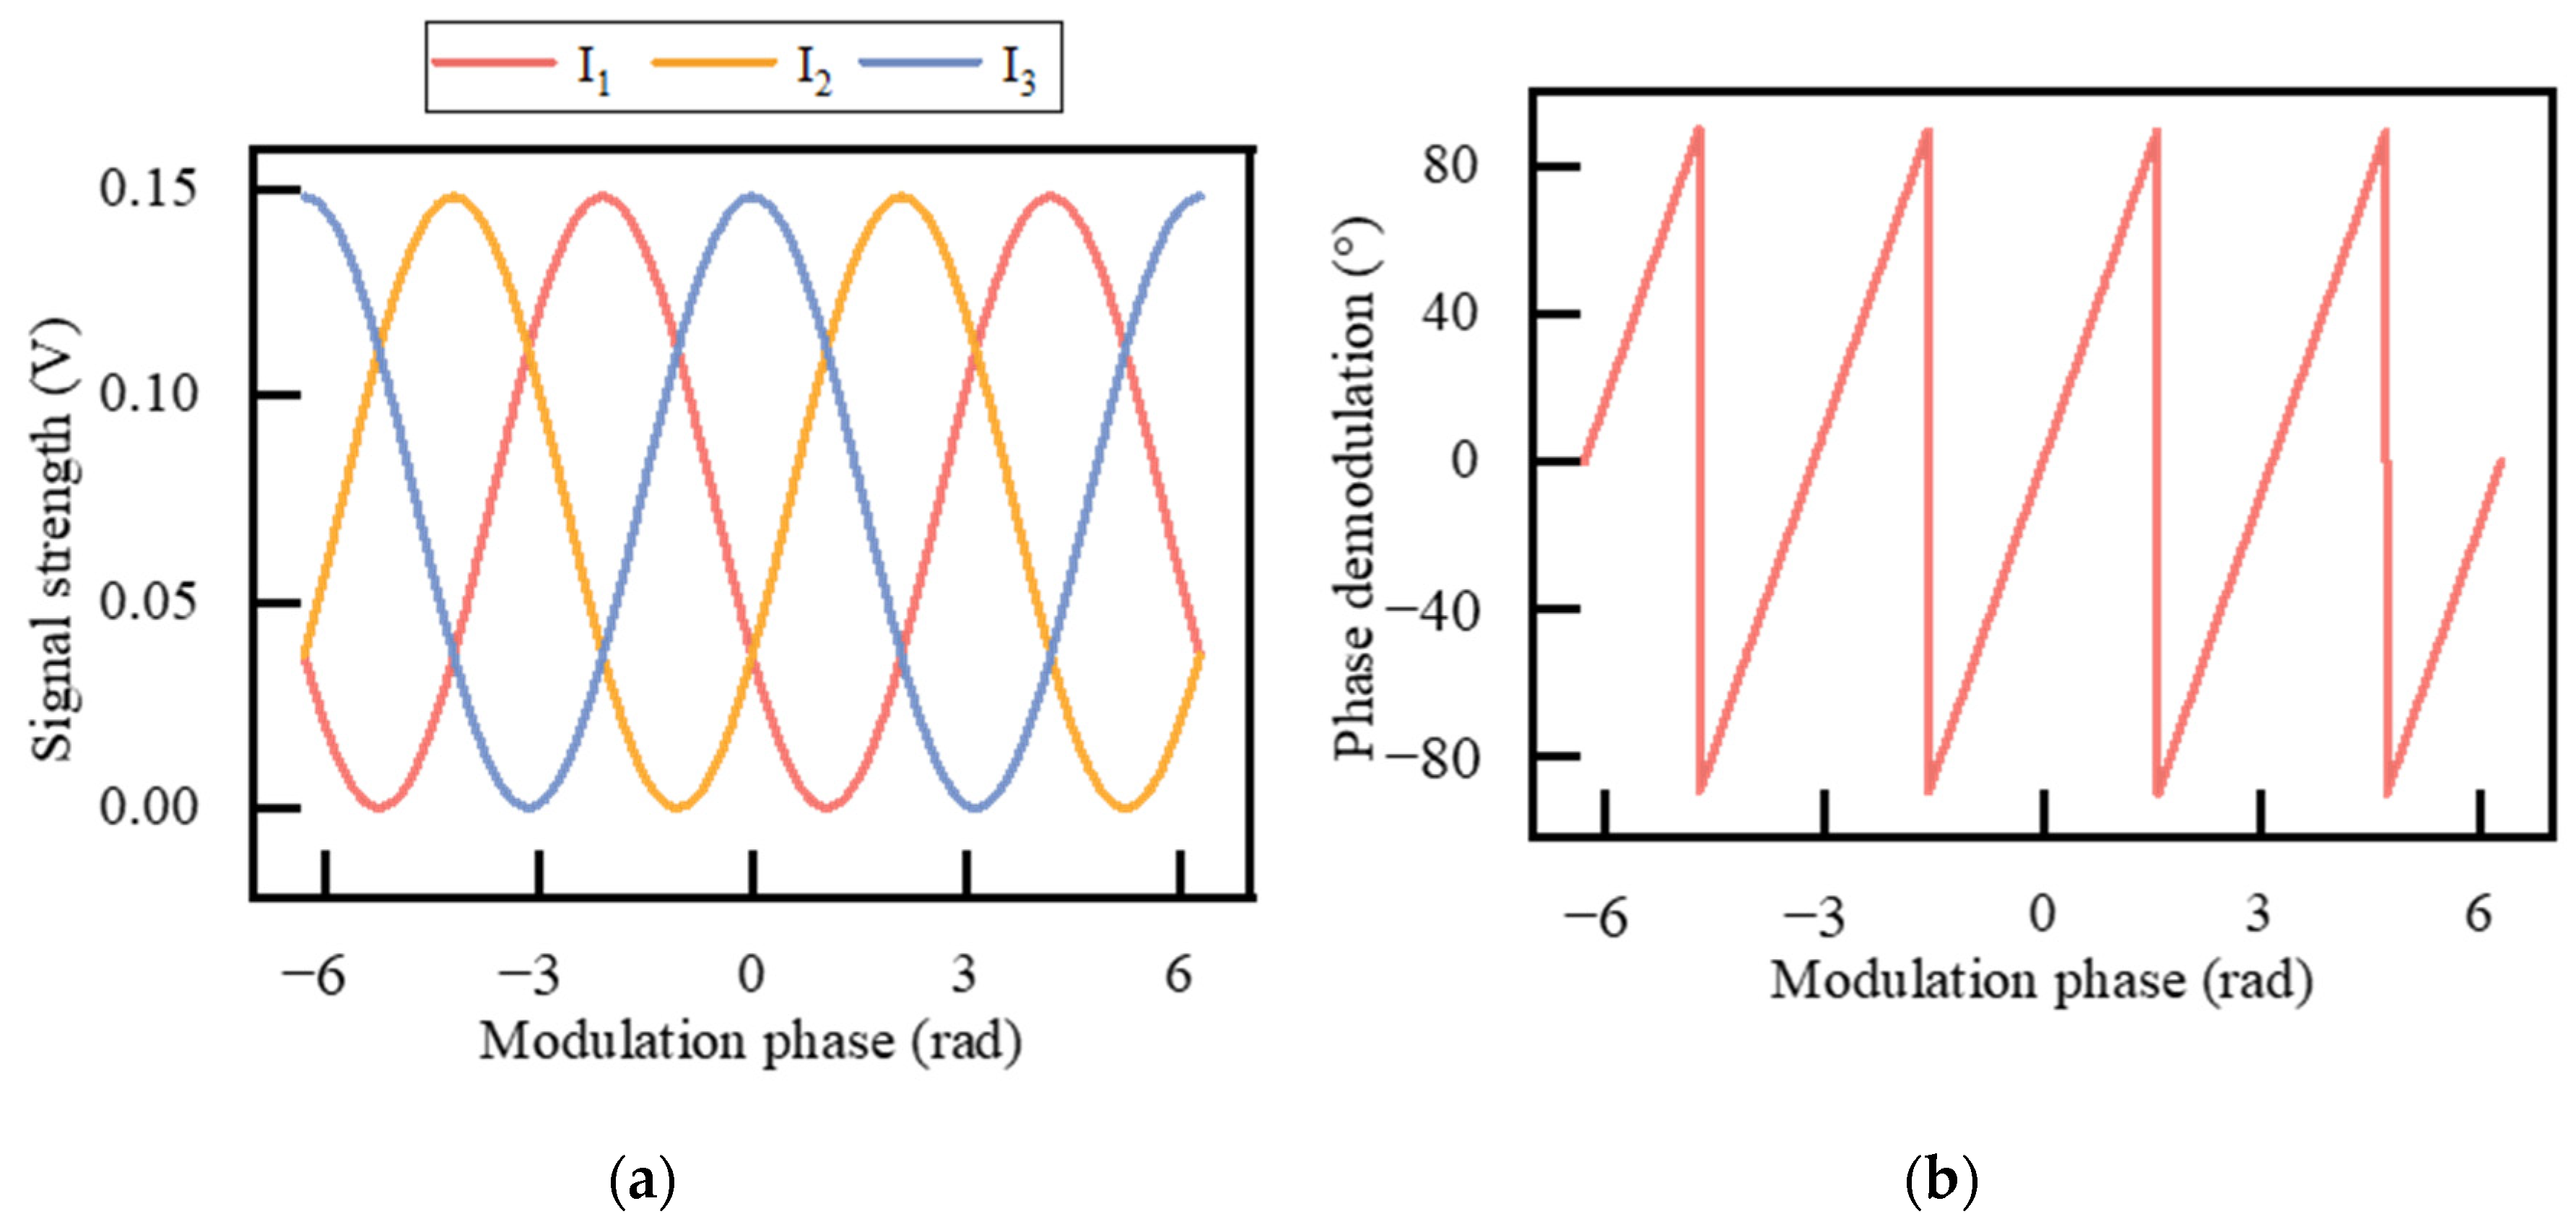
In the arctangent operation, the common factor ( s 1 s 2 s 3 d 1 d 2 d 3 ) 1 3 is eliminated, making the system insensitive to variations in optical path losses and thereby enhancing the stability of the sensing. It is important to note that when the magnitude of the Faraday phase shift exceeds 90°, the result obtained from the arctangent algorithm does not fully align with the actual phase shift. Further phase unwrapping processing is required to address this discrepancy. The simulation results are shown in Figure 2.

3. Experimental Results and Discussions

The pulse width of the pulsed light source is set to 100 ns, and the repetition frequency is set to 1 kHz. The single-mode fiber used in the experiment is G.652 fiber, and the lengths of the fiber delay lines are as follows: DF1 (approximately 25 m), DF2 (approximately 50 m), DF3 (approximately 75 m), and DF4 (approximately 150 m). Based on the lengths of the fiber delay lines and the pulse width used in the experiment, the nine pulses in the time domain are sequentially represented as I11, I21, I31, I12, I22, I32, I13, I23, and I33.
The current applied to the DC power supply is scanned from 0 to 5 A in increments of 1 A, and the experimental observations are shown in Figure 3. As can be seen from Figure 3, the intensity of the sensing signal changes with the current. Additionally, an overshoot is observed at the leading edge of each pulse sensing signal. Therefore, when processing the data, it is necessary to account for the impact of this issue by selecting the average value of the latter half of the pulse signal for demodulation and analysis.
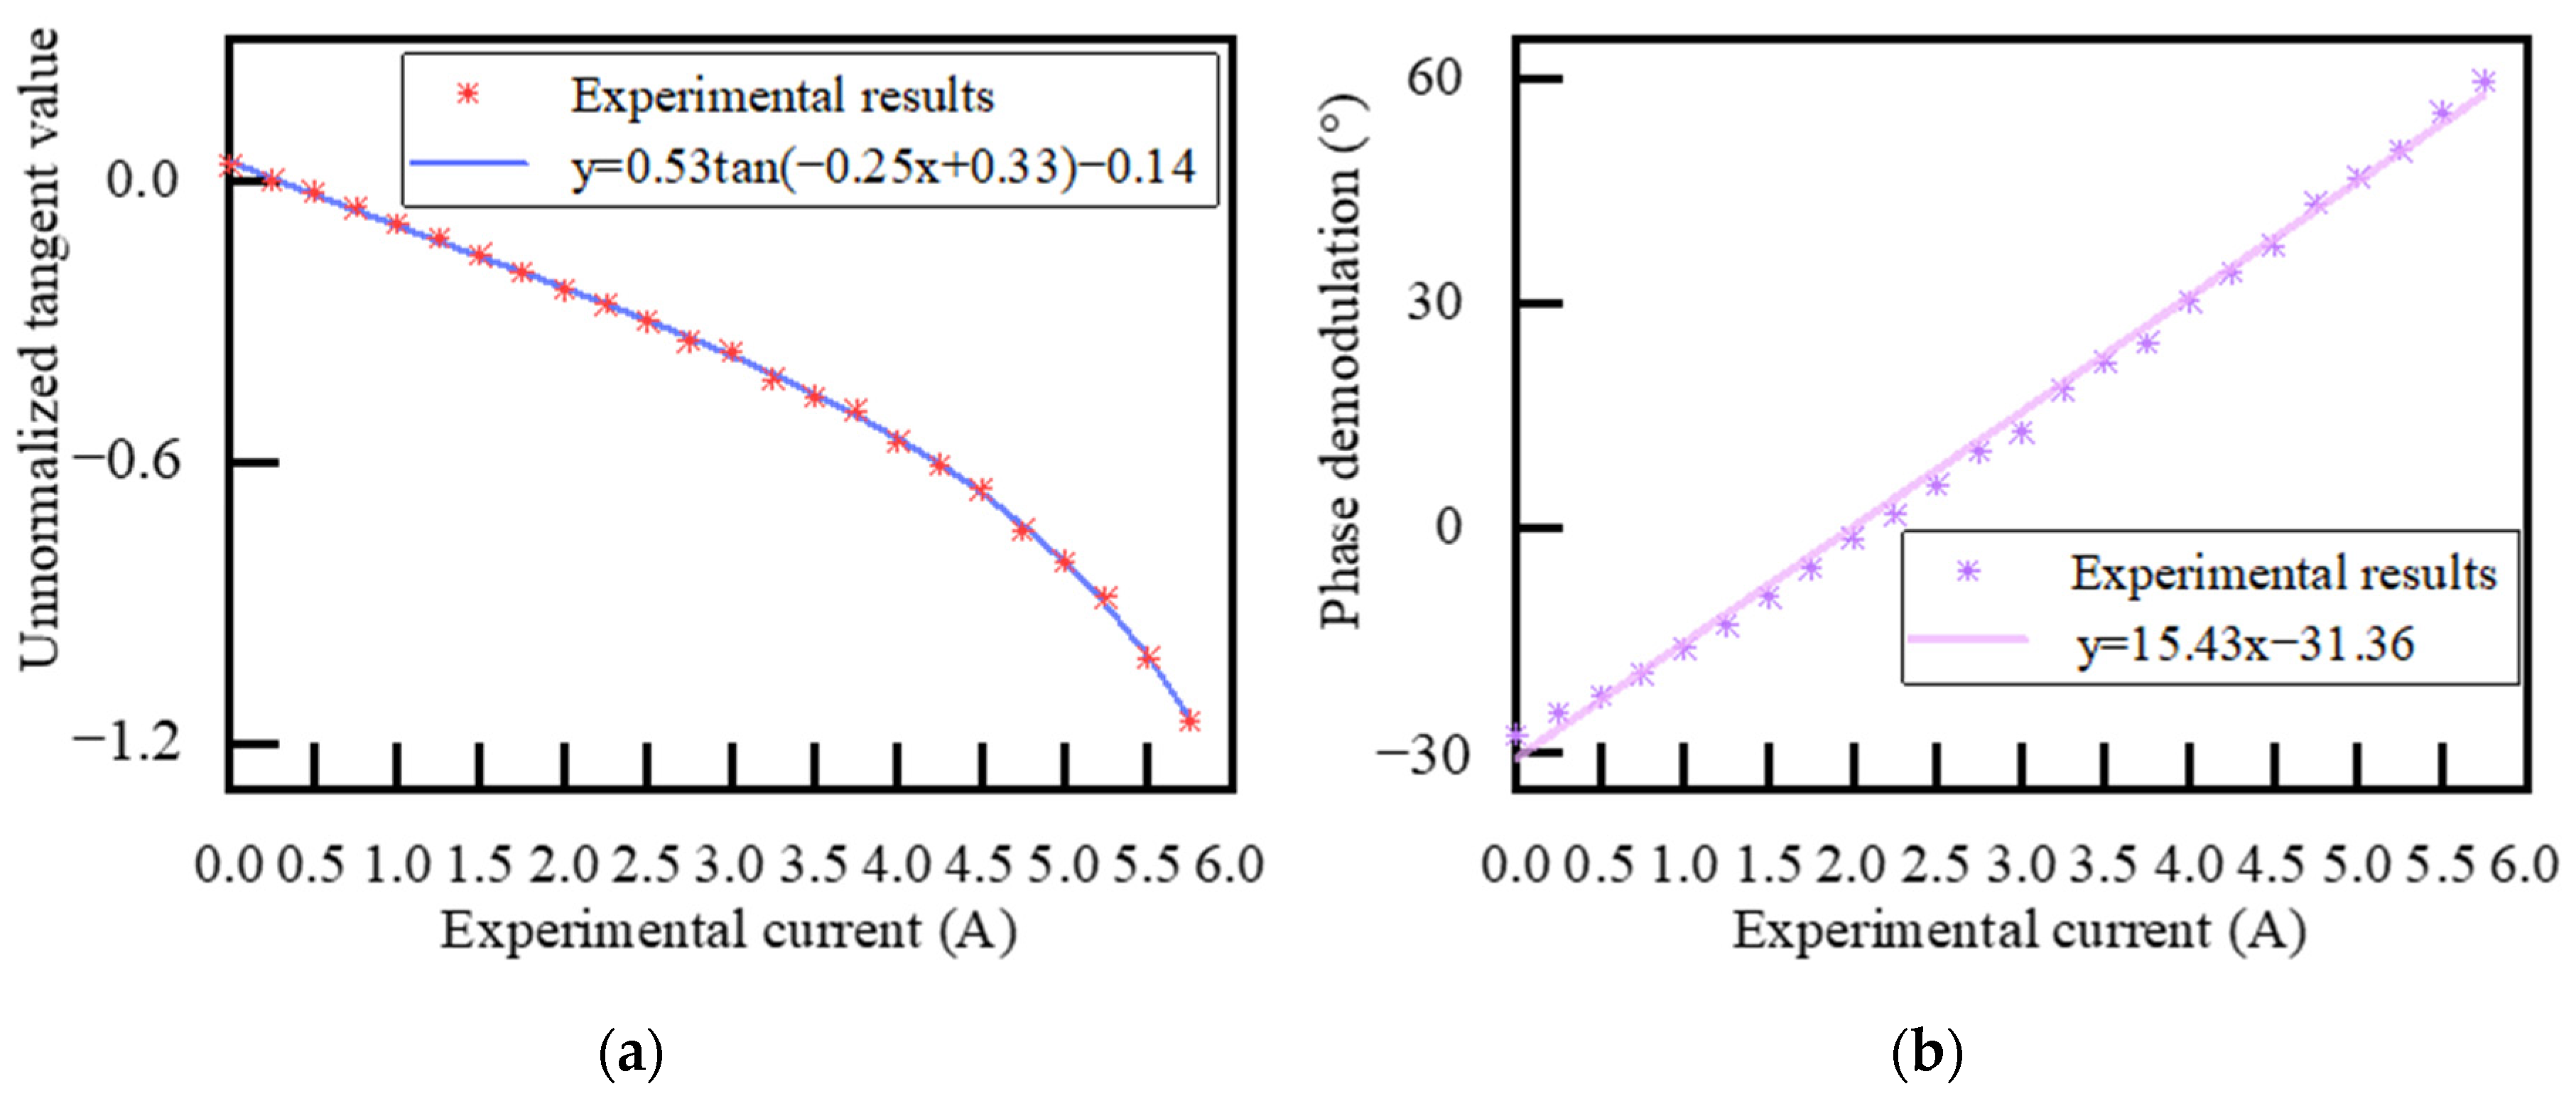
The sensing experiment was conducted at a temperature of 25 °C. Due to limitations in experimental conditions, the experimental current was set to vary from 0 to 5.75 A. Using a DC power supply, currents ranging from 0 to 5.75 A were applied to the coil, and experimental data were recorded at intervals of 0.25 A. The experimental data were uploaded to a computer and analyzed using MATLAB (R2017a) software. Based on the demodulation algorithm described earlier, the intensities of the sensing signals were synthesized to obtain the composite intensity. The arctangent algorithm was then applied to derive the unnormalized tangent values, as shown in the experimental results in Figure 4a. By fitting the tangent curve, the curve parameters were further eliminated, yielding normalized tangent values and enabling the arctangent operation to obtain the demodulated phase. The sensitivity curve of the demodulated phase versus the experimental current is shown in Figure 4b, demonstrating a linear relationship between the experimental current and the demodulated phase. Linear fitting revealed a sensitivity of 15.43°/A, an R-squared value of 0.9970, and a root mean square error of 1.9353, indicating a strong linear relationship between the experimental current and the demodulated phase. From the results of the demodulated phase, it can be observed that when the experimental current is less than or equal to 5.75 A, the phase shift caused by the Faraday effect does not exceed 90°, and thus, no phase unwrapping is required as there are no jump discontinuities in the demodulation results.
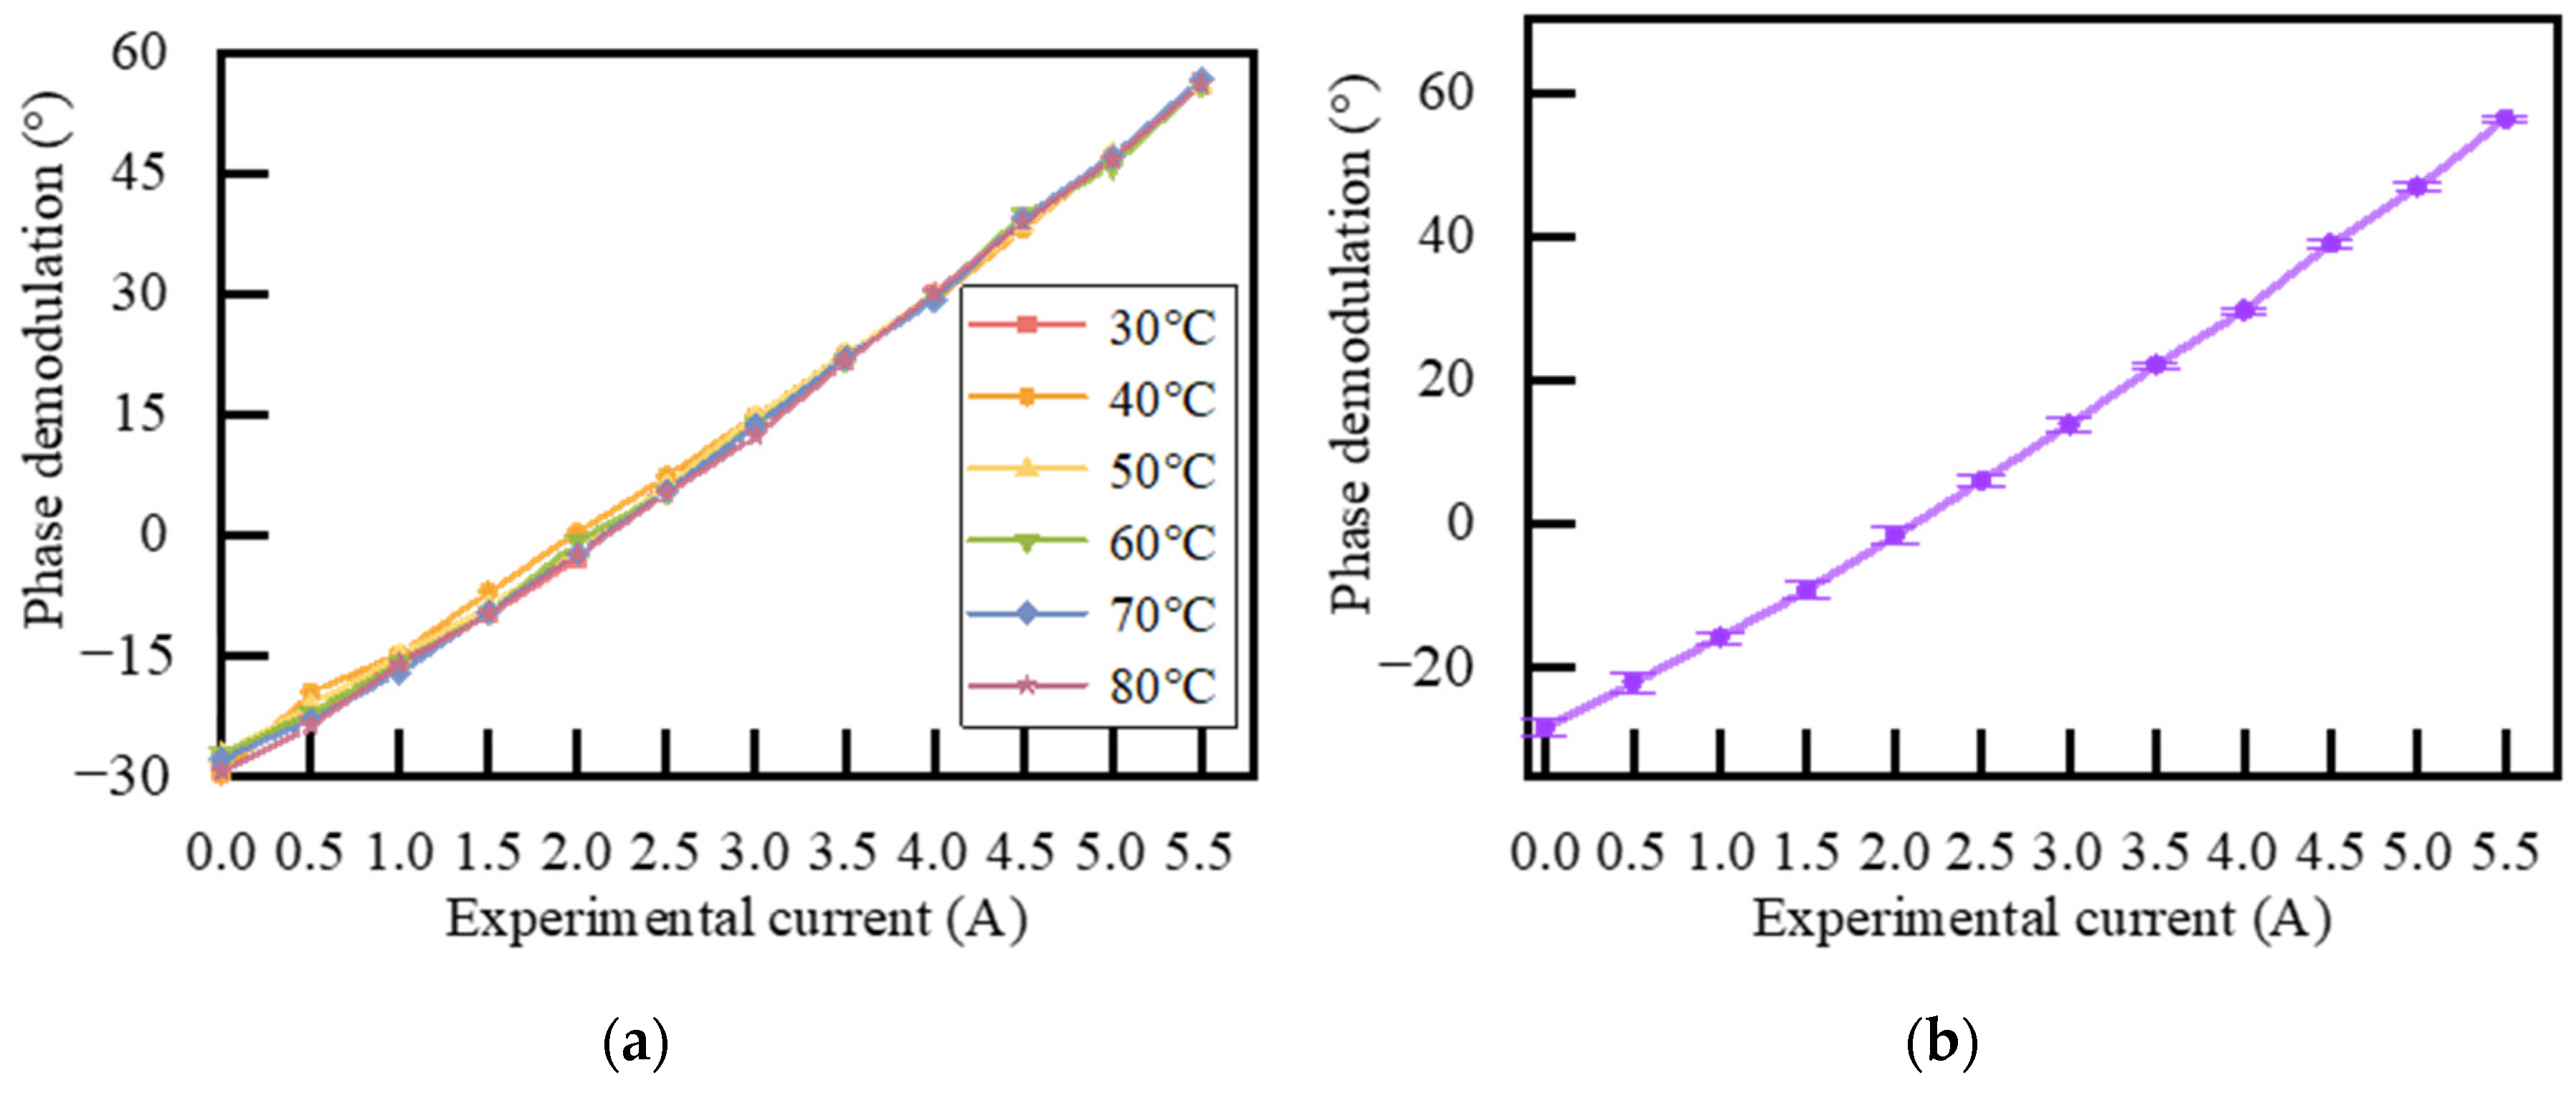
In the actual operation of FOCT, changes in external environmental temperature and coil heating may have an impact on the results. Therefore, the sensitivity of the FOCT at different temperatures was investigated. The sensitivity of the FOCT at different temperatures was investigated. A semiconductor temperature controller was used for temperature regulation, with one side of the sensing fiber fixed on a heating stage and insulated with thermal padding to enhance thermal retention. In the experiment, the temperature was gradually increased from 30 °C to 80 °C, and experimental data were collected and demodulated at intervals of 10 °C. The results, as shown in Figure 5, indicate that within the range of 30–80 °C, the sensitivity curve exhibited minimal variation, with a relative standard deviation of 1.133%. The designed FOCT demonstrated a certain level of stability across this temperature range.
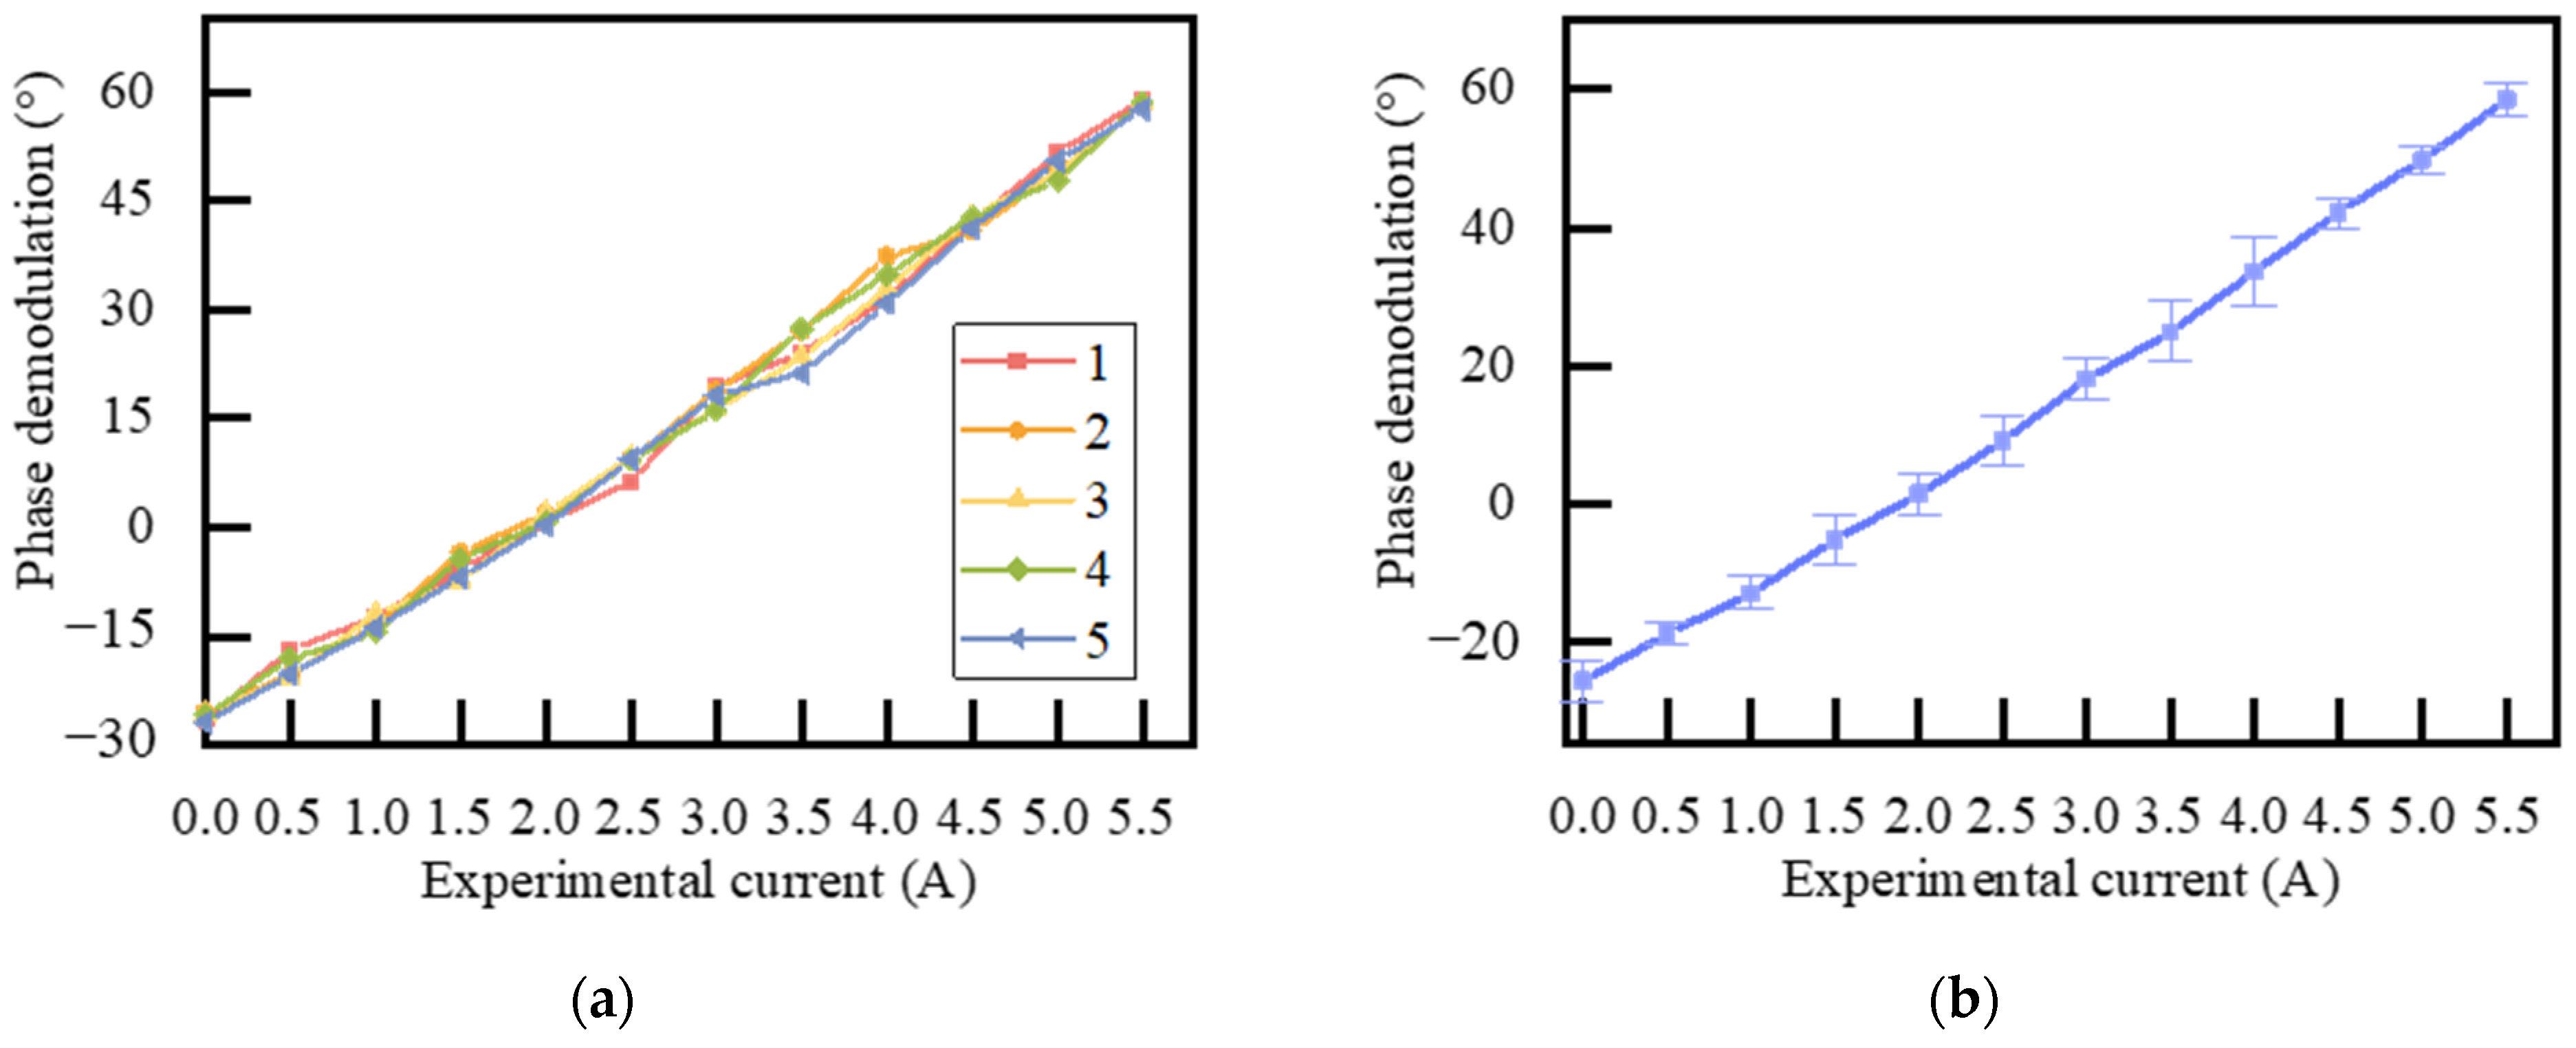
Finally, the repeatability and stability of the FOCT solution were analyzed through repeated experiments. Five experiments were conducted under the same conditions, and the demodulation results are shown in Figure 6. The relative standard deviation of the sensitivity was 1.745%, indicating that the system exhibits a certain level of repeatability with minimal variation in sensitivity.

4. Conclusions

In summary, the proposed FOCT solution based on the 3 × 3 coupler and passive multiplexing structure demonstrates a sensitivity of 15.43°/A. In intensity demodulation, the common factor, including losses in the transmission path, is removed, and the sensing system has good stability. The temperature experiments show that the experimental system has a relative stable deviation of 1.133% under temperature changes of 30 to 80 °C, and the relative standard deviation of the repeatability experiment is 1.745%. The designed FOCT provides a low-cost and simple demodulation passive sensing solution.

Author Contributions

Conceptualization, Y.L.; methodology, J.X.; software, J.H.; resources, F.P.; data curation, J.H.; writing—original draft preparation, Y.Z., Y.L. and J.X.; writing—review and editing, Y.Z., Y.L. and L.X.; supervision, L.X.; project administration, F.P. All authors have read and agreed to the published version of the manuscript.

Funding

This research was funded by the science and technology project of the STATE GRID Corporation of China, “Research on Key Technologies for Highly Durable FOCT”, project code 5500-202155473A-0-5-ZN.

Institutional Review Board Statement

Not applicable.

Informed Consent Statement

Not applicable.

Data Availability Statement

Relevant data are available from the authors upon reasonable request.

Conflicts of Interest

The authors declare no conflicts of interest.

References

  1. Wu, J.; Zhang, X. Recent Progress of All Fiber Optic Current Transformers. In Proceedings of the 2020 7th International Forum on Electrical Engineering and Automation (IFEEA), Hefei, China, 25–27 September 2020. [Google Scholar]
  2. Sima, W.; Zeng, L.; Yang, M.; Yuan, T.; Sun, P. Improving the temperature and vibration robustness of fiber optic current transformer using fiber polarization rotator. IEEE Trans. Instrum. Meas. 2022, 71, 1–12. [Google Scholar] [CrossRef]
  3. Li, Z.; Cui, J.; Chen, H.; Lu, H.; Zhou, F.; Rocha, P.R.F.; Yang, C. Research Progress of All-Fiber Optic Current Transformers in Novel Power Systems: A Review. Microw. Opt. Technol. Lett. 2025, 67, e70061. [Google Scholar] [CrossRef]
  4. Gao, H.; Wang, G.; Gao, W.; Li, S. A chiral photonic crystal fiber sensing coil for decreasing the polarization error in a fiber optic current sensor. Opt. Commun. 2020, 469, 125755. [Google Scholar] [CrossRef]
  5. Gubin, V.P.; Przhiyalkovskiy, Y.V.; Starostin, N.I.; Morshnev, S.; Sazonov, A. A broadband Faraday fiber-optic current sensor with excess noise compensation. Results Phys. 2020, 18, 103286. [Google Scholar] [CrossRef]
  6. Leal-Junior, A.; Díaz, C.; Frizera, A.; Lee, H.; Nakamura, K.; Mizuno, Y.; Marques, C. Highly Sensitive, Fiber-Optic Intrinsic Electromagnetic Field Sensing. Adv. Photonics Res. 2020, 2, 2000078. [Google Scholar] [CrossRef]
  7. Yan, D.; Chen, H.; Cheng, Q.; Wang, H. Enhanced Faraday effect by magneto-plasmonic structure design composed of bismuth-iron garnet. Opt. Laser Technol. 2023, 161, 109193. [Google Scholar] [CrossRef]
  8. Sun, T.; Yang, K.; Hao, D.; Hu, J.; Wang, X.; Dong, W.; Ding, K.; Kong, L. Temperature self-compensating photonic crystal fiber grating magnetic field sensor. Opt. Eng. 2024, 63, 036105. [Google Scholar] [CrossRef]
  9. Wang, G.; Wu, Y.; Guan, X.; Chen, X.; Yu, X. Highly sensitive fiber vector magnetic field sensor based on an open-cavity Mach-Zehnder interferometer filled with magnetic fluid. Sens. Actuators A Phys. 2025, 381, 116075. [Google Scholar] [CrossRef]
  10. Ning, Y.; Guo, H.; Qin, Y.; Zhang, Y.; Li, S.; Mou, J.; Zhang, M.; Zhang, Y.; Liu, Z.; Zhang, J.; et al. Ultrasensitive Fiber SPR Magnetic Field Sensor Using Au/TiO2 Schottky Junction. IEEE Sens. J. 2023, 23, 13823–13828. [Google Scholar] [CrossRef]
  11. Wu, J.; Zhang, X.; Chen, L.; Wu, B.; Peng, C. Research on All-Fiber Dual-Modulation Optic Current Sensor Based on Real-Time Temperature Compensation. IEEE Photonics J. 2022, 14, 1–9. [Google Scholar] [CrossRef]
  12. Li, Y.; Han, Y. Modeling and analysis of vibration characteristics of all fiber current sensor. In Proceedings of the 2021 International Conference on Neural Networks, Information and Communication Engineering, SPIE, Qingdao, China, 27–28 August 2021; Volume 11933, pp. 506–518. [Google Scholar]
  13. Huang, Y.; Xia, R. Polarization evolution in spun quarter wave plate and its influence on FOCS performance. J. Light. Technol. 2024, 42, 3891–3900. [Google Scholar] [CrossRef]
  14. Xin, G.; Zhu, J.; Luo, C.; Tang, J.; Li, W.; Cao, Y.; Xu, H. Polarization Error Analysis of an All-Optical Fibre Small Current Sensor for Partial Discharge. J. Electr. Eng. Technol. 2020, 15, 2199–2210. [Google Scholar] [CrossRef]
  15. Yang, H.; Qiao, L.; Yang, Y.; Huang, W.; Sun, S. Thermally induced error analysis and suppression of optic fiber delay loop in the different variable rate of temperature. Optik 2019, 193, 162994. [Google Scholar] [CrossRef]
  16. Chen, S.; Liu, Z.; Niu, X.; Huang, J.; Zhao, L.; Ke, Y.; Xia, L. Highly Sensitive Fiber Optic Current Sensors with Integrated λ/4 Retarder. Microw. Opt. Technol. Lett. 2024, 66, e70025. [Google Scholar] [CrossRef]
  17. Tian, J.; Yu, A.; Wang, Z.; Xia, L. A differential-self-multiplication demodulation algorithm for fiber optic current sensor. Opt. Laser Technol. 2024, 169, 110041. [Google Scholar] [CrossRef]
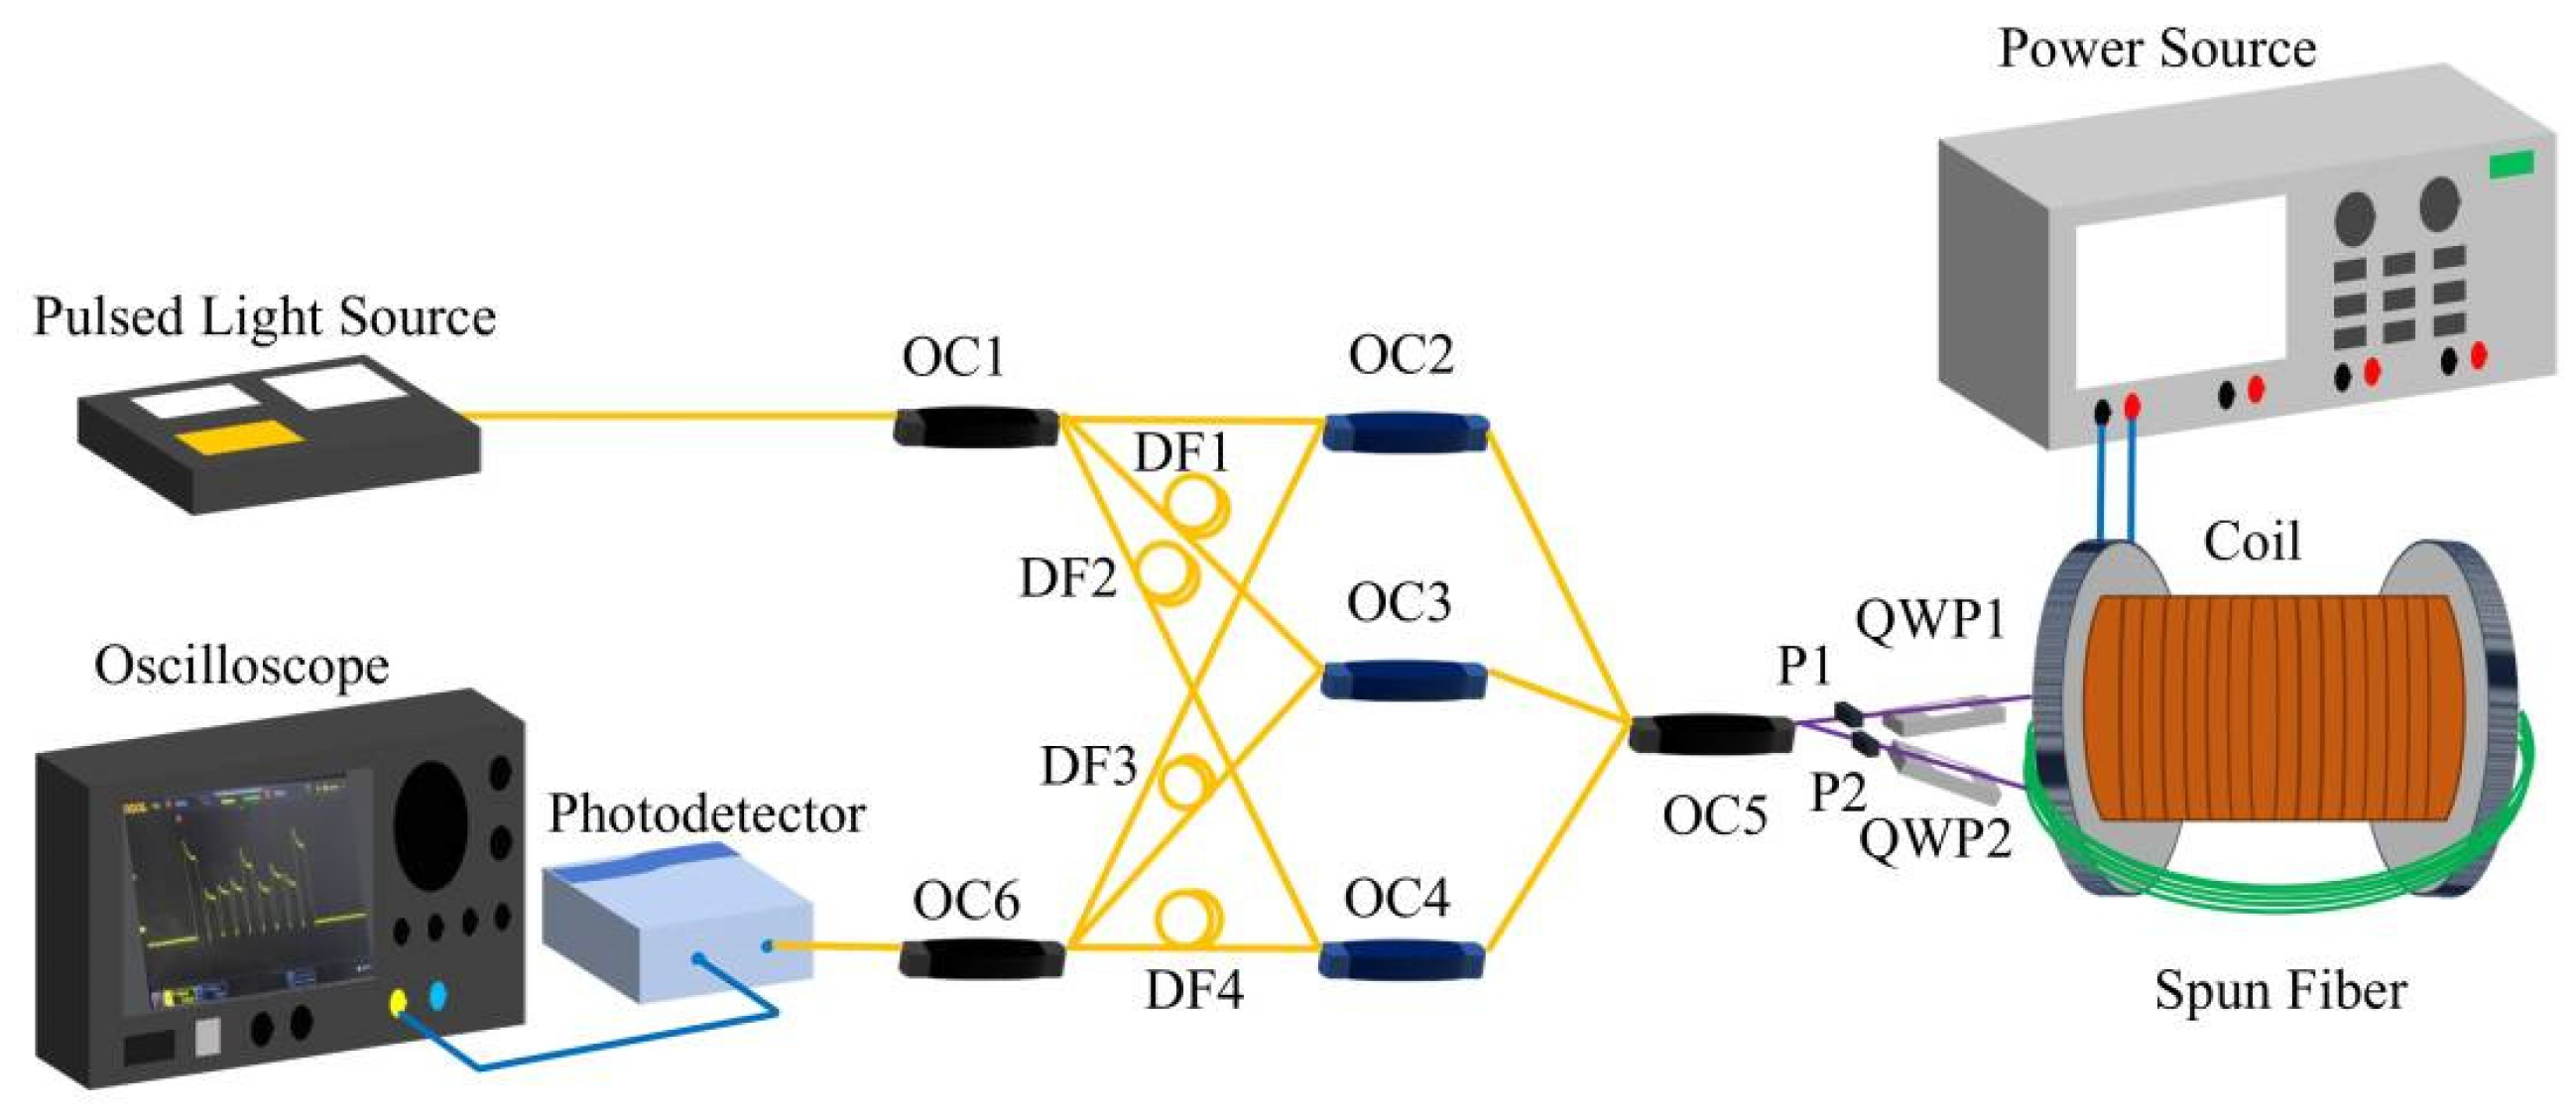
Figure 1. Schematic diagram of the FOCT structure based on a 3 × 3 coupler and passive multiplexing configuration.
Photonics 12 00506 g001
Figure 2. Simulation demodulation results: (a) three synthesized intensities and (b) demodulated phase.
Photonics 12 00506 g002
Figure 3. Experimental results of pulse output under different currents.
Photonics 12 00506 g003
Figure 4. Experimental results of 3 × 3 coupler-based FOCT: (a) unnormalized tangent values and fitted curve, and (b) demodulated sensitivity curve.
Photonics 12 00506 g004
Figure 5. Experimental results at different temperatures: (a) experimental results and (b) error bar analysis of the sensitivity curve.
Photonics 12 00506 g005
Figure 6. Sensitivity curve results from multiple experiments: (a) experimental results and (b) error bar analysis of the sensitivity curve.
Photonics 12 00506 g006
Disclaimer/Publisher’s Note: The statements, opinions and data contained in all publications are solely those of the individual author(s) and contributor(s) and not of MDPI and/or the editor(s). MDPI and/or the editor(s) disclaim responsibility for any injury to people or property resulting from any ideas, methods, instructions or products referred to in the content.