Article

Exploiting a Multi-Mode Laser in Homodyne Detection for Vacuum-Fluctuation-Based Quantum Random Number Generator

Quantum Team, SK Telecom, 65, Eulji-ro, Jung-gu, Seoul 04539, Republic of Korea
*
Author to whom correspondence should be addressed.
Photonics 2025, 12(9), 851; https://doi.org/10.3390/photonics12090851
Submission received: 4 August 2025 / Revised: 18 August 2025 / Accepted: 20 August 2025 / Published: 25 August 2025
(This article belongs to the Section Quantum Photonics and Technologies)

Abstract

To realize a vacuum-fluctuation-based quantum random number generator (QRNG), various implementations can be explored to improve efficiency and practicality. In this study, we employed a multi-mode (MM) laser as the local oscillator in a vacuum-fluctuation QRNG and compared its performance with that of a conventional single-mode (SM) laser. Despite experiencing frequency-mode hopping, the MM laser successfully interfered with the vacuum state, similar to the SM reference. The common-mode rejection ratio of the balanced homodyne detection setup exceeded 35 dB for all laser sources. The digitized raw data were processed with a cryptographic hash function to generate full-entropy data. These outputs passed both the independent and identically distributed test recommended in NIST SP 800-90B and the statistical test suite under the SP 800-22 guideline, confirming their quality as quantum random numbers. Our results demonstrate that full-entropy data derived from either SM or MM lasers are applicable to systems requiring high-quality randomness, such as quantum key distribution. This study represents the first demonstration of an MM-laser-based vacuum-fluctuation QRNG, achieving a generation rate of 10 Gbps and indicating potential for compact and practical implementation.

1. Introduction

Random numbers are core resources for various applications, including stochastic simulations [1], numerical modeling [2], quantitative finance [3], and cryptography [4,5]. Conventionally, pseudo-random numbers generated by mathematical algorithms have been widely used for these purposes [6,7]. However, due to their deterministic characteristics, the demand for true random numbers, which possess intrinsic unpredictability and unbiasedness, has been growing in recent years. In particular, quantum random number generators (QRNGs) have been considered one of the most promising candidates, as they exploit the quantum nature of physical systems.
Numerous QRNGs have been demonstrated in the past several decades. First-generation techniques relied on radioactive decay [8,9] and electronic noise [4,10], which are categorized as non-optical QRNGs [11]. However, due to the wide range of implementation possibilities based on various quantum properties of light, optical QRNGs have become the dominant approach [12]. Optical QRNGs are generally divided into two groups: discrete-variable (DV) and continuous-variable (CV) types. DV QRNGs derive randomness from polarization states [13], path splitting [14], number statistics [15,16], and arrival times [17,18] of photons. In CV QRNGs, quantum entropy sources include laser phase noise [19,20,21,22], spontaneous emission [23,24], amplified spontaneous emission (ASE) [25,26,27,28], Raman scattering [29,30,31], and vacuum fluctuations [32,33,34,35,36,37,38,39,40,41,42]. DV QRNGs that employ single-photon detectors or photon-number-resolving detectors suffer from limited generation rates due to detector dead time. Therefore, CV QRNGs are more suitable for achieving high speeds, such as those in the gigabit-per-second (Gbps) range.
Compared to other CV QRNG schemes, QRNGs that utilize vacuum fluctuations offer several practical advantages by avoiding the technical complexities underlying alternative approaches. First, unlike QRNGs relying on phase noise, there is no need to actively stabilize an interferometer [20] or maintain a constant optical power level [21]. In addition, vacuum-based schemes do not require rapid gain switching at rates as high as 1 GHz [22]. Second, schemes using spontaneous emission face challenges in efficiently collecting emitted light and coupling it into a high-speed photodiode (PD) with a very small active area. Although ASE sources such as superluminescent diodes (SLDs) [28] can improve collection efficiency, they tend to be expensive and less accessible. Third, methods employing Raman scattering require both a strong pump beam and a suitable medium, such as diamond [29], which adds complexity to the setup.
In this paper, we present a QRNG system that draws on vacuum fluctuations as the quantum entropy source, relatively free from the technical difficulties faced by other CV QRNG approaches. Although several vacuum-fluctuation-based QRNGs achieving Gbps generation rates have been reported [34,35,36,37,38,39,41], to the best of our knowledge, no prior work has incorporated a multi-mode laser as a local oscillator (LO) in such a system. Multi-mode lasers do not require single-mode operation, and their configurations are typically simpler, which makes them relatively more cost-effective compared to single-mode or single-frequency lasers. In this study, we used multi-mode laser sources without temperature stabilization. Typically, temperature control is required to ensure the stable operation of a single frequency component. However, due to the nature of the vacuum state, which contains an infinite number of modes, it can effectively couple with the multiple frequency components of a multi-mode laser beam. This relaxed requirement simplifies the design of the LO driving circuit, eliminating the need for feedback systems, thermoelectric coolers (TECs), or thermistors. Furthermore, the multi-mode laser used in our setup delivered higher output power than the reference single-mode laser under the same injection current. This allowed the LO, and consequently the entire system, to operate with lower electrical power consumption.
We employed two multi-mode lasers and one single-mode laser to construct a balanced homodyne detection (BHD) system, with the single-mode laser serving as a reference for comparison. Except for the light source, all other components in the experimental setup were kept identical. The raw data obtained from the BHD system were transmitted to a field-programmable gate array (FPGA) board equipped with an analog-to-digital converter (ADC). Within the FPGA board, the raw data were digitized and processed into full-entropy data using a secure hash algorithm 3 (SHA3) [43]. The final output bit stream was generated at a rate of 10 Gbps, then tested and validated using the NIST entropy source validation [44] and statistical test suite [45]. These verified full-entropy data can serve as true random numbers for cryptographic applications, including quantum key distribution (QKD), highlighting the feasibility of an economical and high-speed QRNG architecture.

2. Materials and Methods

Figure 1 illustrates the schematic of our QRNG system. The QRNG system utilized three types of laser sources: two multi-mode and one single-mode source. Their fiber-coupled outputs were collimated through aspheric lenses. A fraction of each beam was sent to a CMOS camera for transverse-mode observation. A plano-convex lens was used to focus the beam onto the CMOS sensor, allowing analysis of the far-field intensity pattern.
An optical isolator was installed to prevent back-reflection, which could degrade the quality of the vacuum fluctuation signal measured through the BHD. To measure the common-mode rejection ratio (CMRR), we introduced an acousto-optic modulator (AOM; 3080-122, Gooch & Housego, Dowlish Ford, Ilminster, UK). Ideally, the spatial separation between the zeroth- and first-order diffracted beams inhibits the generation of a beat signal. However, in practice, a residual amount of the first-order component propagates along the same direction as the zeroth-order beam. We utilized this effect to evaluate the balance quality of the BHD system: when the beat signals entering the two PDs became nearly equal in amplitude, they were substantially canceled through subtraction, resulting in effective suppression of the beat signal at the BHD output.
After the AOM, the beam was split into two paths. One path was directed to a Fabry–Pérot cavity for longitudinal-mode analysis. The other path, the main beam, was combined with the vacuum state at a beam splitter. The resulting signal was measured by the BHD system, which consisted of a custom-ordered balanced homodyne detector (LD-PD PTE. LTD., Singapore) and an additional RF amplifier. To eliminate spurious peaks observed in the RF spectrum around the LTE (Long-Term Evolution) and 5G (Fifth-Generation) bands—originating from ambient electromagnetic radiation in our telecommunication environment—the BHD setup was enclosed in a custom-made electromagnetic shielding box. The signal from the BHD output was then transmitted to the FPGA board. Inside the FPGA board, the signal was digitized by a 12-bit ADC operating at a sampling rate of 2.5 GSa/s. From each sample, 8 bits were selected based on their entropy. This selection serves as a pre-processing step to reduce bias and increase the entropy rate, in line with the guideline described in NIST SP 800-90B (Section 6.4, “Reducing the Symbol Space”) [44]. It also helps to reduce computational overhead in subsequent processing. A total of 96 such 8-bit outputs were collected and concatenated to form a 768-bit input. This was then fed into the SHA3-384 hash function. The hashed output constituted full-entropy data.
To assess the quality and statistical properties of the extracted data, we performed two categories of evaluation based on NIST standards: (1) entropy estimation and independent and identically distributed (i.i.d.) test in accordance with SP 800-90B [44], and (2) a statistical test suite for randomness accompanying SP 800-22 [45]. The results from these evaluations were used to characterize the output quality of each laser configuration, and data that satisfied the criteria were considered for use as quantum random numbers.

3. Results

3.1. Characterization of Multi-Mode Lasers

3.1.1. Optical Power Efficiency

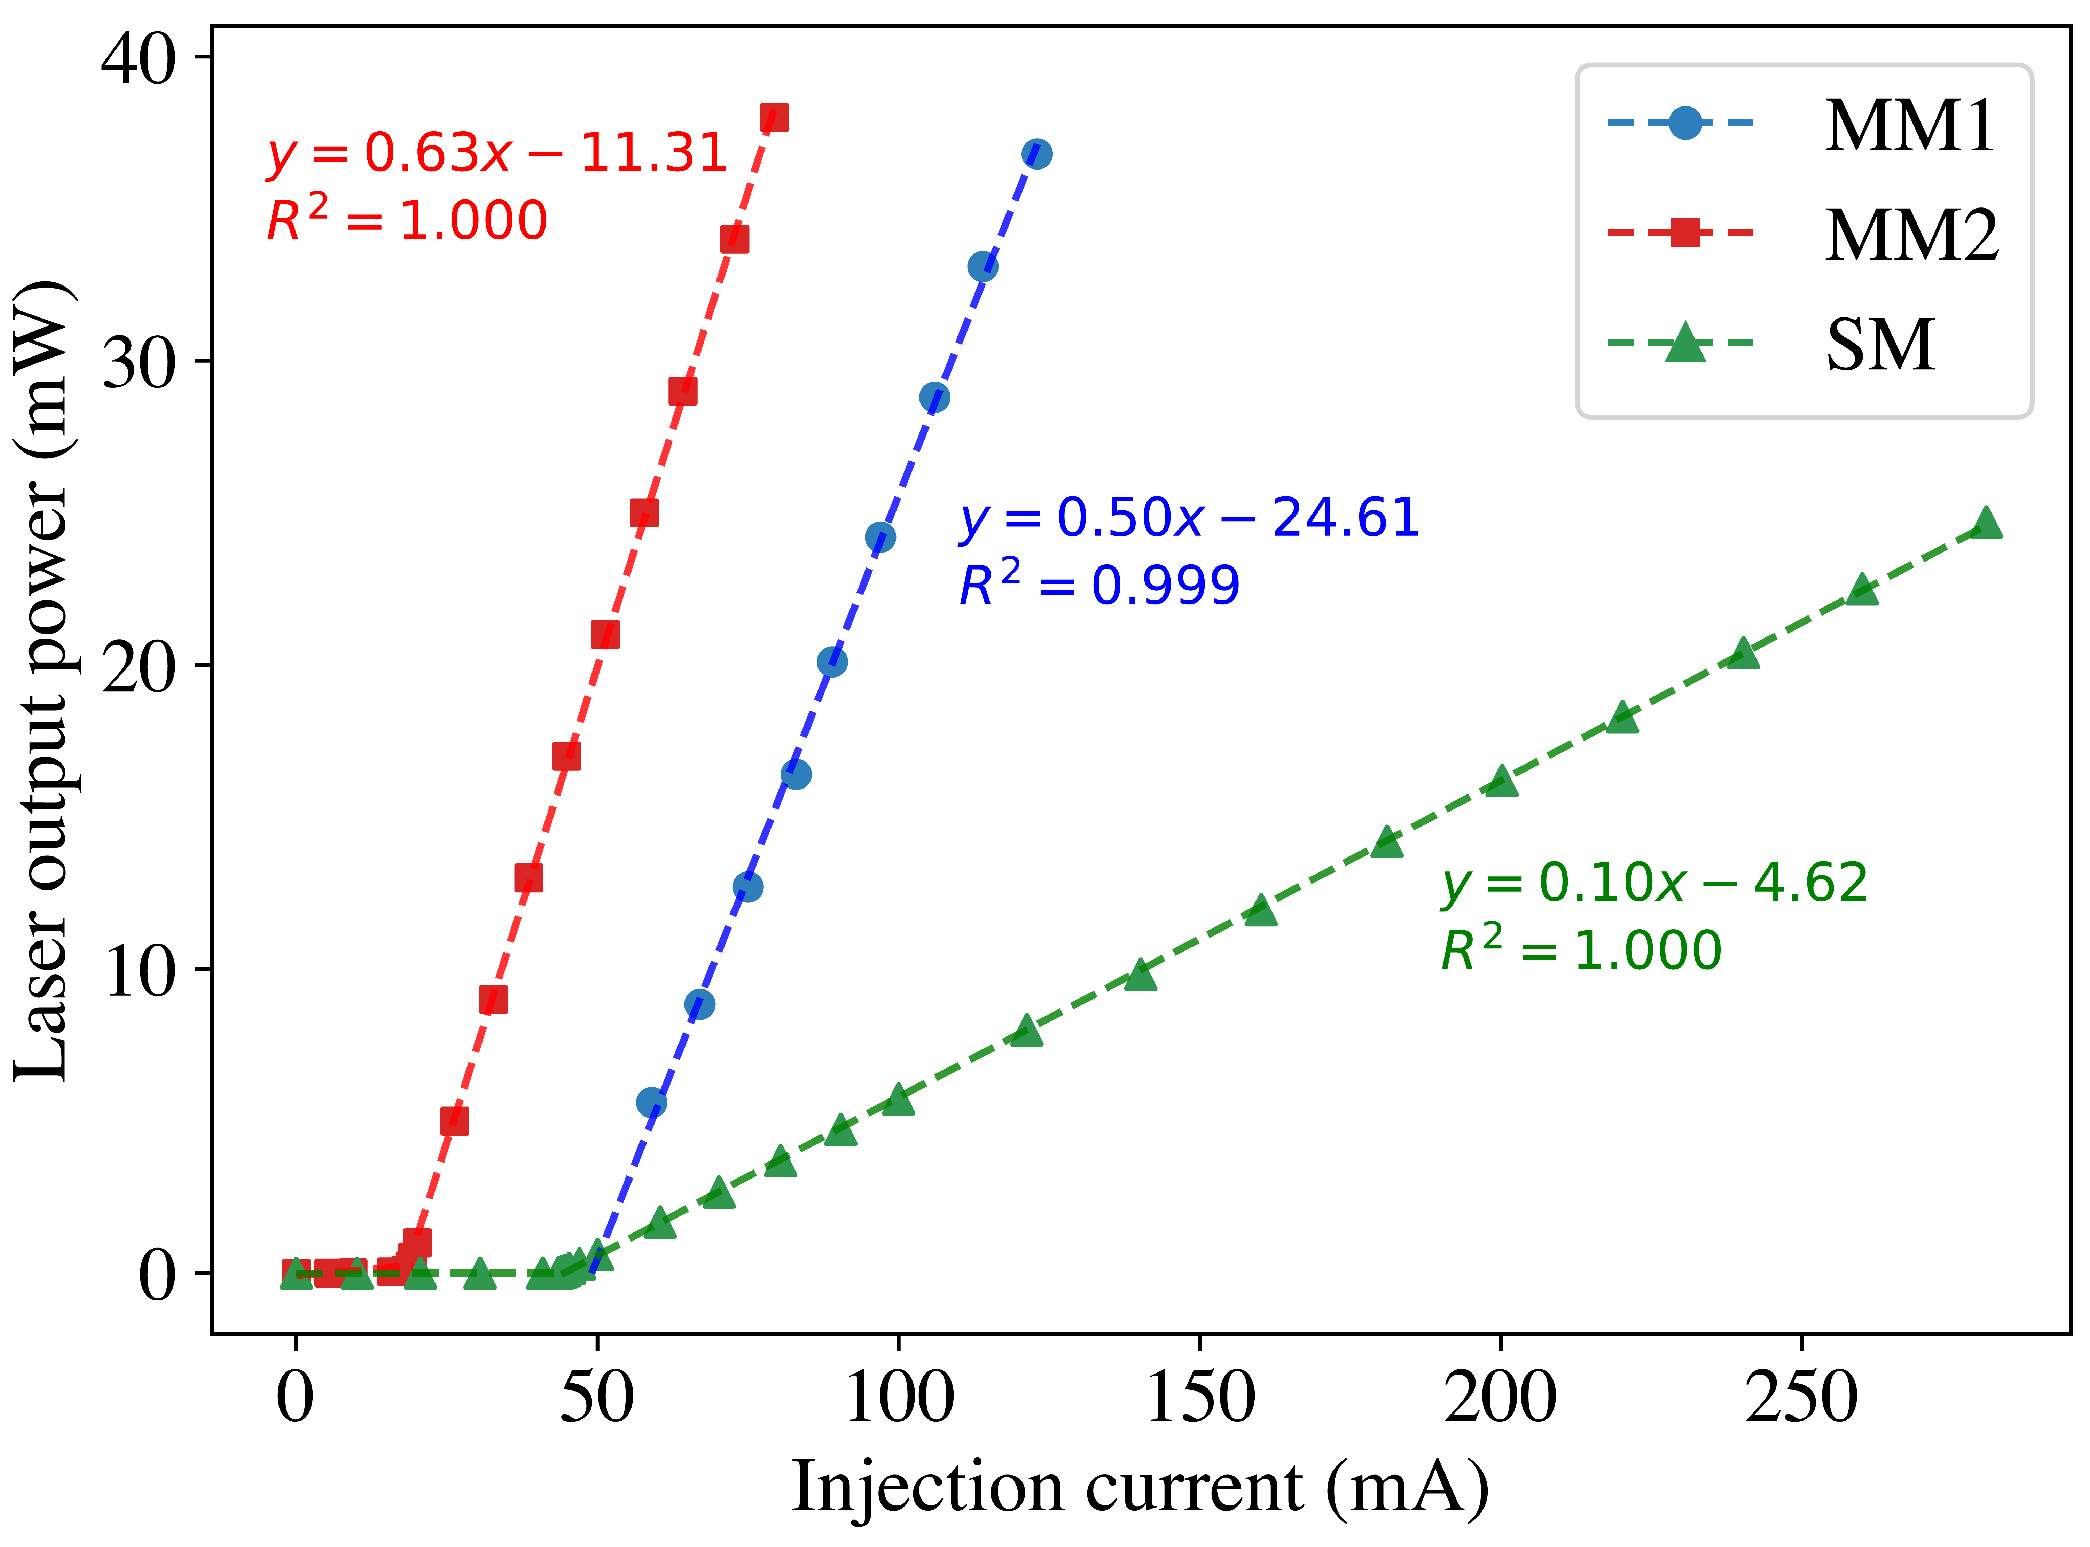
Figure 2 shows the laser output power as a function of injection current for three different types of sources: multi-mode 1 (MM1), multi-mode 2 (MM2), and single-mode (SM). Data points for MM1, MM2, and SM are represented by blue circles, red squares, and green triangles, respectively. MM1 and MM2 were operated without any cooling, whereas SM was driven under temperature stabilization using a feedback-controlled TEC.
For MM1, the laser was supplied as an integrated module with a built-in driver, which did not allow the injection current to be lowered below the lasing threshold. Therefore, only the lasing region could be measured. Linear fitting was applied to the lasing region data of all three sources. As depicted in Figure 2, the slopes of MM1 and MM2 were over fivefold higher compared to SM, indicating that the selected multi-mode sources exhibit significantly higher power efficiency.
Since the forward voltages were similar for all sources, a lower injection current in MM1 and MM2 results in reduced electrical power consumption for the same level of optical output. Given that the magnitude of vacuum fluctuations in a BHD system is proportional to the LO power, this configuration enables the generation of sufficiently strong quantum noise signals with reduced electrical power.

3.1.2. Transverse Mode

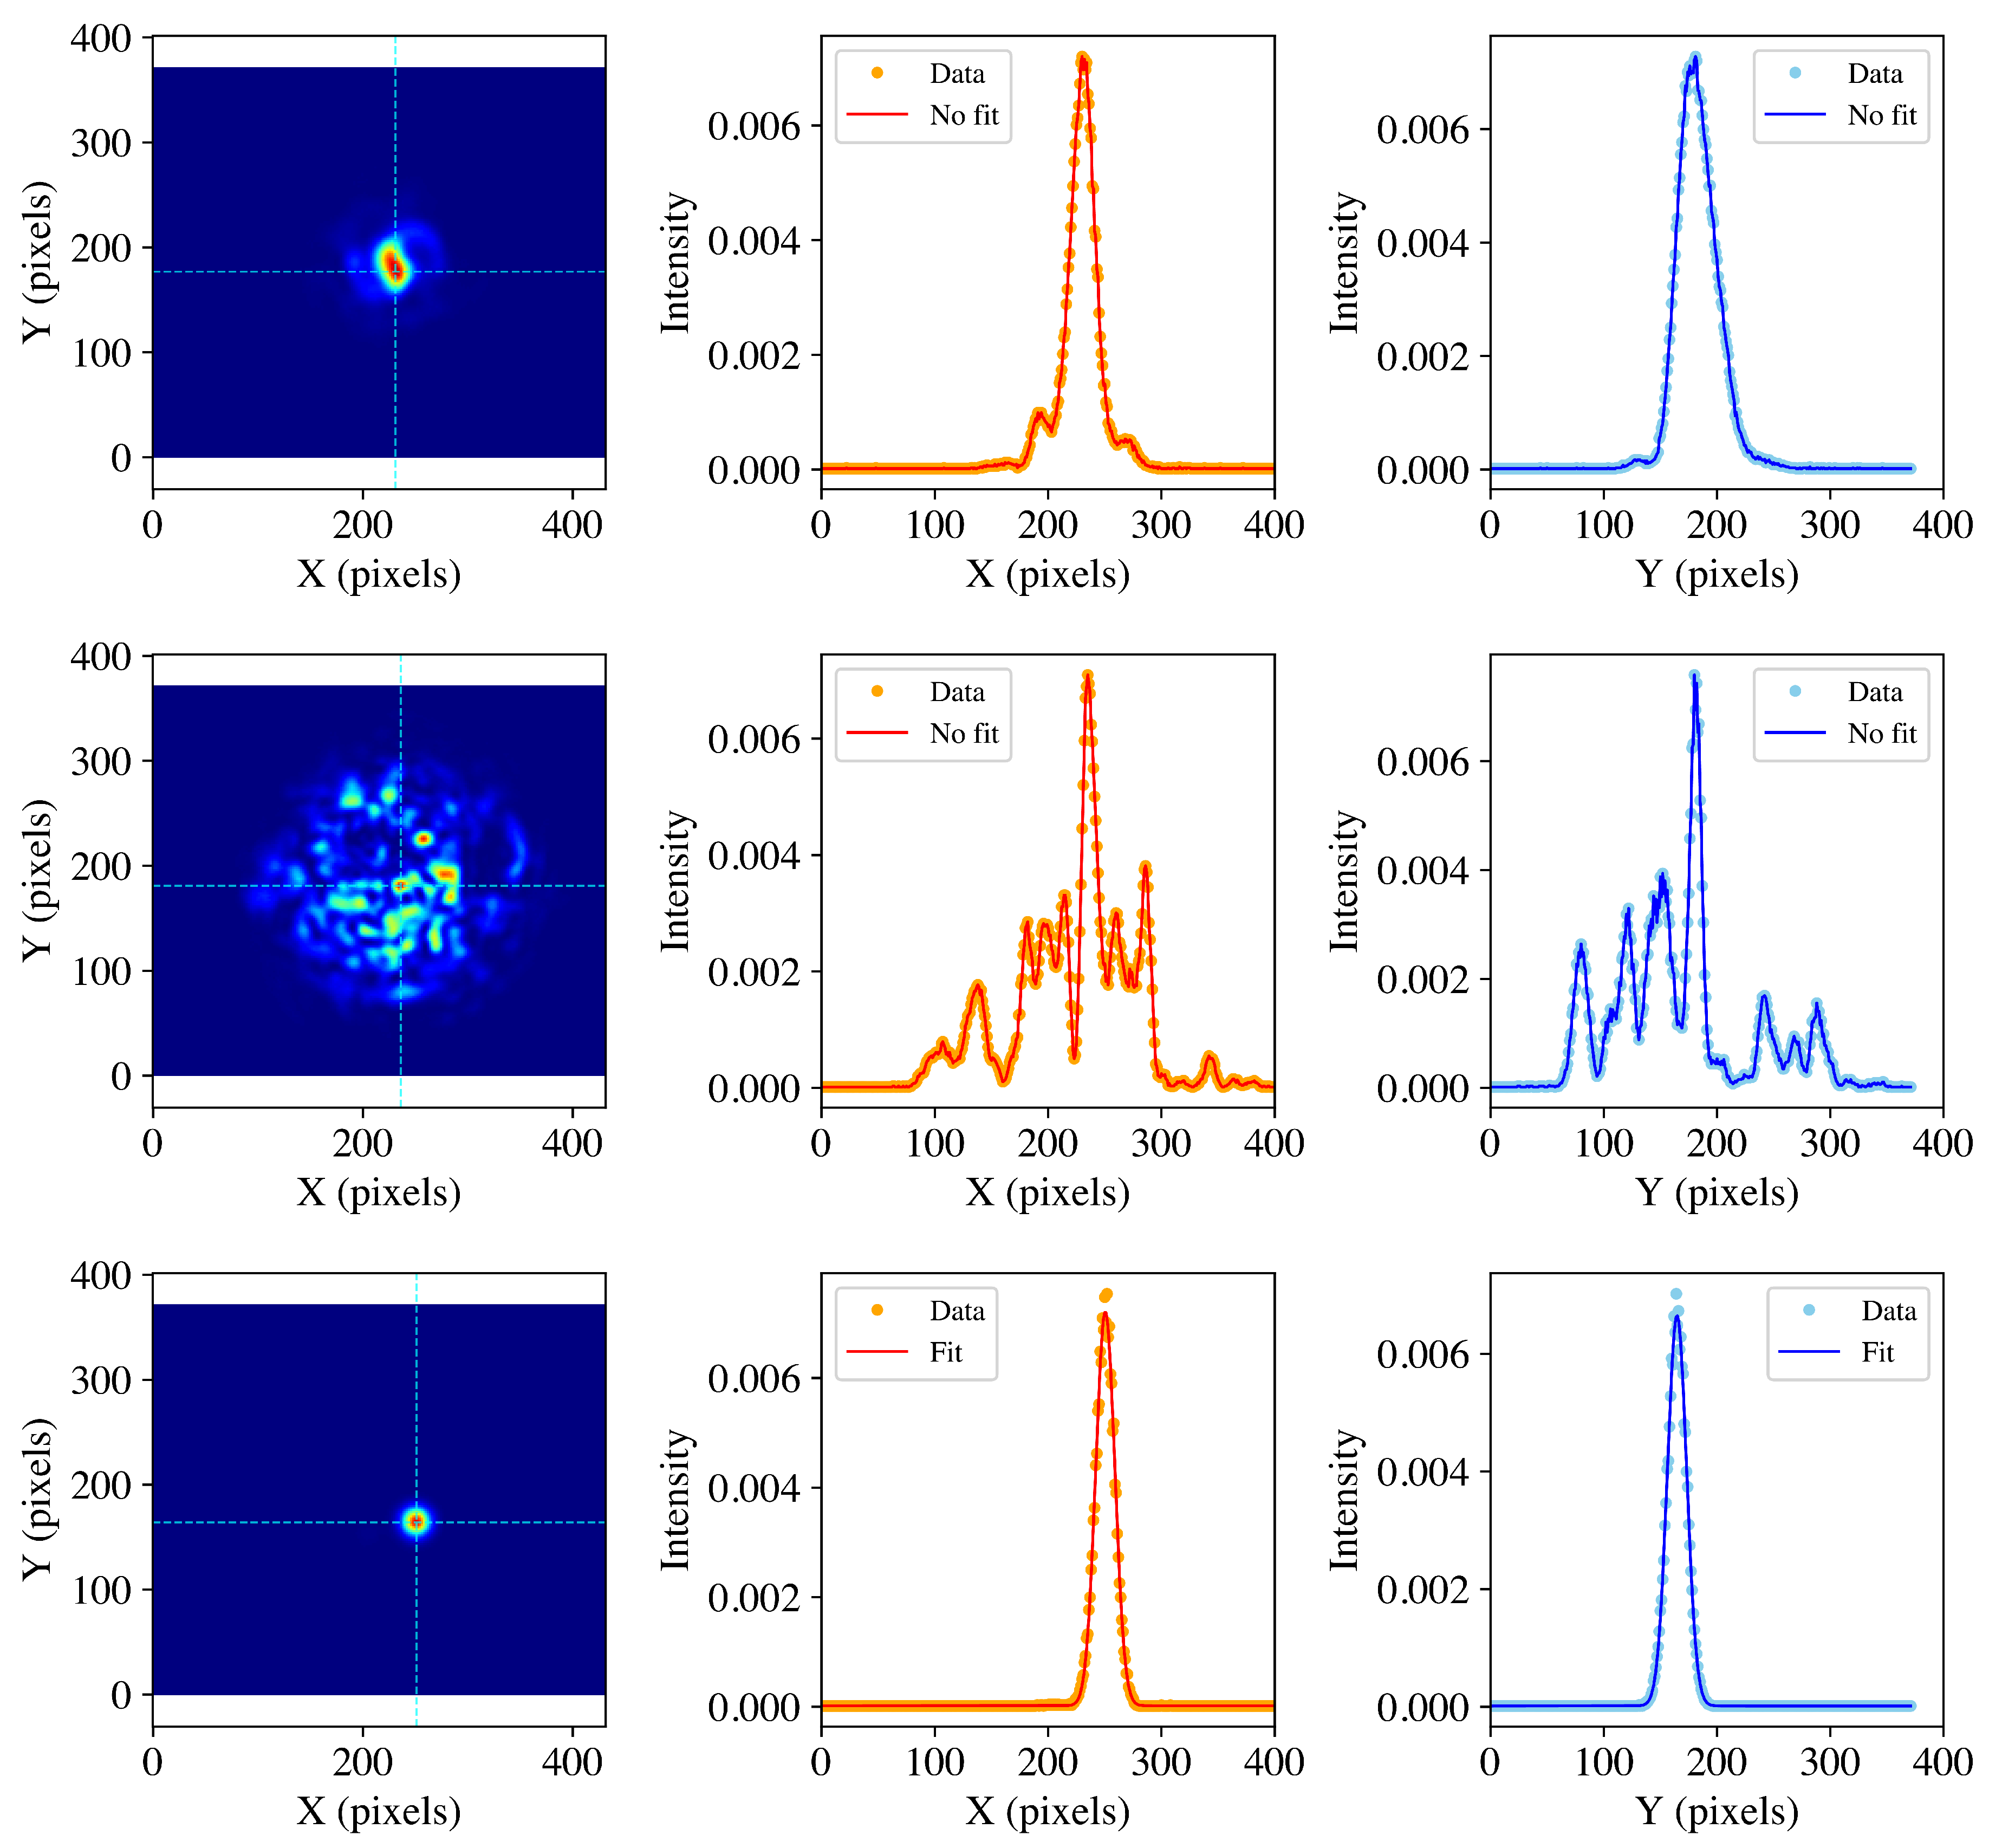
Multi-mode lasers can be categorized as multi-transverse mode, multi-longitudinal mode, or a combination of both [46]. To identify the modal behavior of our multi-mode lasers, we investigated their transverse characteristics using a CMOS camera. A plano-convex lens with a focal length of 75 mm was placed in front of the detector to exploit its Fourier transforming property in the spatial domain, thereby enabling a clear distinction of different transverse modes [47].
Figure 3 presents the beam profiles of MM1, MM2, and SM. The three columns, respectively, show the beam image captured by the CMOS camera, and the horizontal and vertical cross-sections of the beam intensity. SM exhibits a beam shape consistent with an ideal Gaussian distribution, whereas MM1 and MM2 show substantial deviation. MM1 appears to consist of a superposition of several low-order transverse electromagnetic (TEM) modes, although the exact modal composition is not clearly identified. In contrast, MM2 exhibits a dynamic speckle pattern. This is presumably caused by inter-modal interference, which arises from the direct coupling of the laser diode to a multi-mode fiber.
In summary, MM1 is interpreted as a multi-transverse-mode laser composed of mixed low-order TEM modes, while MM2 exhibits multi-transverse behavior as a result of modal mixing introduced by the attached multi-mode fiber.

3.1.3. Longitudinal Mode

For the longitudinal-mode analysis, we employed a commercial Fabry–Pérot cavity (SA200-8B, Thorlabs, Newton, NJ, USA) equipped with a piezoelectric transducer that enables dynamic tuning of the cavity length, thereby allowing measurement of the transmission spectrum. Figure 4 presents the transmission spectra of MM1, MM2, and SM. Grey curves indicate the ramp voltage applied to adjust the cavity length. Given the cavity’s free spectral range (FSR) of 1.5 GHz, scanning over approximately 3 GHz produces two consecutive transmission peaks. For the SM laser, these peaks remain stable across measurements taken over a period of approximately 20 s. In contrast, for MM1 and MM2, the peak positions fluctuate by several tens of MHz within similar time scales, indicating temporal instability.
Two distinct features are observed in the multi-mode lasers: (1) at each time point, a single dominant longitudinal mode appears, but its frequency shifts over time, indicating mode hopping due to dynamic fluctuations in the laser cavity or gain conditions; and (2) in MM2, additional smaller peaks are simultaneously observed in the transmission spectra, implying mode competition, where multiple longitudinal modes can oscillate concurrently.

3.2. Analysis of Raw Entropy Data

In this section, we analyze the raw entropy data, defined as the RF amplifier output in the BHD setup, as illustrated by the AMP block in Figure 1. First, we compare the CMRR measurements obtained using the MM and SM laser sources. Second, we present the digitized raw data processed by the ADC on the FPGA board. The digitized signal is examined in both the time and frequency domains to verify its noise characteristics and signal integrity. We subsequently estimate the min-entropy and quantum-to-classical noise ratio (QCNR) based on the histogram of the digitized signal.

3.2.1. CMRR Comparison Between MM and SM

To evaluate the CMRR performance for the MM and SM sources, we measured the noise spectra of the raw entropy data using an RF spectrum analyzer (E4440A, Agilent Technologies, Santa Clara, CA, USA) while introducing beat signals through the AOM. The AOM was driven with an 80 MHz sine wave to generate a weak first-order diffracted beam that partially overlapped with the zeroth-order beam. This overlap resulted in a beat signal at 80 MHz, which was used to assess the balance quality of the BHD system. Figure 5 shows the noise spectra under three different optical configurations for MM1, MM2, and SM.
First, the beams were blocked from reaching both PDs to measure the electronic noise of the BHD system. These measurements are shown as blue curves. If the PD dark current and the intrinsic amplifier noise are smaller, the resulting electronic noise level can be further reduced. Second, only one port in the BHD setup was opened, allowing the beat signal to enter a single PD. In this case, prominent peaks appeared at 80 MHz and 160 MHz due to residual interference between the two diffraction orders of the beam. These results are shown as red curves.
Finally, both PDs received optical input, and the beam power was finely controlled to balance the amplitudes of the beat signals at the two PDs. When the BHD balance was optimized, the peak at 80 MHz was significantly reduced for all laser sources. In the MM1 and MM2 cases, not only was the beat signal suppressed, but noise components at other intensities were also substantially diminished. These results are shown as green curves. Although the 160 MHz peak was not suppressed as effectively, it may be further reduced by employing precisely tunable variable optical attenuators (VOAs).
These results demonstrate that, even with multi-mode lasers, classical noise can be suppressed to a degree comparable to that achieved using single-mode lasers, enabling reliable extraction of the vacuum fluctuation signal.

3.2.2. Min-Entropy and QCNR Estimation

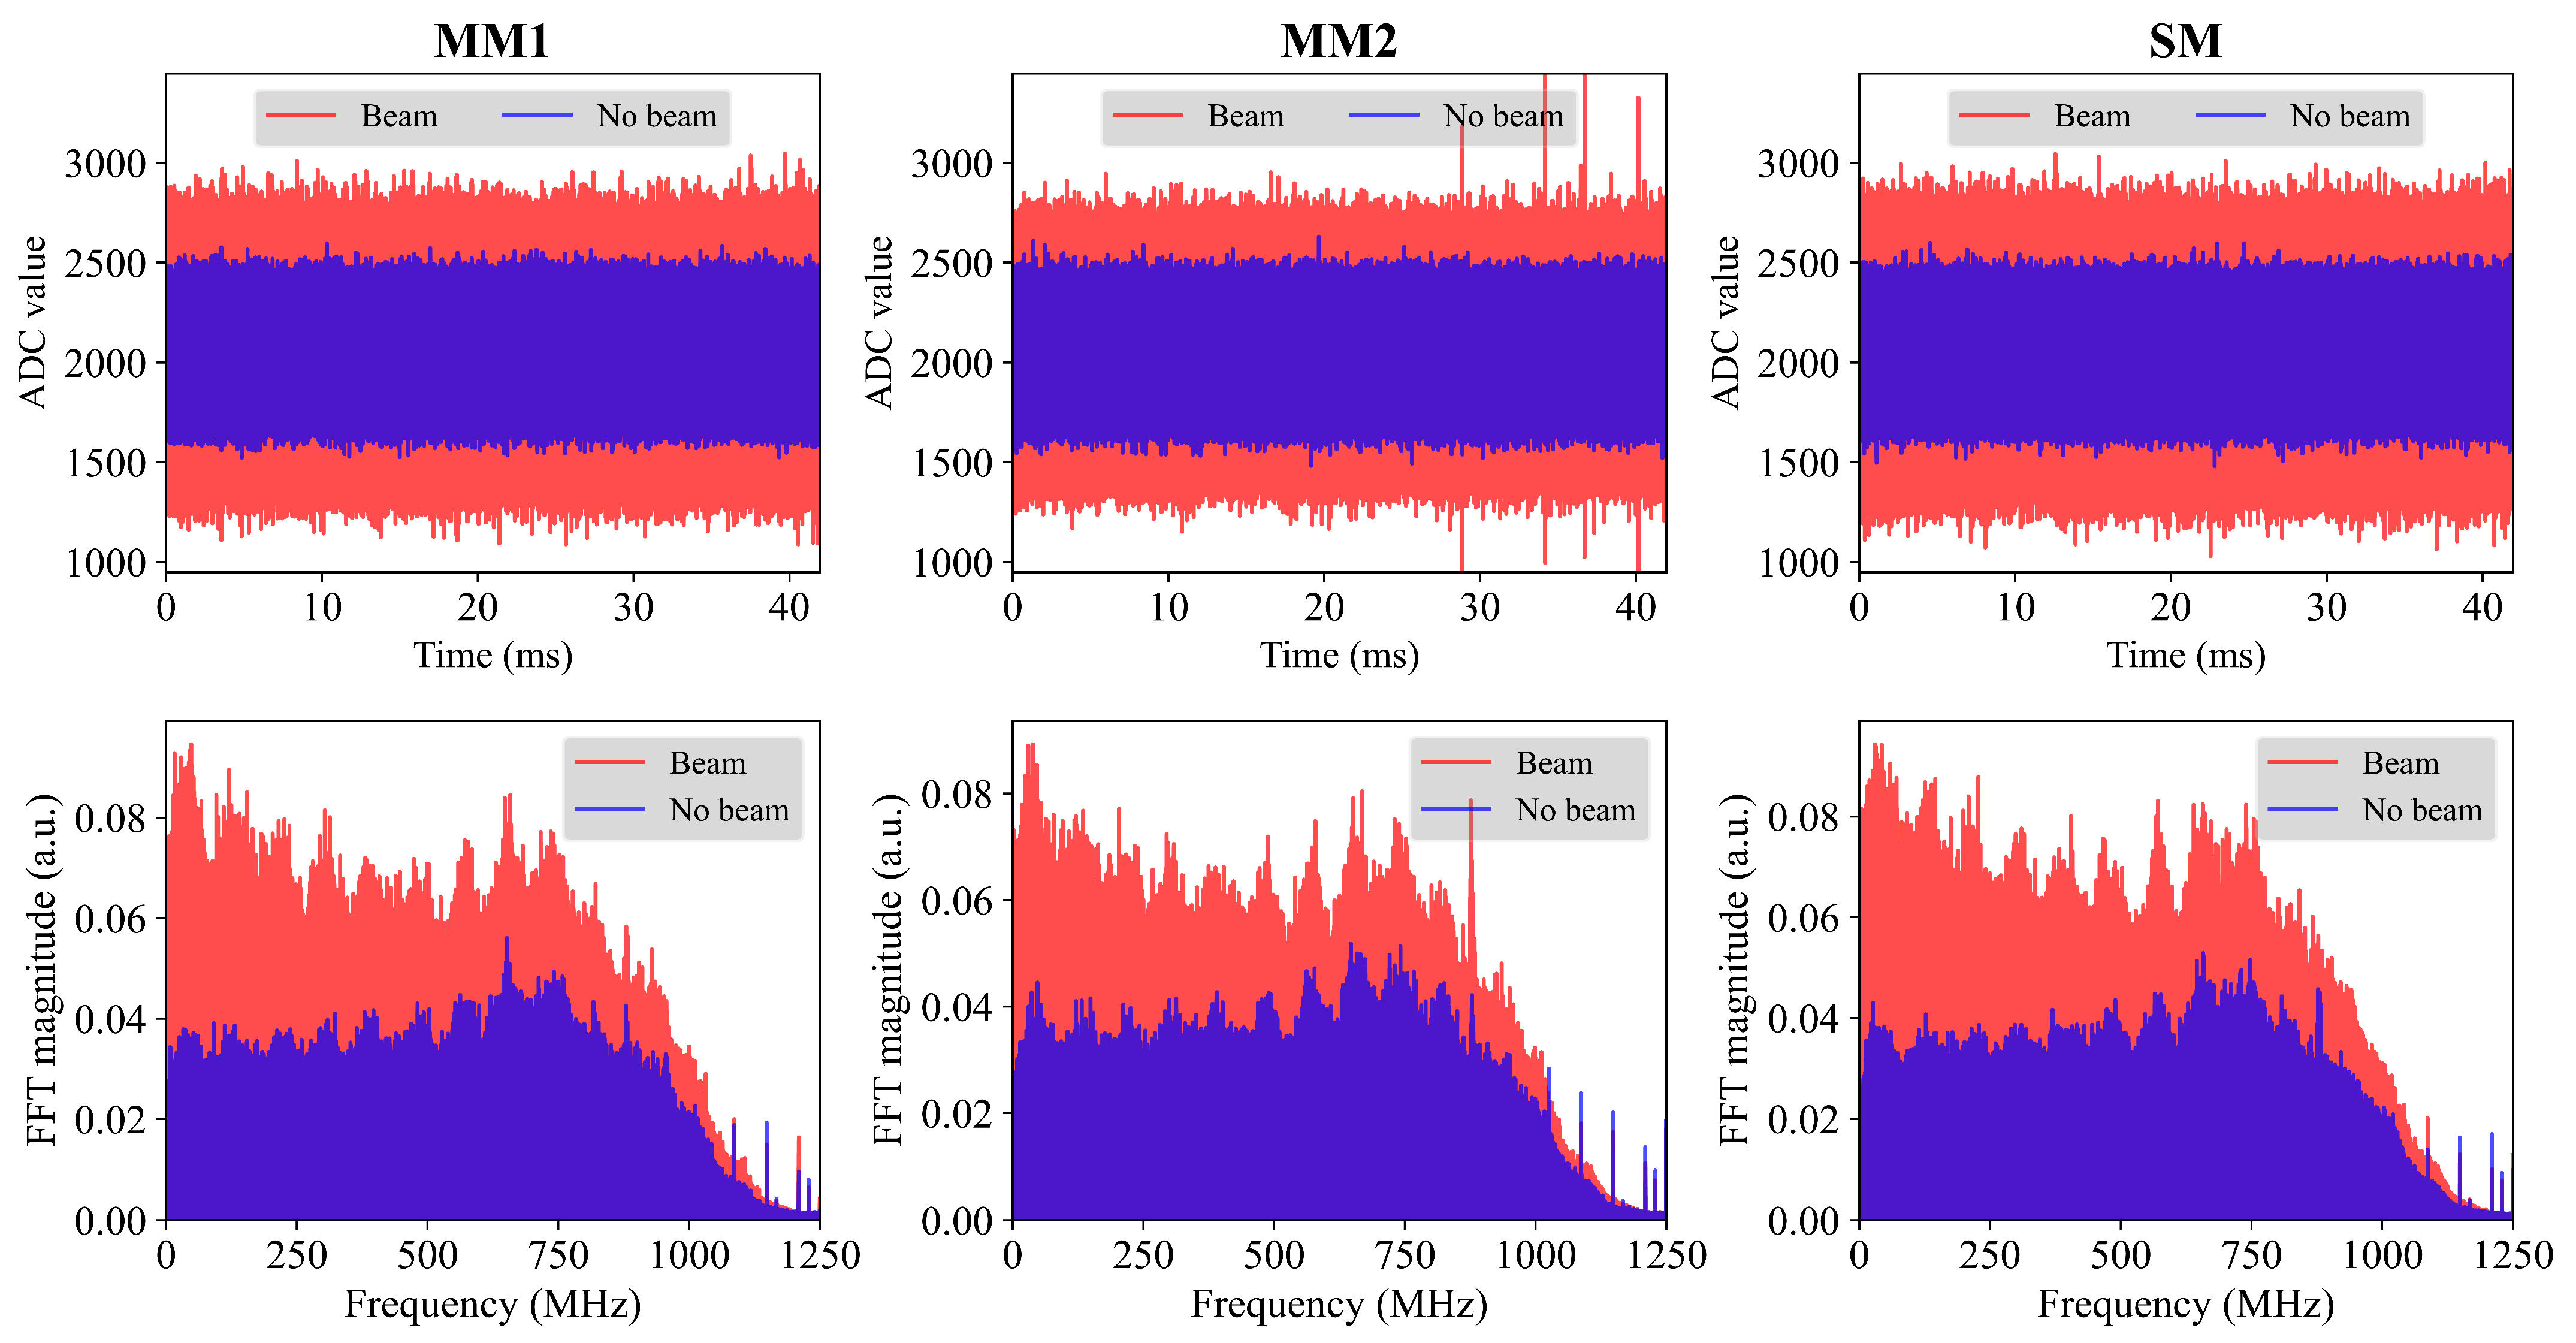
Figure 6 presents time- and frequency-domain representations of the ADC outputs for MM1, MM2, and SM under both beam-on and beam-off conditions. Raw signals were acquired using a 12-bit ADC with a sampling rate of 2.5 GSa/s over a continuous duration of approximately 42 ms, yielding 104,857,600 samples per condition. The time-domain plots in the top row show stable signal traces for all three sources. While the MM2 trace contains a few artifacts, no persistent anomalies or signal dropouts were observed in any of the measurements, confirming the reliable performance of both the optical setup and the FPGA-based acquisition system. The bottom row displays the corresponding FFT spectra up to the Nyquist frequency of 1.25 GHz. The difference between the beam-off and beam-on spectra remains nearly uniform throughout the full frequency range, suggesting that this spectral increase reflects the vacuum fluctuation and was digitized without distortion. Through these measurements, we confirmed that vacuum noise captured using MM1 and MM2 sources was also comparable in quality to that obtained with SM.
Figure 7 shows histograms of the ADC outputs plotted in the top row of Figure 6. For each laser source, histograms were drawn under beam-on (measured noise) and beam-off (electronic noise) conditions, representing their respective probability density functions (PDFs). Both distributions were well fitted by Gaussian functions. As the PDF of the measured noise is the convolution of the electronic noise and vacuum fluctuation PDFs, the Gaussian nature of the vacuum fluctuation distribution is thus affirmed, in line with the theories of quantum mechanics [48]. Let the measured noise and electronic noise be represented by the random variables M and E, respectively, with m and e being their realizations. The conditional PDF of M given E is expressed as
p M | E ( m | e ) = 1 2 π ( σ M 2 σ E 2 ) exp ( m e ) 2 2 ( σ M 2 σ E 2 ) .
Here, σ M and σ E denote the standard deviations of the measured noise and electronic noise distributions, respectively. The quantity σ M 2 σ E 2 is denoted as σ Q 2 , representing the variance of the vacuum noise.
Based on the conditional PDF given in Equation (1), the conditional min-entropy H min ( M | E ) is evaluated using the approach described in [37,48] as
H min ( M | E ) = log 2 max ( c 1 , c 2 ) ,
where c 1 = 1 2 erf e max R + 3 δ / 2 2 σ Q + 1 and c 2 = erf δ 2 2 σ Q . In this expression, erf denotes the error function, e max is the upper limit of classical noise, R represents half the maximum input voltage, and δ is the width of a quantization bin. Assuming a confidence level of 99.9999%, e max is conservatively set to 5 σ E . Given the parameter regime in this work, it is observed that c 2 consistently exceeds c 1 , which results in the following expression for the conditional min-entropy:
H min ( M | E ) = log 2 erf δ 2 2 σ Q .
Table 1 presents the conditional min-entropy values for MM1, MM2, and SM. The variation among these values originates from differences in the optical power incident on the BHD setup. Using σ Q , the QCNR was also calculated according to the equation provided in [48] as QCNR = 10 log 10 ( σ Q 2 / σ E 2 ) . The QCNR values for each laser source are also summarized in Table 1.
The QCNR can be further improved by implementing two enhancements. First, in this experiment, the maximum optical power incident on a single PD was limited to approximately 4–5 mW, even though the output power immediately after the lasers exceeded 25 mW. This reduction is primarily attributed to optical losses at the free-space optical isolator, which arise from the small aperture size and polarization filtering, particularly in the case of multi-mode lasers. If back-reflections at the fiber-coupled PDs in the BHD setup can be sufficiently suppressed, the use of an optical isolator could be eliminated, allowing more optical power to reach the detectors.
Second, the QCNR can be improved by employing PDs with lower noise-equivalent power (NEP). In our setup, PD selection was constrained by the need for compatibility with multi-mode beams, which limited the available options when purchasing a commercial BHD system. The NEP of the PDs used in our experiment is approximately 20 pW / Hz . In contrast, Zhang et al. [35] reported the use of PDs with an NEP as low as 2 fW / Hz , achieving a QCNR of approximately 13 dB at an optical power of 5 mW.

3.3. Full-Entropy Data Extraction Using SHA3-384

To derive full-entropy data from the raw data, we first applied a bit selection process. For each of the twelve bit positions in the 12-bit ADC output, the bit-wise Shannon entropy was calculated across all samples. Based on the computed entropy values, the eight bit positions exhibiting the highest entropy were selected. Throughout this work, bit position 0 denotes the least significant bit (LSB) and bit 11 denotes the most significant bit (MSB); the selected positions corresponded to bits 0 through 7. Because the standard deviation of the ADC output was relatively small, the sample values were concentrated near the center of the ADC dynamic range. As a result, the higher-order bits (positions 8 to 11) exhibited limited variation, whereas the lower-order bits exhibited slightly higher entropy. These lower bits were therefore chosen.
The selected 8-bit samples were input to the SHA3-384 hash function, which is classified as a vetted conditioning component in [44]. According to the definition in NIST SP 800-90C [49], the hashed output can be regarded as full-entropy data if the min-entropy per bit exceeds 1 ε , where ε = 2 32 .
To satisfy this criterion, it is essential that the input to the hash function itself possess sufficient entropy. In our experiment, the min-entropy of the input—the selected 8-bit samples—was evaluated to be greater than 7.4 bits for all laser sources. This evaluation was performed using the non-i.i.d. entropy assessment procedure described in [44]. The estimated min-entropy values for MM1, MM2, and SM are summarized in Table 2.
The entropy per bit of the hash outputs was subsequently calculated using the formulation provided in Section 3.1.5.1.2 of [44]. The corresponding ε values for MM1, MM2, and SM are also listed in Table 2. As all ε values were below 2 32 , the hashed outputs fulfill the condition for being considered full-entropy data. Figure 8 shows the histograms of the full-entropy data for MM1, MM2, and SM, which were divided into 8-bit blocks for the subsequent NIST tests.

3.4. NIST Validation of Full-Entropy Data

To validate the quality of the full-entropy data as random bitstreams, we conducted a two-step procedure based on the NIST-recommended frameworks. First, we applied the i.i.d. test to determine whether the data exhibited i.i.d. characteristics. Since the full-entropy data from all three laser sources passed this test, the min-entropy was estimated using the most common values method, as specified in [44]. Second, we performed the statistical test suite defined in [45] to assess the randomness of the full-entropy data. The full-entropy data from all three laser sources successfully passed every test in the suite.

3.4.1. Entropy and IID Assessment (SP 800-90B)

Table 3 shows the entropy and i.i.d. test results of the full-entropy data for MM1, MM2, and SM. Initially, entropy was evaluated using two methods. In the first method, min-entropy per sample, denoted as H original , was calculated using 8-bit re-grouped full-entropy data. In the second method, the first 1,000,000 bits were selected from the consecutive 8-bit samples, and H bitstring was computed based on the most common bit in those bits. Finally, min-entropy was determined as the minimum between H original and 8 H bitstring , which was H original in our work.
Accordingly, H original per bit was calculated to be 0.998297 for MM1, 0.998330 for MM2, and 0.998360 for SM, respectively. These values were lower than the theoretical bound 1 ε , where ε is defined in Table 2. This is primarily because the number of 8-bit samples for the entropy estimation was finite—specifically, 78,643,152 samples. As the number of samples increases, the estimated min-entropy per bit is expected to approach 1 ε .
After the entropy estimation, three types of tests were performed to verify the i.i.d. assumption. First, the chi-square test validated the independence and the goodness-of-fit. Second, the longest repeated substring (LRS) test examined the presence of repeated patterns. Lastly, the permutation test suite, comprising 11 different statistical tests, compared the test statistics computed from the original and permuted datasets. If the samples are i.i.d., the statistics from both datasets should be similar. Since all three types of tests were successfully passed, the full-entropy data from MM1, MM2, and SM can be regarded as i.i.d.

3.4.2. Statistical Test Suite (SP 800-22)

We performed the Statistical Test Suite (STS) to evaluate the randomness of our full-entropy data, as recommended in [45]. Table 4 presents the STS results for the full-entropy data obtained from the MM1, MM2, and SM sources. The 8-bit samples were divided into 629 sequences, each consisting of 1,000,000 bits. The tests were applied to each sequence individually.
The significance level ( α ) was set to the default value of 0.01. A sequence was considered to pass a test if its p-value was greater than or equal to α . The proportion indicates the fraction of sequences that passed each test. Given that the total number of sequences was 629, the minimum acceptable proportion was 0.978. All full-entropy datasets from the three laser sources satisfied this requirement.
The p-value in the table refers to the uniformity of the p-values obtained across all sequences for each test. It was calculated using a chi-square goodness-of-fit test. In our STS results, all tests conducted with each laser source yielded a p-value above 0.0001.
Since both the proportion and the p-value met the required criteria, the randomness of our full-entropy data was statistically validated.

4. Discussion

In this work, we proposed the use of an MM laser as the LO in a vacuum-fluctuation-based QRNG. MM lasers offer several advantages over SM lasers: they do not require single-mode operation, simplifying the system configuration; they eliminate the need for temperature stabilization, reducing the complexity of the LO driving circuit; and in our experiments, the selected MM lasers exhibited higher optical power than the reference SM laser under the same injection current, implying lower electrical power consumption for comparable performance.
Although the beam profiles of MM lasers were not ideal TEM 00 and experienced frequent mode hopping, they successfully interfered with the vacuum state, as did the SM laser. With a well-balanced BHD setup, classical noise was suppressed by more than 35 dB for all sources, allowing us to extract raw data dominated by vacuum fluctuations. While the QCNR was modest, it could be improved by increasing the optical power delivered to the BHD setup and by employing PDs with lower NEP.
The raw data were digitized using a 12-bit 2.5 GSa/s ADC and transferred to the FPGA. We selected the 8-bit indices with the highest entropy among the 12-bit outputs. These 8-bit samples were grouped into 768-bit blocks and served as inputs to the SHA3-384 hash function. Since the input data from all sources contained high entropy, the hash outputs were regarded as full-entropy data.
To validate the quality of these full-entropy outputs, two types of NIST validation were conducted. First, min-entropy estimation and the i.i.d. test showed min-entropy values above 7.986 and confirmed the i.i.d. characteristic for all sources. Second, the STS verified that the full-entropy data passed all tests in terms of both the proportion of successful sequences and the uniformity of p-value distributions.
Our QRNG is a fully trusted (FT) QRNG, where the entire system from the source to the detector is assumed to be trusted. It offers the advantages of simplicity and high speed compared to device-independent (DI) or semi-device-independent (semi-DI) QRNGs. However, the quality of the generated random numbers is guaranteed only under the assumption that no adversarial manipulation occurs. In future work, we plan to extend our vacuum-fluctuation-based QRNG, employing multi-mode lasers toward a semi-DI framework.
To the best of our knowledge, this study was the first case of exploiting an MM laser in a vacuum-fluctuation-based QRNG. Having passed both NIST validations, the full-entropy data are confirmed to possess sufficient quality to be used as quantum random numbers for cryptographic applications such as QKD. The random number generation rate was estimated as 2.5 GSa/s × 8 bits × 0.5 = 10 Gbps, where the factor 0.5 accounts for the 2× compression applied by the hash function. With further development, a compact MM-laser-based vacuum-fluctuation QRNG could potentially be commercialized.

Author Contributions

Conceptualization, S.P.; methodology, S.P.; software, S.K.; validation, S.P. and S.K.; formal analysis, S.P.; investigation, S.P.; resources, C.P.; data curation, S.P. and S.K.; writing—original draft preparation, S.P.; writing—review and editing, S.P.; visualization, S.P.; supervision, C.P. and J.W.C.; project administration, C.P. and J.W.C. All authors have read and agreed to the published version of the manuscript.

Funding

This research was supported by the Future Challenge Defense Technology Research and Development Project through the Agency for Defense Development (ADD), funded by the Defense Acquisition Program Administration (DAPA) in 2025, Korea (Grant No. 915068201). The APC was funded by the same grant.

Institutional Review Board Statement

Not applicable.

Informed Consent Statement

Not applicable.

Data Availability Statement

All essential findings and results are presented within the article. However, the underlying raw data are not publicly available due to security restrictions associated with national defense research. Further inquiries can be directed to the corresponding author and may be subject to approval.

Conflicts of Interest

All authors were employed by SK Telecom. The funders had no role in the design of the study; in the collection, analyses, or interpretation of data; in the writing of the manuscript; or in the decision to publish the results.

References

  1. Bauke, H.; Mertens, S. Random numbers for large-scale distributed Monte Carlo simulations. Phys. Rev. E 2007, 75, 066701. [Google Scholar] [CrossRef]
  2. Ogorodnikov, V.A.; Prigarin, S.M. Numerical Modelling of Random Processes and Fields: Algorithms and Applications; De Gruyter: Berlin, Germany, 1996. [Google Scholar] [CrossRef]
  3. Banks, S.; Beadling, P.; Ferencz, A. FPGA Implementation of Pseudo Random Number Generators for Monte Carlo Methods in Quantitative Finance. In Proceedings of the 2008 International Conference on Reconfigurable Computing and FPGAs, Cancun, Mexico, 3–5 December 2008; pp. 271–276. [Google Scholar] [CrossRef]
  4. Petrie, C.S.; Connelly, J.A. A noise-based IC random number generator for applications in cryptography. IEEE Trans. Circuits Syst. I Fundam. Theory Appl. 2000, 47, 615–621. [Google Scholar] [CrossRef]
  5. Stipčević, M. Quantum random number generators and their applications in cryptography. In Proceedings of the SPIE 8375, Advanced Photon Counting Techniques VI, Baltimore, MD, USA, 5–6 April 2012; Volume 837504. [Google Scholar] [CrossRef]
  6. L’Ecuyer, P. Random numbers for simulation. Commun. ACM 1990, 33, 85–97. [Google Scholar] [CrossRef]
  7. L’Ecuyer, P. Random Number Generation. In Handbook of Computational Statistics; Gentle, J.E., Härdle, W.K., Mori, Y., Eds.; Springer: Berlin/Heidelberg, Germany, 2012; pp. 35–71. [Google Scholar] [CrossRef]
  8. Schmidt, H. Quantum-Mechanical Random-Number Generator. J. Appl. Phys. 1970, 41, 462–468. [Google Scholar] [CrossRef]
  9. Alkassar, A.; Nicolay, T.; Rohe, M. Obtaining True-Random Binary Numbers from a Weak Radioactive Source. In Computational Science and Its Applications—ICCSA 2005; Gervasi, O., Gavrilova, M.L., Kumar, V., Laganà, A., Lee, H.P., Mun, Y., Taniar, D., Tan, C.J.K., Eds.; Lecture Notes in Computer Science; Springer: Berlin/Heidelberg, Germany, 2005; Volume 3481. [Google Scholar] [CrossRef]
  10. Gude, M. Concept for a High Performance Random Number Generator Based on Physical Random Phenomena. Frequenz 1985, 39, 187–190. [Google Scholar] [CrossRef]
  11. Mannalatha, V.; Mishra, S.; Pathak, A. A Comprehensive Review of Quantum Random Number Generators: Concepts, Classification and the Origin of Randomness. Quantum Inf. Process. 2023, 22, 439. [Google Scholar] [CrossRef]
  12. Herrero-Collantes, M.; Garcia-Escartin, J.C. Quantum random number generators. Rev. Mod. Phys. 2017, 89, 015004. [Google Scholar] [CrossRef]
  13. Fiorentino, M.; Santori, C.; Spillane, S.M.; Beausoleil, R.G.; Munro, W.J. Secure self-calibrating quantum random-bit generator. Phys. Rev. A 2007, 75, 032334. [Google Scholar] [CrossRef]
  14. Jennewein, T.; Achleitner, U.; Weihs, G.; Weinfurter, H.; Zeilinger, A. A fast and compact quantum random number generator. Rev. Sci. Instrum. 2000, 71, 1675–1680. [Google Scholar] [CrossRef]
  15. Ren, M.; Wu, E.; Liang, Y.; Jian, Y.; Wu, G.; Zeng, H. Quantum random-number generator based on a photon-number-resolving detector. Phys. Rev. A 2011, 83, 023820. [Google Scholar] [CrossRef]
  16. Sanguinetti, B.; Martin, A.; Zbinden, H.; Gisin, N. Quantum random number generation on a mobile phone. Phys. Rev. X 2014, 4, 031056. [Google Scholar] [CrossRef]
  17. Wayne, M.A.; Jeffrey, E.R.; Akselrod, G.M.; Kwiat, P.G. Photon arrival time quantum random number generation. J. Mod. Opt. 2009, 56, 516–522. [Google Scholar] [CrossRef]
  18. Wahl, M.; Leifgen, M.; Berlin, M.; Röhlicke, T.; Rahn, H.-J.; Benson, O. An ultrafast quantum random number generator with provably bounded output bias based on photon arrival time measurements. Appl. Phys. Lett. 2011, 98, 171105. [Google Scholar] [CrossRef]
  19. Qi, B.; Chi, Y.-M.; Lo, H.-K.; Qian, L. High-speed quantum random number generation by measuring phase noise of a single-mode laser. Opt. Lett. 2010, 35, 312–314. [Google Scholar] [CrossRef]
  20. Nie, Y.-Q.; Huang, L.; Liu, Y.; Payne, F.; Zhang, J.; Pan, J.-W. The generation of 68 Gbps quantum random number by measuring laser phase fluctuations. Rev. Sci. Instrum. 2015, 86, 063105. [Google Scholar] [CrossRef]
  21. Huang, M.; Chen, Z.; Zhang, Y.; Guo, H. A Phase Fluctuation Based Practical Quantum Random Number Generator Scheme with Delay-Free Structure. Appl. Sci. 2020, 10, 2431. [Google Scholar] [CrossRef]
  22. Lovic, V.; Marangon, D.G.; Lucamarini, M.; Yuan, Z.; Shields, A.J. Characterizing Phase Noise in a Gain-Switched Laser Diode for Quantum Random-Number Generation. Phys. Rev. Appl. 2021, 16, 054012. [Google Scholar] [CrossRef]
  23. Hu, Y.-Y.; Ding, Y.-Y.; Wang, S.; Yin, Z.-Q.; Chen, W.; He, D.-Y.; Huang, W.; Xu, B.-J.; Guo, G.-C.; Han, Z.-F. Compact Quantum Random Number Generation Using a Linear Optocoupler. Opt. Lett. 2021, 46, 3175–3178. [Google Scholar] [CrossRef]
  24. Moeini, M.; Akbari, M.; Mirsadeghi, M.; Naeij, H.R.; Haghkish, N.; Hayeri, A.; Malekian, M. Quantum Random Number Generator Based on LED. J. Appl. Phys. 2024, 135, 084402. [Google Scholar] [CrossRef]
  25. Williams, C.R.S.; Salevan, J.C.; Li, X.; Roy, R.; Murphy, T.E. Fast Physical Random Number Generator Using Amplified Spontaneous Emission. Opt. Express 2010, 18, 23584–23597. [Google Scholar] [CrossRef]
  26. Argyris, A.; Pikasis, E.; Deligiannidis, S.; Syvridis, D. Sub-Tb/s Physical Random Bit Generators Based on Direct Detection of Amplified Spontaneous Emission Signals. J. Light. Technol. 2012, 30, 1329–1334. [Google Scholar] [CrossRef]
  27. Martin, A.; Sanguinetti, B.; Lim, C.C.W.; Houlmann, R.; Zbinden, H. Quantum Random Number Generation for 1.25-GHz Quantum Key Distribution Systems. J. Light. Technol. 2015, 33, 2855–2859. [Google Scholar] [CrossRef]
  28. Wei, S.; Yang, J.; Fan, F.; Huang, W.; Li, D.; Xu, B. Compact Quantum Random Number Generator Based on Superluminescent Light-Emitting Diodes. Rev. Sci. Instrum. 2017, 88, 123115. [Google Scholar] [CrossRef] [PubMed]
  29. Bustard, P.J.; Moffatt, D.; Lausten, R.; Wu, G.; Walmsley, I.A.; Sussman, B.J. Quantum Random Bit Generation Using Stimulated Raman Scattering. Opt. Express 2011, 19, 25173–25180. [Google Scholar] [CrossRef]
  30. England, D.G.; Bustard, P.J.; Moffatt, D.J.; Nunn, J.; Lausten, R.; Sussman, B.J. Efficient Raman Generation in a Waveguide: A Route to Ultrafast Quantum Random Number Generation. Appl. Phys. Lett. 2014, 104, 051117. [Google Scholar] [CrossRef]
  31. Collins, M.J.; Clark, A.S.; Xiong, C.; Mägi, E.; Steel, M.J.; Eggleton, B.J. Random Number Generation from Spontaneous Raman Scattering. Appl. Phys. Lett. 2015, 107, 141112. [Google Scholar] [CrossRef]
  32. Gabriel, C.; Wittmann, C.; Sych, D.; Dong, R.; Mauerer, W.; Andersen, U.L.; Marquardt, C.; Leuchs, G. A Generator for Unique Quantum Random Numbers Based on Vacuum States. Nat. Photonics 2010, 4, 711–715. [Google Scholar] [CrossRef]
  33. Shen, Y.; Tian, L.; Zou, H. Practical Quantum Random Number Generator Based on Measuring the Shot Noise of Vacuum States. Phys. Rev. A 2010, 81, 063814. [Google Scholar] [CrossRef]
  34. Symul, T.; Assad, S.M.; Lam, P.K. Real-Time Demonstration of High Bitrate Quantum Random Number Generation with Coherent Laser Light. Appl. Phys. Lett. 2011, 98, 231103. [Google Scholar] [CrossRef]
  35. Zhang, X.; Zhang, Y.; Li, Z.; Yu, S.; Guo, H. 1.2-GHz Balanced Homodyne Detector for Continuous-Variable Quantum Information Technology. IEEE Photonics J. 2018, 10, 6803810. [Google Scholar] [CrossRef]
  36. Huang, L.; Zhou, H. Integrated Gbps Quantum Random Number Generator with Real-Time Extraction Based on Homodyne Detection. J. Opt. Soc. Am. B 2019, 36, B130–B136. [Google Scholar] [CrossRef]
  37. Zheng, Z.; Zhang, Y.; Huang, W.; Yu, S.; Guo, H. 6 Gbps Real-Time Optical Quantum Random Number Generator Based on Vacuum Fluctuation. Rev. Sci. Instrum. 2019, 90, 043105. [Google Scholar] [CrossRef] [PubMed]
  38. Gehring, T.; Lupo, C.; Kordts, A.; Pacher, C.; Fürst, M.; Ricken, R.; Quiring, V.; Lenhard, A.; Mauerer, W.; Weinfurter, H.; et al. Homodyne-Based Quantum Random Number Generator at 2.9 Gbps Secure Against Quantum Side-Information. Nat. Commun. 2021, 12, 605. [Google Scholar] [CrossRef]
  39. Bai, B.; Huang, J.; Qiao, G.-R.; Nie, Y.-Q.; Tang, W.; Chu, T.; Zhang, J.; Pan, J.-W. 18.8 Gbps Real-Time Quantum Random Number Generator with a Photonic Integrated Chip. Appl. Phys. Lett. 2021, 118, 264001. [Google Scholar] [CrossRef]
  40. Ferreira, M.J.; Silva, N.A.; Pinto, A.N.; Muga, N.J. Characterization of a Quantum Random Number Generator Based on Vacuum Fluctuations. Appl. Sci. 2021, 11, 7413. [Google Scholar] [CrossRef]
  41. Bruynsteen, C.; Gehring, T.; Lupo, C.; Bauwelinck, J.; Yin, X. 100-Gbit/s Integrated Quantum Random Number Generator Based on Vacuum Fluctuations. PRX Quantum 2023, 4, 010330. [Google Scholar] [CrossRef]
  42. Wang, X.; Zheng, T.; Jia, Y.; Huang, J.; Zhu, X.; Shi, Y.; Wang, N.; Lu, Z.; Zou, J.; Li, Y. Compact Quantum Random Number Generator Based on a Laser Diode and a Hybrid Chip with Integrated Silicon Photonics. Photonics 2024, 11, 468. [Google Scholar] [CrossRef]
  43. National Institute of Standards and Technology. SHA-3 Standard: Permutation-Based Hash and Extendable-Output Functions; FIPS PUB 202; National Institute of Standards and Technology: Gaithersburg, MD, USA, 2015. [CrossRef]
  44. Turan, M.S.; Barker, E.; Kelsey, J.; McKay, K.A.; Baish, M.L.; Boyle, M. Recommendation for the Entropy Sources Used for Random Bit Generation; NIST Special Publication 800-90B; National Institute of Standards and Technology: Gaithersburg, MD, USA, 2018. [CrossRef]
  45. Rukhin, A.; Soto, J.; Nechvatal, J.; Smid, M.; Barker, E.; Leigh, S.; Levenson, M.; Vangel, M.; Banks, D.; Heckert, A.; et al. A Statistical Test Suite for Random and Pseudorandom Number Generators for Cryptographic Applications; NIST Special Publication 800-22 Rev.1a; National Institute of Standards and Technology: Gaithersburg, MD, USA, 2010. [CrossRef]
  46. Hecht, E. The Laser. In Optics, 5th ed.; Pearson Education: Upper Saddle River, NJ, USA, 2017; Chapter 13.1.3; Available online: https://scholar.google.com/scholar_lookup?title=Optics+Fifth&author=Hecht,+E.&publication_year=2017 (accessed on 19 August 2025).
  47. Day, G.; Stubenrauch, D.F. Laser Far-Field Beam-Profile Measurements by the Focal Plane Technique; National Institute of Standards and Technology (NIST): Gaithersburg, MD, USA, 1978. Available online: https://scholar.google.com/scholar_lookup?title=Laser+Far-field+Beamprofile+Measurements+by+the+Focal+Plane+Technique&author=Day,+G.&author=Stubenrauch,+D.F.&publication_year=1978 (accessed on 19 August 2025).
  48. Haw, J.Y.; Assad, S.M.; Lance, A.M.; Ng, N.H.Y.; Sharma, V.; Lam, P.K.; Symul, T. Maximization of Extractable Randomness in a Quantum Random-Number Generator. Phys. Rev. Appl. 2015, 3, 054004. [Google Scholar] [CrossRef]
  49. Barker, E.; Kelsey, J.; McKay, K.; Roginsky, A.; Sönmez Turan, M. Recommendation for Random Bit Generator (RBG) Constructions; NIST Special Publication 800-90C (4th Public Draft); National Institute of Standards and Technology: Gaithersburg, MD, USA, 2024. [CrossRef]
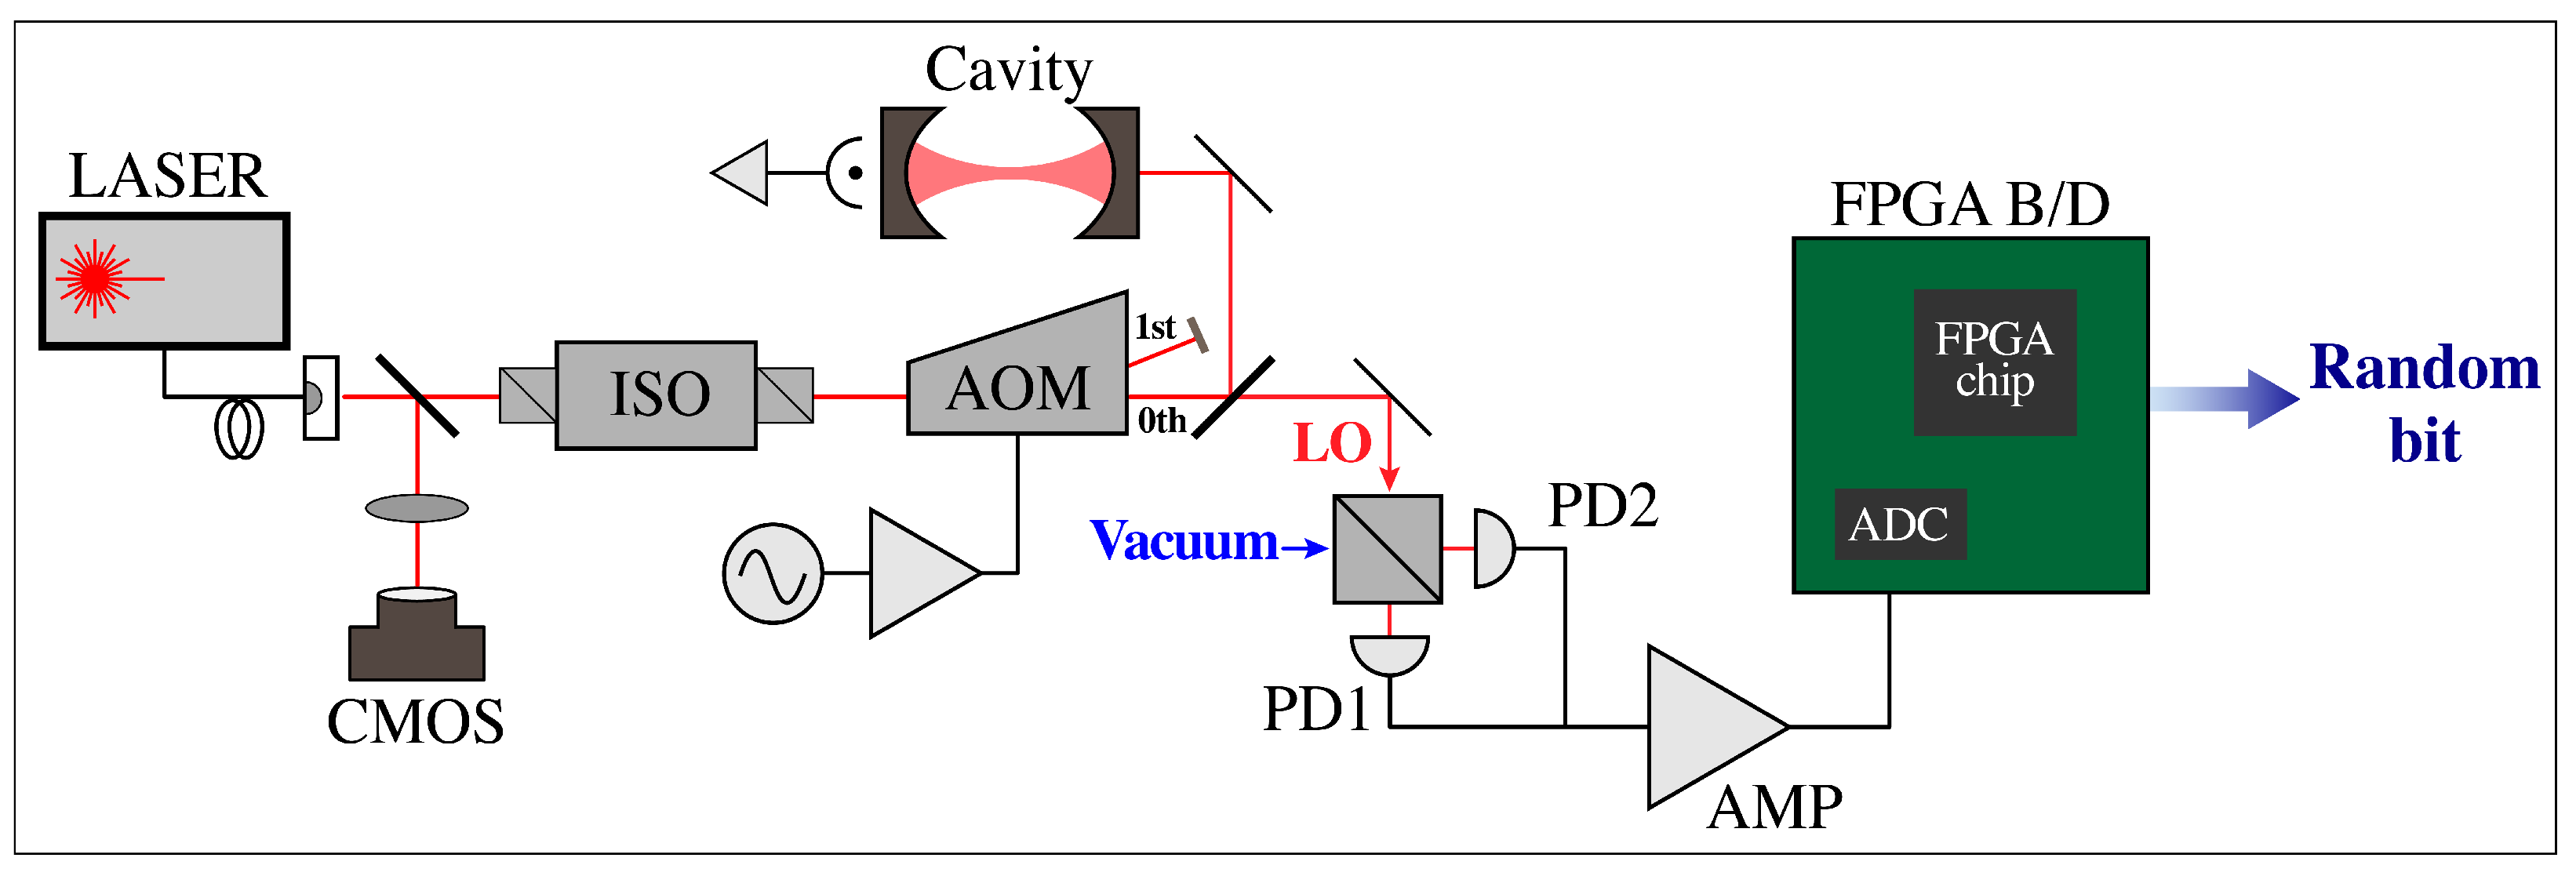
Figure 1. Experimental setup of the proposed QRNG system. Three laser sources were used: two multi-mode lasers and one single-mode laser, all with fiber-coupled outputs, which were collimated using aspheric lenses. For transverse- and longitudinal-mode analyses, small portions of the light were directed to a CMOS camera and a Fabry–Pérot cavity, respectively. An acousto-optic modulator (AOM) was installed for the measurement of the common-mode rejection ratio. After passing through the AOM, the main beam was mixed with the vacuum state at a beam splitter, and the outputs were measured using a BHD system. The amplified raw data were delivered to an FPGA board, where they were digitized and post-processed using a hash function. The resulting full-entropy data constituted the final quantum random numbers of the system. ISO: optical isolator, LO: local oscillator.
Photonics 12 00851 g001
Figure 2. Laser output power as a function of injection current for three types of sources: multi-mode 1 (MM1), multi-mode 2 (MM2), and single-mode (SM). Blue circles and red squares represent MM1 and MM2, while green triangles denote SM. In the case of MM1, the current could not be applied below the lasing threshold because the laser was supplied as an integrated module with a built-in driver, which limited control over low-current operation. Dashed lines indicate linear fitting results. The slopes for MM1 and MM2 are more than five times greater than that of the SM source, indicating that the selected multi-mode sources exhibit better efficiency in terms of optical power generation.
Photonics 12 00851 g002
Figure 3. Transverse-mode analysis of MM1, MM2, and SM. The first column shows the beam profile image captured by a CMOS camera. The second and third columns display the horizontal (X) and vertical (Y) cross-sectional intensity profiles, respectively. While the SM beam is well described by a single Gaussian function, MM1 and MM2 deviate from this fitting, indicating the presence of multiple transverse modes.
Photonics 12 00851 g003
Figure 4. Cavity transmission spectra measured using a Fabry–Pérot cavity with a 1.5 GHz free spectral range. Grey curves indicate the ramp voltage applied to scan the cavity length. While the SM laser shows stable peak positions over time, MM1 and MM2 exhibit peak shifts of several tens of megahertz within tens of seconds. This behavior indicates temporal mode hopping. Additionally, smaller peaks observed in MM2 suggest mode competition between multiple longitudinal modes.
Photonics 12 00851 g004
Figure 5. CMRR measurements for MM1, MM2, and SM. Noise spectra of the BHD output were measured using an RF spectrum analyzer. A beat signal at 80 MHz was introduced by overlapping the zeroth- and first-order beams generated by an AOM. Blue curves show the electronic noise with the laser beam blocked. Red curves correspond to the case where only one PD was illuminated, showing strong peaks at 80 MHz and 160 MHz. Green curves show the result with balanced inputs at both PDs, where the 80 MHz peak was suppressed by over 35 dB for all laser sources. Despite limited suppression at 160 MHz, classical noise was effectively reduced, enabling extraction of vacuum noise even with multi-mode lasers.
Photonics 12 00851 g005
Figure 6. Time- and frequency-domain plots of ADC outputs for MM1, MM2, and SM. Each panel compares measurements with and without the beam, corresponding to the presence or absence of vacuum fluctuations. Raw signals were sampled at 2.5 GSa/s using a 12-bit ADC over a total duration of approximately 42 ms. The first row shows the time-domain waveforms. The second row presents the FFT spectra up to the Nyquist frequency of 1.25 GHz. The spectra for the beam-on condition appear almost flat across the entire frequency range, indicating that vacuum fluctuations were amplified without spectral distortion.
Photonics 12 00851 g006
Figure 7. Histograms of ADC outputs for MM1, MM2, and SM, measured under beam-on (measured noise) and beam-off (electronic noise) conditions. Each histogram was fitted with a Gaussian function, indicating that both the measured noise and electronic noise follow Gaussian probability density functions (PDFs). Given that the PDF of the measured noise is the convolution of the electronic noise and vacuum noise PDFs, this observation supports the theoretically expected Gaussian nature of vacuum noise.
Photonics 12 00851 g007
Figure 8. Histogram of hashed outputs for MM1, MM2, and SM. The eight bit positions with the highest entropy were selected based on Shannon entropy computation for each bit position across all 12-bit samples obtained from ADC. These 8-bit samples were grouped into 768-bit blocks and fed into the SHA3-384 hash function. The resulting 384-bit outputs are referred to as full-entropy data, as the estimated min-entropy per bit exceeds 1 ε , where ε = 2 32 [49]. To perform the NIST tests, the 384-bit hash outputs were re-grouped into 8-bit samples.
Photonics 12 00851 g008
Table 1. Conditional min-entropy and QCNR for three different sources.
MM1MM2SM
H min ( M | E ) 8.528.358.55
QCNR (dB)3.612.553.82
Table 2. Estimated min-entropy of the selected 8-bit samples ( M ), obtained using the non-i.i.d. entropy assessment, and criterion values ε calculated according to the formula in [44], for three laser sources.
MM1MM2SM
H min ( M ) 7.407.587.57
ε 1.38 × 10 59 1.38 × 10 59 1.38 × 10 59
Table 3. Summary of the entropy and i.i.d. test results for the full-entropy data from three laser sources. LRS: longest repeated substring.
MM1MM2SM
H original 7.9863777.9866437.986876
H bitstring 0.9998360.9998400.999822
min ( H orig , 8 H bit ) 7.9863777.9866437.986876
Chi-square testPassedPassedPassed
LRS testPassedPassedPassed
Permutation testsPassedPassedPassed
Table 4. Results of the NIST Statistical Test Suite (STS) for MM1, MM2, and SM full-entropy data. Each cell reports the proportion of passed sequences (Prop.) and the uniformity of the p-value distribution (p-Val.).
Statistical TestMM1MM2SM
Prop.p-Val.Prop.p-Val.Prop.p-Val.
Frequency0.9890.4010.9890.1630.9840.057
Block Frequency0.9870.6660.9840.8830.9830.699
Cusum-Forward0.9970.4040.9890.3040.9840.094
Cusum-Reverse0.9920.7480.9900.9720.9860.147
Runs0.9840.8360.9900.5790.9870.214
Long Runs of Ones0.9840.6350.9890.4750.9830.485
Rank0.9900.8070.9840.2970.9940.839
Spectral DFT0.9920.8010.9870.6420.9870.044
Non-overlapping Templates0.9890.7250.9920.9360.9840.602
Overlapping Templates0.9870.7220.9900.0420.9860.295
Universal0.9830.2120.9920.0420.9790.190
Approximate Entropy0.9790.4660.9920.2470.9870.844
Random Excursions0.9950.0560.9920.4350.9920.320
Random Excursions Variant0.9870.1610.9870.1160.9950.137
Linear Complexity0.9980.6050.9920.2430.9860.227
Serial0.9890.8800.9940.9610.9920.795
Disclaimer/Publisher’s Note: The statements, opinions and data contained in all publications are solely those of the individual author(s) and contributor(s) and not of MDPI and/or the editor(s). MDPI and/or the editor(s) disclaim responsibility for any injury to people or property resulting from any ideas, methods, instructions or products referred to in the content.