Article

MGFormer: Super-Resolution Reconstruction of Retinal OCT Images Based on a Multi-Granularity Transformer

1
School of Computer and Communication Engineering, Northeastern University at Qinhuangdao, No. 143 Taishan Road, Qinhuangdao 066004, China
2
Laiwu People’s Hospital, Jinan 271100, China
3
School of Control Engineering, Northeastern University at Qinhuangdao, No. 143 Taishan Road, Qinhuangdao 066004, China
4
Department of Ophthalmology, The First Hospital of Qinhuangdao, Qinhuangdao 066001, China
5
School of Electronics and Information, Northwestern Polytechnical University, No. 1 Dongxiang Road, Xi’an 710129, China
*
Author to whom correspondence should be addressed.
Photonics 2025, 12(9), 850; https://doi.org/10.3390/photonics12090850 (registering DOI)
Submission received: 28 July 2025 / Revised: 20 August 2025 / Accepted: 22 August 2025 / Published: 25 August 2025
(This article belongs to the Section Biophotonics and Biomedical Optics)

Abstract

Optical coherence tomography (OCT) acquisitions often reduce lateral sampling density to shorten scan time and suppress motion artifacts, but this strategy degrades the signal-to-noise ratio and obscures fine retinal microstructures. To recover these details without hardware modifications, we propose MGFormer, a lightweight Transformer for OCT super-resolution (SR) that integrates a multi-granularity attention mechanism with tensor distillation. A feature-enhancing convolution first sharpens edges; stacked multi-granularity attention blocks then fuse coarse-to-fine context, while a row-wise top-k operator retains the most informative tokens and preserves their positional order. We trained and evaluated MGFormer on B-scans from the Duke SD-OCT dataset at 2 × , 4 × , and 8 × scaling factors. Relative to seven recent CNN- and Transformer-based SR models, MGFormer achieves the highest quantitative fidelity; at 4 × it reaches 34.39 dB PSNR and 0.8399 SSIM, surpassing SwinIR by +0.52 dB and +0.026 SSIM, and reduces LPIPS by 21.4%. Compared with the same backbone without tensor distillation, FLOPs drop from 289G to 233G (−19.4%), and per-B-scan latency at 4 × falls from 166.43 ms to 98.17 ms (−41.01%); the model size remains compact (105.68 MB). A blinded reader study shows higher scores for boundary sharpness (4.2 ± 0.3), pathology discernibility (4.1 ± 0.3), and diagnostic confidence (4.3 ± 0.2), exceeding SwinIR by 0.3–0.5 points. These results suggest that MGFormer can provide fast, high-fidelity OCT SR suitable for routine clinical workflows.

1. Introduction

High-resolution medical imaging is pivotal for accurate diagnosis, effective treatment planning, and reliable longitudinal monitoring [1,2]. Optical coherence tomography (OCT) has emerged as a leading technique due to its real-time, non-invasive capability to capture micrometer-scale, cross-sectional, and volumetric visualizations of biological tissues [3]. Its exceptional capacity to present retinal diseases has established OCT as a frontline diagnostic tool in ophthalmology and has also led to its increasing adoption in dermatology [4] and cardiology [5]. Yet the interferometric nature of OCT imaging renders it susceptible to speckle noise, which degrades image contrast and obscures fine structural details in the sample [6,7]. More critically, inevitable motion artifacts resulting from involuntary patient movements—such as eye saccades, cardiac pulsation, or head tremor—during acquisition compromise both image quality and diagnostic accuracy [8]. A commonly adopted clinical strategy to mitigate motion-induced artifacts is to accelerate scanning by reducing spatial sampling density [9]. However, this approach inevitably compromises both the signal-to-noise ratio (SNR) and the effective spatial resolution of the reconstructed volumes [10]. Consequently, critical microstructural details, such as retinal layer boundaries and early pathological features, may become blurred or lost [11]. This degradation not only reduces clinicians’ diagnostic confidence but also adversely affects the performance of downstream computer-aided diagnosis tools, including automated segmentation and quantitative analysis algorithms [12].
Image super-resolution (SR) offers a promising computational strategy to overcome these hardware-imposed limitations. By reconstructing high-resolution (HR) images from low-resolution (LR) inputs, SR techniques aim to restore high-frequency information and enhance fine structural details, thereby unlocking the full diagnostic potential inherent in OCT datasets. Early SR methods, based on interpolation, resampling, or sparse reconstruction, were limited by oversmoothing and poor structural fidelity. Recent advances in deep learning have significantly transformed the SR landscape. Convolutional neural networks (CNNs), such as SRCNN [13], EDSR [14], and RCAN [15], have achieved remarkable success on natural image benchmarks. CNN-based models suffer from the content-independent nature of convolutional kernels, which interact with images in a uniform manner regardless of content variations. However, retinal OCT images exhibit significant inter-layer differences, necessitating robust content-adaptive interactions and enhanced information extraction. Moreover, convolutions are limited to capturing local features and are ineffective at modeling long-range dependencies [16,17,18]. This is particularly problematic for retinal OCT images, which contain extended lateral layered structures where long-range interactions are critical for extracting meaningful features. As a result, CNN-based SR methods often produce overly smooth reconstructions, inadequately recovering clinically relevant micro-anatomical details. Although generative adversarial networks (GANs)—such as SRGAN [19], SDSR-OCT [20], N2NSR-OCT [21], and unsupervised GAN-based approaches [22]—have demonstrated improved texture restoration, they are prone to introducing artifacts and often suffer from training instability, undermining clinical reliability.
Transformer-based architectures have recently achieved state-of-the-art performance in natural image SR by leveraging self-attention mechanisms to capture long-range dependencies [23]. Early Transformer-based models compute pairwise token interactions uniformly across the entire spatial domain, resulting in high computational overhead and suboptimal extraction of fine-grained, localized details essential for medical imaging tasks [24,25]. The subsequent Transformer-based models, exemplified by SwinIR, deliver state-of-the-art accuracy, but their fixed, shifted-window self-attention still constrains cross-window information flow. This restriction prevents the network from adaptively aggregating the context that different image regions require, and enlarging the window to capture broader context tends to dilute high-frequency cues, leading to blurry fine details in texture-rich areas [26,27]. Meanwhile, most existing Transformer-based SR models lack explicit multi-scale feature modeling and hierarchical information fusion, both of which are critical for faithfully reconstructing the inherently layered and multi-granular structures of OCT images.
To address these limitations, we propose MGFormer (multi-granularity Transformer), a novel deep learning architecture specifically tailored for OCT image super-resolution reconstruction. The central innovation of MGFormer lies in its multi-granularity attention mechanism, which is strategically designed to overcome the shortcomings of both conventional CNNs and standard Transformers in OCT SR tasks. Specifically, (1) hierarchical feature processing: MGFormer explicitly extracts and processes features at multiple granularity levels, facilitating the integration of deep semantic information and shallow texture cues. This hierarchical design enhances the delineation of layer boundaries and preserves fine anatomical structures. (2) Innovative tensor distillation (TD) mechanism: Tensor distillation compresses an input tensor with a top-k filter: a row-wise top-k operator selects the k key–value pairs most relevant to the current query, preserves their positional information, and then aggregates them, thereby improving GPU resource utilization and reducing computational overhead. (3) OCT-specific adaptations: Dedicated modules, including feature-enhancing convolutions and a stepwise upsampling block, optimize the network for OCT data by capturing layered structural features and suppressing speckle noise. The primary contributions of this work are as follows:
  • We propose MGFormer, a novel Transformer-based SR framework that features a multi-granularity attention mechanism specifically designed for OCT image reconstruction.
  • Extensive experiments on both benchmark and clinical OCT datasets demonstrate that MGFormer consistently outperforms state-of-the-art SR models, including SRCNN, SRGAN, EDSR, BSRN, RCAN, and SwinIR, in terms of both quantitative metrics (PSNR, SSIM, and LPIPS) and qualitative visual assessment.
  • The high-fidelity SR outputs generated by MGFormer hold significant clinical relevance by enhancing diagnostic confidence and providing superior inputs for downstream OCT image analysis tasks, such as automated segmentation and disease classification.
The remainder of this paper is organized as follows: Section 2 presents the MGFormer architecture in detail. Section 3 describes the experimental setup, including datasets, data pre-processing, and experimental process. Section 4 reports the experimental results, comparative analyses, and ablation study. Section 5 discusses the findings, limitations, and potential avenues for future research. Finally, Section 6 concludes the paper.

2. Method

As illustrated in Figure 1, the proposed model comprises three core modules: a shallow feature extraction module, a deep feature extraction module, and an image reconstruction module. The shallow feature extraction module employs feature-enhancing convolutions to capture edge and contour details from retinal OCT images, thereby facilitating subsequent processing. The deep feature extraction module leverages a multi-granularity attention mechanism to extract abstract image information, effectively restoring details lost to noise and down-sampling. The image reconstruction module then integrates the shallow and deep features and applies PixelShuffle [28] to generate the final image from the fused feature set.

2.1. Shallow Feature Extraction Module

The shallow feature extraction module (SFEM) comprises two blocks, namely, a feature-enhancing convolution (FEConv) block and a channel reconstruction (CR) block. This module maps the input image from a low-dimensional to a high-dimensional feature space, thereby increasing the representational capacity of the data. The transformation can be expressed by Formula (1):
F 0 = H S F I L Q
where F 0 represents the output of SFEM, H S F · represents the mapping corresponding to the extraction of shallow features, and I L Q represents the input low-resolution image.
The FEConv block is designed to extract shallow features from images, offering superior texture and detail capture compared to conventional convolution by leveraging low-frequency information more effectively. Unlike conventional convolution, which lacks constraints and suffers from an overly broad search space, limiting its expressive capacity and optimization efficiency, the proposed approach employs five convolution layers [29]—one vanilla convolution (VC) and four difference convolutions [30], namely horizontal difference convolution (HDC), vertical difference convolution (VDC), angular difference convolution (ADC), and central difference convolution (CDC). These layers are deployed in parallel to extract distinct feature representations, which are subsequently concatenated across channels to produce FEConv output. The VC captures intensity-level information, while the difference convolutions enhance gradient-level and detail information in various directions [31]. This process is expressed in Formula (2):
f = F E C o n v ( x ) = C o n c a t ( C i · I L Q )
where f represents the output of FEConv, F E C o n v ( · ) corresponds to the mapping function of FEConv, C i represents different convolution kernels, and C o n c a t ( · ) represents the channel concatenation operation.
CR block employs a 1 × 1 convolution to address the increased computational complexity resulting from the FEConv block. The latter utilizes channel concatenation, expanding the channel count to five times its original size, significantly increasing the computational burden. CR block compresses the channel count, thereby reducing the computational load for subsequent modules while facilitating the fusion of channel information. This process is expressed in Formula (3):
R o = C 5 1 1 × 1 ( f )
where R o represents the output of the CR block, and C 5 1 1 × 1 ( · ) represents a 1 × 1 convolution.

2.2. Deep Feature Extraction Module

The deep feature extraction module (DFEM) comprises sequentially stacked multi-granularity attention blocks (MGABs) integrated with FEConv for feature fusion. Residual connections between blocks facilitate feature preservation, mitigate overfitting, and streamline training. Each MGAB hierarchically transforms features to capture multi-scale abstract representations, while residual connections ensure retention of input information. This process for a single MGAB block is expressed in Formula (4):
F i = H f i ( H c i ( F i 1 + F i 2 + + F 0 )
where F i represents the output of the i-th MGAB block, i [ 1 , K ] , K is the number of stacked MGAB blocks, H c i ( · ) represents the coarse-grained attention mechanism mapping, H f i ( · ) represents the fine-grained attention mechanism mapping.
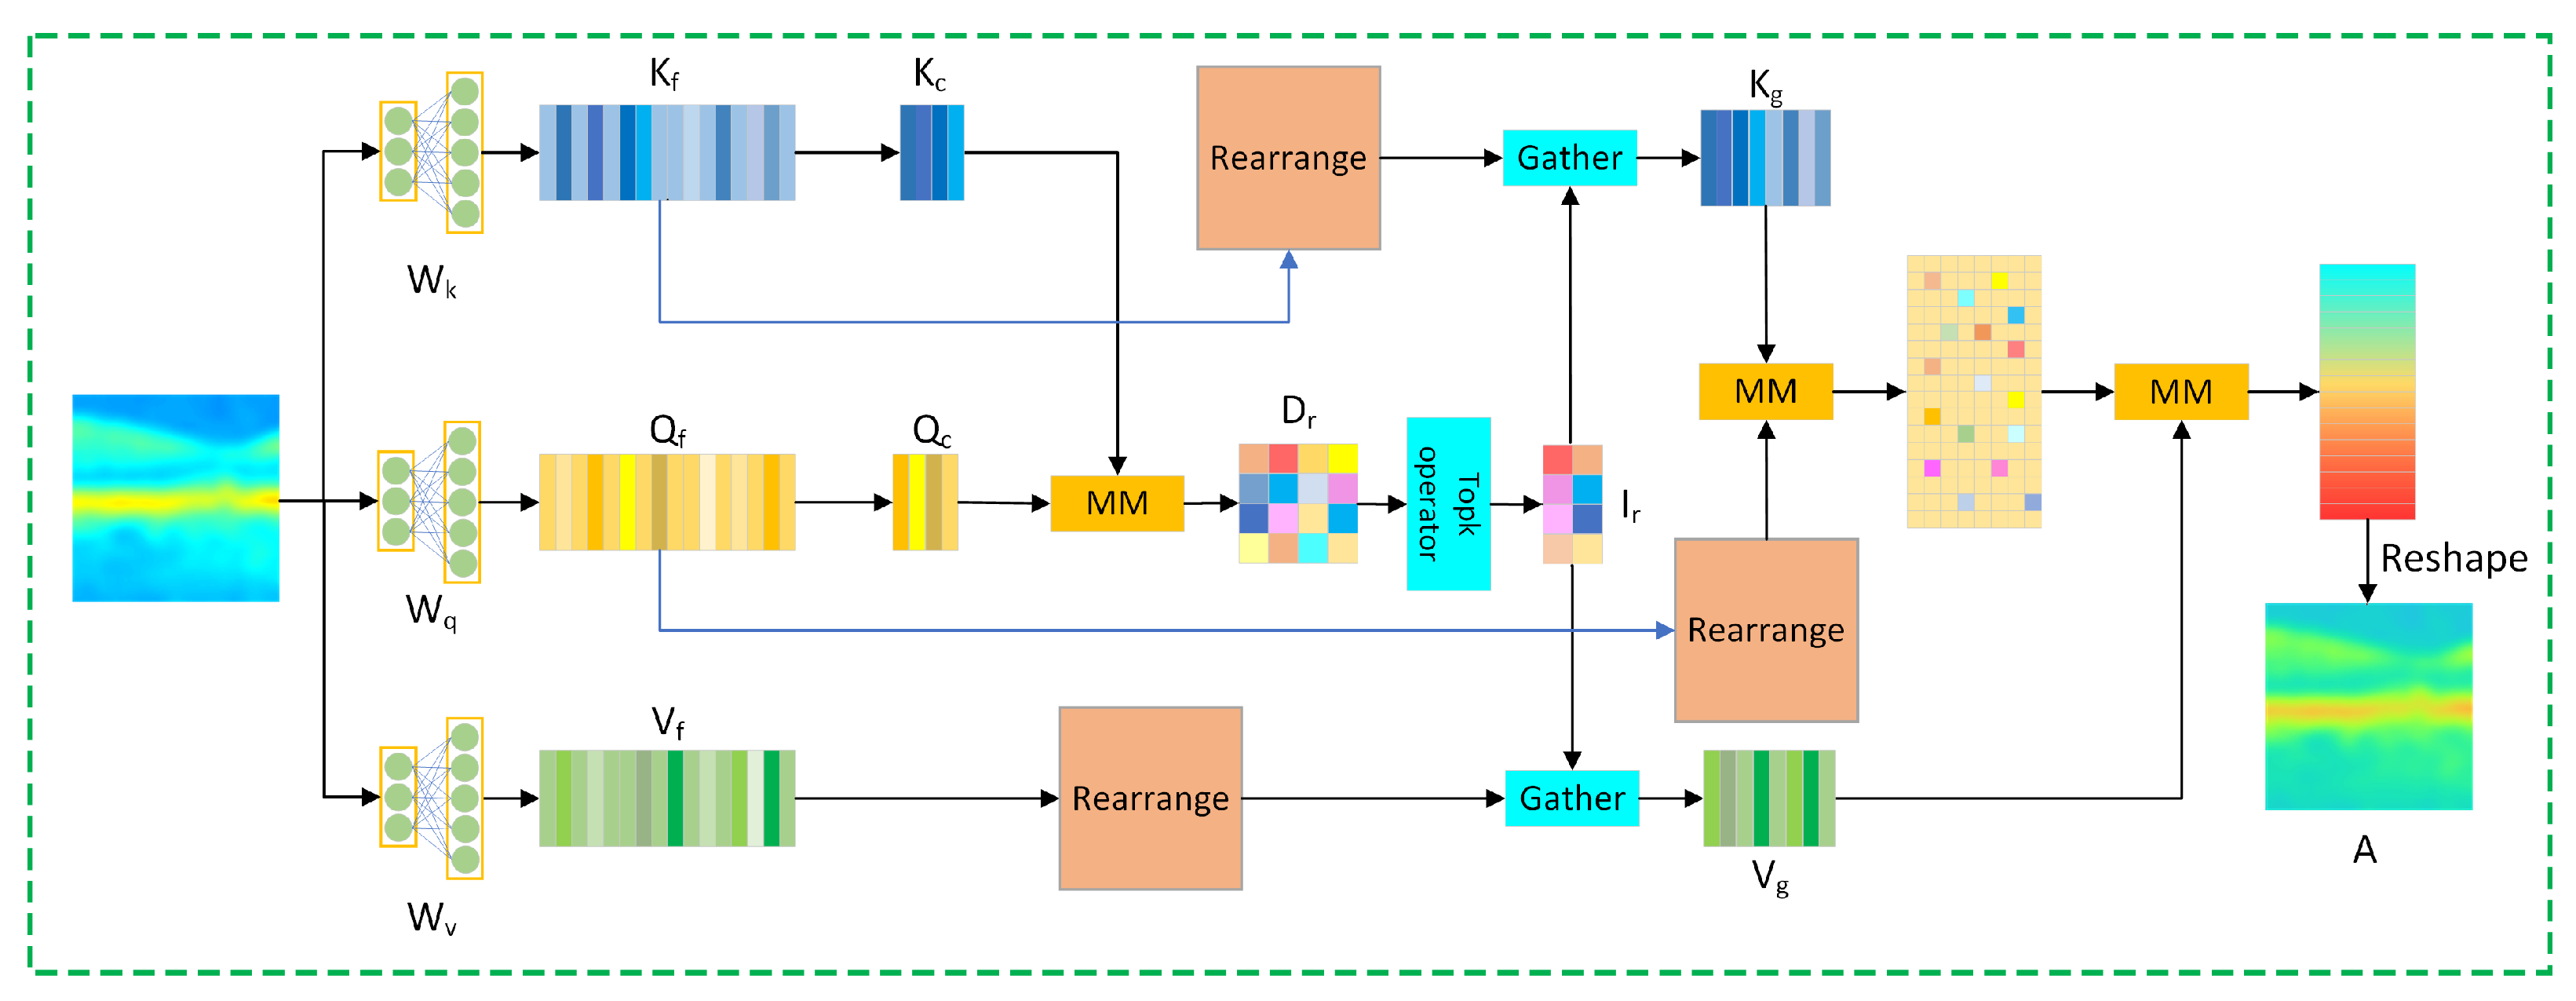
The multi-granularity attention mechanism consists of two parts—coarse-grained attention and fine-grained attention. The coarse-grained attention mechanism identifies correlations between different regions, filtering out most low-relevance key–value pairs. Subsequently, the fine-grained attention mechanism operates on highly correlated patches to extract detailed features. The structure is depicted in Figure 2. The multi-granularity attention mechanism, combined with position encoding, MLP, LN, etc., constitutes MGAB. For each MGAB block, given an input X R H × W × C (H, W, C represent the height, width, and number of channels of the input image, respectively), a 3 × 3 depth-wise convolution is first applied to implicitly encode relative positional information. The feature map is then partitioned into M × M non-overlapping regions, each with a feature vector of size H W M 2 . This enables X R H × W × C to X r R M 2 × H W M 2 × C . The reshaped features are then mapped to query Q f , key K f , and value V f tensors through learnable weight tensors W q , W k , and W v , as expressed in Formula (5).
Q f = W q X r K f = W k X r V f = W v X r
For each non-overlapping window, we compute the spatial mean of its local query, key, and value tensors to obtain region-level (i.e., coarse-grained) query and key tensors, as expressed in Formula (6):
Q c = 1 P i = 0 P Q f i K c = 1 P i = 0 P K f i
where Q c and K c are, respectively, the coarse-grained query and key tensors, and P represents the number of fine-grained tensors within the current regions.
The affinity tensor D r is calculated to quantify the pairwise correlations among regions, as expressed in Formula (7):
D r = Q c K c T
Next, tensor distillation is applied to the fine-level key tensors K f and value tensors V f . The goal is to distill the large tensors to compact subsets that retain the most salient contextual cues, thereby reducing computational cost. For each query region, we perform a row-wise top-k search on the affinity tensor to identify the k regions most correlated with the region. During the search process, the position indices of each element in the original tensor are also tracked and saved in the tensor I r , as expressed in Formula (8):
I r = t o p k i n d e x D r
where I r represents the regional index tensor, and t o p k i n d e x ( · ) represents the row-wise top-k operator.
To maximize GPU throughput, we gather the distilled keys and values into separate contiguous tensors using the position indices from the index tensor I r before invoking fine-grained attention. This arrangement allows modern GPUs to execute the subsequent tensor-tensor operations as a single highly parallel call, as expressed in Formula (9):
K g = g a t h e r ( K f , I r ) V g = g a t h e r ( V f , I r )
where K g and V g represent the key and value tensors obtained by aggregating regions based on the index, and g a t h e r ( · ) represents the mapping corresponding to the aggregation.
Subsequently, fine-grained attention is invoked to capture information. To enrich local details, we employ deep pointwise convolution to enhance contextual representations [32], as expressed in Formula (10):
A = s o f t m a x Q f K g T d V g + D W C o v ( V g )
where A represents the output of the fine-grained attention mechanism, d represents the introduced scalar factor, s o f t m a x ( · ) represents the softmax function, and D W C o v ( · ) represents the depth-wise separable convolution. Here, only the case of a single-head self-attention mechanism is presented. In reality, we use the multi-head self-attention mechanism [33].
The attention output is processed with layer normalization (LN) to stabilize the data distribution and prevent overflow, followed by a multi-layer perceptron (MLP) module with an expansion ratio of 2 for cross-position relationship modeling and feature transformation. The MGAB block output is expressed in Formula (11):
O = M L P ( L N ( A ) )
where O represents the final output of the MGAB block, L N ( · ) represents the layer normalization operation, and M L P ( · ) represents the mapping of an MLP layer.

2.3. Image Reconstruction Module

The image reconstruction module (IRM) contains multiple convolutional layers and a super-resolution scaling block (SRSB) to aggregate shallow and deep features and to reconstruct high-quality images. Shallow features primarily capture low-frequency information, whereas deep features focus on restoring the desired high-frequency details. Through long-range residual connections from the SFEM output to the DFEM output, low-frequency information is directly propagated to the reconstruction module, enabling the fusion of shallow and deep features. This facilitates more comprehensive feature representation, provides additional optimization pathways for gradient propagation, and stabilizes the training process. Moreover, it allows the deep feature extraction module to concentrate on processing high-frequency components. SRSB is composed of a convolution and a PixelShuffle block, which is used to achieve the rearrangement of feature channels and the upsampling of the feature map, thereby increasing the pixel density. This process is expressed in Formula (12):
I S R = I R M F K + F 0
where I S R represents the output image after super-resolution reconstruction, I R M ( · ) corresponds to the mapping of IRM, F 0 represents the output of SFEM, F K represents the output of DFEM.

2.4. Loss Function

The loss function integrates L1 loss and perceptual loss [34] to optimize the model for high-quality image reconstruction. The L1 loss l 1 ensures pixel-wise accuracy between the reconstructed and real HR images, while the perceptual loss l p enhances high-level feature similarity, improving visual quality. The combined loss function is expressed in Formula (13):
f l o s s = λ 1 l 1 + λ 2 l p
where λ 1 and λ 2 represent the weights of each part’s loss, and their values are self-adaptive. Concretely, both λ 1 and λ 2 were initially set to 1. Then, using gradient descent, they were updated separately according to the backpropagated gradients of the loss function, until training converged and the weights stabilized; f l o s s is the final loss function.
The L1 loss is employed to minimize pixel-wise differences between the SR output I S R and real HR images I H R . Compared to L2 loss, L1 loss converges faster, produces sharper features, and exhibits greater robustness [35], resulting in superior recovery of details and edges. The L1 loss is formulated as shown in Formula (14):
l 1 = 1 N I H R I S R 1
where N represents the size of the model batch.
The perceptual loss leverages a pre-trained VGG-19 network to extract features from both real HR and SR output images, mapping them into a feature space. Feature maps from specific VGG-19 layers are compared using the Euclidean distance to emphasize perceptual quality. This approach, which preserves the geometric invariance of the feature manifold, enhances image resolution optimization [36]. The perceptual loss is formulated as shown in Formula (15):
l p = 1 N ϕ ( I H R ) ϕ ( I S R ) 1
where ϕ ( · ) represents the mapping corresponding to the VGG-19 network, and N represents the size of the model batch.

3. Experiments

To rigorously evaluate the SR reconstruction performance of the proposed network, we utilized the publicly available spectral-domain optical coherence tomography (SD-OCT) dataset [37] (referred to as the DK-OCT dataset) from Duke University for training and testing. This dataset was acquired using a Bioptigen SD-OCT imaging system with an 840 nm wavelength, capturing axial B-scans of subjects with age-related macular degeneration (AMD) or healthy retinas. Each image had a resolution of 450 × 900 pixels.
To achieve sufficient training data volume, we performed image cropping and flipping operations to generate 700 paired images consisting of noisy images and clear HR images. Then the noisy images are downsampled at 2 × , 4 × , and 8 × scales to yield corresponding LR counterparts. These LR images are then combined with their clear HR references to construct three distinct data subsets corresponding to each downsampling factor.
Experiments were conducted on a system equipped with an NVIDIA RTX 4070Ti GPU, 32 GB of RAM, and an Intel Core i7-14700KF CPU, using the PyTorch 2.0.1 framework and Python 3.8 to build and train the network. The adaptive moment estimation (Adam) optimizer was employed with parameters β 1 = 0.9 and β 2 = 0.99 , a batch size of 4, a Patch_Size (Patch_Size denotes the number of fine-grained patches along the length or width of the LR image) of 8, an MLP expansion ratio of 2, and 16 stacked MGABs. A learning rate decay strategy was adopted, with an initial learning rate of 0.001, halved every 25 epochs until reaching 0.0001 or model convergence. To enhance high-quality image reconstruction by effectively utilizing shallow and deep features, IRM incorporated varying numbers of scaling blocks instead of multi-scale PixelShuffle operations—one module for 2 × reconstruction, two for 4 × reconstruction, and three for 8 × reconstruction. After training, the model with the lowest loss value was selected for subsequent experiments.
To assess the robustness of the proposed model, we initially employed fivefold cross-validation on the 700 paired images in the 4 × downsampled data subsets. Each subset was evenly divided into five folds, with four folds used as the training set and one as the validation set in each of five training iterations, ensuring every image appeared in the validation set once. The results are presented in Figure 3. All baselines were retrained under a standardized protocol (splits, preprocessing/augmentation, patch/batch, optimizer/LR schedule, early stopping, seed, and hardware as specified above) while preserving each method’s canonical loss.
Figure 3 illustrates the validation loss curves of various super-resolution methods with 5-fold cross-validation. Each shaded band represents the mean ± standard deviation across 5 trials, demonstrating the stability of model convergence. The results show that the proposed model achieved the lowest loss value among all compared models after approximately 35 epochs. The loss value after convergence of this model was approximately 6.5% lower than that of the second-ranked model (RCAN). The model exhibited a rapid initial decline in loss, reaching convergence around 80 epochs, with post-convergence fluctuations of approximately 6%. In contrast, SRGAN and SwinIR displayed larger fluctuations after convergence, underscoring the effectiveness and stability of the proposed method.
For the definitive evaluation, each of the 2 × , 4 × , and 8 × downsampled subsets was randomly partitioned into training, validation, and test splits at an 8:1:1 ratio—560 pairs for training, 70 for validating, and 70 for testing. The network was then retrained from scratch on the corresponding training split while keeping all hyperparameters unchanged. The result is shown in Figure 4.
It can be seen from Figure 4 that the proposed model achieved the best results in both PSNR and SSIM. Especially in SSIM, the proposed model demonstrated substantial superiority over other mainstream methods, outperforming the second-best model (SwinIR) by approximately 3.2%.

4. Results and Ablation Study

4.1. Results

To rigorously evaluate the performance of the proposed SR network, we conducted qualitative and quantitative comparisons with several baseline methods—BM3D combined with Bicubic interpolation (BM3D for denoising and Bicubic for upsampling, in this paper, it is referred to as BMBic), SRCNN, SRGAN, EDSR, BSRN, RCAN, and SwinIR. Reconstruction quality was quantified with three complementary metrics—peak signal-to-noise ratio (PSNR), structural similarity (SSIM), and learned perceptual image patch similarity (LPIPS). These metrics quantify, respectively, pixel-wise fidelity, structural consistency, and the perceptual resemblance of the reconstructions to the ground-truth images. The calculation methods of these metrics are, respectively, expressed in Formulas (16)–(18).
P S N R = 10 log 10 M A X I 2 M S E M S E = 1 m n i = 0 m 1 j = 0 n 1 I H R ( i , j ) I S R ( i , j )
where M A X I represents the maximum value of image pixel coloration, m and n represent the height and width of the image, respectively.
S S I M x , y = ( 2 μ x μ y + c 1 ) ( 2 σ x y + c 2 ) ( μ x 2 + μ y 2 + c 1 ) ( σ x 2 + σ y 2 + c 2 )
where x and y represent HR and SR images, respectively; μ x and μ y represent the mean values of x and y, respectively; σ x and σ y represent the variance of x and y, respectively; σ x y represents the covariance of x and y.
L P I P S ( x , x 0 ) = l 1 H l W l h , w ω l ( y ^ h w l y ^ 0 h w l ) 2 2
where x and x 0 represent HR and SR images, respectively; H l and W l represent the height and width of the output feature maps of the l-th layer in a pre-trained VGG-19 network, respectively; ω l represents a learned weight vector; ⊙ represents the element-wise multiplication operation; and y ^ h w l and y ^ 0 h w l represent the extracted features of the corresponding x and x0 of the l-th layer at location (h, w), respectively.
Table 1 reports quantitative results for 2 × , 4 × , and 8 × super-resolution on the DK-OCT dataset. All models—BMBic, SRCNN, SRGAN, EDSR, BSRN, RCAN, SwinIR, and the proposed MGFormer—were trained on an identical dataset to ensure a fair comparison of performance differences. MGFormer consistently outperformed all baselines in PSNR, SSIM, and LPIPS across all scales. At the challenging 4 × setting, MGFormer exceeds the strongest baseline (SwinIR) by +0.52 dB PSNR and +0.026 SSIM, and reduces LPIPS by 0.0339 (absolute), corresponding to a 21.4% relative decrease (from 0.1585 to 0.1246); it also outperforms the conventional BMBic pipeline by +4.05 dB PSNR, +0.135 SSIM, and −0.297 LPIPS. For 2 × and 8 × scales, results are similar. These results demonstrate MGFormer’s ability to reconstruct high-quality SD-OCT images from sparsely sampled inputs.
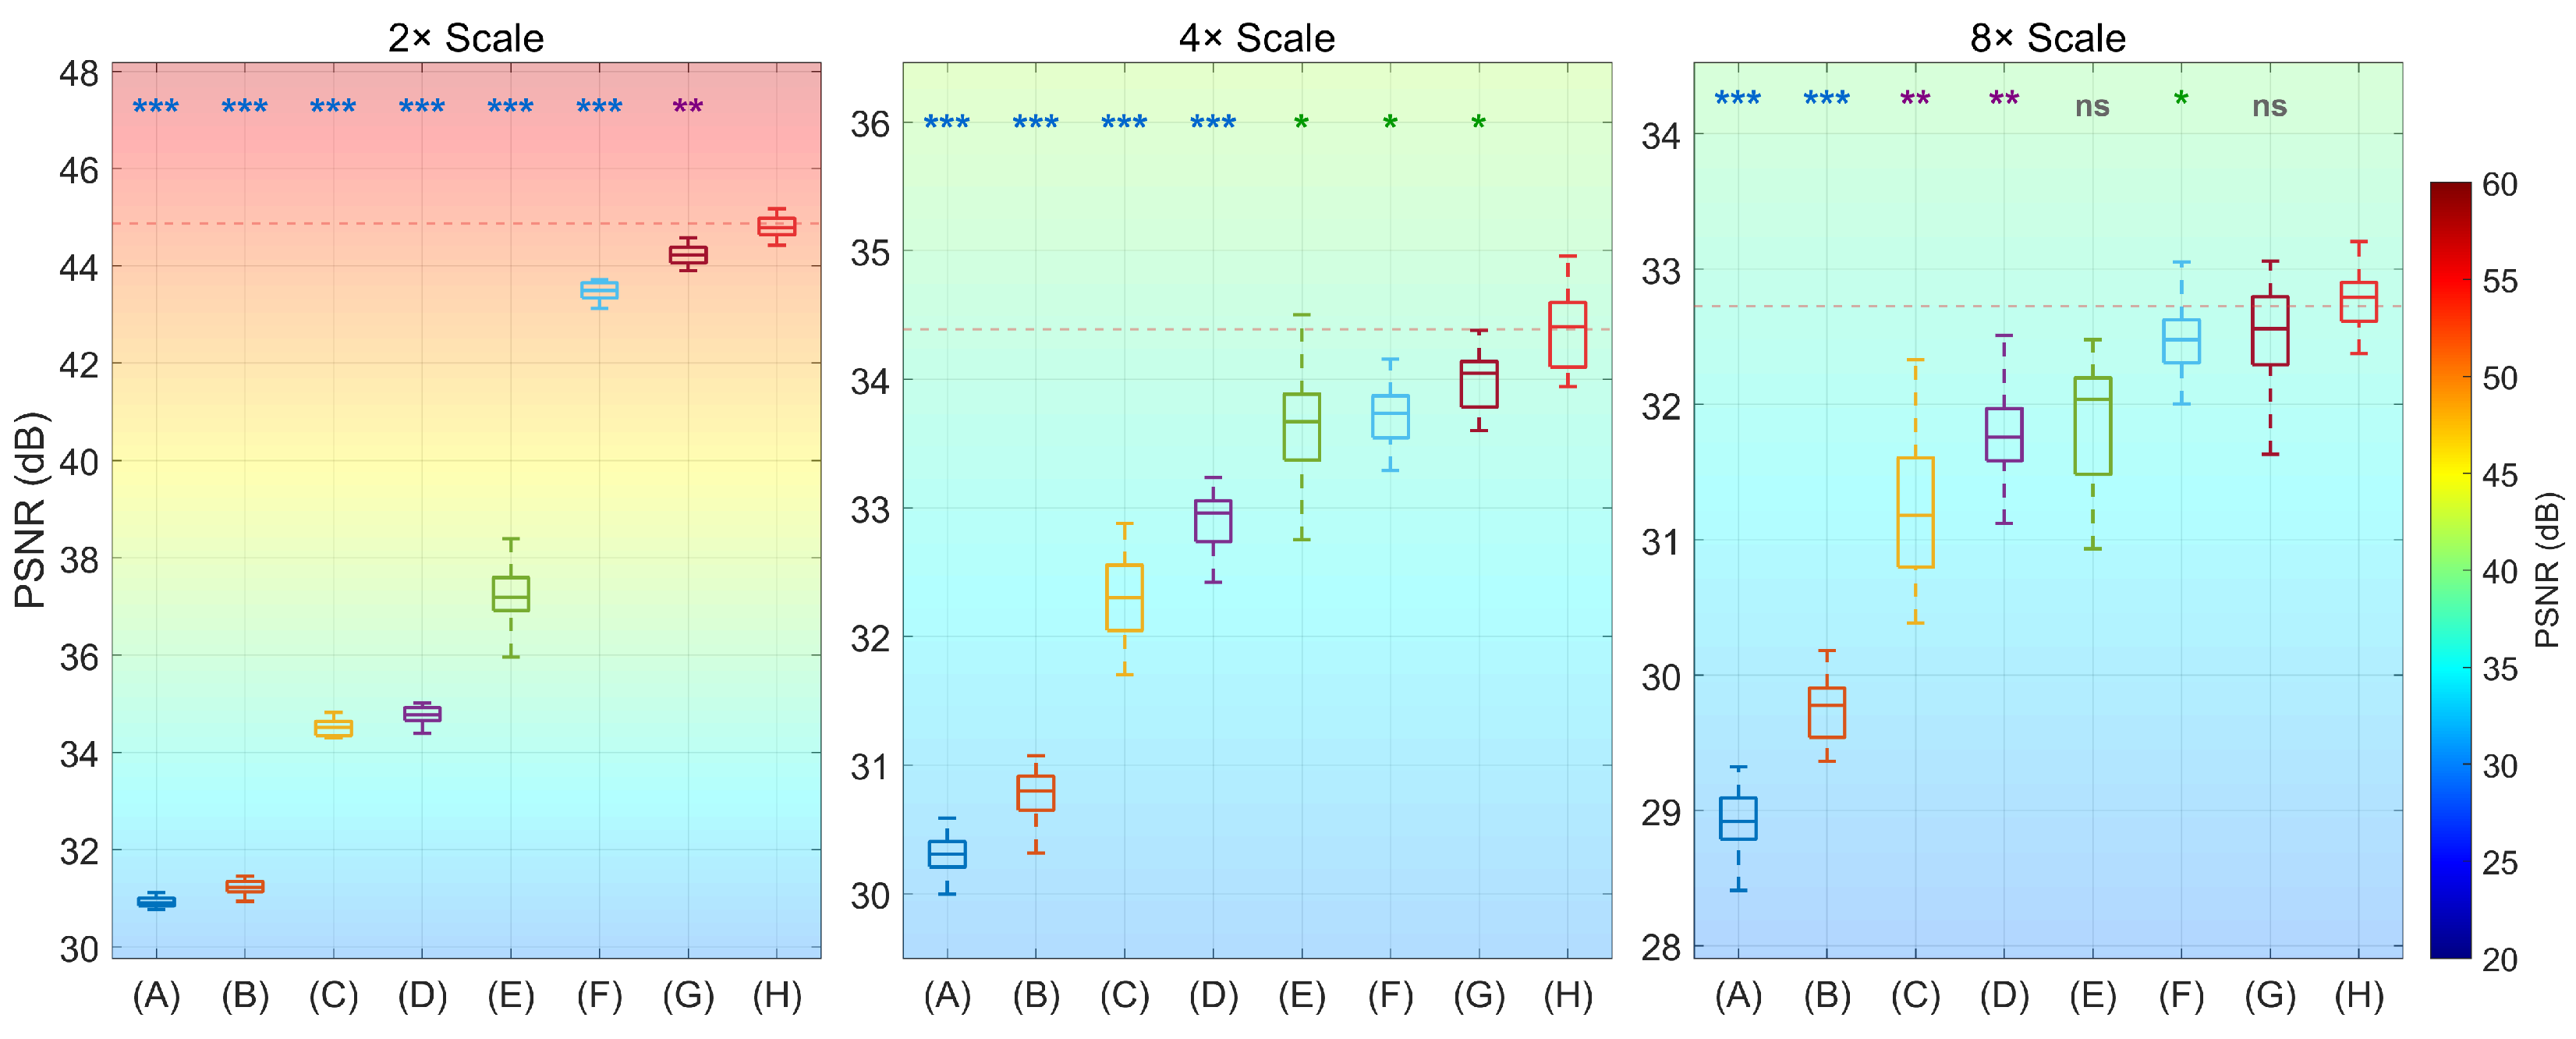
Figure 5 shows a visual synopsis of the fivefold cross-validation results and their statistical interpretation. It depicts box-and-whisker plots of the PSNR obtained by eight representative SR algorithms at three upsampling factors ( 2 × , 4 × , and 8 × ). Each box aggregates the five cross-validation folds, allowing direct inspection of both central tendency and spread, while the colored background encodes the absolute PSNR range (jet scale shown at the right-hand color bar). Across all scales, the MGFormer (red boxes) is systematically higher than every comparative method. The dashed horizontal line in each panel marks the fold-averaged PSNR of MGFormer, highlighting a gap of ≈1.3 dB at 2 × , 0.7 dB at 4 × , and 0.4 dB at 8 × to the second-best SwinIR. These margins corroborate the numerical gains reported in Table 1.
Stars plotted above each baseline denote the paired t-test against MGFormer. All competitors are significantly inferior at 2 × and 4 × . At the 8 × scale, compared with BMBic, SRCNN, SRGAN, and EDSR, MGFormer remains highly significant, whereas RCAN and SwinIR no longer reach the 5% threshold, indicating their performance converges toward ours when the degradation becomes severe. The box height narrows for our model, reflecting lower fold-to-fold variability and hence greater robustness to data partitioning. In contrast, GAN-based SRGAN exhibits wider inter-quartile ranges, consistent with its unstable optimization. Absolute PSNR drops roughly logarithmically with scale (gradient background shifts from warm to cool colors), yet MGFormer preserves a larger proportion of its 2 × advantage when moving to 8 × , suggesting the proposed multi-granularity attention better captures long-range retinal structures.
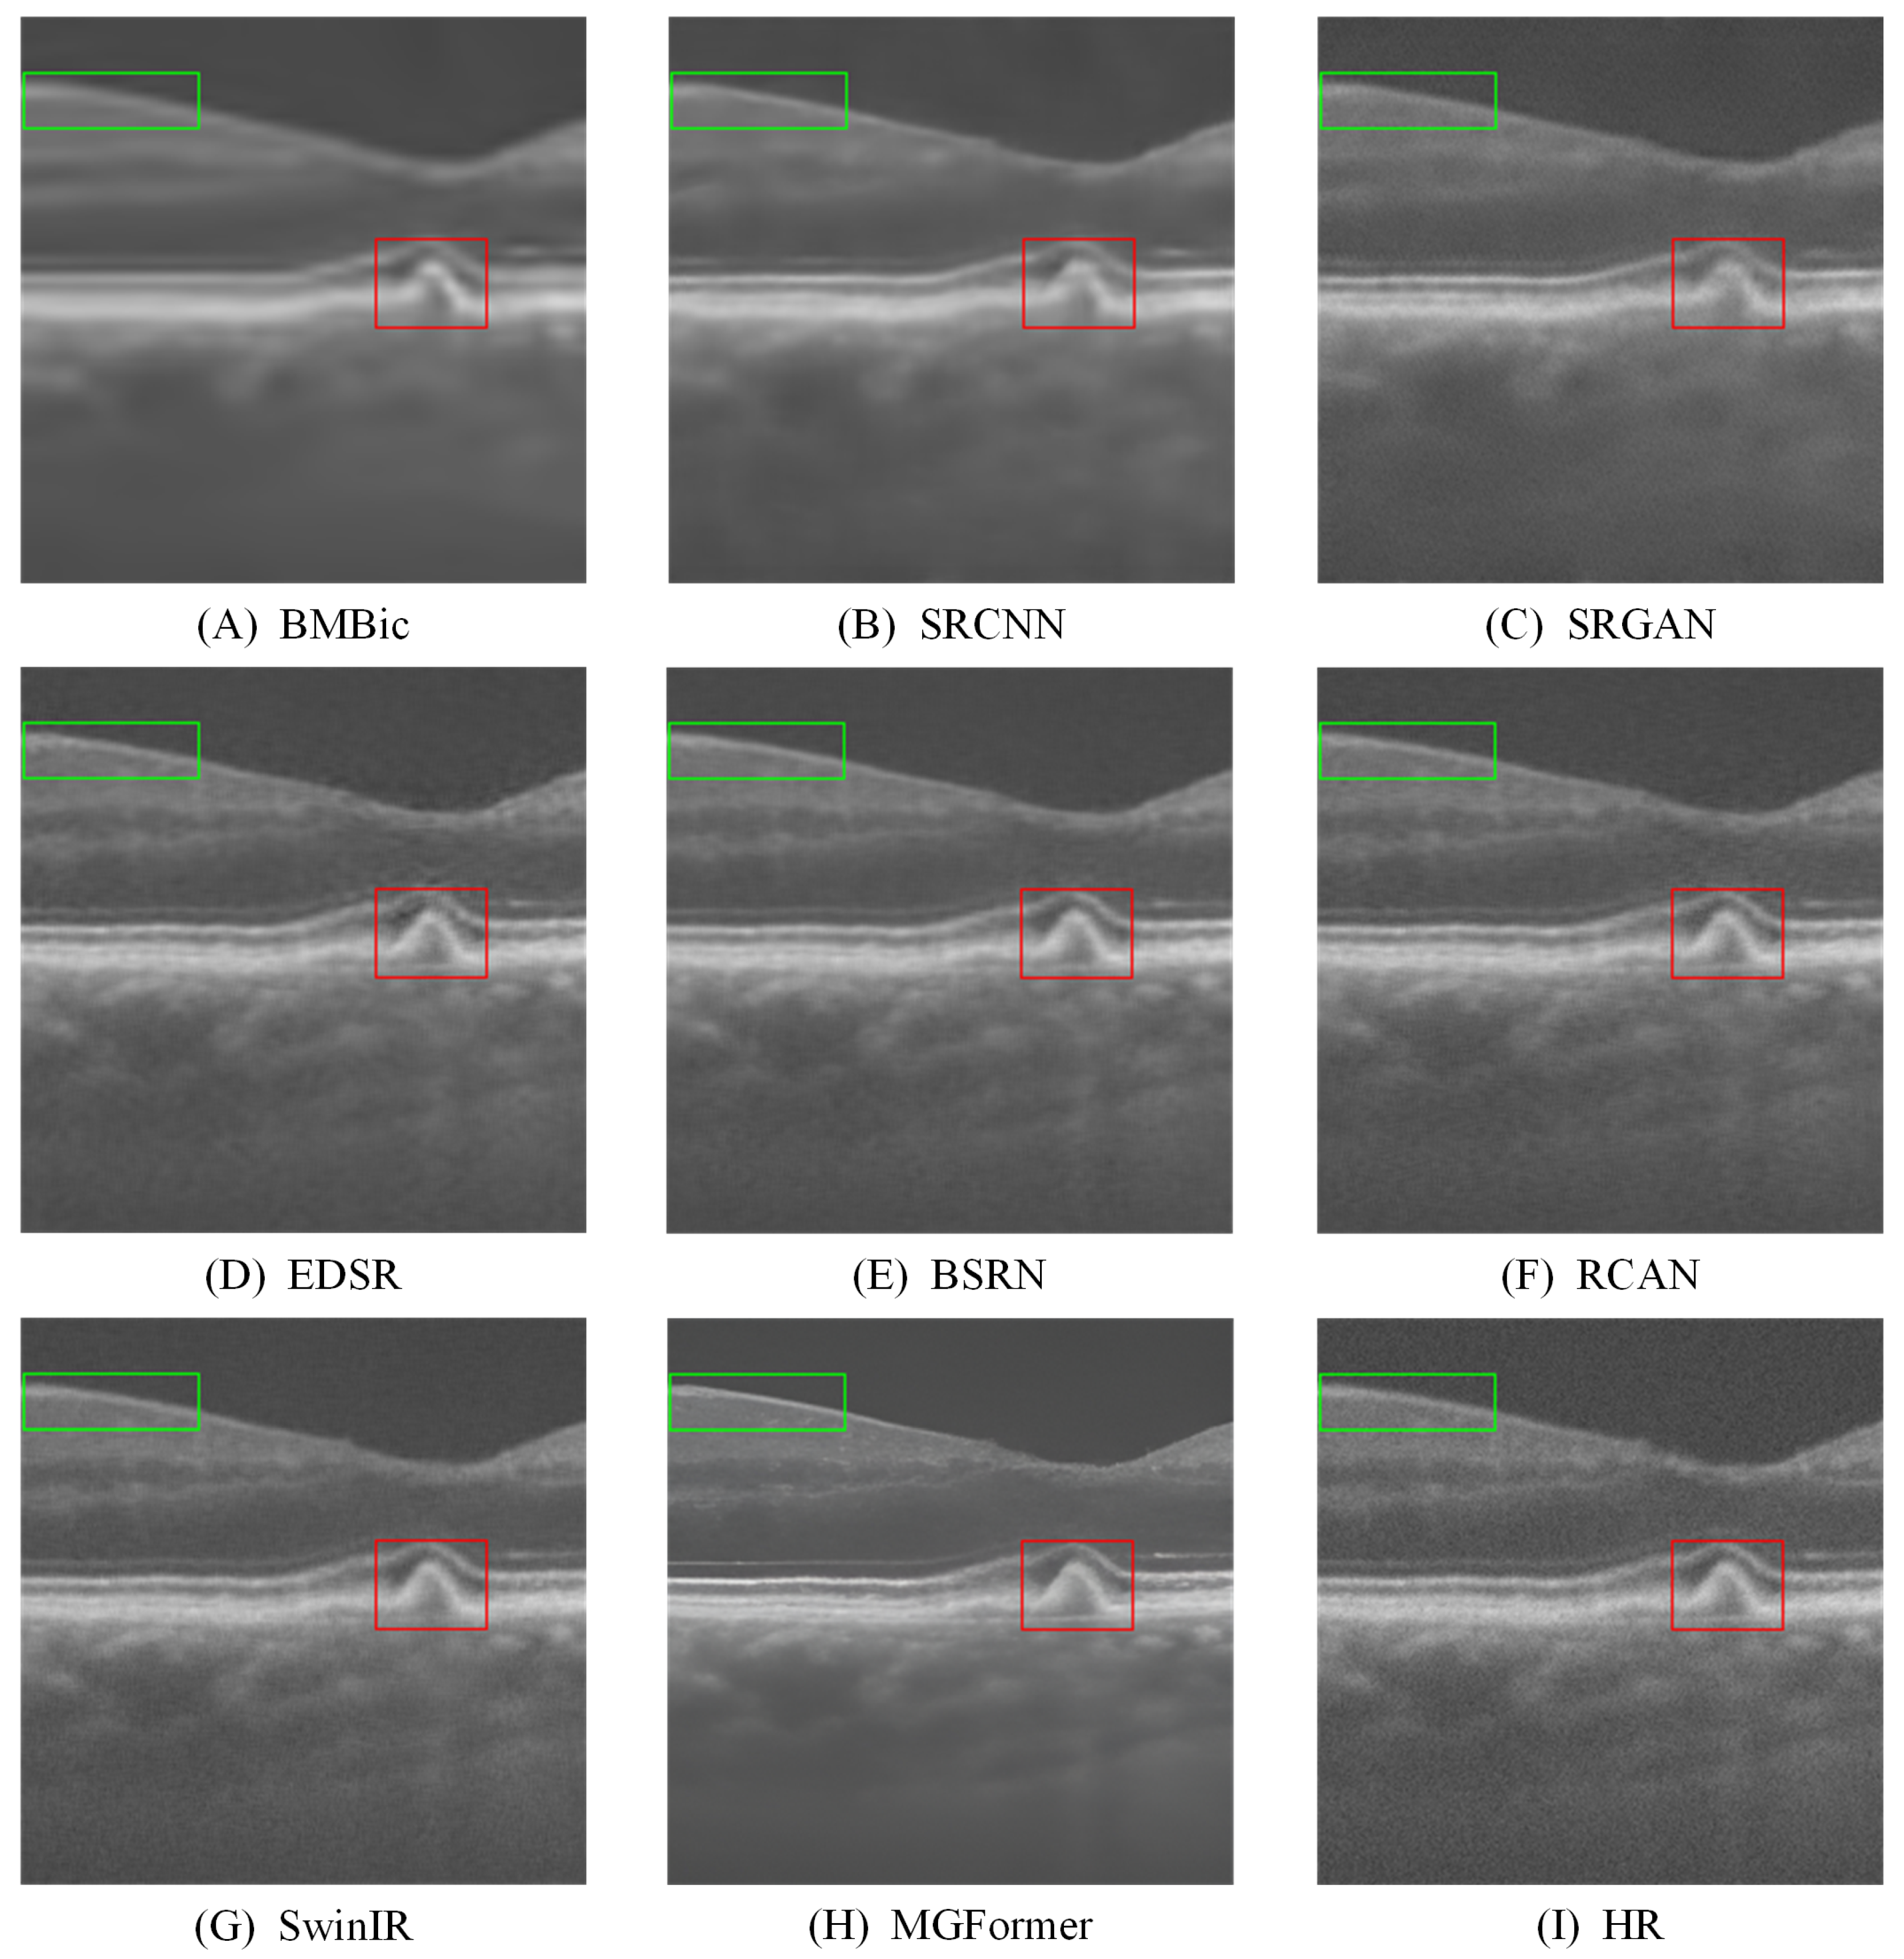
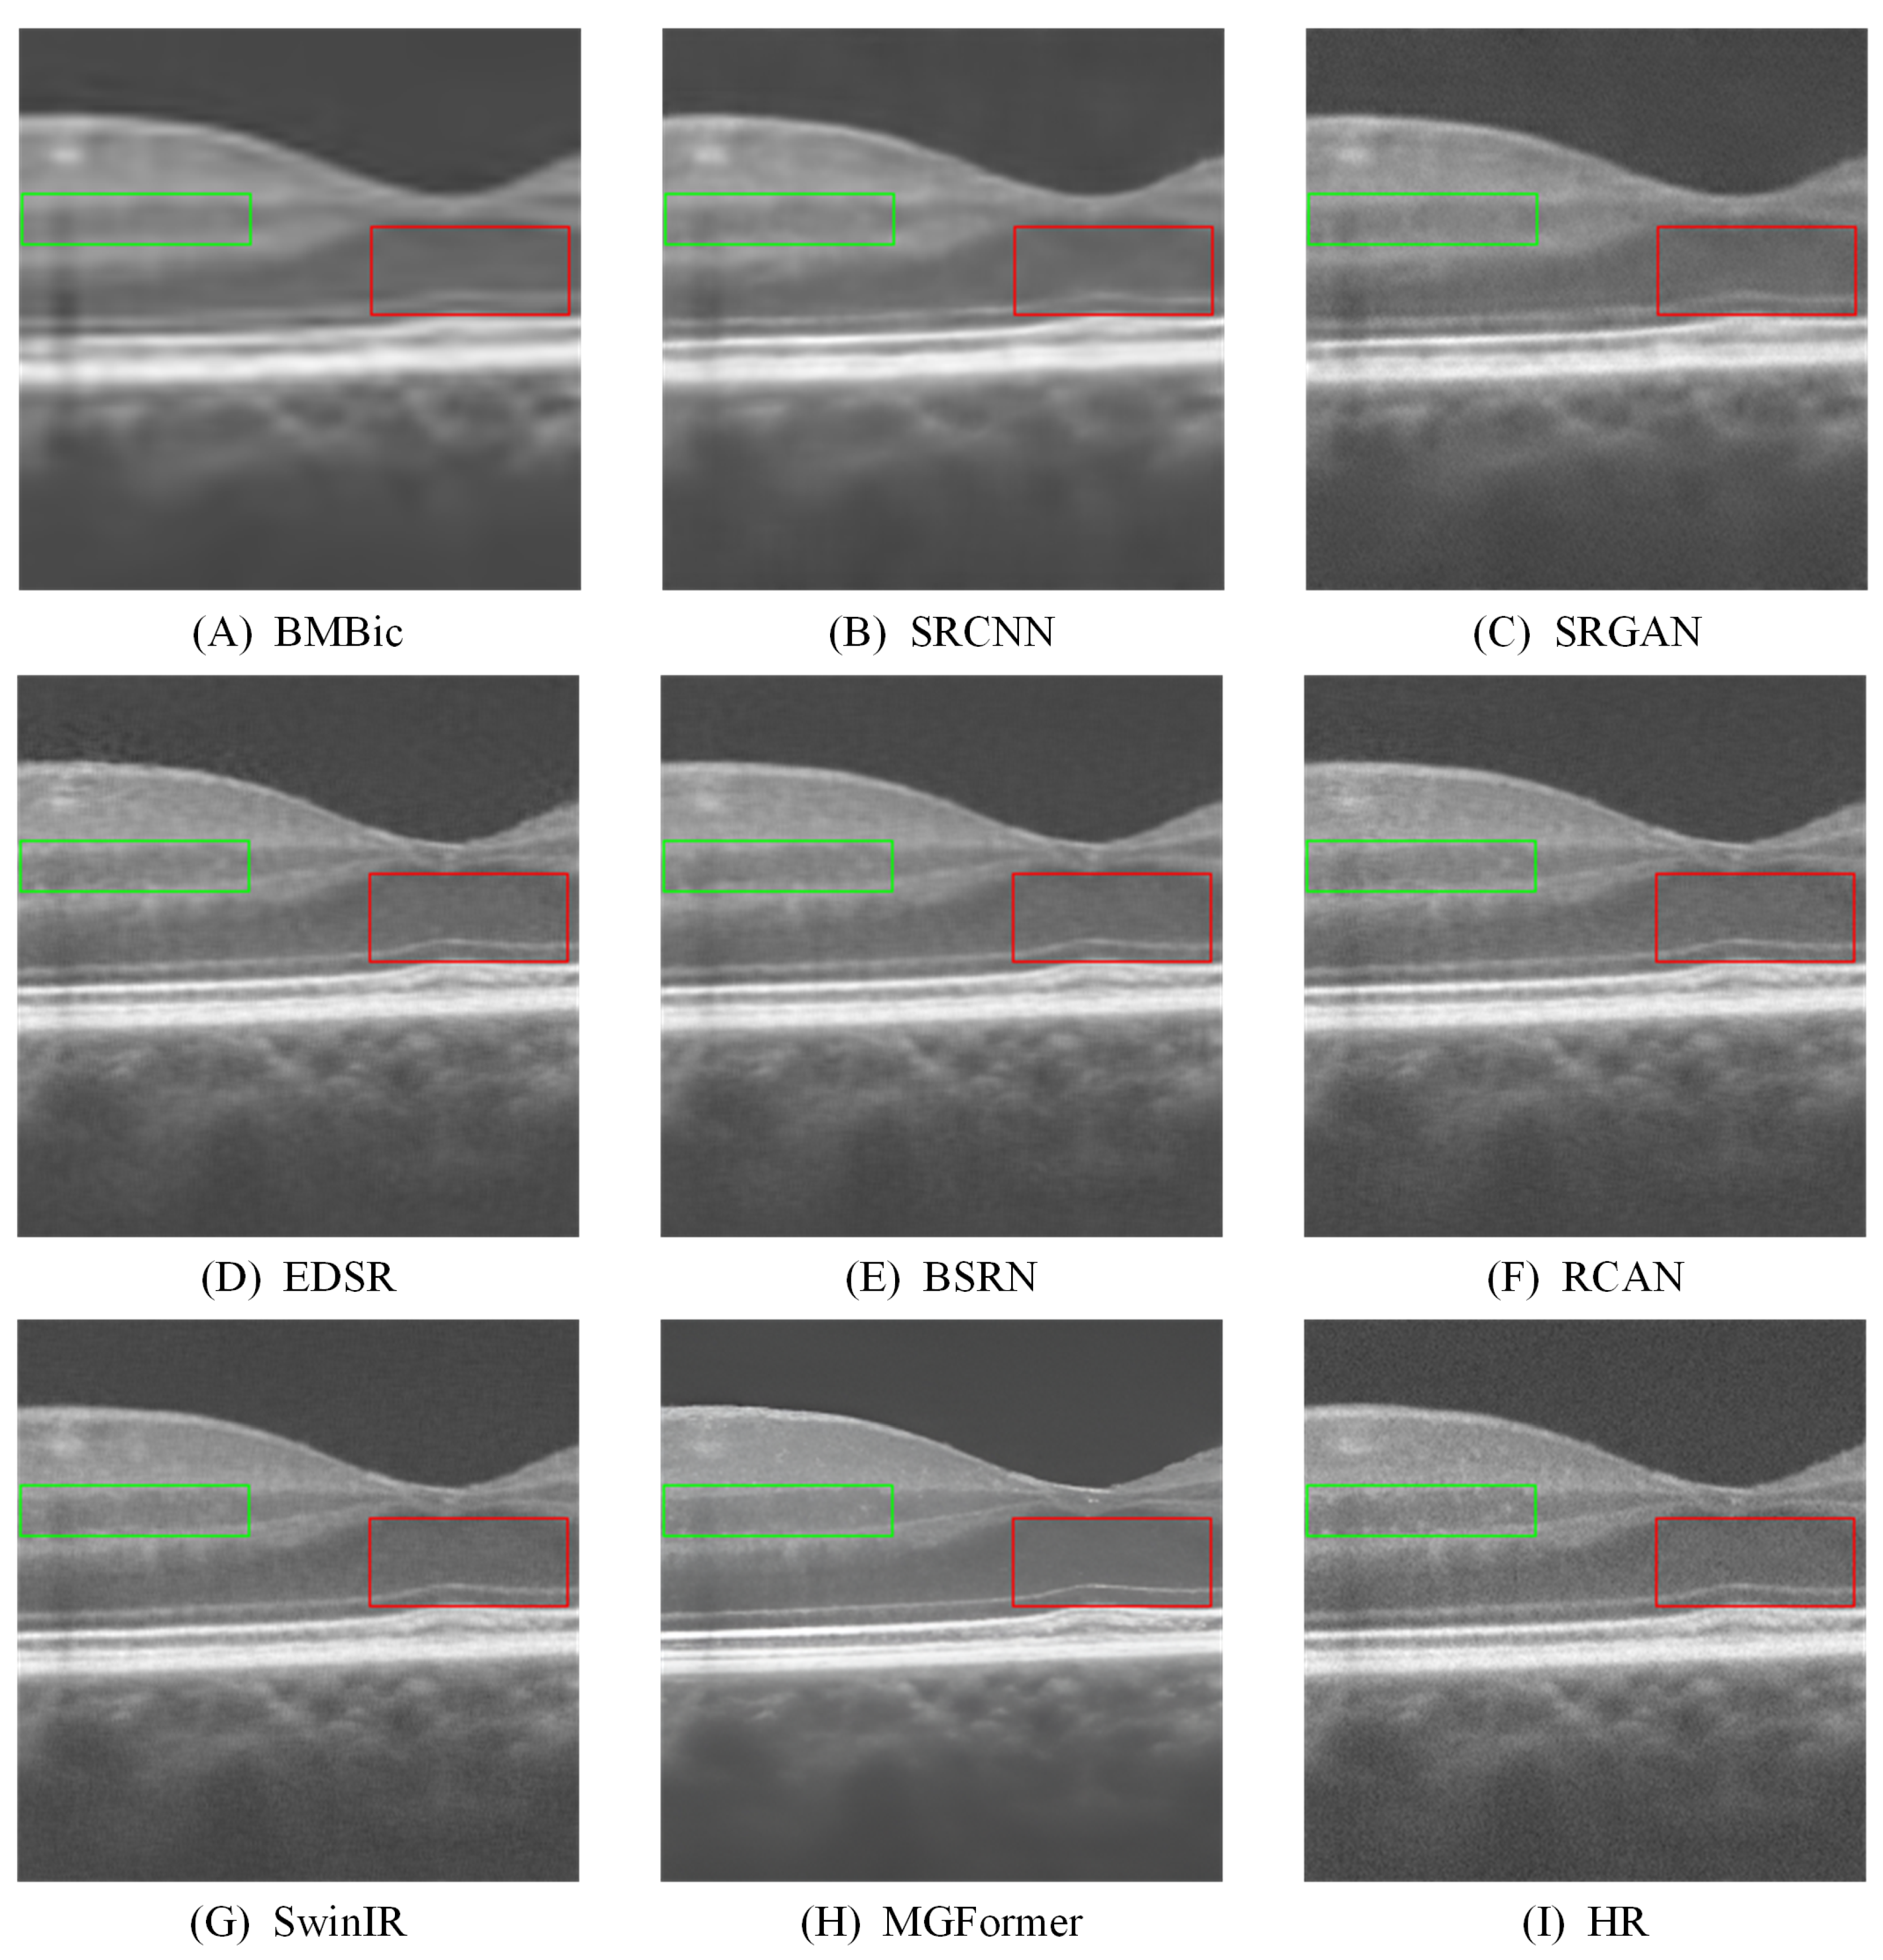
To further assess the quality of reconstructed images, we conducted a visual comparison of 4 × SR results across different retinal regions in the images of the DK-OCT dataset. The proposed MGFormer model was compared against baseline methods, with the reconstructed images presented in Figure 6, Figure 7, Figure 8 and Figure 9. The area within the colored frames in the image represent the region of interest (ROI) for qualitative comparison. The ROI location is identical across all reconstructions and is used for visualization or alignment only; it was not used for model training or for any quantitative analysis. These figures provide an intuitive visual contrast, highlighting differences in reconstruction quality among the models.
Figure 6 displays the 4 × SR reconstruction results for the retinal pigment epithelium (RPE) layer, comparing the proposed MGFormer model with baseline methods. BMBic and SRCNN reconstructions are excessively blurred, failing to recover distinct texture or structural information, resulting in poor reconstruction quality. SRGAN reconstructions exhibit low overall clarity and are significantly affected by noise. EDSR, BSRN, and RCAN produce smooth boundaries at tissue interfaces, lacking sharp edges, and are marred by varying degrees of artifacts that degrade visual quality. SwinIR reconstructions show slightly blurred edges and textures, with minor noise and insufficient detail recovery. In contrast, MGFormer restores richer, more detailed information, achieving clear reconstructions of pathological regions with enhanced texture and edge fidelity, demonstrating superior performance in clinically relevant tasks.
Figure 7 presents the 4 × SR reconstruction results of the retinal foveal region, comparing the proposed MGFormer model with baseline methods. BMBic, SRCNN, and SRGAN reconstructions exhibit excessive smoothing, resulting in significant detail loss. EDSR and BSRN reconstructions show minor distortions in certain regions, accompanied by information loss. RCAN and SwinIR demonstrate limited texture detail recovery, with insufficient richness in information representation. In contrast, MGFormer produces reconstructions with well-defined edges, clear textures, and enhanced details, achieving superior visual quality compared to other models and delivering highly satisfactory results.
Figure 8 presents the 4 × SR reconstruction results for the retinal inner layer, comparing the proposed MGFormer model with baseline methods. BMBic and SRCNN produce overly blurred images, rendering tissue structural features and retinal hierarchical structures nearly indistinguishable. SRGAN reconstructions exhibit significant noise and deviate considerably from real HR images. EDSR and BSRN reconstructions suffer from blurry artifacts and low reconstruction quality, with unclear hierarchical structures. RCAN and SwinIR achieve improved clarity but still exhibit insufficient definition in the inner layer’s hierarchical structure and minor artifacts. In contrast, MGFormer effectively restores the retinal hierarchical information, recovering richer edge details and high-frequency components without noticeable noise, demonstrating superior.
Figure 9 illustrates the 4 × SR reconstruction results for the macular lesion region, comparing the proposed MGFormer model with baseline methods. BMBic reconstructions exhibit low overall clarity and excessive blur, though mid-region textures are slightly clearer than those of SRCNN and SRGAN. SRCNN and SRGAN fail to fully restore detailed information. EDSR reconstructions suffer from severe distortion and blurry artifacts, while BSRN, despite improvements over EDSR, produces insufficiently clear structures with overly smooth boundaries. RCAN reconstructions contain minor noise and artifacts, and SwinIR, while recovering most details, lacks sufficient clarity. In contrast, MGFormer effectively restores detailed information, accurately depicting retinal distortions caused by macular lesions, thereby facilitating clinical diagnosis by enhancing the visibility of pathological features.
To assess the clinical utility of the reconstructed images, a blinded reader study was conducted. Three experienced ophthalmologists (10 ± 2 years of experience in retinal imaging) from the Ophthalmology Department of Qinhuangdao First Hospital independently evaluated 60 reconstructed images per method. Each image was rated on three key 5-point Likert scales—boundary sharpness (BS), pathology discernibility (PD), and diagnostic confidence (DC). The mean scores (±standard deviation, SD) for each reconstruction method reference are presented in Table 2.
The blinded reader study demonstrated that MGFormer attained the highest mean scores on all three perceptual criteria—BS, PD, and DC (4.2 ± 0.3, 4.1 ± 0.3, 4.3 ± 0.2), surpassing SwinIR by 0.3–0.5 points and exceeding SRGAN and BMBic interpolation by approximately 0.8–1.0 points and 1.7–1.9 points, respectively. The corresponding Cohen’s d values for MGFormer versus SwinIR indicated medium-to-large effect sizes (BS = 0.85, PD = 1.33, DC = 1.96), evidencing clinically perceptible improvements beyond statistical significance. Inter-observer reliability among the three retinal specialists was excellent, with ICC (3,1) values of 0.91 (BS; 95%CI: 0.87–0.94), 0.89 (PD; 0.85–0.93), and 0.93 (DC; 0.90–0.94). Bland–Altman analysis showed a mean bias of 0.02 points with 95% limits of agreement of ±0.38 points, confirming tight consistency among graders. Overall, MGFormer provides consistent and significant enhancements in edge sharpness, lesion delineation, and diagnostic confidence over BMBic interpolation, SRGAN, and the window-based Transformer SwinIR, with highly concordant assessments across observers—underscoring its clinical superiority in perceptual image quality.

4.2. Ablation Study

To further evaluate the contributions of key architectural components, we conducted a comprehensive ablation study. As shown in Table 3, the ablation study demonstrates that increasing the number of MGABs (MGABs_Number), Patch_Size (coarse-grained patch was calculated using Formula (6)), or the top-k value (K_Value) generally enhances reconstruction quality for OCT super-resolution, evidenced by improvements in PSNR (higher values), SSIM (higher values), and LPIPS (lower values). Notably, marginal gains diminish progressively with further increases in MGABs_Number or Patch_Size, and excessively high K_Value can occasionally cause minor performance degradation. The optimal configuration (MGABs_Number = 16, Patch_Size = 8, K_Value = 8) achieves a PSNR of 34.3898 dB, SSIM of 0.8399, and LPIPS of 0.1246.
  • Effect of MGABs_Number (Patch_Size = 8, K = 8). MGABs_Number has the strongest overall impact, especially on LPIPS and SSIM. Increasing MGABs from 4→8→16 improves PSNR from 33.4988 to 33.7156 to 34.3898 (+2.66% from 4 to 16). SSIM rises from 0.7828 to 0.7979 to 0.8399 (+7.29%). LPIPS decreases from 0.1441 to 0.1395 to 0.1246 (−13.53%). The largest relative gain is in LPIPS, followed by SSIM, with PSNR improving the least in percentage terms (percentages computed relative to the 4-MGAB setting).
  • Effect of Patch_Size (MGABs = 16, K = 8). The benefit peaks at a moderate window of 8. Increasing Patch from 4→8→→16 yields PSNR 34.0782→34.3898→34.1530 (+0.91% at 8, +0.22% at 16 vs. 4), SSIM 0.8165→0.8399→0.8213 (+2.87%, +0.59%), and LPIPS 0.1327→0.1246→0.1281 (−6.10% at 8, −3.47% at 16). With a shallower network (MGABs = 4), larger patches provide small monotonic gains (PSNR 33.4571→33.5156→33.5483, SSIM 0.7815→0.7835→0.7855) with modest LPIPS reductions. These comparisons indicate that gains peak at Patch_Size = 8 and diminish at 16, suggesting an optimal receptive-field span around 8 (percentages relative to Patch = 4).
  • Effect of K_Value (MGABs = 16, Patch_Size = 8). PSNR increases from 33.9913 (K = 2) to 34.2501 (K = 4) and 34.3898 (K = 8) (+1.17% vs. K = 2), then drops to 34.1452 at K = 16 (−0.71% vs. K = 8). SSIM rises 0.8137→0.8325→0.8399 (+3.22% vs. K = 2) and declines to 0.8207 at K = 16. LPIPS decreases 0.1304→0.1279→0.1246 (−4.45% vs. K = 2) and slightly increases to 0.1248 at K = 16. These results indicate an optimum near K = 8 (percentages relative to K = 2).
Across all three metrics, MGABs_Number is the dominant contributor, with the largest relative effects in LPIPS (−13.53%), SSIM (+7.29%), and PSNR (+2.66%). Patch_Size exerts a moderate influence that peaks at the mid-range window, giving −6.10% in LPIPS and +2.87% in SSIM at Patch_Size = 8, while the PSNR gain is smaller (+0.91%). K_Value has a smaller but non-negligible impact, with an optimum near K = 8 that produces −4.45% in LPIPS and +3.22% in SSIM, together with a +1.17% increase in PSNR.
This paper explores the role of FEConv in SFEM and DFEM, and replaces it with vanilla convolution (VC) for experiments. As evidenced by Table 4, the optimal configuration employs FEConv in both feature extraction modules: FEConv in SFEM combined with FEConv in DFEM achieves peak performance (PSNR: 34.3898 dB, SSIM: 0.8399, and LPIPS: 0.1246). This represents a 0.63% PSNR improvement, 1.73% SSIM gain, and 2.19% reduction in LPIPS compared to the baseline configuration using VC in both SFEM and DFEM. Furthermore, implementing FEConv solely in DFEM outperforms its exclusive implementation in SFEM, confirming the module’s enhanced effectiveness in deeper feature extraction.
As summarized in Table 5, incorporating tensor distillation (TD) substantially reduces computational cost while maintaining a high level of reconstruction fidelity: floating-point operations (FLOPs) decrease from 289 G to 233 G (−56 G; −19.4% relative), while PSNR decreases by approximately 0.42% and SSIM by only 0.33%. In particular, under our measured setting (RTX 4070Ti, PyTorch 2.0.1), TD reduces the per-B-scan inference latency at 4 × scaling for a single B-scan from 166.43 ms (w/o TD) to 98.17 ms (with TD), corresponding to a 41.01% relative reduction. These results confirm that tensor distillation delivers high-quality SR at a markedly lower computational budget.

5. Discussion

Speckle noise remains a significant challenge in OCT imaging, even at reduced spatial sampling rates, and is inevitably amplified during traditional super-resolution reconstruction, as noise, a high-frequency component, is enhanced alongside desired details. Conversely, denoising typically involves smoothing filters that suppress high-frequency noise but blur critical high-frequency details, leading to reduced image clarity. Achieving simultaneous super-resolution and denoising is thus a complex task. The proposed MGFormer model addresses this challenge through its multi-granularity Transformer architecture, enabling high-quality super-resolution reconstruction while effectively suppressing noise. Initially, feature-enhancing convolution captures noise location and contour information, which is further refined by MGABs that extract noise intensity and gradient details. These features are fused with shallow information via long skip connections, allowing targeted noise removal in the reconstruction module. On the representative B-scan, MGFormer attains the most favorable speckle profile when combining vitreous and intra-retinal evidence. In vitreous ROIs, MGFormer yields a markedly higher Equivalent Number of Looks (ENL) than all competitors (96.6 vs. HR 11.5; next-best methods ≈ 20–53), indicating strong speckle stabilization under a shared HR-based intensity scale. Its Speckle Contrast (SC) is within the range of the top baselines (MGFormer 0.651 vs. SRCNN 0.617, BSRN 0.632, HR 0.729). In intra-retinal ROIs, MGFormer remains close to HR on both metrics (SC 0.343 vs. HR 0.343; ENL 8.5 vs. HR 8.6), suggesting speckle reduction without over-smoothing tissue texture.
To further evaluate the contributions of key architectural components, we conducted comprehensive and detailed ablation studies. As shown in Table 3, the ablation study reveals a clear but non-linear relationship between the three core hyperparameters and perceptual quality. Increasing the MGABs_Number consistently(4–>8–>16) strengthens structural fidelity, giving the largest improvements in SSIM and LPIPS, because deeper multi-granularity stacks refine global context and suppress speckle artifacts more effectively. Enlarging the fine Patch_Size contributes most to PSNR by widening the receptive field for retinal-layer alignment, yet its benefit plateaus quickly once inter-layer context is saturated. Raising the K_Value supplies only marginal gains and becomes counter-productive beyond a moderate threshold, where redundant tokens inflate GPU memory demands. Together, these observations suggest that high-quality OCT super-resolution hinges on depth-driven representation, moderate contextual span, and restrained token selection. The configuration (MGABs_Number = 16, Patch_Size = 8, K_Value = 8) strikes the best trade-off, delivering the highest PSNR/SSIM and lowest LPIPS within a single-GPU budget, and is therefore adopted as the default setting in experiments. Table 4 confirms that FEConv is pivotal when placed in both extraction stages. Configurations that include FEConv in the SFEM and the DFEM attain the highest PSNR and SSIM, whereas removing it from either stage degrades performance. In SFEM, FEConv can capture richer, detailed information, facilitating subsequent deep feature extraction and image reconstruction while providing comprehensive gradient information to enhance training stability. In DFEM, inserting FEConv after the MGAB stack aggregates the multi-scale tokens and fuses complementary convolutional and Transformer representations, making fuller use of the features harvested by multiple MGABs. Collectively, these effects demonstrate that FEConv acts as an essential bridge between the convolutional and attention branches, enabling the high-fidelity OCT super-resolution achieved by MGFormer.
An important design consideration for MGFormer was to achieve high-fidelity image reconstruction with reduced computational burden. As summarized in Table 5, MGFormer achieved a favorable balance between model size, inference speed, and reconstruction quality through the synergistic use of multi-granularity attention and tensor distillation. Compared to SwinIR and RCAN, MGFormer is more compact, with an on-disk FP32 checkpoint of 105.68 MB (vs. 113.58 MB for SwinIR and 120.23 MB for RCAN). Together with the FLOPs reduction from 289G to 233G (−19.4%) and the representative 4 × per-B-scan latency of 98.17 ms with TD versus 166.43 ms without TD, these synchronized figures indicate a favorable accuracy-efficiency balance. These results demonstrate that MGFormer achieves significant reductions in computational complexity without sacrificing reconstruction accuracy. This combination of efficiency and fidelity, surpassing many existing SR approaches, makes it suitable for real-time or resource-constrained clinical applications.
Since OCT relies on interferometric imaging of reflected signals, it visualizes dynamic blood flow, whereas static tissue manifests as black regions, which we term non-information areas (NIAs). When we crop the full OCT images during preprocessing, a cropped image may fall entirely within an NIA, producing “NIA Images” devoid of valid retinal vascular content. To mitigate overfitting, given the limited dataset, we retained such images during training as a form of data augmentation. In order to validate the effectiveness of this approach, we conducted secondary training excluding these images and compared the results. As presented in Table 6, incorporating NIA Images led to a slight improvement in PSNR, with negligible impact on SSIM and LPIPS, though the differences between the two approaches are not statistically significant. Retaining these images proves beneficial, as it increases the volume of training data, enhances model generalization, and mitigates overfitting, thereby improving the robustness of the MGFormer model for super-resolution reconstruction.
Despite the demonstrated advantages of MGFormer, several limitations remain that warrant further investigation. First, the current study is primarily based on the Duke University SD-OCT dataset, which may not fully capture the heterogeneity of clinical data encountered in real-world, multi-center settings. To improve generalizability, future work will focus on training and validating the model using larger and more diverse datasets collected across different imaging devices and patient populations. Second, while MGFormer employs two granularity levels (coarse and fine) attention mechanisms to capture multi-scale information, the granularity design remains relatively limited. Expanding the attention framework to include additional intermediate granularity levels may further enhance the model’s capacity to represent hierarchical anatomical structures and contextual dependencies more effectively. Lastly, integrating MGFormer into a multi-task learning framework—where super-resolution is performed jointly with downstream tasks such as segmentation or disease classification—offers a promising direction for future research. Such integration could not only improve reconstruction fidelity but also enhance the model’s clinical utility by enabling end-to-end image understanding and decision support.

6. Conclusions

In order to address the challenges posed by low-resolution OCT volumes acquired in routine clinical practice and the limited ability of conventional SR algorithms to restore fine edge details, we introduced MGFormer, a Transformer-based framework tailored for OCT SR reconstruction. The core of MGFormer is a multi-granularity attention mechanism that hierarchically extracts image features so that both global context and local structural cues are exploited. Another innovation of MGFormer is the tensor-distillation module, which further refines this representation by allocating fine-grained attention to the most informative regions while suppressing less relevant areas. Together, these two components enable finer-grained feature reconstruction than existing Transformer models and, at the same time, reduce computational overhead by selectively concentrating attention, as confirmed by a measurable decrease in FLOPs relative to mainstream Transformer-based SR baselines. Comparative experiments conducted on publicly available OCT datasets demonstrated that MGFormer consistently enhanced image resolution across typical up-scaling factors ( 2 × 8 × ). Among all evaluated SR methods, our model achieved the highest PSNR and SSIM scores and the lowest LPIPS value; subjective assessments further confirmed its crisper edge delineation and more distinct layer separation. Owing to its balanced design of accuracy and efficiency, MGFormer may facilitate downstream scientific analyses and clinical decision-making by providing higher-fidelity retinal information without requiring hardware upgrades. We believe the proposed architecture offers a practical step toward integrating computational SR into everyday OCT workflows and serves as a solid foundation for future research on task-aware, resource-efficient image reconstruction in medical imaging.

Author Contributions

Conceptualization, J.L. (Jingmin Luan); Methodology, J.L. (Jingmin Luan); Software, Z.J.; Validation, Y.L. and D.Y.; Formal analysis, J.L. (Jian Liu); Investigation, Y.Y. and Z.W.; Resources, J.S.; Data curation, Y.S.; Writing—original draft, J.L. (Jingmin Luan) and Z.J.; Project administration, Z.M. All authors have read and agreed to the published version of the manuscript.

Funding

This research was funded by the National Natural Science Foundation of China (No. 62301137) and Industry–Academia–Research Cooperation Project between Hebei-located Universities and Shijiazhuang City (No. 2517903007A).

Institutional Review Board Statement

Not applicable.

Informed Consent Statement

Not applicable.

Data Availability Statement

Not applicable.

Conflicts of Interest

The authors declare that there are no conflicts of interest related to this paper.

References

  1. Qiu, D.; Cheng, Y.; Wang, X. Medical image super-resolution reconstruction algorithms based on deep learning: A survey. Comput. Methods Programs Biomed. 2023, 238, 107590. [Google Scholar] [CrossRef]
  2. Umirzakova, S.; Ahmad, S.; Khan, L.U.; Whangbo, T. Medical image super-resolution for smart healthcare applications: A comprehensive survey. Inf. Fusion 2024, 103, 102075. [Google Scholar] [CrossRef]
  3. Leingang, O.; Riedl, S.; Mai, J.; Reiter, G.S.; Faustmann, G.; Fuchs, P.; Scholl, H.P.N.; Sivaprasad, S.; Rueckert, D.; Lotery, A.; et al. Automated deep learning-based AMD detection and staging in real-world OCT datasets (PINNACLE study report 5). Sci. Rep. 2023, 13, 19545. [Google Scholar] [CrossRef] [PubMed]
  4. Le Blay, H.; Raynaud, E.; Bouayadi, S.; Rieux, E.; Rolland, G.; Saussine, A.; Jachiet, M.; Bouaziz, J.; Lynch, B. Epidermal renewal during the treatment of atopic dermatitis lesions: A study coupling line-field confocal optical coherence tomography with artificial intelligence quantifications. Ski. Res. Technol. 2024, 30, e13891. [Google Scholar] [CrossRef]
  5. Wang, Y.; Yang, X.; Wu, Y.; Li, Y.; Zhou, Y. Optical coherence tomography (OCT)—Versus angiography-guided strategy for percutaneous coronary intervention: A meta-analysis of randomized trials. BMC Cardiovasc. Disord. 2024, 24, 262. [Google Scholar] [CrossRef]
  6. Ge, C.; Yu, X.; Yuan, M.; Fan, Z.; Chen, J.; Shum, P.P.; Liu, L. Self-supervised Self2Self denoising strategy for OCT speckle reduction with a single noisy image. Biomed. Opt. Express 2024, 15, 1233–1252. [Google Scholar] [CrossRef]
  7. Li, S.; Azam, M.A.; Gunalan, A.; Mattos, L.S. One-Step Enhancer: Deblurring and Denoising of OCT Images. Appl. Sci. 2022, 12, 10092. [Google Scholar] [CrossRef]
  8. Zhang, X.; Zhong, H.; Wang, S.; He, B.; Cao, L.; Li, M.; Jiang, M.; Li, Q. Subpixel motion artifacts correction and motion estimation for 3D-OCT. J. Biophotonics 2024, 17, e202400104. [Google Scholar] [CrossRef]
  9. Guo, Z.; Zhao, Z. Hybrid attention structure preserving network for reconstruction of under-sampled OCT images. Sci. Rep. 2025, 15, 7405. [Google Scholar] [CrossRef]
  10. Sampson, D.M.; M.Dubis, A.; K.Chen, F.; J.Zawadzki, R.; D.Sampson, D. Towards standardizing retinal optical coherence tomography angiography: A review. Light (Sci. Appl.) 2022, 11, 520–541. [Google Scholar] [CrossRef]
  11. Liu, X.; Li, X.; Zhang, Y.; Wang, M.; Yao, J.; Tang, J. Boundary-Repairing Dual-Path Network for Retinal Layer Segmentation in OCT Image with Pigment Epithelial Detachment. J. Imaging Inform. Med. 2024, 37, 3101–3130. [Google Scholar] [CrossRef] [PubMed]
  12. Yao, B.; Jin, L.; Hu, J.; Liu, Y.; Yan, Y.; Li, Q.; Lu, Y. PSCAT: A lightweight transformer for simultaneous denoising and super-resolution of OCT images. Biomed. Opt. Express 2024, 15, 2958–2976. [Google Scholar] [CrossRef]
  13. Dong, C.; Loy, C.C.; He, K.; Tang, X. Image Super-Resolution Using Deep Convolutional Networks. IEEE Trans. Pattern Anal. Mach. Intell. 2016, 38, 295–307. [Google Scholar] [CrossRef]
  14. Lim, B.; Son, S.; Kim, H.; Nah, S.; Mu Lee, K. Enhanced Deep Residual Networks for Single Image Super-Resolution. In Proceedings of the IEEE Conference on Computer Vision and Pattern Recognition (CVPR) Workshops, Honolulu, HI, USA, 21–26 July 2017; pp. 1132–1140. [Google Scholar] [CrossRef]
  15. Zhang, Y.; Li, K.; Li, K.; Wang, L.; Zhong, B.; Fu, Y. Image super-resolution using very deep residual channel attention networks. In Proceedings of the European Conference on Computer Vision (ECCV), Munich, Germany, 8–14 September 2018; pp. 286–301. [Google Scholar]
  16. Mauricio, J.; Domingues, I.; Bernardino, J. Comparing Vision Transformers and Convolutional Neural Networks for Image Classification: A Literature Review. Appl. Sci. 2023, 13, 5521. [Google Scholar] [CrossRef]
  17. Rangel, G.; CuevasTello, J.C.; NunezVarela, J.; Puente, C.; SilvaTrujillo, A.G. A Survey on Convolutional Neural Networks and Their Performance Limitations in Image Recognition Tasks. J. Sens. 2024, 2024, 2797320. [Google Scholar] [CrossRef]
  18. Hassanin, M.; Anwar, S.; Radwan, I.; Khan, F.S.; Mian, A. Visual attention methods in deep learning: An in-depth survey. Inf. Fusion 2024, 108, 102417. [Google Scholar] [CrossRef]
  19. Ledig, C.; Theis, L.; Huszár, F.; Caballero, J.; Cunningham, A.; Acosta, A.; Aitken, A.; Tejani, A.; Totz, J.; Wang, Z.; et al. Photo-Realistic Single Image Super-Resolution Using a Generative Adversarial Network. In Proceedings of the IEEE Conference on Computer Vision and Pattern Recognition (CVPR), Honolulu, HI, USA, 21–26 July 2017; pp. 105–114. [Google Scholar] [CrossRef]
  20. Huang, Y.; Lu, Z.; Shao, Z.; Ran, M.; Zhou, J.; Fang, L.; Zhang, Y. Simultaneous denoising and super-resolution of optical coherence tomography images based on a generative adversarial network. Opt. Express 2019, 27, 12289–12307. [Google Scholar] [CrossRef] [PubMed]
  21. Qiu, B.; You, Y.; Huang, Z.; Meng, X.; Jiang, Z.; Zhou, C.; Liu, G.; Yang, K.; Ren, Q.; Lu, Y. N2NSR-OCT: Simultaneous denoising and super-resolution in optical coherence tomography images using semisupervised deep learning. J. Biophotonics 2021, 14, e202000282. [Google Scholar] [CrossRef]
  22. Das, V.; Dandapat, S.; Bora, P.K. Unsupervised Super-Resolution of OCT Images Using Generative Adversarial Network for Improved Age-Related Macular Degeneration Diagnosis. IEEE Sens. J. 2020, 20, 8746–8756. [Google Scholar] [CrossRef]
  23. Chen, H.; Wang, Y.; Guo, T.; Xu, C.; Deng, Y.; Liu, Z.; Ma, S.; Xu, C.; Xu, C.; Gao, W. Pre-trained image processing transformer. In Proceedings of the IEEE/CVF Conference on Computer Vision and Pattern Recognition (CVPR), Nashville, TN, USA, 19–25 June 2021; pp. 12294–12305. [Google Scholar] [CrossRef]
  24. Dosovitskiy, A.; Beyer, L.; Kolesnikov, A.; Weissenborn, D.; Zhai, X.; Unterthiner, T.; Dehghani, M.; Minderer, M.; Heigold, G.; Gelly, S.; et al. An image is worth 16 × 16 words: Transformers for image recognition at scale. arXiv 2021, arXiv:2010.11929. [Google Scholar] [CrossRef]
  25. Chen, J.; Lu, Y.; Yu, Q.; Luo, X.; Adeli, E.; Wang, Y.; Lu, L.; Yuille, A.L.; Zhou, Y. TransUNet: Transformers make strong encoders for medical image segmentation. arXiv 2021, arXiv:2102.04306. [Google Scholar] [CrossRef]
  26. Huang, W.; Huang, D. Local feature enhancement transformer for image super-resolution. Sci. Rep. 2025, 15, 20792. [Google Scholar] [CrossRef]
  27. Wang, J.; Hao, Y.; Bai, H.; Yan, L. Parallel attention recursive generalization transformer for image super-resolution. Sci. Rep. 2025, 15, 8669. [Google Scholar] [CrossRef]
  28. Shi, W.; Caballero, J.; Huszár, F.; Totz, J.; Aitken, A.P.; Bishop, R.; Rueckert, D.; Wang, Z. Real-Time Single Image and Video Super-Resolution Using an Efficient Sub-Pixel Convolutional Neural Network. In Proceedings of the IEEE Conference on Computer Vision and Pattern Recognition (CVPR), Las Vegas, NV, USA, 27–30 June 2016; pp. 1874–1883. [Google Scholar] [CrossRef]
  29. Chen, Z.; He, Z.; Lu, Z. DEA-Net: Single Image Dehazing Based on Detail-Enhanced Convolution and Content-Guided Attention. IEEE Trans. Image Process. 2024, 33, 1002–1015. [Google Scholar] [CrossRef]
  30. Yu, Z.; Zhao, C.; Wang, Z.; Qin, Y.; Su, Z.; Li, X.; Zhou, F.; Zhao, G. Searching central difference convolutional networks for face anti-spoofing. In Proceedings of the IEEE/CVF Conference on Computer Vision and Pattern Recognition (CVPR), Seattle, WA, USA, 13–19 June 2020; pp. 5295–5305. [Google Scholar] [CrossRef]
  31. Su, Z.; Liu, W.; Yu, Z.; Hu, D.; Liao, Q.; Tian, Q.; Pietikäinen, M.; Liu, L. Pixel Difference Networks for Efficient Edge Detection. In Proceedings of the IEEE/CVF International Conference on Computer Vision (ICCV), Montreal, BC, Canada, 11–17 October 2021; pp. 5117–5127. [Google Scholar] [CrossRef]
  32. Ren, S.; Zhou, D.; He, S.; Feng, J.; Wang, X. Shunted Self-Attention via Multi-Scale Token Aggregation. In Proceedings of the IEEE/CVF Conference on Computer Vision and Pattern Recognition (CVPR), New Orleans, LA, USA, 18–24 June 2022; pp. 10843–10852. [Google Scholar] [CrossRef]
  33. Vaswani, A.; Shazeer, N.; Parmar, N.; Uszkoreit, J.; Jones, L.; Gomez, A.N.; Kaiser, L.; Polosukhin, I. Attention Is All You Need. arXiv 2017, arXiv:1706.03762. [Google Scholar] [CrossRef]
  34. Johnson, J.; Alahi, A.; Fei-Fei, L. Perceptual losses for real-time style transfer and super-resolution. In European Conference on Computer Vision; Springer International Publishing: Cham, Switzerland, 8–16 October 2016; pp. 694–711. [Google Scholar] [CrossRef]
  35. Terven, J.; CordovaEsparza, D.; RomeroGonzalez, J.; RamirezPedraza, A.; ChavezUrbiola, E.A. A comprehensive survey of loss functions and metrics in deep learning. Artif. Intell. Rev. 2025, 58, 195. [Google Scholar] [CrossRef]
  36. Zhu, Y.; Zhang, X.; Yuan, K. Medical image super-resolution using a generative adversarial network. arXiv 2019, arXiv:1902.00369. [Google Scholar] [CrossRef]
  37. Fang, L.; Li, S.; McNabb, R.P.; Nie, Q.; Kuo, A.N.; Toth, C.A.; Izatt, J.A.; Farsiu, S. Fast Acquisition and Reconstruction of Optical Coherence Tomography Images via Sparse Representation. IEEE Trans. Med. Imaging 2013, 32, 2034–2049. [Google Scholar] [CrossRef]
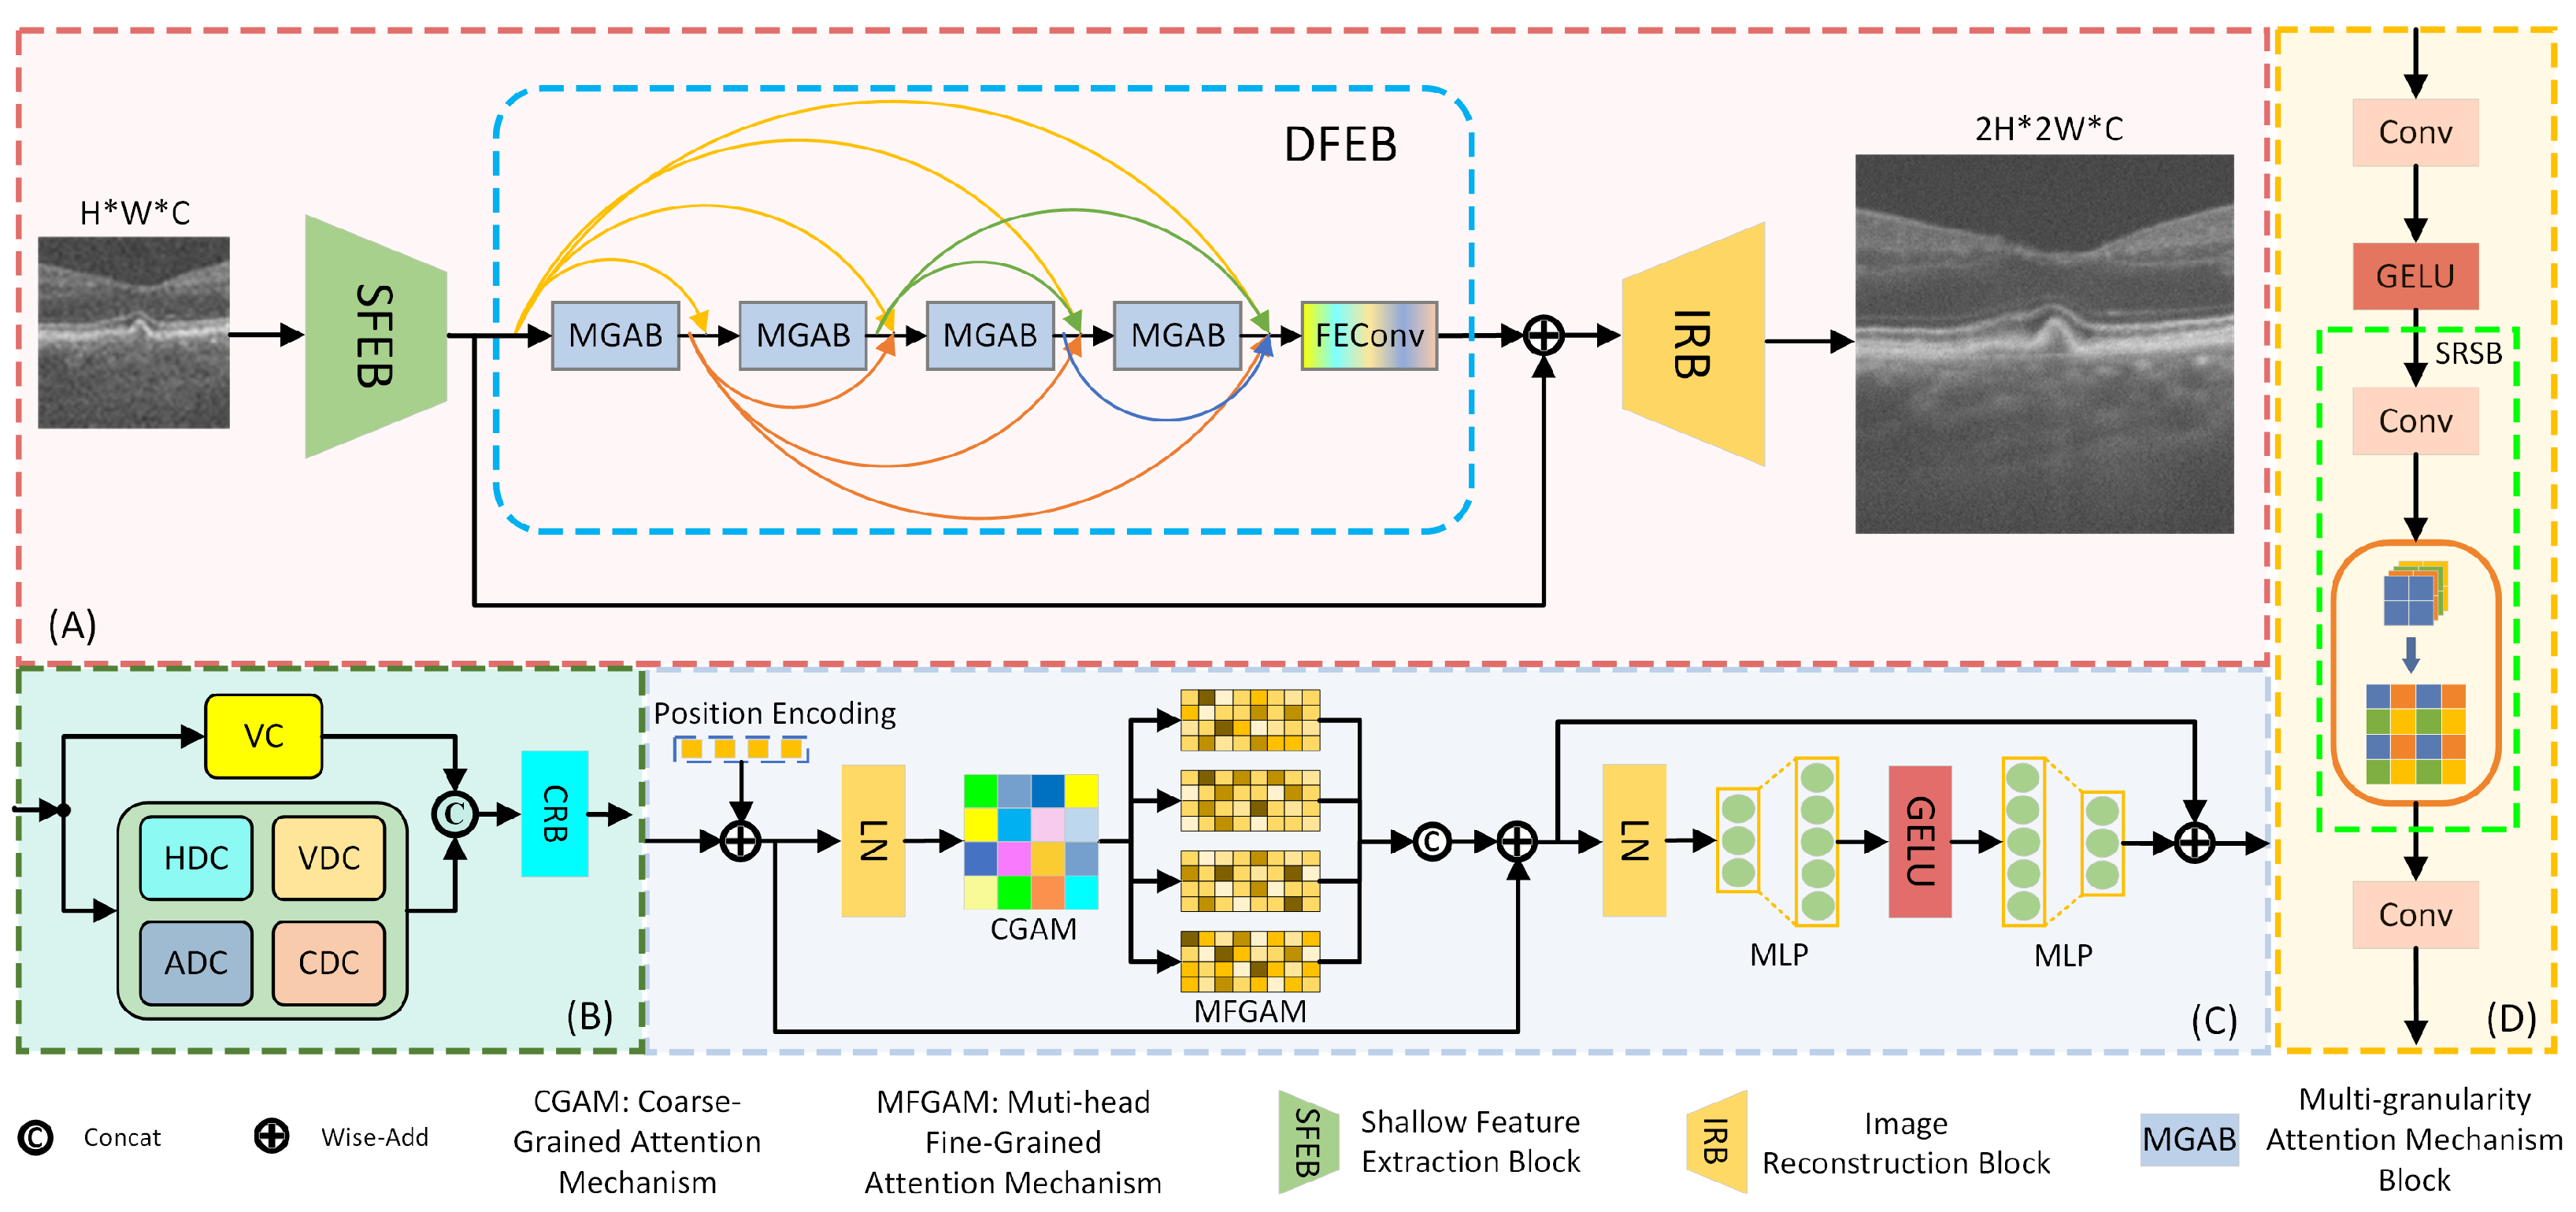
Figure 1. Architecture of the proposed MGFormer for OCT image super-resolution. (A) Backbone of the proposed MGFormer, (B) detailed structure of SFEM, (C) detailed structure of MGAB, (D) detailed structure of IRM.
Photonics 12 00850 g001
Figure 2. Flowchart of the multi-granularity attention mechanism.
Photonics 12 00850 g002
Figure 3. Comparison of validation loss across super-resolution methods using 5-fold cross-validation (mean ± standard deviation).
Photonics 12 00850 g003
Figure 4. Quantitative comparison of PSNR (A) and SSIM (B) on validation set.
Photonics 12 00850 g004
Figure 5. Statistical comparison of PSNR distributions via boxplots with significance annotations for 2 × , 4 × , and 8 × . (A) BMBic, (B) SRCNN, (C) SRGAN, (D) EDSR, (E) BSRN, (F) RCAN, (G) SwinIR, (H) MGFormer (*: p < 0.05, **: p < 0.01, ***: p < 0.001; ns: not significant).
Photonics 12 00850 g005
Figure 6. Visual comparison of 4 × SR results in the retinal pigment epithelium (RPE) layer.
Photonics 12 00850 g006
Figure 7. Visual comparison of 4 × SR results in the retinal foveal region.
Photonics 12 00850 g007
Figure 8. Visual comparison of 4 × SR results in the retinal inner layer. (A) Original Image of the retinal inner layer, (B1) LR, (B2) BMBic, (B3) SRCNN, (B4) SRGAN, (B5) EDSR, (B6) BSRN, (B7) RCAN, (B8) SwinIR, (B9) MGFormer, (B10) HR.
Photonics 12 00850 g008
Figure 9. Visual comparison of 4 × SR results in macular lesion regions. (A) Original Image of macular lesion, (B1) LR, (B2) BMBic, (B3) SRCNN, (B4) SRGAN, (B5) EDSR, (B6) BSRN, (B7) RCAN, (B8) SwinIR, (B9) MGFormer, (B10) HR.
Photonics 12 00850 g009
Table 1. Quantitative evaluation of MGFormer against state-of-the-art methods across scaling factors.
MethodScalePSNR(dB) ↑SSIM ↑LPIPS ↓ (Mean)Paired-t (PSNR)p-Value (vs. Ours)
Bicubic30.9125 ± 0.110.7182 ± 0.00320.3430142.040.001 ***
SRCNN31.2335 ± 0.130.7295 ± 0.00280.3428132.300.001 ***
SRGAN34.5648 ± 0.250.8098 ± 0.00950.267673.320.001 ***
EDSR34.7313 ± 0.140.8138 ± 0.00230.263995.930.001 ***
BSRN37.1367 ± 0.430.9056 ± 0.01370.209536.730.001 ***
RCAN43.5013 ± 0.220.9709 ± 0.00150.066110.450.001 ***
SwinIR44.2302 ± 0.210.9765 ± 0.00180.08374.970.008 **
Ours44.8601 ± 0.190.9813 ± 0.00140.0652//
Bicubic30.3403 ± 0.160.7054 ± 0.00530.421130.510.001 ***
SRCNN30.8068 ± 0.210.7166 ± 0.00490.385724.540.001 ***
SRGAN32.3078 ± 0.360.7469 ± 0.01320.274610.620.001 ***
EDSR32.9225 ± 0.230.7602 ± 0.00380.22889.650.001 ***
BSRN33.4146 ± 0.570.7769 ± 0.01840.19263.500.025 *
RCAN33.7580 ± 0.280.8131 ± 0.00280.16753.760.020 *
SwinIR33.8748 ± 0.260.8135 ± 0.00370.15853.190.033 *
Ours34.3898 ± 0.250.8399 ± 0.00230.1246//
Bicubic28.9156 ± 0.190.6657 ± 0.00760.458323.430.001 ***
SRCNN29.7402 ± 0.230.6884 ± 0.00910.391617.290.001 ***
SRGAN31.3958 ± 0.470.7285 ± 0.01850.27485.280.006 **
EDSR31.7366 ± 0.260.7318 ± 0.00720.25025.460.005 **
BSRN32.0317 ± 0.580.7315 ± 0.02330.22912.360.078
RCAN32.4033 ± 0.340.7378 ± 0.00530.20332.990.030 *
SwinIR32.5387 ± 0.280.7454 ± 0.00640.19311.700.163
Ours32.7257 ± 0.310.7482 ± 0.00380.1875//
Paired t-test with Bonferroni correction for multiple comparisons. Bold values denote the best results. ↑ indicates that the larger the value, the better. ↓ indicates that the smaller the value, the better. *: p < 0.05, **: p < 0.01, ***: p < 0.001; ns: not significant.
Table 2. Clinical evaluation scores (mean ± standard deviation) for reconstructed retinal images.
ModelBS (Mean ± SD)PD (Mean ± SD)DC (Mean ± SD)
BMBic2.5 ± 0.32.3 ± 0.32.4 ± 0.2
SRGAN3.4 ± 0.53.2 ± 0.63.3 ± 0.5
SwinIR3.9 ± 0.43.7 ± 0.33.8 ± 0.3
MGFormer4.2 ± 0.34.1 ± 0.34.3 ± 0.2
Table 3. Ablation study on hyperparameters for 4× SR.
MGABs_NumberPatch_SizeK_ValuePSNR (dB) ↑SSIM ↑LPIPS ↓
44233.32470.77610.1487
433.41520.77940.1459
833.45710.78150.1446
16///
8233.35620.77790.1477
433.44890.78080.1452
833.49880.78280.1441
1633.51560.78350.1436
16833.43220.78020.1465
1633.46460.78180.1443
3233.51920.78460.1438
6433.54830.78550.1427
84233.43710.78360.1448
433.66530.79570.1432
833.72430.79720.1426
16///
8233.64470.79600.1412
433.69160.79680.1407
833.71560.79790.1395
1633.74160.79950.1386
16833.70250.79830.1406
1633.73750.79920.1387
3233.78310.80060.1362
64
164233.90880.81120.1368
434.01890.81460.1345
834.07820.81650.1327
16///
8233.99130.81370.1304
434.25010.83250.1279
834.38980.83990.1246
1634.14520.82070.1248
16834.1530.82130.1281
16
32
64
“/” = Not applicable; “–” = GPU hardware limitations prevented computation. Bold values denote the best results.
Table 4. Ablation of FEConv versus VC in SFEM and DFEM.
Convolution MethodPSNR (dB) ↑SSIM ↑LPIPS ↓
VC (in SFEM) + VC (in DFEM)34.17340.82560.1274
VC (in SFEM) + FEConv (in DFEM)34.31780.83640.1253
FEConv (in SFEM) + VC (in DFEM)34.27700.83360.1268
FEConv (in SFEM) + FEConv (in DFEM)34.38980.83990.1246
Table 5. Computational efficiency analysis of TD with minimal performance.
ModelFLOPsInference Time (ms) ↓PSNR (dB) ↑SSIM ↑LPIPS ↓
TD233 G98.1734.38980.83990.1246
w/o TD289 G166.4334.53420.84270.1241
For w/o TD, the model maintains identical MGAB layers and FEConv modules, replacing tensor distillation with self-attention.
Table 6. Effect of retaining NIA during training on reconstruction metrics.
ApproachPSNR (dB) ↑SSIM ↑LPIPS ↓
NIA34.38980.83990.1244
w/o NIA34.37710.84060.1246
Disclaimer/Publisher’s Note: The statements, opinions and data contained in all publications are solely those of the individual author(s) and contributor(s) and not of MDPI and/or the editor(s). MDPI and/or the editor(s) disclaim responsibility for any injury to people or property resulting from any ideas, methods, instructions or products referred to in the content.