Article

Contrast-Enhancing Spatial–Frequency Deconvolution-Aided Interferometric Scattering Microscopy (iSCAT)

1
School of Mechatronics Engineering, Harbin Institute of Technology, Harbin 150000, China
2
School of Microelectronics, Southern University of Science and Technology, Shenzhen 518055, China
3
School of Biomedical Engineering, Shenzhen Campus of Sun Yat-Sen University, Sun Yat-Sen University, Shenzhen 518107, China
*
Author to whom correspondence should be addressed.
Photonics 2025, 12(8), 795; https://doi.org/10.3390/photonics12080795
Submission received: 17 June 2025 / Revised: 23 July 2025 / Accepted: 6 August 2025 / Published: 7 August 2025
(This article belongs to the Special Issue Research, Development and Application of Raman Scattering Technology)

Abstract

Interferometric scattering microscopy (iSCAT) is widely used for label-free tracking of nanoparticles and single molecules. However, its ability to identify small molecules is limited by low imaging contrast blurred with noise. Frame-averaging methods are widely used for reducing background noise but require hundreds of frames to produce a single frame as a trade-off. To address this, we applied a spatial–frequency domain deconvolution algorithm to suppress background noise and amplify the signal for each frame, achieving an improvement of ∼ 3-fold without hardware modification. This enhancement is achieved by compensating for missing information within the optical transfer function (OTF) boundary, while high-frequency components (noise) beyond this boundary are filtered. The resulting deconvolution process provides linear signal amplification, making it ideal for quantitative analysis in mass photometry. Additionally, the localization error is reduced by 20%. Comparisons with traditional denoising algorithms revealed that these methods often extract the side lobes. In contrast, our deconvolution approach preserves signal integrity while enhancing sensitivity. This work highlights the potential of image processing techniques to significantly improve the detection sensitivity of iSCAT for small molecule analysis.

1. Introduction

Interferometric scattering microscopy (iSCAT) has emerged as a powerful tool for visualizing nanoscale objects, offering distinct advantages over fluorescence-based techniques. By leveraging the scattering of light from nanoparticles or single molecules, iSCAT achieves enhanced contrast without the limitations of fluorescence saturation [1], photo-bleaching [2] or photo-blinking [3], which hinder long-term, reliable tracking of the samples [4,5,6]. Previous publication has demonstrated the feasibility of tracking 5 nm gold nanoparticles (GNPs) with iSCAT [7], enabling the identification of molecular attachments such as lipids [8,9,10] and proteins [11,12,13]. Subsequent advancements extended label-free tracking to single proteins through innovations in contrast enhancement. Central to these improvements is extending the shot-noise limit [14], a critical bottleneck in iSCAT systems. In the early stage of iSCAT, non-polarizing beam splitters were widely used [15]. In the later iterations of iSCAT setups, polarizing beam splitters and wave plates were employed to suppress reference light intensity [16,17,18], effectively minimizing background noise while preserving scattered light signals. For instance, spatial filtering of transmitted or reflected components reduced reference light dominance, enhancing extinction contrast for scatterers near interfaces [19,20,21]. Similarly, dark-field configurations, which block reflected light using a sub-aperture mask in the objective’s back focal plane, localized GNPs at an exposure time of 6 μs [22].
Despite these advancements, the intrinsic trade-off between reference light suppression and scattering signal reduction remains a challenge. While reducing reference light intensity mitigates background noise, it simultaneously weakens the scattered light from the target, compromising the dynamic range of detectable signals [19]. To address this, computational approaches have been developed to extract weak scattering signals from noisy backgrounds. For example, frame averaging [23], differential rolling averages [24] and ratio metric [25] algorithms are designed to stabilize noise by averaging multiple scans of the same imaging region at the expense of temporal resolution. The iterative noise estimation method further refined this process but often requires extensive computational resources [26]. More recently, self-supervised machine learning has been applied to particle identification, offering high sensitivity, though at the cost of interpretability [27]. These solutions either rely on frame-consuming averaging or prior labeled training.
A transformative approach to overcoming these barriers lies in deconvolution algorithms, which reverse the blurring effects of the imaging system. Deconvolution is particularly effective in iSCAT, which enhances SNR and contrast by reconstructing sharp images from noisy data. The Richardson–Lucy (RL) deconvolution framework, for instance, has been validated in diverse imaging modalities, from underwater acoustic imaging [28] to high-resolution X-ray tomography [29], demonstrating its versatility in extracting fine structural details. Deconvolutions have not yet been introduced in iSCAT; we demonstrated that a spatial–frequency domain deconvolution (SF) not only improves contrast but also sharpens particle localization, making it ideal for quantitative mass photometric analysis. By reducing nanoparticle localization errors through SNR enhancement, deconvolution enables more precise tracking and dynamic analysis. Comparative studies of deconvolution and denoising algorithms reveal that SF outperforms conventional methods in preserving spatial resolution, underscoring its potential to advance iSCAT’s capabilities in single-molecule and nanoscale imaging. Collectively, with these optical and computational innovations, the inherent challenges of low-light imaging with iSCAT can be efficiently mitigated, paving the way for molecular dynamics and biophysical processes tracking with deep insights.

2. Materials and Methods

2.1. Samples

GNP samples with a diameter of 40 nm were dropped on the cover glass and sealed with mounting medium. The streptavidin functionalized GNP (10 nm) sample was fixed to the cover glass. The cover glasses (CG15KH1, Thorlabs, Shanghai, China) were washed in isopropanol and clean water in 3 alternating circles before natural drying. The samples were diluted with clean water. Biotin-PEG-silane solution (20 nM) was applied to the cover glasses, which was then incubated for one hour to prepare for streptavidin functionalized GNP. The concentration of the GNPs was about 100 nM.

2.2. Setup

The setup referred to the design from Kashkanova et al. [18]. The widefield interferometric microscopy consisted of a single mode fiber-coupled laser, polarization modulation components, lens and nano-stages. The laser was purchased from Lasertack (LDM-520-1500-C, Lasertack, Bergshausen, Germany). Polarization modulation components included a λ /4 wave plate (QWP25-532A-M, Shenzhen LUBON Technology Co., Ltd., Shenzhen, China), a λ /2 wave plate (HWP25-532A-M, Shenzhen LUBON Technology Co., Ltd.) and polarizing beam splitters (PBS641, Shenzhen LUBON Technology Co., Ltd.). The laser was collimated and focused to the objective’s back focal plane with a collimator (FC520-6.1-APC, Shenzhen LUBON Technology Co., Ltd.) and imaging lens (AC254-200-A, Thorlabs). A vertically oriented piezo (SLC-1730, SmarAct, Oldenburg, Germany) is installed on a combined piezo assisted XYZ positioner (TADC-652WSR25-M6PA and TDAC-653L25-M6PA actuators, OptoSigma Corporation, Santa Ana, CA, USA). The images were captured by a CMOS camera (acA1920-155um, Basler, Arnsberg, Germany).

2.3. Imaging Processing

All images acquired from the experiment were preprocessed to remove the static background image. The background image was approximated with the median image. The deconvolution and denoising algorithms were performed in MATLAB (R2024b) scripts.
The resolution of diffraction limited spot for our system is 352 nm based on the Rayleigh Criterion as Formula (1), the numerical aperture is 0.9 and the wavelength is 520 nm.
r = 0.61 · λ N A
where r is the size of the diffraction limited spot, and λ is the wavelength. N A is the numerical aperture of the objective.
The size of the Gaussian function used as the convolution kernel was 289 nm, and the kernel was formed based on the Nyquist Sampling Theorem as Formula (2), where r k e r n e l is the size of the Gaussian kernel. This formula emphasizes the relationship between sampling frequency and signal recovery, making it suitable for signal processing and imaging system analysis. The PSF model was defined by the wavelength, numerical aperture of the objective, pixel size in the object space, model size in pixel, attenuate strength and the attenuated size of PSF. These parameters are fixed.
r k e r n e l = 0.5 · λ N A
The cutoff frequency was 1.731 μm−1 and it was determined when the contrast reached its peak and the noise had been suppressed. The interference of marginal wave vectors in the scattering contribute to the cutoff frequency at 3.462 μm−1, while cutoff frequency generated from the interference of marginal wave vector and the reference light vector only achieves half of the former at 1.731 μm−1.
The workflow of SF. The raw image was processed by Wiener deconvolution and RL deconvolution then filtered by a low-pass filter before background division in the frequency domain.
A 2D Gaussian fitting was applied to calculate the positions of particles in the images. The mean displacement of particles tracked was taken as the reference displacement (relative reference position). The difference between each particle’s displacement and the mean displacement was taken as the localization error. Sample particles were displaced by a piezo stage. The mean displacement can be written as the following formula:
L m e a n = i = 1 i = n L i n
where L m e a n is the relative reference position, L i is the i t h particle’s displacement and n is the number of particles.
The normalized localization error can be written as the following formula:
L m e a n = L i L m e a n L m e a n
where L e r r o r is the localization error.

3. Results and Discussion

To evaluate the deconvolution performance in signal recovery and background suppression for particle imaging in iSCAT, we imaged a gold nanoparticle (GNP) sample and compared the raw data with deconvolved results. A spatial and frequency domain that combined deconvolution and filtering algorithm (SF) was employed to mitigate high-frequency noise (artifact speckles in the spatial domain), using a Gaussian function as the convolution kernel, derived via OpenSIM [30]. The SF deconvolution method combined Wiener deconvolution, RL deconvolution and a low-pass filter in the frequency domain, thereby processing signal and background noise in both spatial and frequency domains.
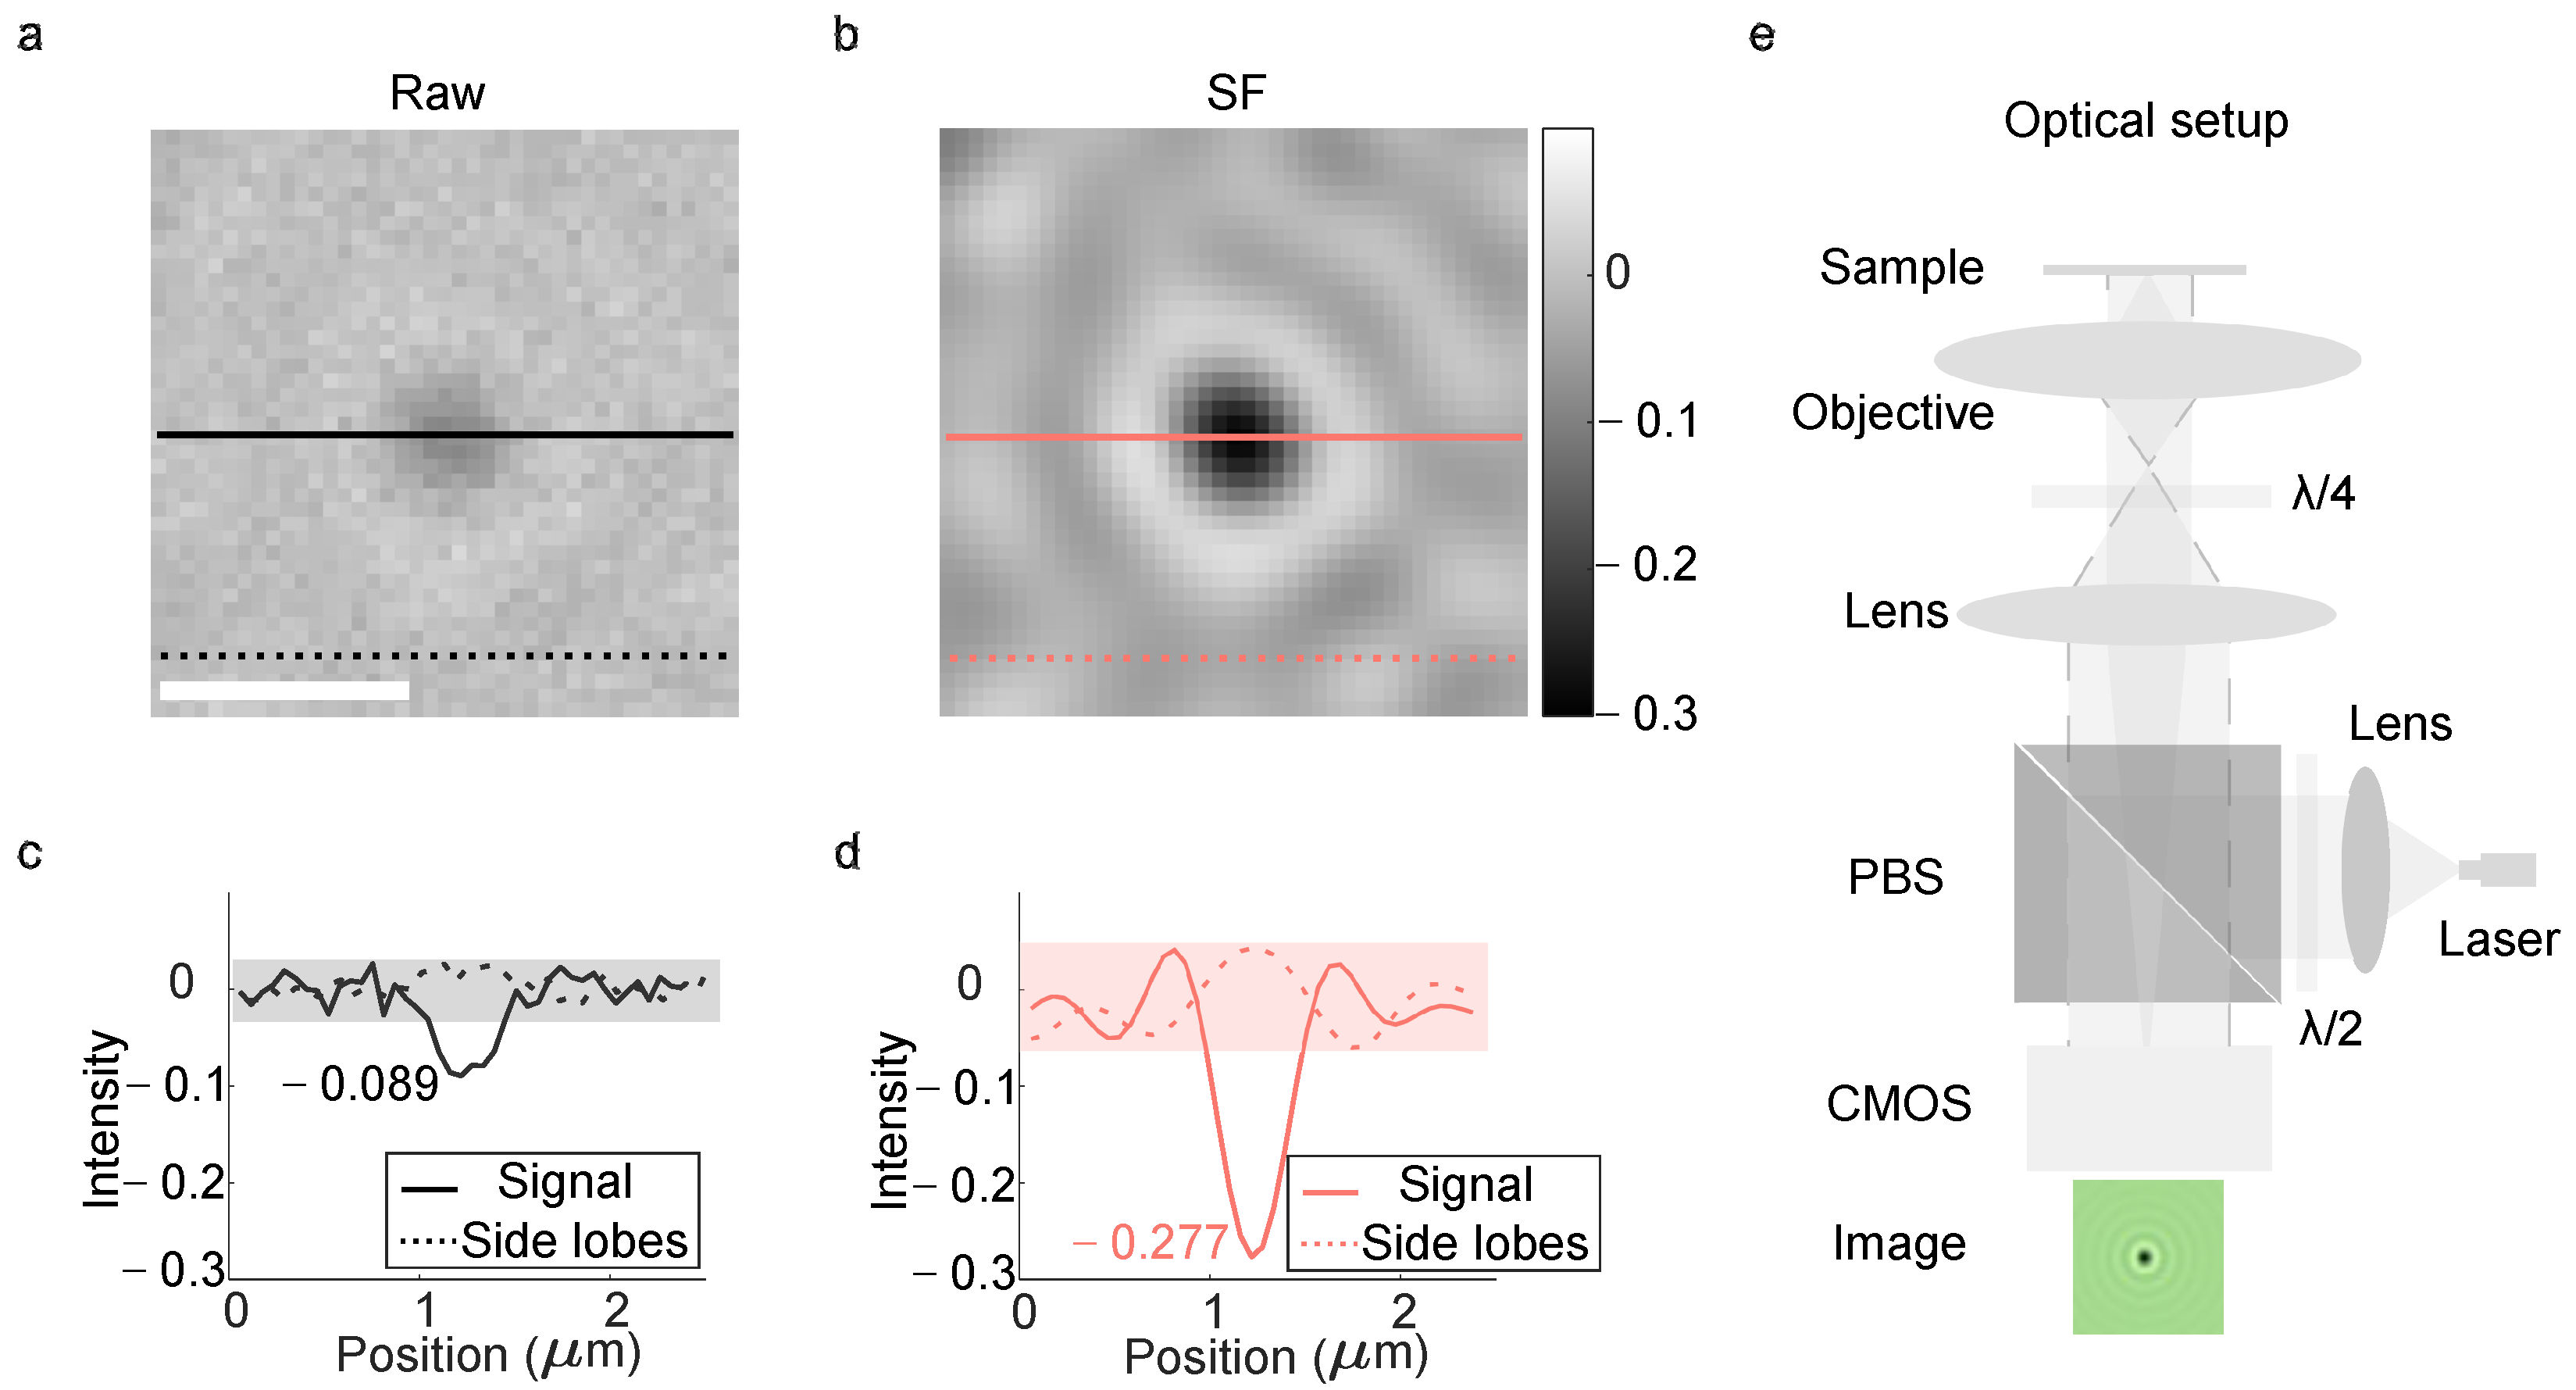
Figure 1a shows the raw GNP image. The corresponding deconvolved image using the SF method is presented in Figure 1b, where the interference signal appears darker compared to Figure 1a (as indicated by the color bar). Figure 1c provides quantitative intensity profiles: the raw image’s signal contrast (solid dark line) was approximately −0.089, whereas deconvolution improved this to −0.277 (solid red line). Intensity profiles along the solid dark and red lines in Figure 1a and Figure 1b were displayed in Figure 1c and Figure 1d, respectively (same color coding). Notably, the raw image’s dashed-dark line exhibits intensity fluctuations with pronounced spikes (dashed line in Figure 1c), while the deconvolved image’s dashed-red line shows a smoother profile with distinct peaks and valleys (dashed line in Figure 1c), indicating reduced noise artifacts. The optical setup is depicted in Figure 1e.
A collimated laser (wavelength of 520 nm) was reflected by the polarized beam splitter and focused on the back focal plane of the objective, resulting in a plane-wave reference illuminated on the cover glass and GNPs sample. The half-wave plate was inserted between the collimation lens and the polarized beam splitter to change the laser’s polarization into a s polarization for high reflection. The quarter-wave plate between the imaging lens and the objective was to maintain the symmetry of the point spread function in the image plane, since the shape of the point spread function changes with the polarization.
Deconvolution improved the signal contrast by threefold (Figure 1c), demonstrating its effectiveness in iSCAT imaging. In optical imaging, the image formation process is modeled as the convolution of an object with a point spread function (PSF) kernel, superimposed with noise. Signal attenuation occurs due to the PSF’s non-uniformity, often modeled as a Gaussian function. SF deconvolution compensates for this attenuation in both spatial and frequency domains. In iSCAT, the interference of spherical and plane waves generate concentric dark–bright ring “side lobes” around the central dark spot (termed the interference PSF). In Figure 1a, these side lobes are obscured by random noise, appearing as spikes in the dashed-dark line profile (Figure 1c). Deconvolution suppresses this noise, revealing the underlying side lobes as distinct peaks and valleys in the dashed-red line profile (Figure 1d), thereby reconstructing the true interference pattern.
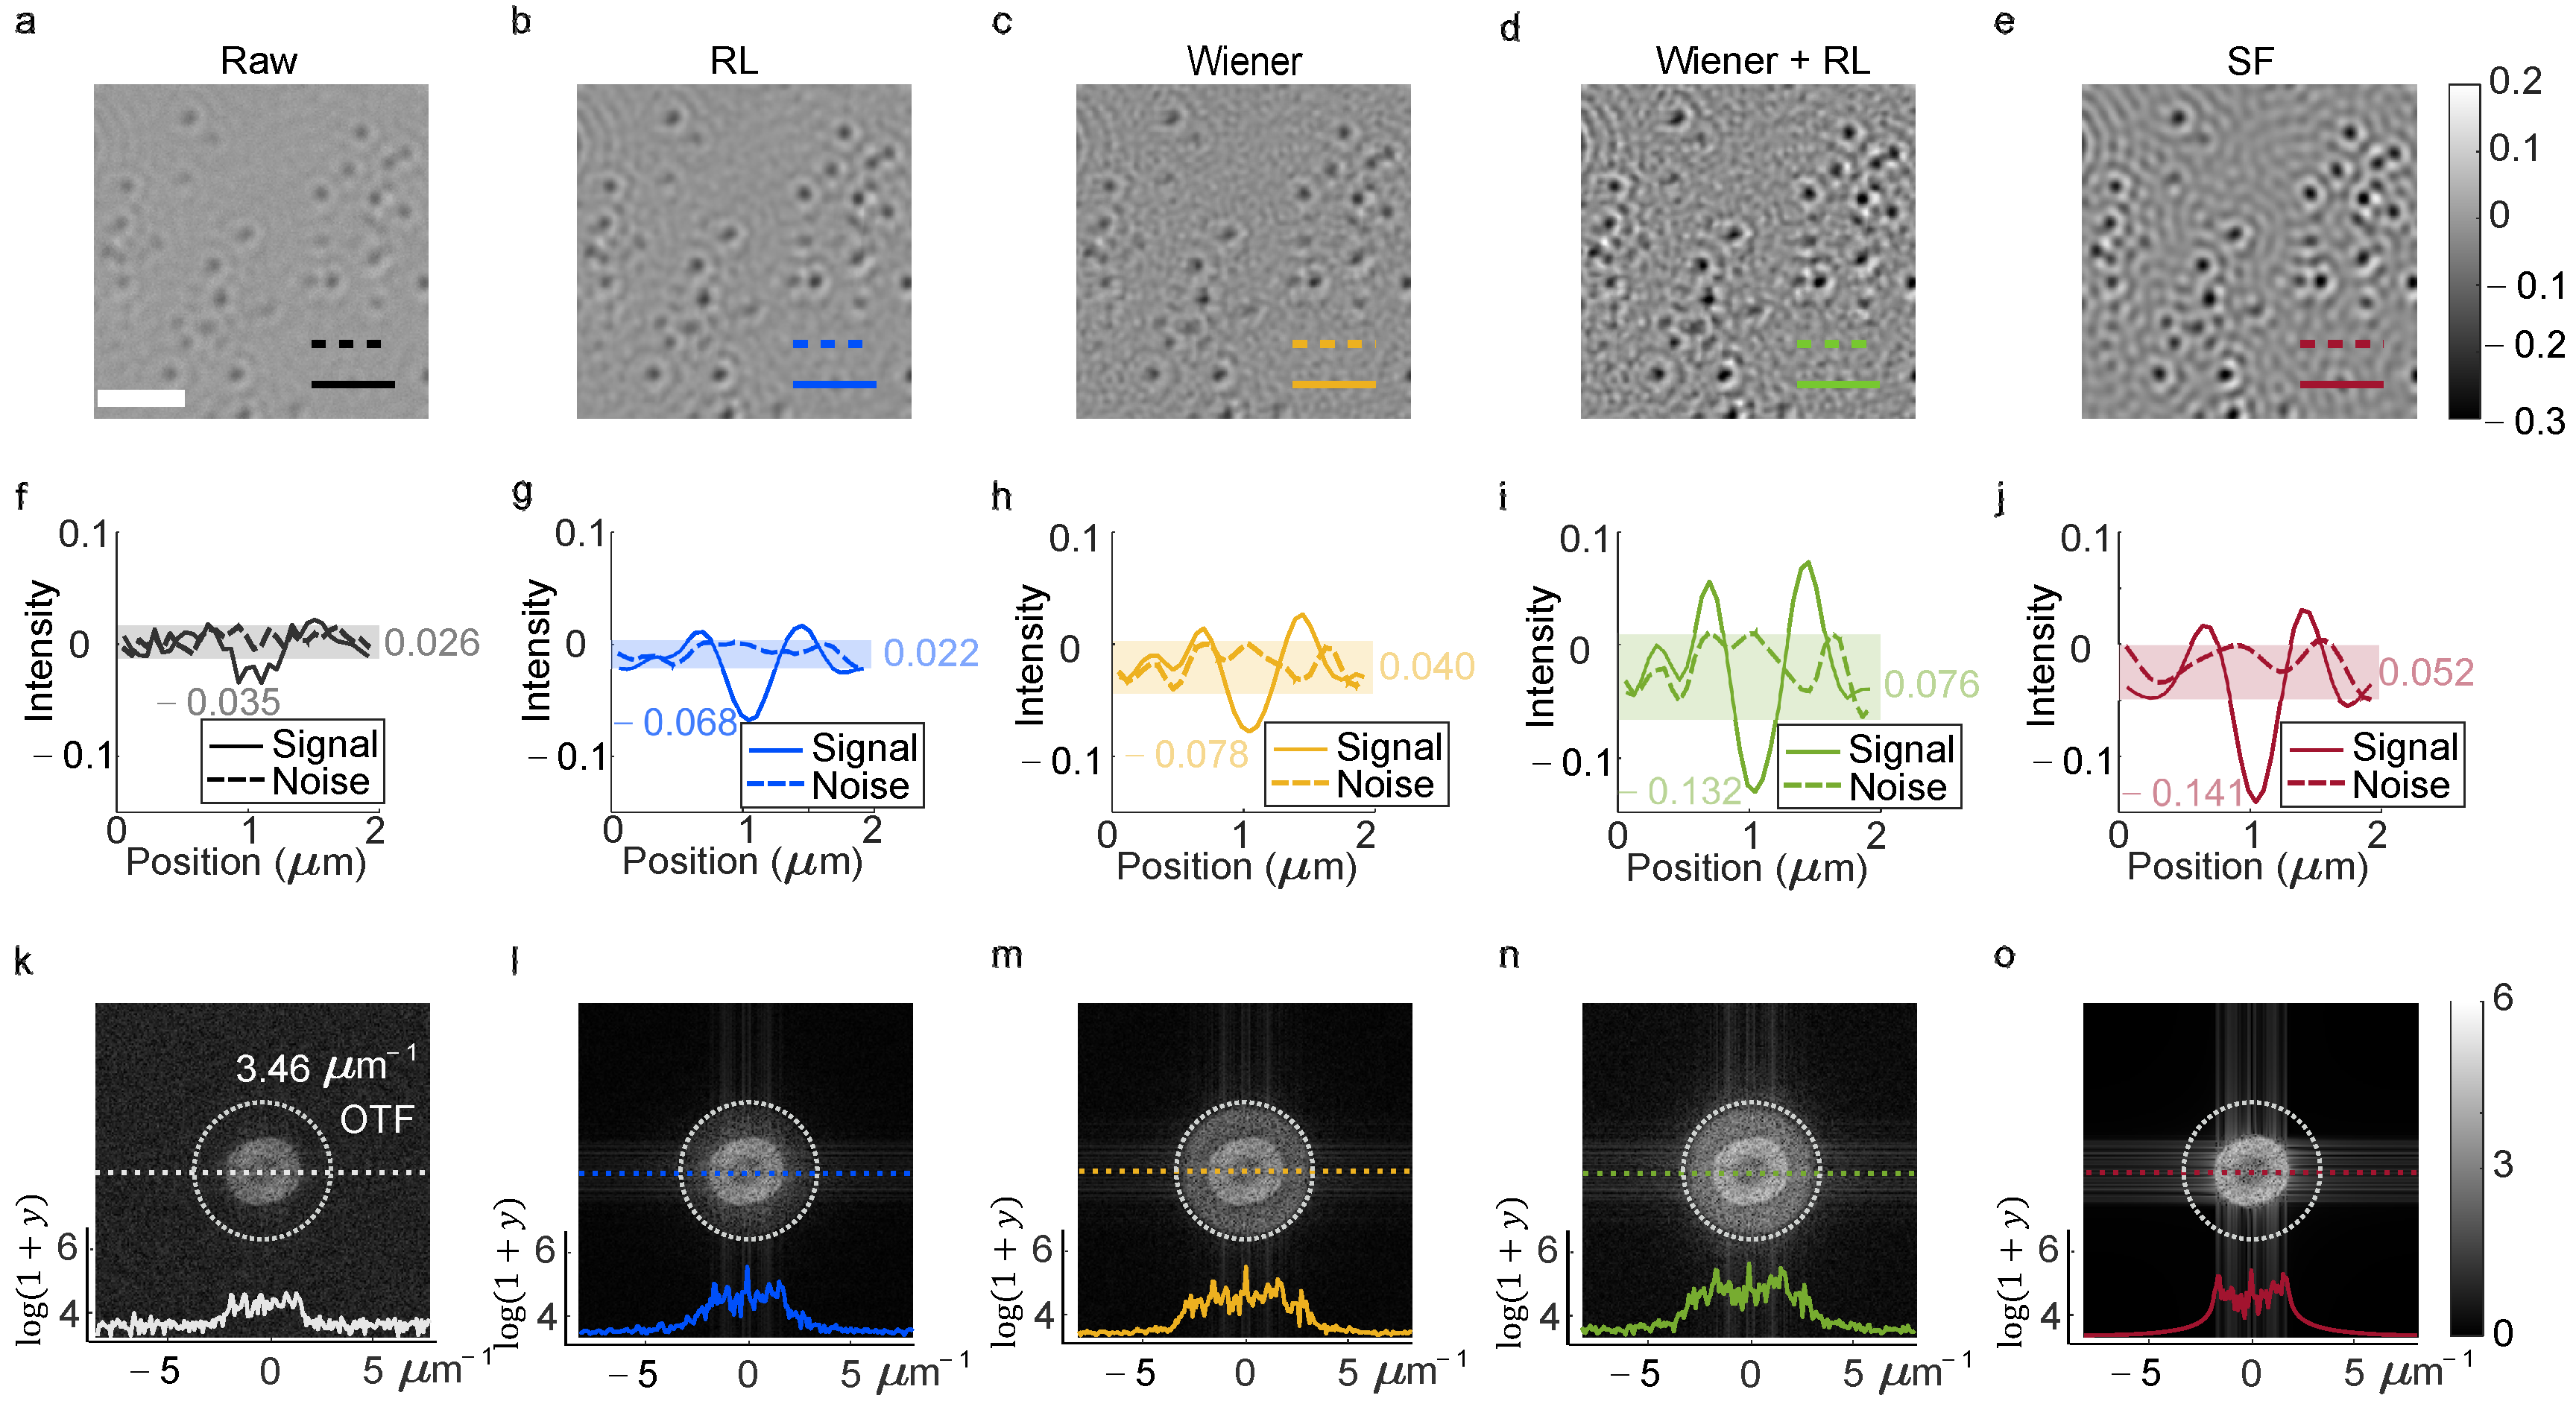
To evaluate deconvolution techniques across spatial and frequency domains, Wiener, RL, Wiener-assisted RL and SF deconvolutions were applied to raw image data (Figure 2a–e). Wiener deconvolution operates in the frequency domain (Figure 2b), while RL deconvolution is a spatial-domain method (Figure 2c). The Wiener-assisted RL approach integrates both domains (Figure 2d), and SF deconvolution incorporates a low-pass filter to suppress noise (Figure 2e). Spatial-domain metrics, such as signal contrast and background noise fluctuations, were quantified in Figure 2f (intensity along cut-lines in Figure 2a) as a baseline. Deconvoluted images (Figure 2g–j) revealed enhanced features and modulated backgrounds: central dark spots and noise became more distinct compared to unprocessed images. Frequency-domain analysis (Figure 2k–o) demonstrated how each method addressed attenuated spectral components.
In Figure 2f,g, background noise along the dashed line in Figure 2a was reduced from 0.026 to 0.022, and signal contrast improved from −0.035 to −0.068. RL deconvolution doubled the contrast without increasing noise (Figure 2g). Wiener deconvolution (Figure 2h) achieved a contrast of −0.078 but introduced speckles in the background, raising noise to 0.040. The combined Wiener-assisted RL method (Figure 2d,i) sharpened the image, enhanced contrast to −0.132 and increased intensity along the cut-line to 0.076, though background speckles persisted. SF deconvolution (Figure 2e,j) further reduced noise while preserving signal contrast, outperforming the combined method.
The raw image’s refraction-limited frequency spectrum (Figure 2k) showed peripheral components above zero, indicating residual high-frequency noise from the aperture-limited system. Deconvolution (Figure 2l–o) suppressed these artifacts, with brighter central regions (Figure 2l–o) revealing recovered signal, consistent with enhanced spatial and spectral contrast (Figure 2b–e,l–o). The dark ring in Figure 2o did not degrade signal contrast in Figure 2e,j, suggesting the effective OTF region in iSCAT is narrower than the system’s theoretical limit. The white dashed circle represented the cutoff frequency of the OTF in Figure 2k–o. The cutoff frequency was 3.462 μm−1. The horizontal coordinates represent the frequency and the vertical coordinates represent the intensity of frequency; these coordinates were labeled in Figure 2.
The RL deconvolution reduced the noise based on a Poisson noise model and the cut-line intensity variance was reduced from 0.026 in Figure 2f to 0.022 in Figure 2g. The rest of the variance of the background with low frequency is the fringe generated from interference which can be treated as the interference feather for detection. Additionally, noise in the frequency domain was introduced by Wiener deconvolution, which was suppressed by the low-pass filter in the frequency domain.
While deconvolution methods compensated for signal loss due to aperture limitations, their noise performance varied. Wiener deconvolution (Figure 2b,l) amplified background noise via an imprecise two-parameter power spectrum model, introducing speckles. RL deconvolution (Figure 2g) preserved spatial detail without adding high-frequency noise. The SF approach (Figure 2e–j) balanced noise reduction and contrast enhancement through low-pass filtering. In contrast, frame-averaging techniques (e.g., differential rolling average or ratio metric) reduced noise but required processing hundreds of frames, whereas deconvolution improved contrast directly without averaging for each frame.
Quantitative analysis is central to iSCAT-based functional measurements, such as determining nanoparticle diameter, mass and surface charge. To assess the impact of image processing techniques, 10 nm gold nanoparticles (GNPs) were analyzed, with statistical comparisons between the raw and the deconvolved images (Figure 3). Deconvolution was applied to enhance image quality and resolve low-contrast features critical for accurate quantification.
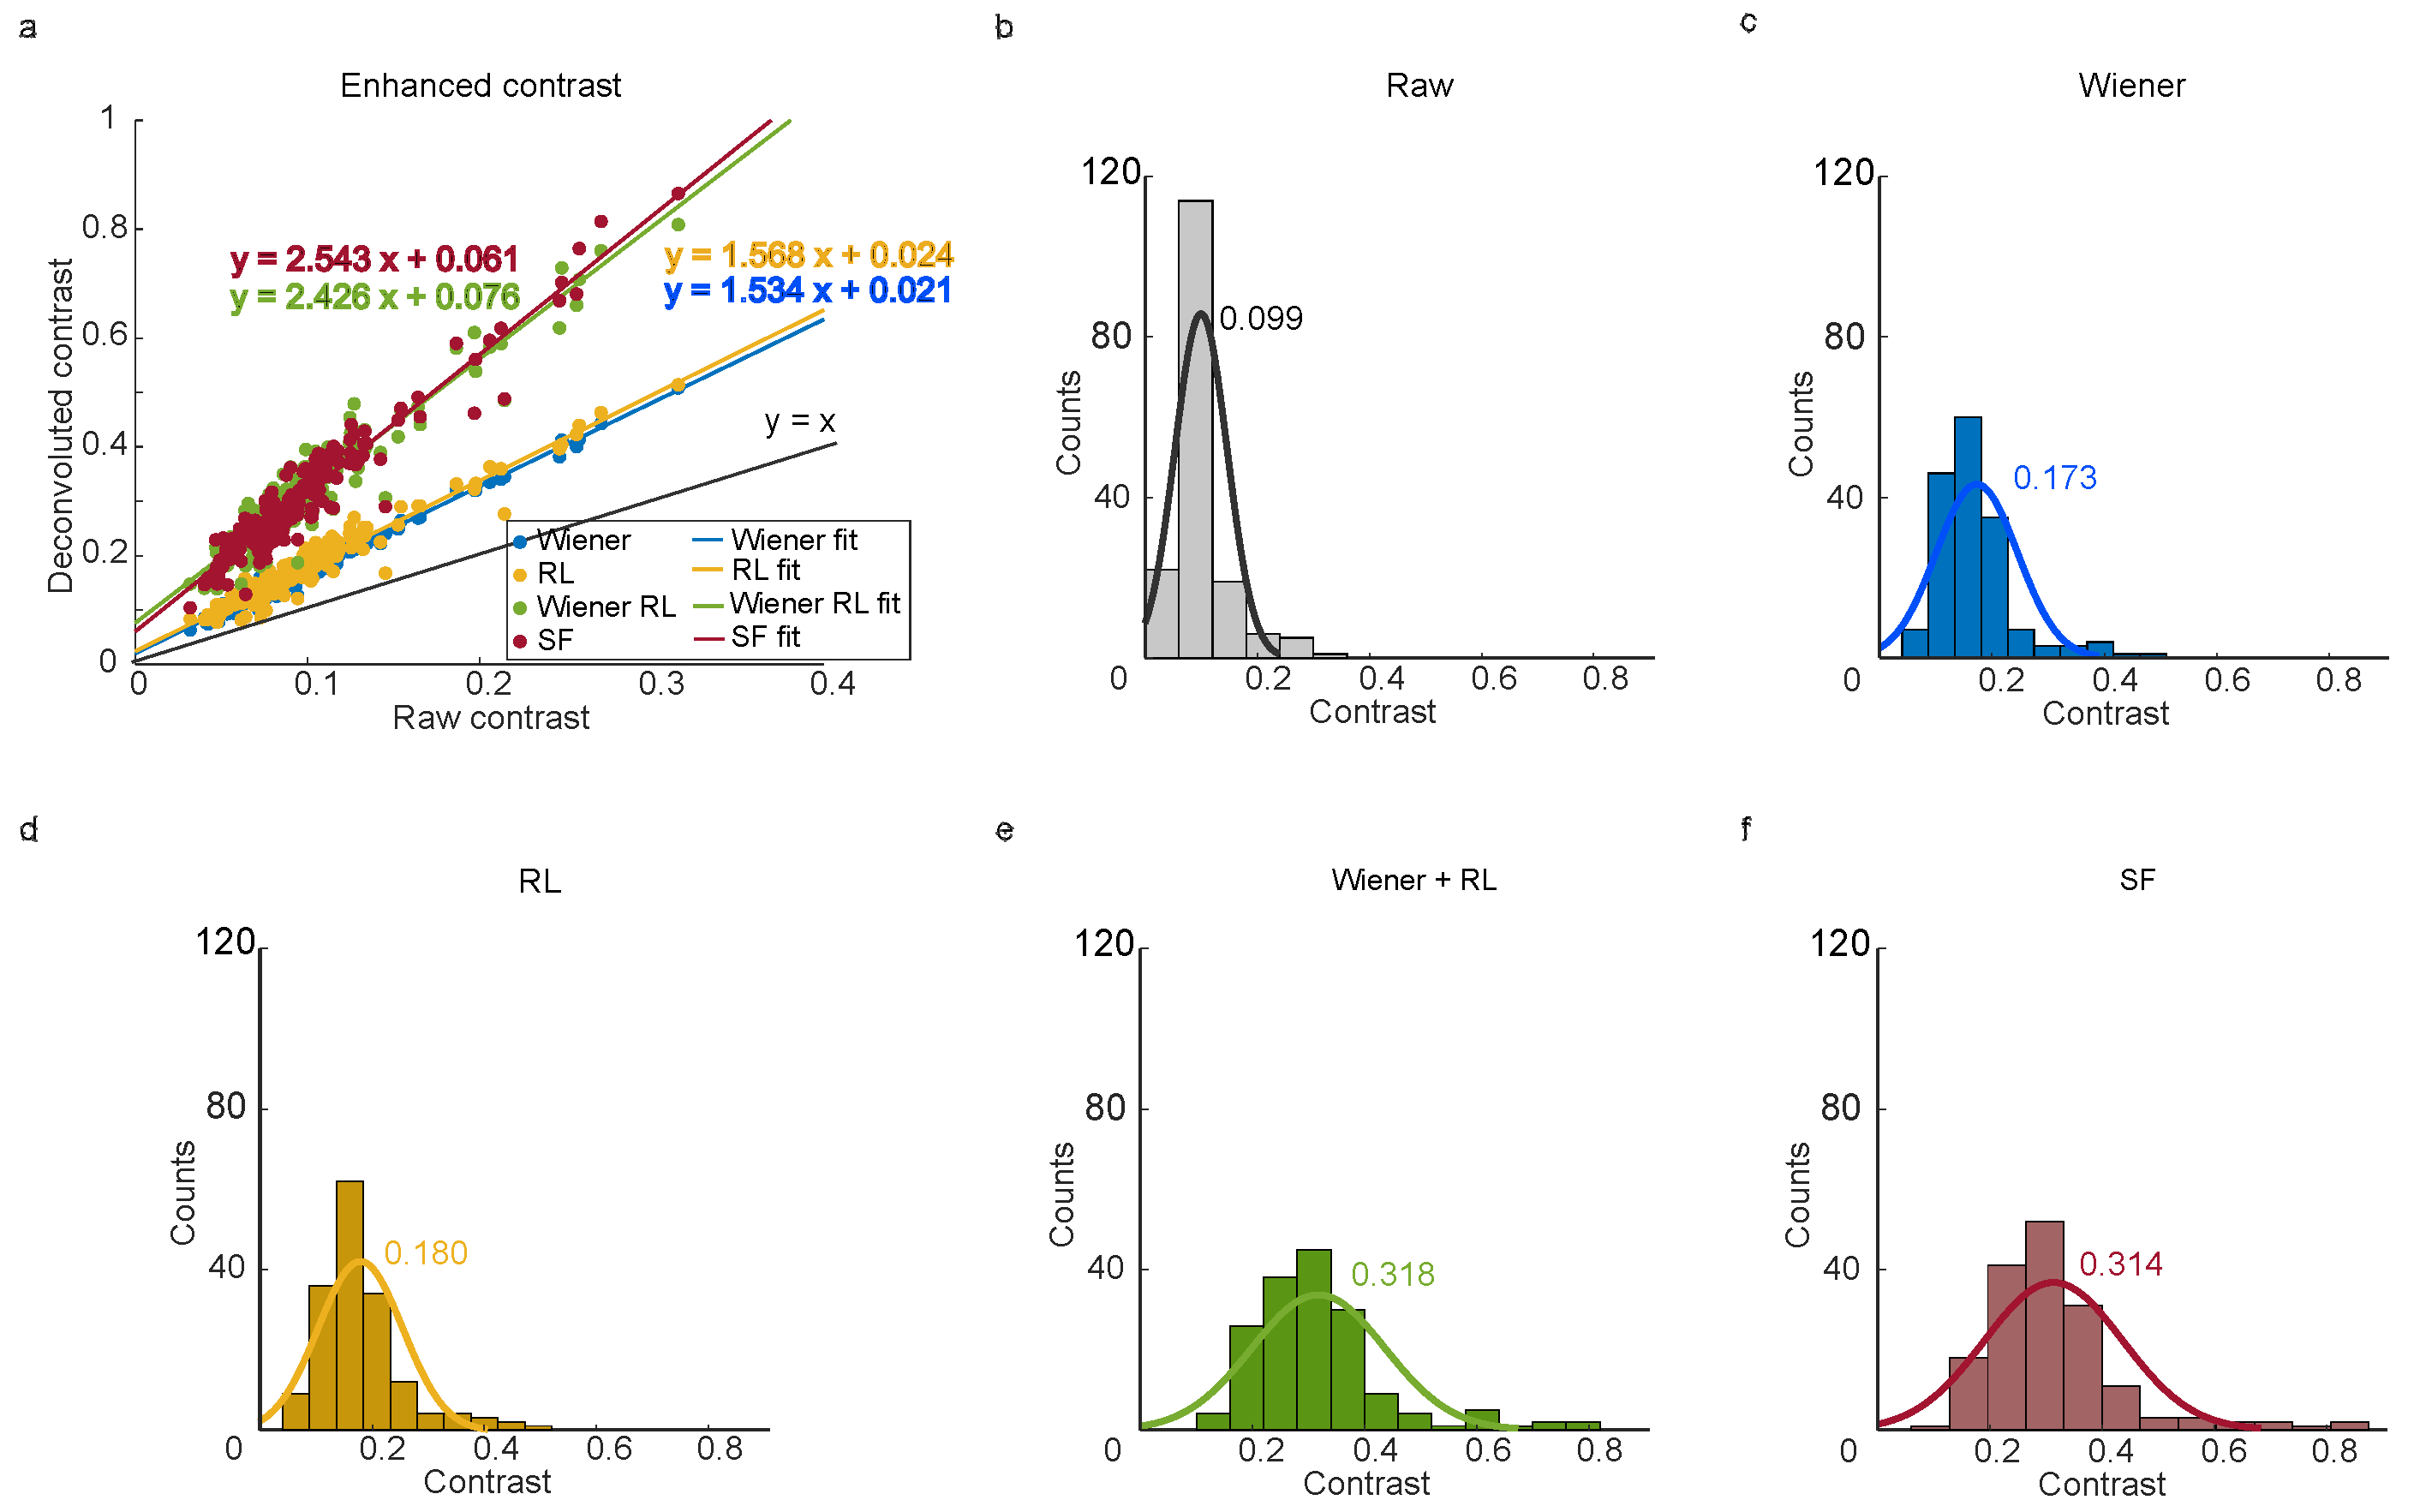
The deconvolved images showed marked improvements in contrast compared to raw images. Linear regression analysis of raw and deconvolved data (Figure 3a, colored lines) revealed consistent slopes of 1.5, 1.5, 2.5 and 2.5, with coefficients of determination (R2) of 0.976, 0.935, 0.906 and 0.924, respectively. Statistical histograms of contrast distributions (Figure 3b–f) further demonstrated deconvolution’s effectiveness. For example, the Gaussian-fitted peak contrast in raw images (0.099, Figure 3b) increased to 0.173 (Wiener deconvolution, Figure 3c) and 0.180 (RL deconvolution, Figure 3d), representing a 1.7-fold improvement in contrast. Wiener-assisted RL deconvolution achieved a contrast of 0.318, with a comparable 0.314 contrast in the spatial–frequency (SF) deconvolved image, representing a ∼ 3-fold improvement in contrast. These enhancements enabled clearer resolution of nanoparticle features, as evidenced by the higher peak contrasts in processed data.
The strong linear correlation between raw and deconvolved contrast, supported by high R2 values, highlights the deconvolution algorithms’ ability to preserve quantitative accuracy while amplifying signal strength. These findings are particularly valuable for high-sensitivity applications, such as nanoparticle characterization. In raw images, low-contrast particles are often masked by background noise, limiting detection sensitivity. Frame-averaging methods yield similar contrast but require hundreds of frames, whereas deconvolution suppresses noise and sharpens particle signals, improving both contrast and signal-to-noise ratios. This dual benefit—enhanced contrast and reduced noise—enables the detection of smaller or sparsely distributed nanoparticles within single frames. By addressing these challenges, deconvolution emerges as a vital tool for advancing iSCAT’s precision in quantitative nanoscale imaging. Future work could explore adaptive deconvolution strategies to account for spatially variant point spread functions (PSFs), further refining the accuracy of functional measurements.
Localization precision is fundamentally tied to the signal-to-noise ratio (SNR). Deconvolution techniques enhance image contrast and reduce noise artifacts, directly benefiting localization accuracy. In this study, localization errors were quantified by measuring the mean shift in individual particles in raw and deconvoluted images. Error values were calculated as the difference between each particle’s shift distance and the overall mean shift. Sample particles were displaced by a piezo stage.
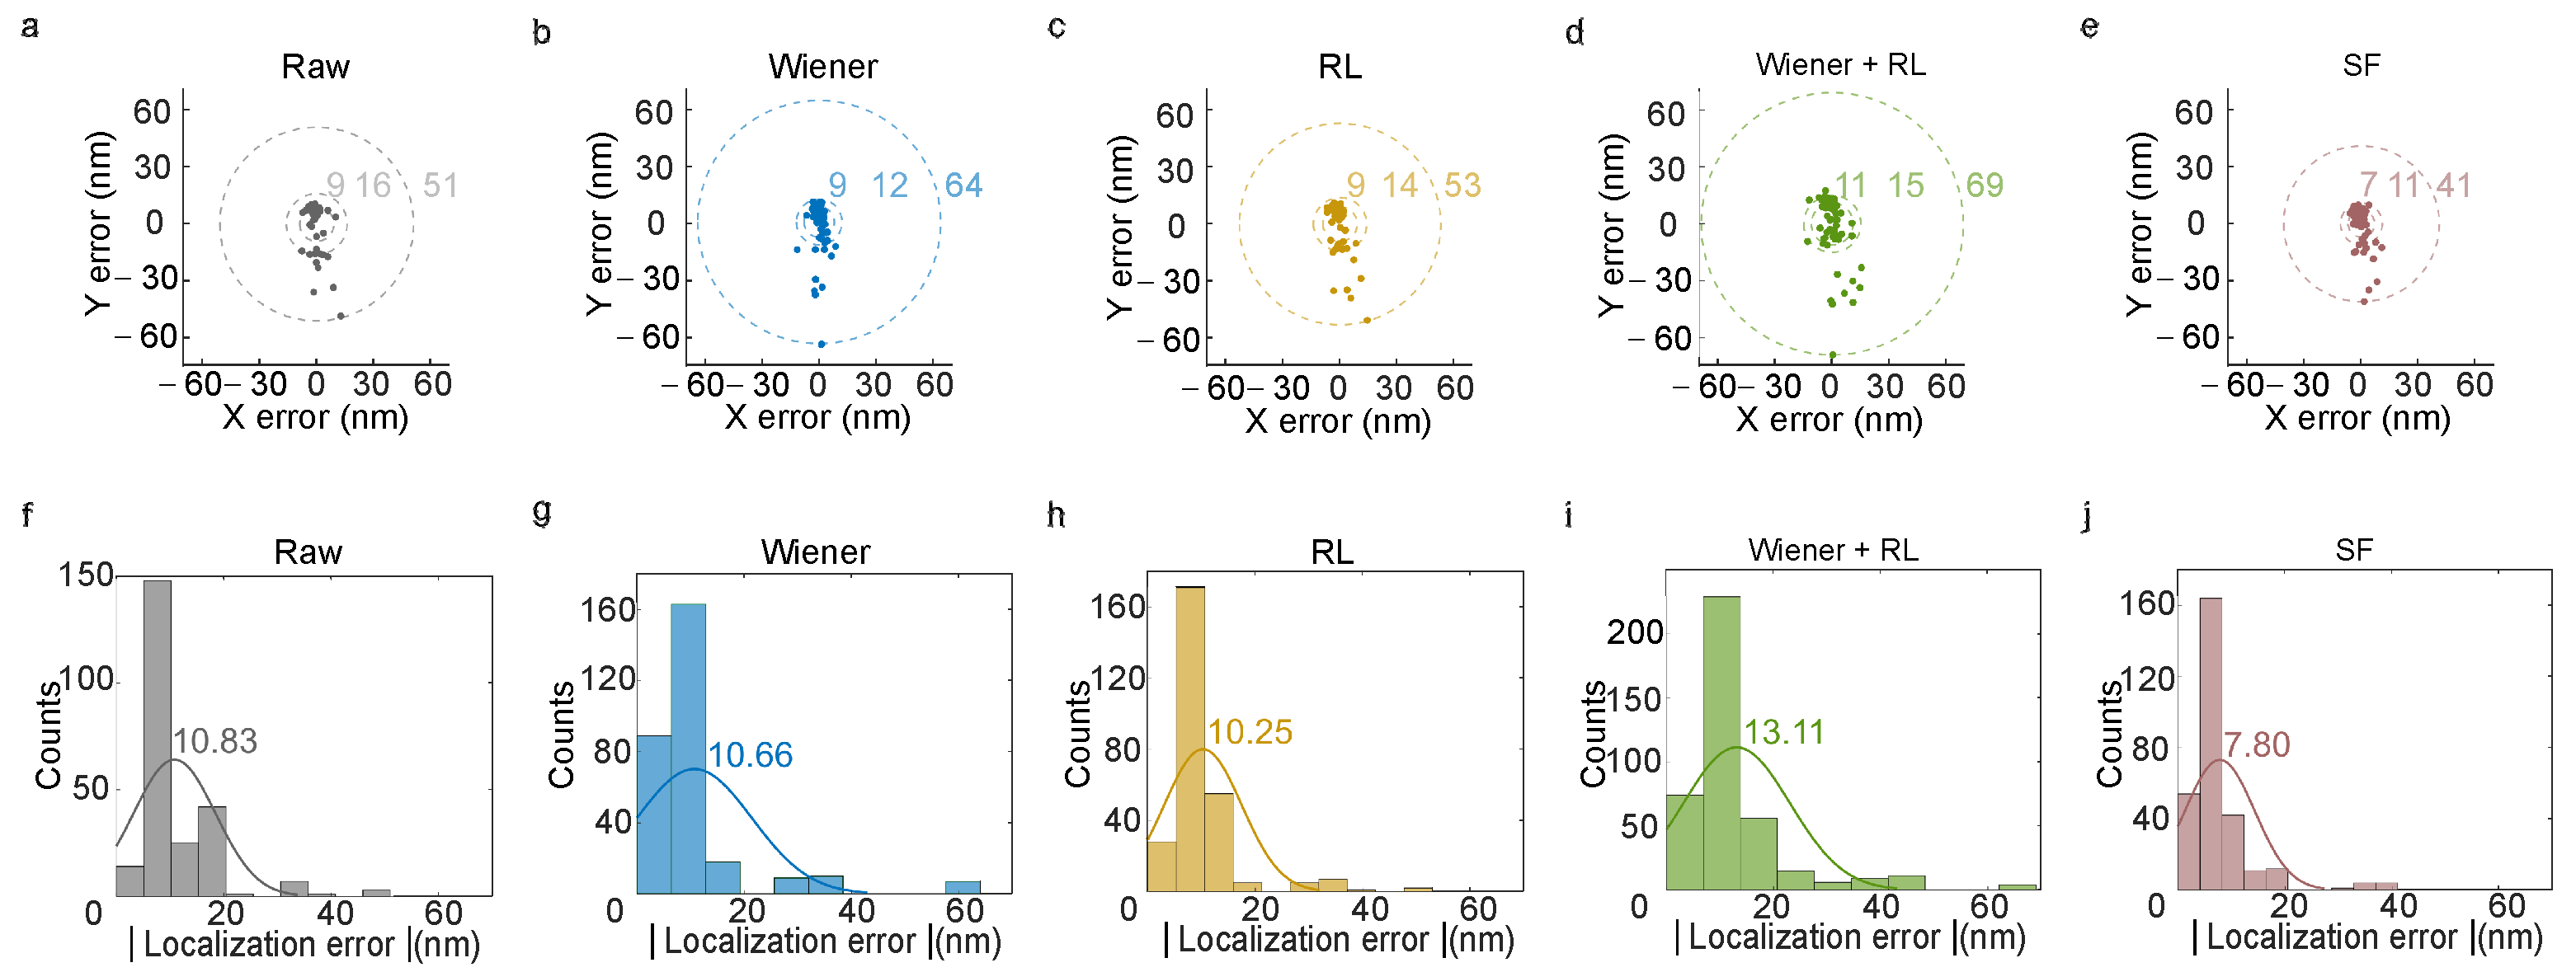
For raw images (Figure 4a), 50% of particles exhibited localization errors below 9 nm, 80% below 16 nm and the maximum error remained under 51 nm. After Wiener deconvolution (Figure 4b), these thresholds improved to 11 nm (50%), 15 nm (80%) and 64 nm (100%). RL deconvolution (Figure 4c) further refined these to 9 nm (50%), 13 nm (80%) and 53 nm (100%), respectively. However, combining Wiener and RL deconvolution (Figure 4d) paradoxically increased localization errors to 11 nm (50%), 15 nm (80%) and 69 nm (100%). Strikingly, applying the SF deconvolution method (Figure 4e) restored and improved these values to 7 nm (50%), 11 nm (80%) and 41 nm (100%).
Histograms and Gaussian-fitted distributions (Figure 4f–j) further illustrate these trends. The fitted peak localization error in raw images was 10.83 nm. While Wiener and RL deconvolution achieved 10.66 nm (Figure 4g) and 10.25 nm (Figure 4h), respectively, the hybrid Wiener-RL method increased the peak error to 13.11 nm (Figure 4i). SF deconvolution, however, reduced this to 7.80 nm (Figure 4j), demonstrating its superior performance.
The systematic reduction in localization errors highlights the efficacy of SF deconvolution in refining spatial resolution. By concentrating errors into narrower ranges, SF deconvolution aligns with theoretical expectations: enhanced SNR and contrast directly correlate with improved localization accuracy (Figure 1, Figure 2 and Figure 3). While the raw image median error was 10.83 nm, SF deconvolution reduced this to 7.80 nm. These findings reveal a trade-off between computational complexity (e.g., RL’s iterative approach) and error suppression, with SF deconvolution striking an optimal balance by progressively mitigating noise while preserving critical signal features.
This trend validates the hypothesis that SF deconvolution optimizes SNR through the suppression of out-of-focus light while retaining in-plane detail. The improved performance is particularly evident in SF-deconvoluted images, where sub-diffraction imaging achieves greater statistical confidence. Collectively, these results demonstrate that deconvolution not only sharpens image contrast but also quantifiably enhances the reliability of single-particle localization. Future work could explore adaptive deconvolution strategies to further tailor error profiles for specific imaging conditions.
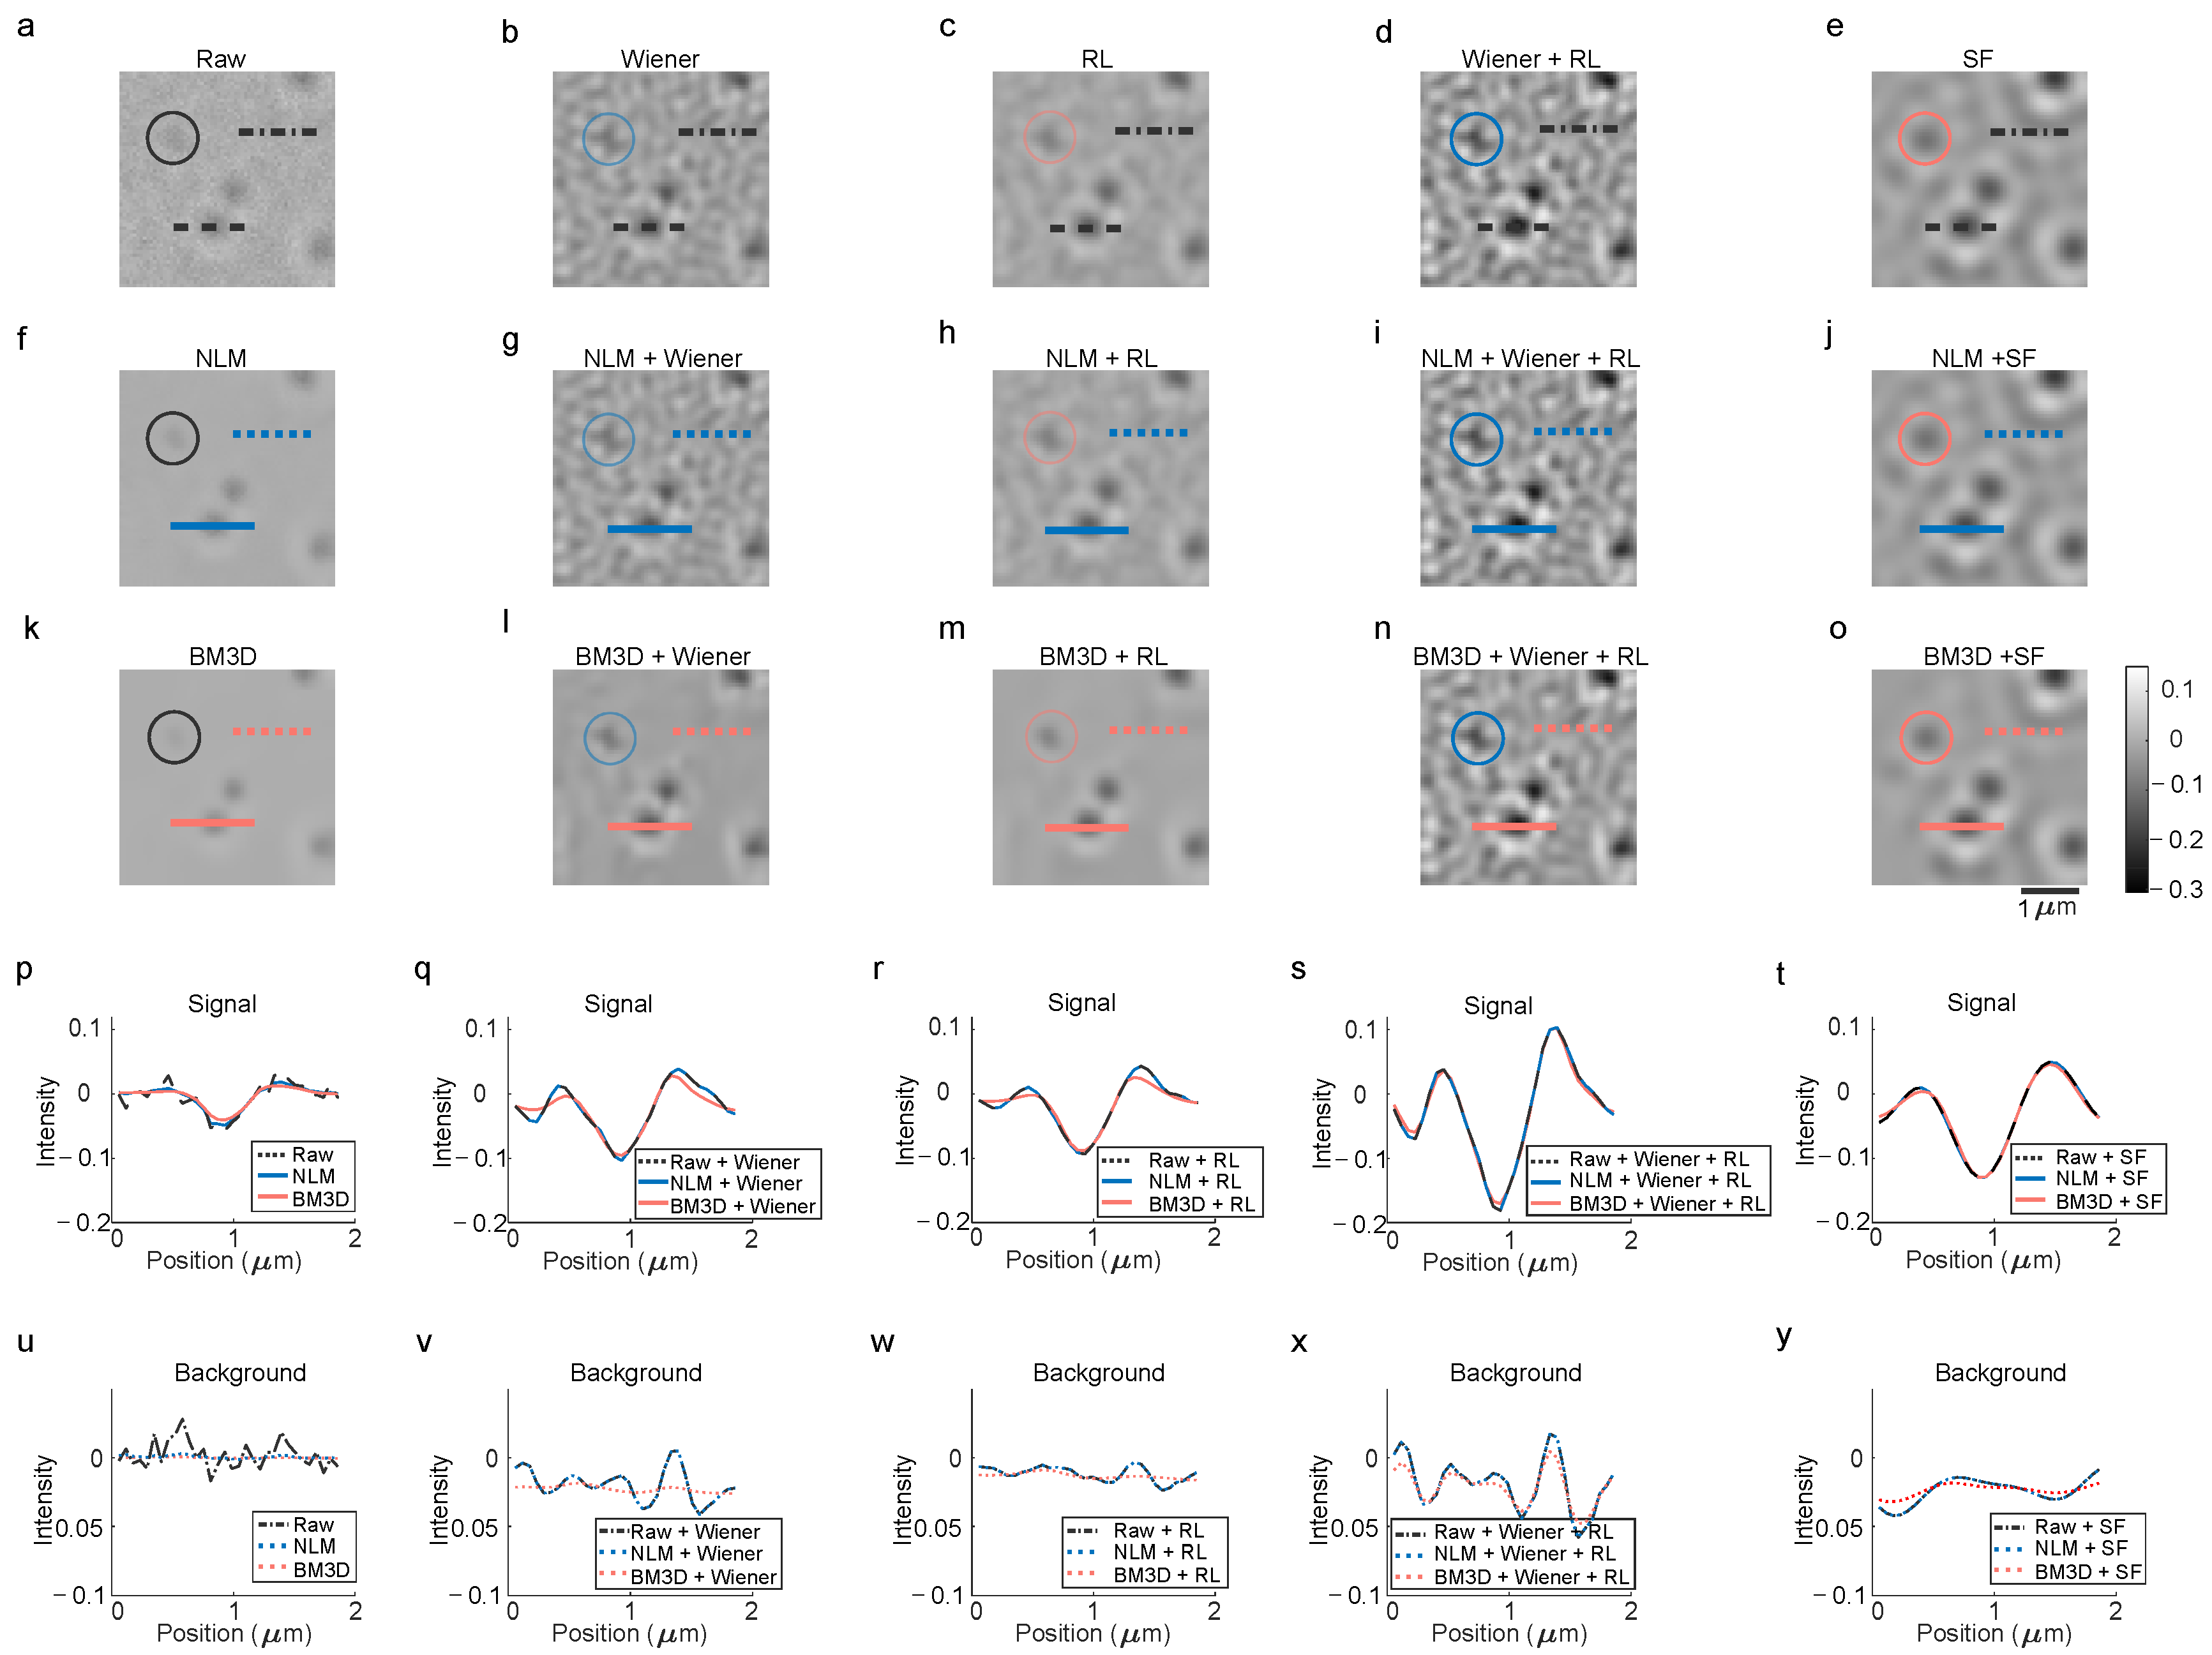
To systematically evaluate deconvolution algorithms, raw images and their processed counterparts (via deconvolution and denoising) were compared in a structured matrix format, as illustrated in Figure 5a–o. Signal intensity and background noise along designated lines in these images were quantified to analyze contrast and noise behavior (Figure 5p–y). The evaluation included Non-Local Means (NLMs) [31] and Block-Matching 3D (BM3D) [32] denoising algorithms, alongside spatial and frequency domain deconvolution methods: Wiener, RL, Wiener-assisted RL and SF.
In the raw image (Figure 5a), a weak particle spot transformed into a sharp, asymmetric pattern under Wiener deconvolution (Figure 5b), while RL deconvolution (Figure 5c) produced a softer, more diffuse shape. The Wiener-assisted RL approach (Figure 5d) further enhanced asymmetry, which was symmetrized by the SF method (Figure 5e). NLM denoising (Figure 5f–j) preserved particle patterns from the raw image (Figure 5a–e) but showed minimal improvement in background noise suppression (Figure 5b–e vs. Figure 5g–j). Similarly, BM3D denoising (Figure 5k–o) smoothed the background while maintaining consistent particle patterns, though residual side lobes—interference feathers from plane-wave and spherical-wave interference—remained in the SF-deconvoluted image (Figure 5e).
Signal intensity profiles along particle-crossing lines (Figure 5a–o) were plotted in Figure 5p–t, with the corresponding background noise analyzed in Figure 5u–y. For example, raw (Figure 5a), NLM-denoised (Figure 5f) and BM3D-denoised (Figure 5k) images were compared in Figure 5p. Subsequent plots (Figure 5q–t) detailed the effects of combining deconvolution with NLM or BM3D denoising. While NLM and BM3D reduced background noise and smoothed signals, they also blurred fine contrasts and suppressed side lobes. Notably, speckle artifacts introduced by Wiener-based deconvolutions were partially filtered but introduced a bias depending on speckle density.
Under iSCAT imaging, where signals manifest as discrete intensity peaks (typically 0–1 contrast), noise fluctuations often obscure weak features. This highlights a critical trade-off: deconvolution enhances resolution but may amplify noise, while aggressive denoising risks signal loss. The results underscore the need for balanced preprocessing strategies that optimize contrast preservation and noise reduction to maintain fidelity in high-resolution imaging.
4. Conclusions

The detection sensitivity in iSCAT is fundamentally constrained by noise-dominant signals and degraded OTF, which obscure subtle features of target particles. Conventional methods to mitigate these limitations often rely on time-intensive or computationally heavy approaches that reduce noise variability but fail to restore critical signal details. To address this, we propose a spatial–frequency deconvolution method (SF) that enhances signal contrast by approximately threefold, enabling robust separation of target signals from background noise. This improvement stems from the algorithm’s ability to reweight frequency components, recovering partially lost structural information while suppressing high-frequency noise beyond the OTF boundary. The resulting linear increase in contrast directly improves spatial resolution and quantitative analysis capabilities, particularly for precise measurements of particle size, mass and charge—key parameters underpinning biophysical characterizations.
Comparative analyses highlight the limitations of traditional denoising techniques such as NLM and BM3D, which, while effective at noise reduction, often eliminate interference side lobes critical for particle identification. Similarly, Wiener-based deconvolution achieves noise suppression but introduces undesirable speckles due to its reliance on power spectrum approximations. In contrast, RL deconvolution in the spatial domain achieves noise levels comparable to raw images while preserving contrast akin to the Wiener method. A hybrid approach combining spatial and frequency domain deconvolution with a low-pass filter offers a balanced strategy, optimizing both signal clarity and noise suppression. These comparisons underscore the trade-offs between existing techniques and the unique advantages of SF deconvolution in maintaining structural fidelity and maximizing measurable contrast.
This study demonstrates the transformative potential of modified SF deconvolution in overcoming iSCAT’s sensitivity bottlenecks. By comparing diverse algorithms, we emphasize the superiority of model-based deconvolution in preserving structural integrity while enhancing contrast for precise quantification. In traditional frame-averaging methods in iSCAT, several hundreds of frames were averaged and divided or subtracted to produce one effective frame. As such, the effective frame rate increased from several frames per second [17,18,19] to thousands of frames per second in our work since each frame can be processed. The time resolution and image utilization has been increased for hundreds of times. The detection sensitivity of iSCAT is limited by the contrast and noise, our algorithm enhanced the contrast for 3-folds. Furthermore, the localization error has been decreased by about 20%. Our approach verified that the detection sensitivity can be improved not only through noise suppression as these frame-consuming methods do but also through signal recovering with deconvolution for each frame.
The detection of nanoparticles and single molecules meets the challenge of weak signal both in the spatial domain and the time domain. Traditional frame-averaging methods reap the enhanced signal in the spatial domain at the cost of low time resolution (several frames per second) and low frame utilization. In this work, the SF approach provided a 3-fold-enhanced signal without lowering the time resolution. The combination of the SF approach and mask-based reference attenuation method might provide higher contrast, further improving the detection sensitivity. The background noise has been improved as well; selective strategies are needed to handle the noise introduced by deconvolution. As in Figure 1d, the interference side lobes were enhanced and the noise was suppressed. The side lobes carry the sub-wavelength information including phase information, axial position and orientation. Investigations into these feathers might open a broader world in nanoparticles. Looking forward, integrating advances in computational imaging—such as deep learning-driven restoration—could further bridge the gap between theoretical OTF performance and practical imaging challenges. Such interdisciplinary innovations hold promise for advancing single-particle analytics, particularly in biomedical and nanoscale applications where precision is paramount.

Author Contributions

Conceptualization, X.Z. and H.H.; methodology, X.Z.; software, X.Z.; validation, X.Z. and H.H.; formal analysis, X.Z.; investigation, X.Z.; resources, X.Z.; data curation, X.Z.; writing—original draft preparation, X.Z.; writing—review and editing, X.Z. and H.H.; visualization, X.Z.; supervision, X.Z. and H.H.; project administration, X.Z.; funding acquisition, X.Z. All authors have read and agreed to the published version of the manuscript.

Funding

This work was funded by the National Key Research and Development Program of China (no. 2022YFF1203400 and 2022YFC3104700), National Natural Science Foundation of China (no. 62171211, 32371526, 32100021, 32371372, 22204069 and 22474054), Science and Technology Innovation Commission of Shenzhen (no. JCYJ20220814170440001, JCYJ20220818100218039, JCYJ20220530113013030 and JCYJ20230807092459028), the Shenzhen Science and Technology Innovation Program (Grant Nos. RCBS20221008093127073, JCYJ20230807093405012) and Center for Computational Science and Engineering at Southern University of Science and Technology.

Institutional Review Board Statement

Not applicable.

Informed Consent Statement

Not applicable.

Data Availability Statement

Data underlying the results presented in this paper will be publicly available later.

Acknowledgments

The authors thank the National Key Research and Development Program of China. The authors thank the National Natural Science Foundation of China. The authors thank the Science and Technology Innovation Commission of Shenzhen. The authors thank the Center for Computational Science and Engineering at Southern University of Science and Technology.

Conflicts of Interest

The authors declare no conflicts of interest.

Abbreviations

The following abbreviations are used in this manuscript:
SFSpatial–frequency domian deconvolution
iSCATInterferometric Scattering Microscopy
OTFOptical transfer function
SNRSignal-to-noise ratios
GNPsGold nanoparticles
RLRichardson–Lucy
PSFPoint spread function
R2Coefficients of determination
NLMsNon-Local Means
BM3DBlock-Matching and 3D Filtering

References

  1. Diaspro, A.; Chirico, G.; Usai, C.; Ramoino, P.; Dobrucki, J. Photobleaching. In Handbook of Biological Confocal Microscopy; Springer: Boston, MA, USA, 2006; pp. 690–702. [Google Scholar]
  2. Chaze, W.; Caballina, O.; Castanet, G.; Lemoine, F. The saturation of the fluorescence and its consequences for laser-induced fluorescence thermometry in liquid flows. Exp. Fluids 2016, 57, 58. [Google Scholar] [CrossRef]
  3. Annibale, P.; Vanni, S.; Scarselli, M.; Rothlisberger, U.; Radenovic, A. Investigating the Impact of Photo-Blinking on Photo Activated Localization Microscopy: From Single Molecules to Cell Membrane Receptors. Biophys. J. 2012, 102, 724a. [Google Scholar] [CrossRef]
  4. Mazaheri, M.; Kasaian, K.; Albrecht, D.; Renger, J.; Utikal, T.; Holler, C.; Sandoghdar, V. iSCAT microscopy and particle tracking with tailored spatial coherence. Optica 2024, 11, 1030. [Google Scholar] [CrossRef]
  5. Iqbal, K.; Thiele, J.C.; Pfitzner, E.; Kukura, P. Enhanced Interferometric Imaging by Rotating Coherent Scattering Microscopy. ACS Photonics 2025, 12, 2647–2655. [Google Scholar] [CrossRef]
  6. Park, J.S.; Lee, I.B.; Hong, S.C.; Cho, M. Label-Free Interference Imaging of Intracellular Trafficking. Accounts Chem. Res. 2024, 57, 1565–1576. [Google Scholar] [CrossRef]
  7. Reina, F.; Galiani, S.; Shrestha, D.; Sezgin, E.; de Wit, G.; Cole, D.; Christoffer Lagerholm, B.; Kukura, P.; Eggeling, C. Complementary studies of lipid membrane dynamics using iSCAT and super-resolved fluorescence correlation spectroscopy. J. Phys. D Appl. Phys. 2018, 51, 235401. [Google Scholar] [CrossRef]
  8. Spindler, S.; Ehrig, J.; König, K.; Nowak, T.; Piliarik, M.; Stein, H.E.; Taylor, R.W.; Garanger, E.; Lecommandoux, S.; Alves, I.D.; et al. Visualization of lipids and proteins at high spatial and temporal resolution via interferometric scattering (iSCAT) microscopy. J. Phys. D Appl. Phys. 2016, 49, 274002. [Google Scholar] [CrossRef]
  9. de Wit, G.; Danial, J.S.H.; Kukura, P.; Wallace, M.I. Dynamic label-free imaging of lipid nanodomains. Proc. Natl. Acad. Sci. USA 2015, 112, 12299–12303. [Google Scholar] [CrossRef]
  10. Taylor, R.W.; Mahmoodabadi, R.G.; Rauschenberger, V.; Giessl, A.; Schambony, A.; Sandoghdar, V. Interferometric scattering microscopy reveals microsecond nanoscopic protein motion on a live cell membrane. Nat. Photonics 2019, 13, 480–487. [Google Scholar] [CrossRef]
  11. Piliarik, M.; Sandoghdar, V. Direct optical sensing of single unlabelled proteins and super-resolution imaging of their binding sites. Nat. Commun. 2014, 5, 4495. [Google Scholar] [CrossRef]
  12. Gemeinhardt, A.; McDonald, M.P.; König, K.; Aigner, M.; Mackensen, A.; Sandoghdar, V. Label-Free Imaging of Single Proteins Secreted from Living Cells via iSCAT Microscopy. J. Vis. Exp. 2018, 141, e58486. [Google Scholar] [CrossRef]
  13. Heermann, T.; Steiert, F.; Ramm, B.; Hundt, N.; Schwille, P. Mass-sensitive particle tracking to elucidate the membrane-associated MinDE reaction cycle. Nat. Methods 2021, 18, 1239–1246. [Google Scholar] [CrossRef]
  14. Lin, Y.H.; Chang, W.L.; Hsieh, C.L. Shot-noise limited localization of single 20 nm gold particles with nanometer spatial precision within microseconds. Opt. Express 2014, 22, 9159. [Google Scholar] [CrossRef]
  15. Jacobsen, V.; Stoller, P.; Brunner, C.; Vogel, V.; Sandoghdar, V. Interferometric optical detection and tracking of very small gold nanoparticles at a water-glass interface. Opt. Express 2006, 14, 405. [Google Scholar] [CrossRef]
  16. Ortega Arroyo, J.; Andrecka, J.; Spillane, K.M.; Billington, N.; Takagi, Y.; Sellers, J.R.; Kukura, P. Label-Free, All-Optical Detection, Imaging, and Tracking of a Single Protein. Nano Lett. 2014, 14, 2065–2070. [Google Scholar] [CrossRef] [PubMed]
  17. Ortega Arroyo, J.; Cole, D.; Kukura, P. Interferometric scattering microscopy and its combination with single-molecule fluorescence imaging. Nat. Protoc. 2016, 11, 617–633. [Google Scholar] [CrossRef] [PubMed]
  18. Kashkanova, A.D.; Blessing, M.; Gemeinhardt, A.; Soulat, D.; Sandoghdar, V. Precision size and refractive index analysis of weakly scattering nanoparticles in polydispersions. Nat. Methods 2022, 19, 586–593. [Google Scholar] [CrossRef] [PubMed]
  19. Cole, D.; Young, G.; Weigel, A.; Sebesta, A.; Kukura, P. Label-Free Single-Molecule Imaging with Numerical-Aperture-Shaped Interferometric Scattering Microscopy. ACS Photonics 2017, 4, 211–216. [Google Scholar] [CrossRef]
  20. Liebel, M.; Hugall, J.T.; van Hulst, N.F. Ultrasensitive Label-Free Nanosensing and High-Speed Tracking of Single Proteins. Nano Lett. 2017, 17, 1277–1281. [Google Scholar] [CrossRef]
  21. Hsiao, Y.T.; Tsai, C.N.; Chen, T.H.; Hsieh, C.L. Label-Free Dynamic Imaging of Chromatin in Live Cell Nuclei by High-Speed Scattering-Based Interference Microscopy. ACS Nano 2021, 16, 2774–2788. [Google Scholar] [CrossRef]
  22. Meng, X.; Sonn-Segev, A.; Schumacher, A.; Cole, D.; Young, G.; Thorpe, S.; Style, R.W.; Dufresne, E.R.; Kukura, P. Micromirror Total Internal Reflection Microscopy for High-Performance Single Particle Tracking at Interfaces. ACS Photonics 2021, 8, 3111–3118. [Google Scholar] [CrossRef]
  23. Robert, H.M.L.; Holanová, K.; Bujak, L.; Vala, M.; Henrichs, V.; Lánský, Z.; Piliarik, M. Fast photothermal spatial light modulation for quantitative phase imaging at the nanoscale. Nat. Commun. 2021, 12, 2921. [Google Scholar] [CrossRef]
  24. Tae Kim, J.; Spindler, S.; Sandoghdar, V. Scanning-aperture trapping and manipulation of single charged nanoparticles. Nat. Commun. 2014, 5, 3380. [Google Scholar] [CrossRef]
  25. Becker, J.; Peters, J.S.; Crooks, I.; Helmi, S.; Synakewicz, M.; Schuler, B.; Kukura, P. A Quantitative Description for Optical Mass Measurement of Single Biomolecules. ACS Photonics 2023, 10, 2699–2710. [Google Scholar] [CrossRef] [PubMed]
  26. Cheng, C.Y.; Hsieh, C.L. Background Estimation and Correction for High-Precision Localization Microscopy. ACS Photonics 2017, 4, 1730–1739. [Google Scholar] [CrossRef]
  27. Dahmardeh, M.; Mirzaalian Dastjerdi, H.; Mazal, H.; Köstler, H.; Sandoghdar, V. Self-supervised machine learning pushes the sensitivity limit in label-free detection of single proteins below 10 kDa. Nat. Methods 2023, 20, 442–447. [Google Scholar] [CrossRef]
  28. Mei, J.; Pei, Y.; Zakharov, Y.; Sun, D.; Ma, C. Improved underwater acoustic imaging with nonuniform spatial resampling RL deconvolution. IET Radar Sonar Navig. 2020, 14, 1697–1707. [Google Scholar] [CrossRef]
  29. Sakai, Y.; Yamada, S.; Sato, T.; Hayakawa, R.; Higurashi, R.; Kominato, N. Richardson–Lucy Deconvolution with a Spatially Variant Point-spread Function of Chandra: Supernova Remnant Cassiopeia A as an Example. Astrophys. J. 2023, 951, 59. [Google Scholar] [CrossRef]
  30. Lal, A.; Shan, C.; Xi, P. Structured Illumination Microscopy Image Reconstruction Algorithm. IEEE J. Sel. Top. Quantum Electron. 2016, 22, 50–63. [Google Scholar] [CrossRef]
  31. Buades, A.; Coll, B.; Morel, J.M. Nonlocal Image and Movie Denoising. Int. J. Comput. Vis. 2007, 76, 123–139. [Google Scholar] [CrossRef]
  32. Liu, Z.; Wang, S.; Zhang, M. Improved Sparse 3D Transform-Domain Collaborative Filter for Screen Content Image Denoising. Int. J. Pattern Recognit. Artif. Intell. 2017, 32, 1854006. [Google Scholar] [CrossRef]
Figure 1. Deconvolution results of iSCAT images. (a) Raw image of GNP with diameter of 10 nm; (b) deconvoluted image of the corresponding particle; (c) cross-line intensity profiles of the particle and its side lobes in Figure (a); (d) cross-line intensity profiles of the particle and its side lobes in Figure (b); (e) optical setup and a simulated particle image colored in green background; polarizing beam splitter (PBS), half-wave plate ( λ /2) and quarter-wave plate ( λ /4) were applied to separate the incident light and the detect light, a single mode fiber-coupled laser was applied here. The scale bar is 1 μm.
Photonics 12 00795 g001
Figure 2. Comparisons of the raw image and deconvoluted results with Wiener, RL, Wiener-assisted RL and SF method. (a) Raw image; (b) deconvoluted image with Wiener method; (c) deconvoluted image with RL method; (d) deconvoluted image with Wiener-assisted RL method; (e) deconvoluted image with SF method; (fj) particles’ intensity and background intensity along the cross-lines in (ae) along the solid-colored lines; (ko) frequency of components corresponding to (ae), the line profiles in the bottom of the image denote the intensity distribution along with the dotted lines. The scale bar is 5 μm.
Photonics 12 00795 g002
Figure 3. Particles’ contrast comparison in the raw image and in the deconvoluted results with Wiener, RL, Wiener-assisted RL and SF method. (a) Linear enhancement of the deconvoluted contrast compared to that in the raw image; (b) particles’ contrast distribution calculated from the raw image; (c) particles’ contrast distribution calculated from the Wiener deconvoluted image; (d) particles’ contrast distribution calculated from the RL deconvoluted image; (e) particles’ contrast distribution calculated from the Wiener-assisted RL deconvoluted image; (f) particles’ contrast distribution calculated from the SF-deconvoluted image.
Photonics 12 00795 g003
Figure 4. Particles’ localization comparison in the raw image and in the deconvoluted results with Wiener, RL, Wiener-assisted RL and SF method. (ae) Axial localization errors of particles in the raw image and in the deconvoluted images with Wiener, RL, Wiener-assisted RL and SF method; (fj) histogram and fitting of the absolute localization errors for the raw image and in the deconvoluted images with Wiener, RL, Wiener-assisted RL and SF method.
Photonics 12 00795 g004
Figure 5. Comparisons of denoising and deconvolution algorithms. (ae) Particles in the raw image and in the deconvoluted images with Wiener, RL, Wiener-assisted RL and SF method; (fj) particles in the image after NLM denoising applied in the raw image and in the deconvoluted images with Wiener, RL, Wiener-assisted RL and SF method; (ko) particles in the image after BM3D denoising applied in the raw image and in the deconvoluted images with Wiener, RL, Wiener-assisted RL and SF method; (p) the denoised signal intensity along cut-lines in Figure (a,f,k); (q) the denoised signal intensity after Wiener deconvolution along cut-lines in Figure (b,g,l); (r) the denoised signal intensity after RL deconvolution along cut-lines in Figure (c,h,m); (s) the denoised signal intensity after Wiener and RL deconvolution along cut-lines in Figure (d,i,n); (t) the denoised signal intensity after SF deconvolution along cut-lines in Figure (e,j,o); (u) the denoised background intensity along cut-lines in Figure (a,f,k); (v) the denoised background intensity after Wiener deconvolution along cut-lines in Figure (b,g,l); (w) the denoised background intensity after RL deconvolution along cut-lines in Figure (c,h,m); (x) the denoised background intensity after Wiener and RL deconvolution along cut-lines in Figure (d,i,n); (y) the denoised background intensity after SF deconvolution along cut-lines in Figure (e,j,o).
Photonics 12 00795 g005
Disclaimer/Publisher’s Note: The statements, opinions and data contained in all publications are solely those of the individual author(s) and contributor(s) and not of MDPI and/or the editor(s). MDPI and/or the editor(s) disclaim responsibility for any injury to people or property resulting from any ideas, methods, instructions or products referred to in the content.