Line Laser 3D Measurement Method and Experiments of Gears


Abstract
1. Introduction
2. Line Laser 3D Measurement Model of Gears
3. Calibration of Pose Parameters for Line Laser Sensors
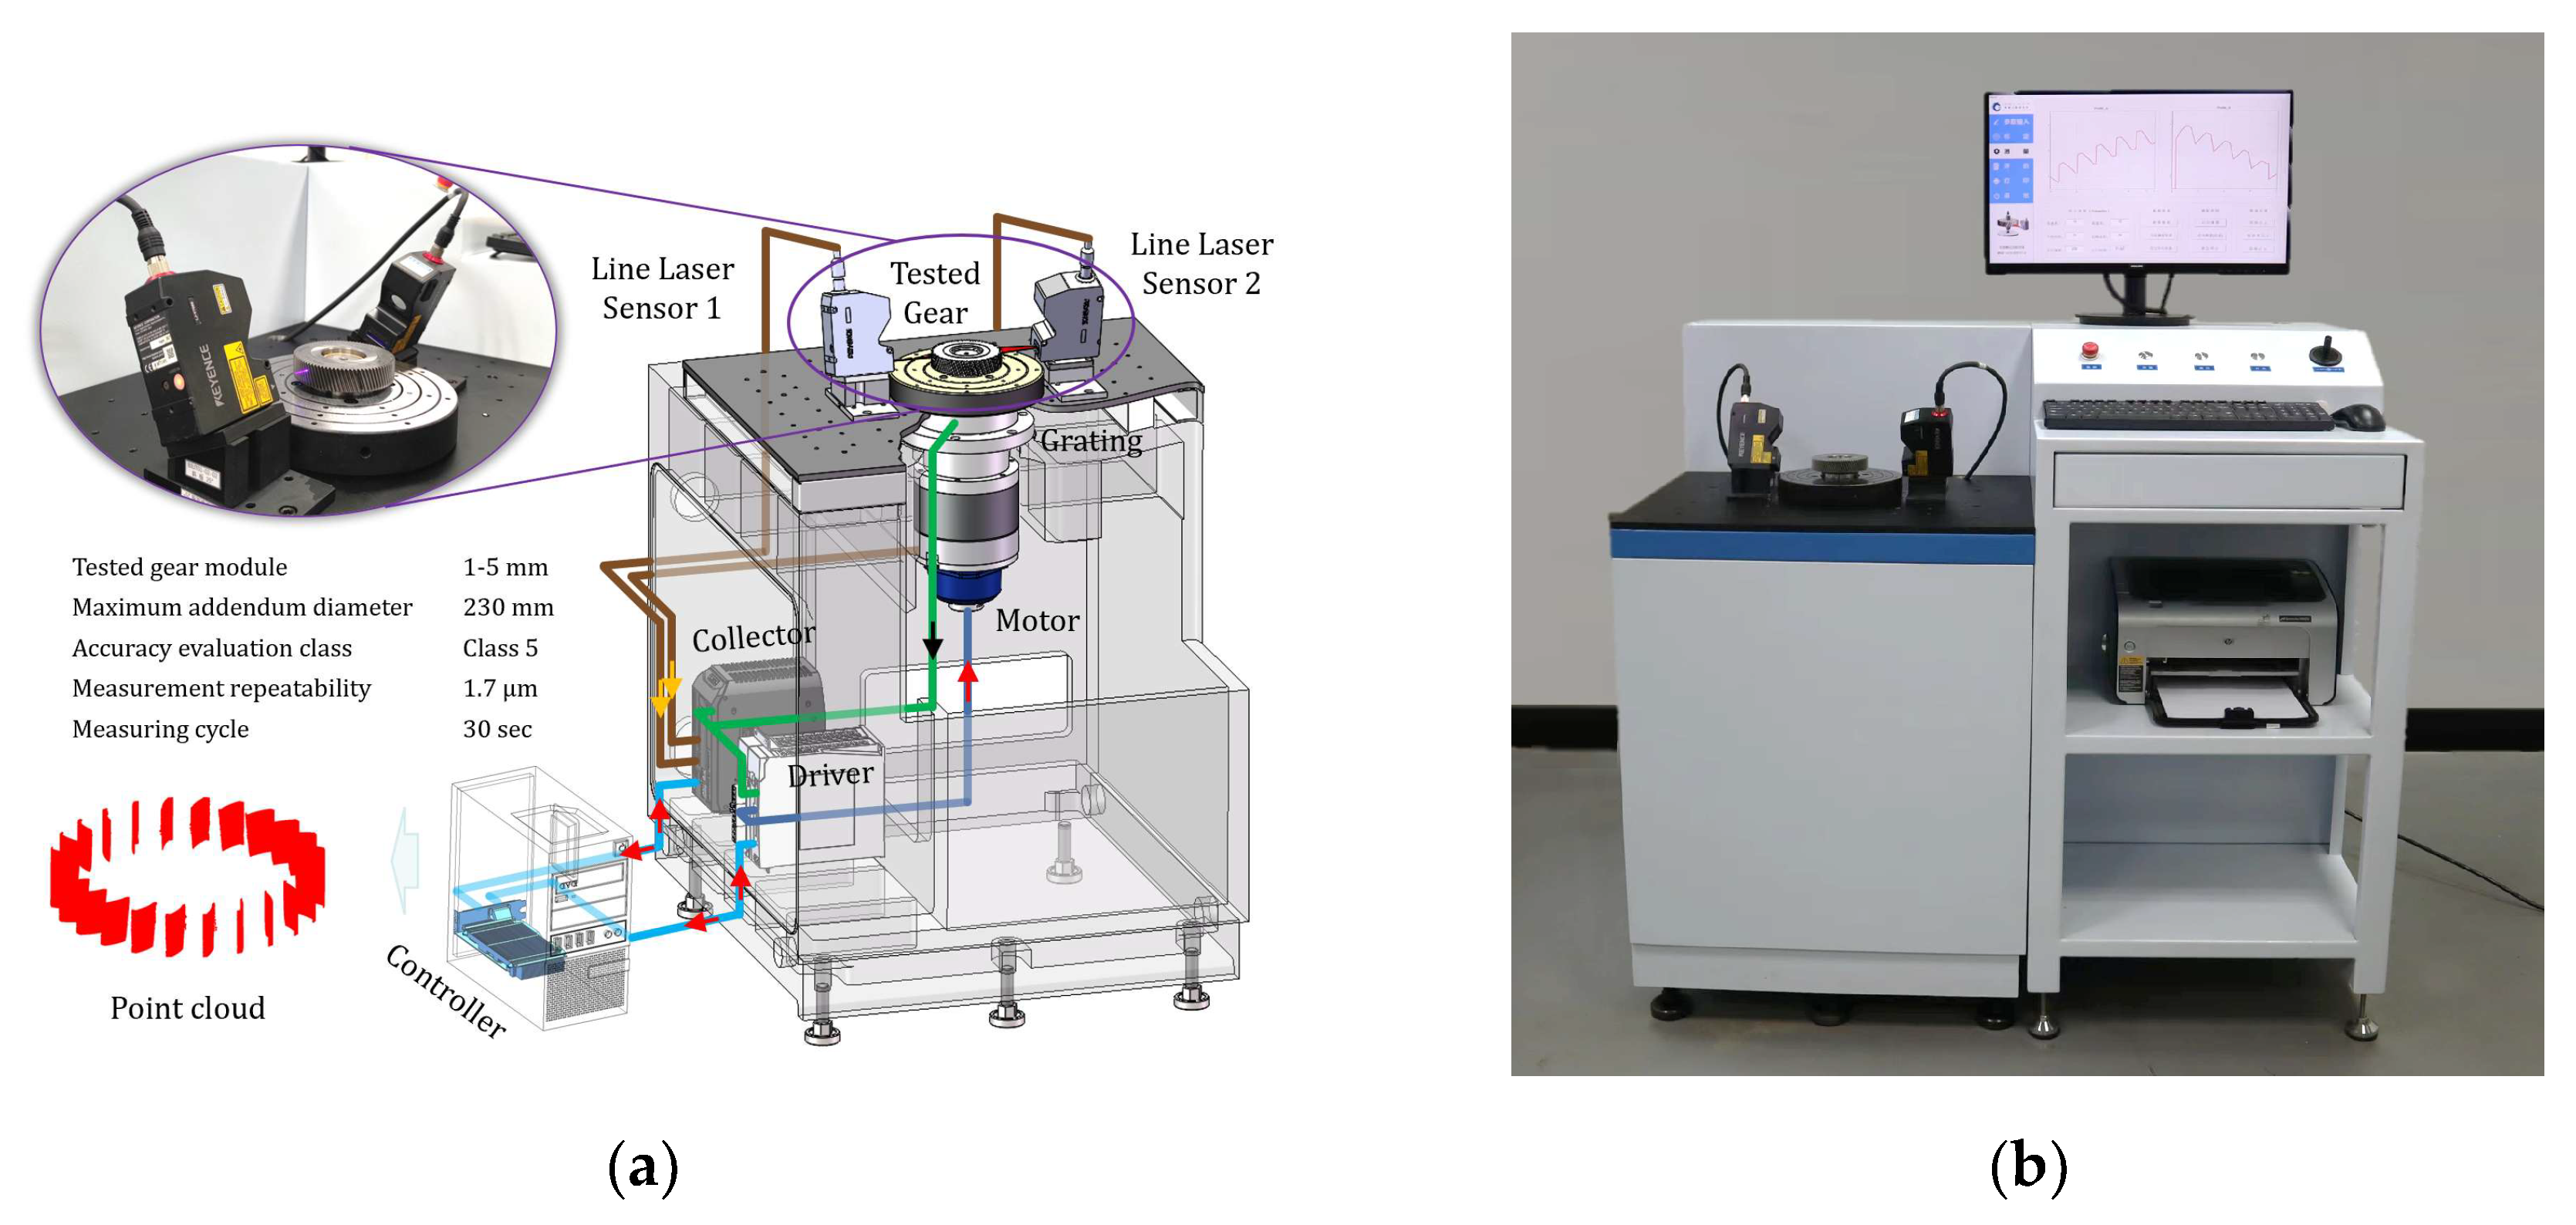
4. Line Laser 3D Measurement Instrument of Gears
5. Experiment and Discussion
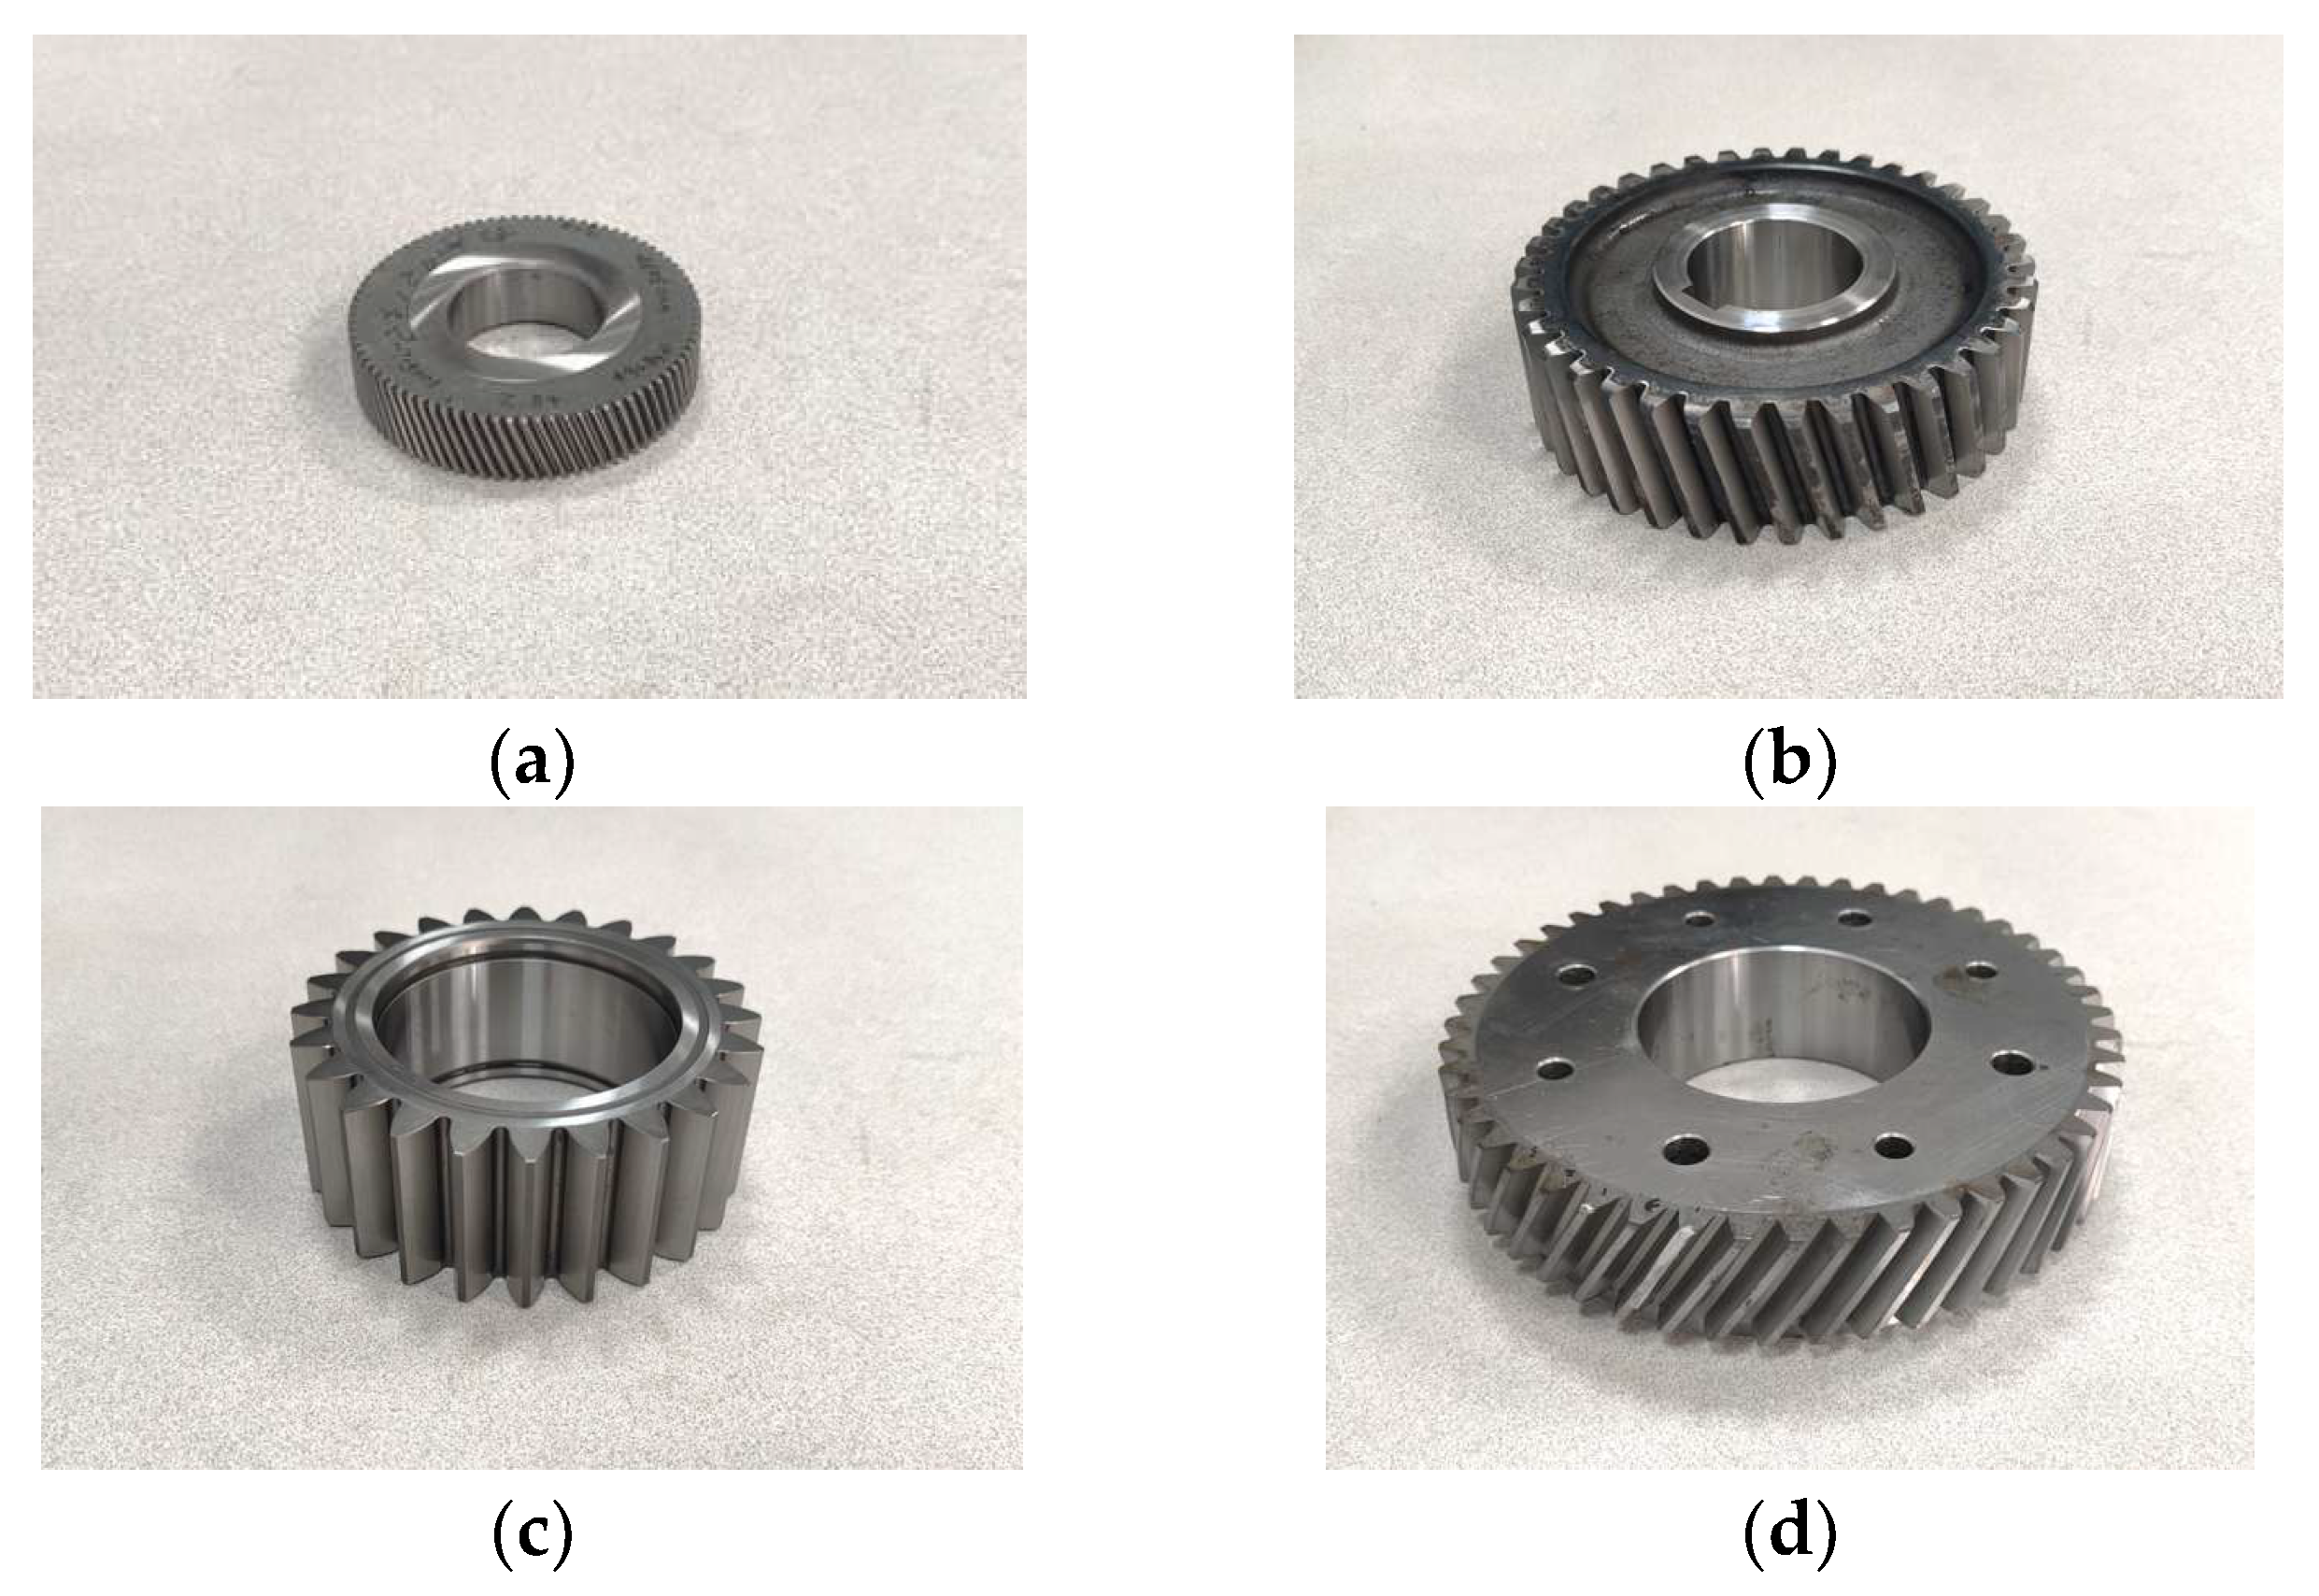
5.1. Tested Gears and Line Laser Sensors
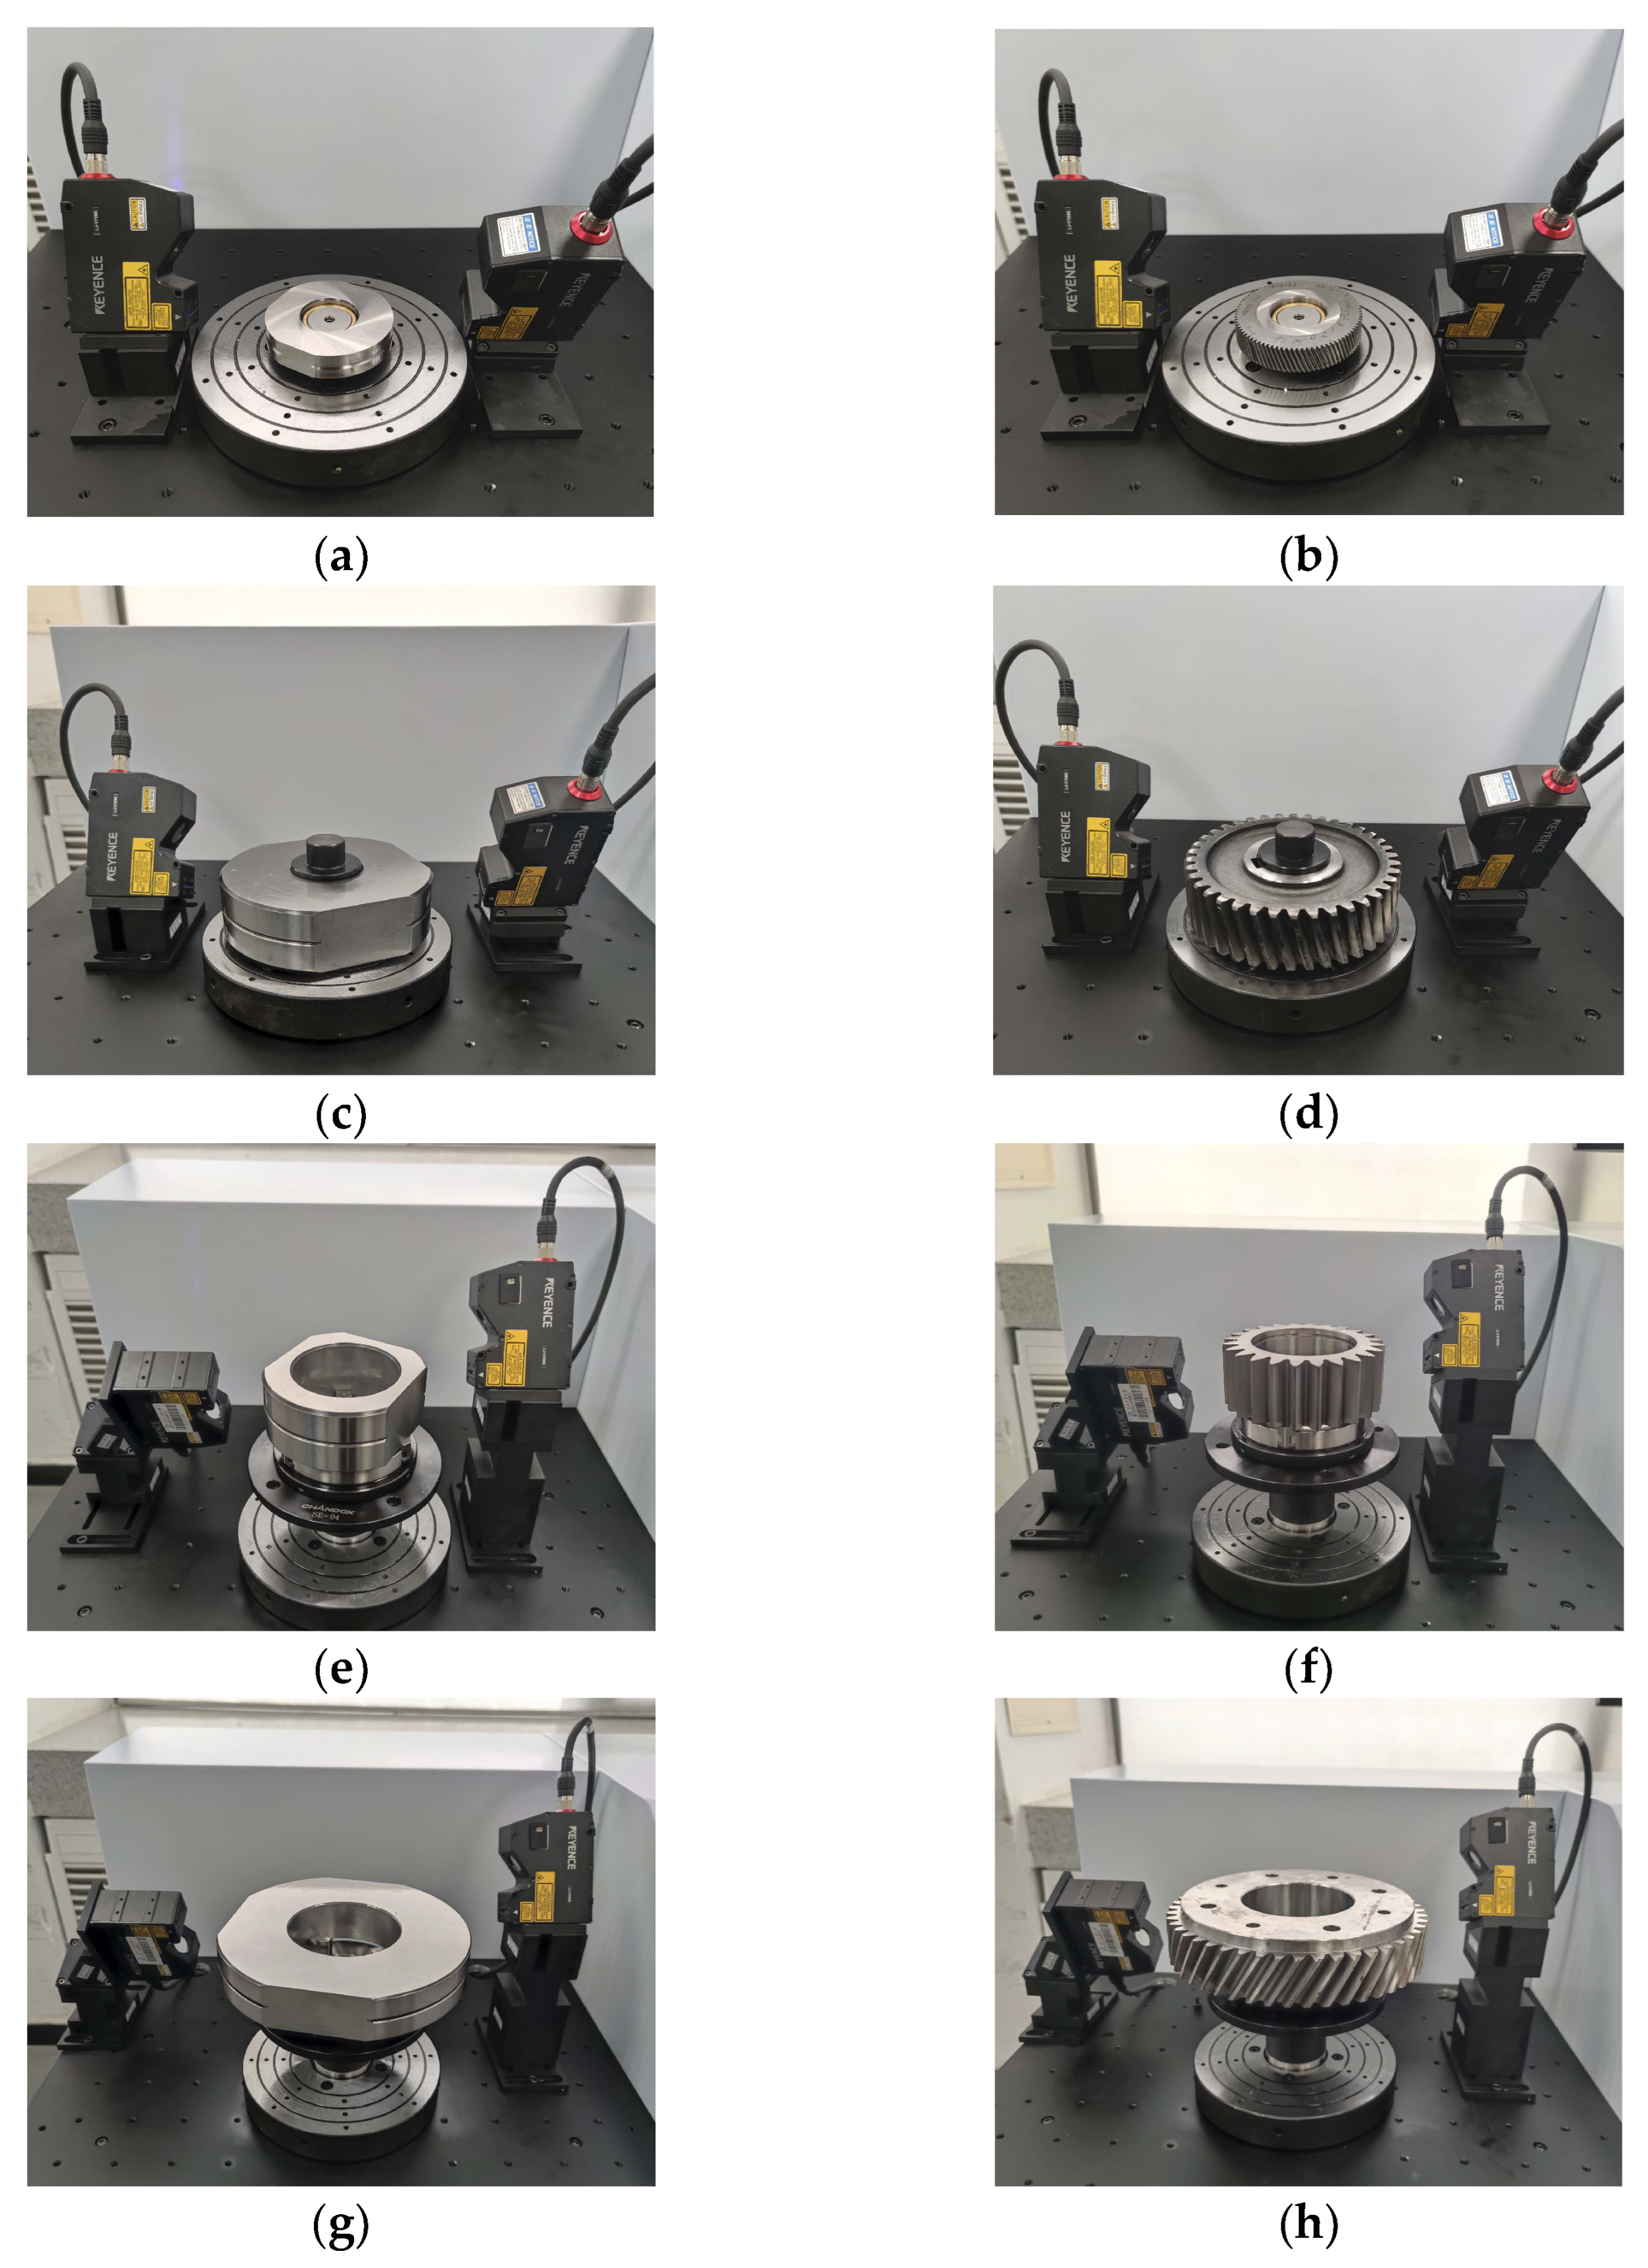
5.2. Sensor Calibration and Measurement Process
5.3. Discussion on Experimental Results
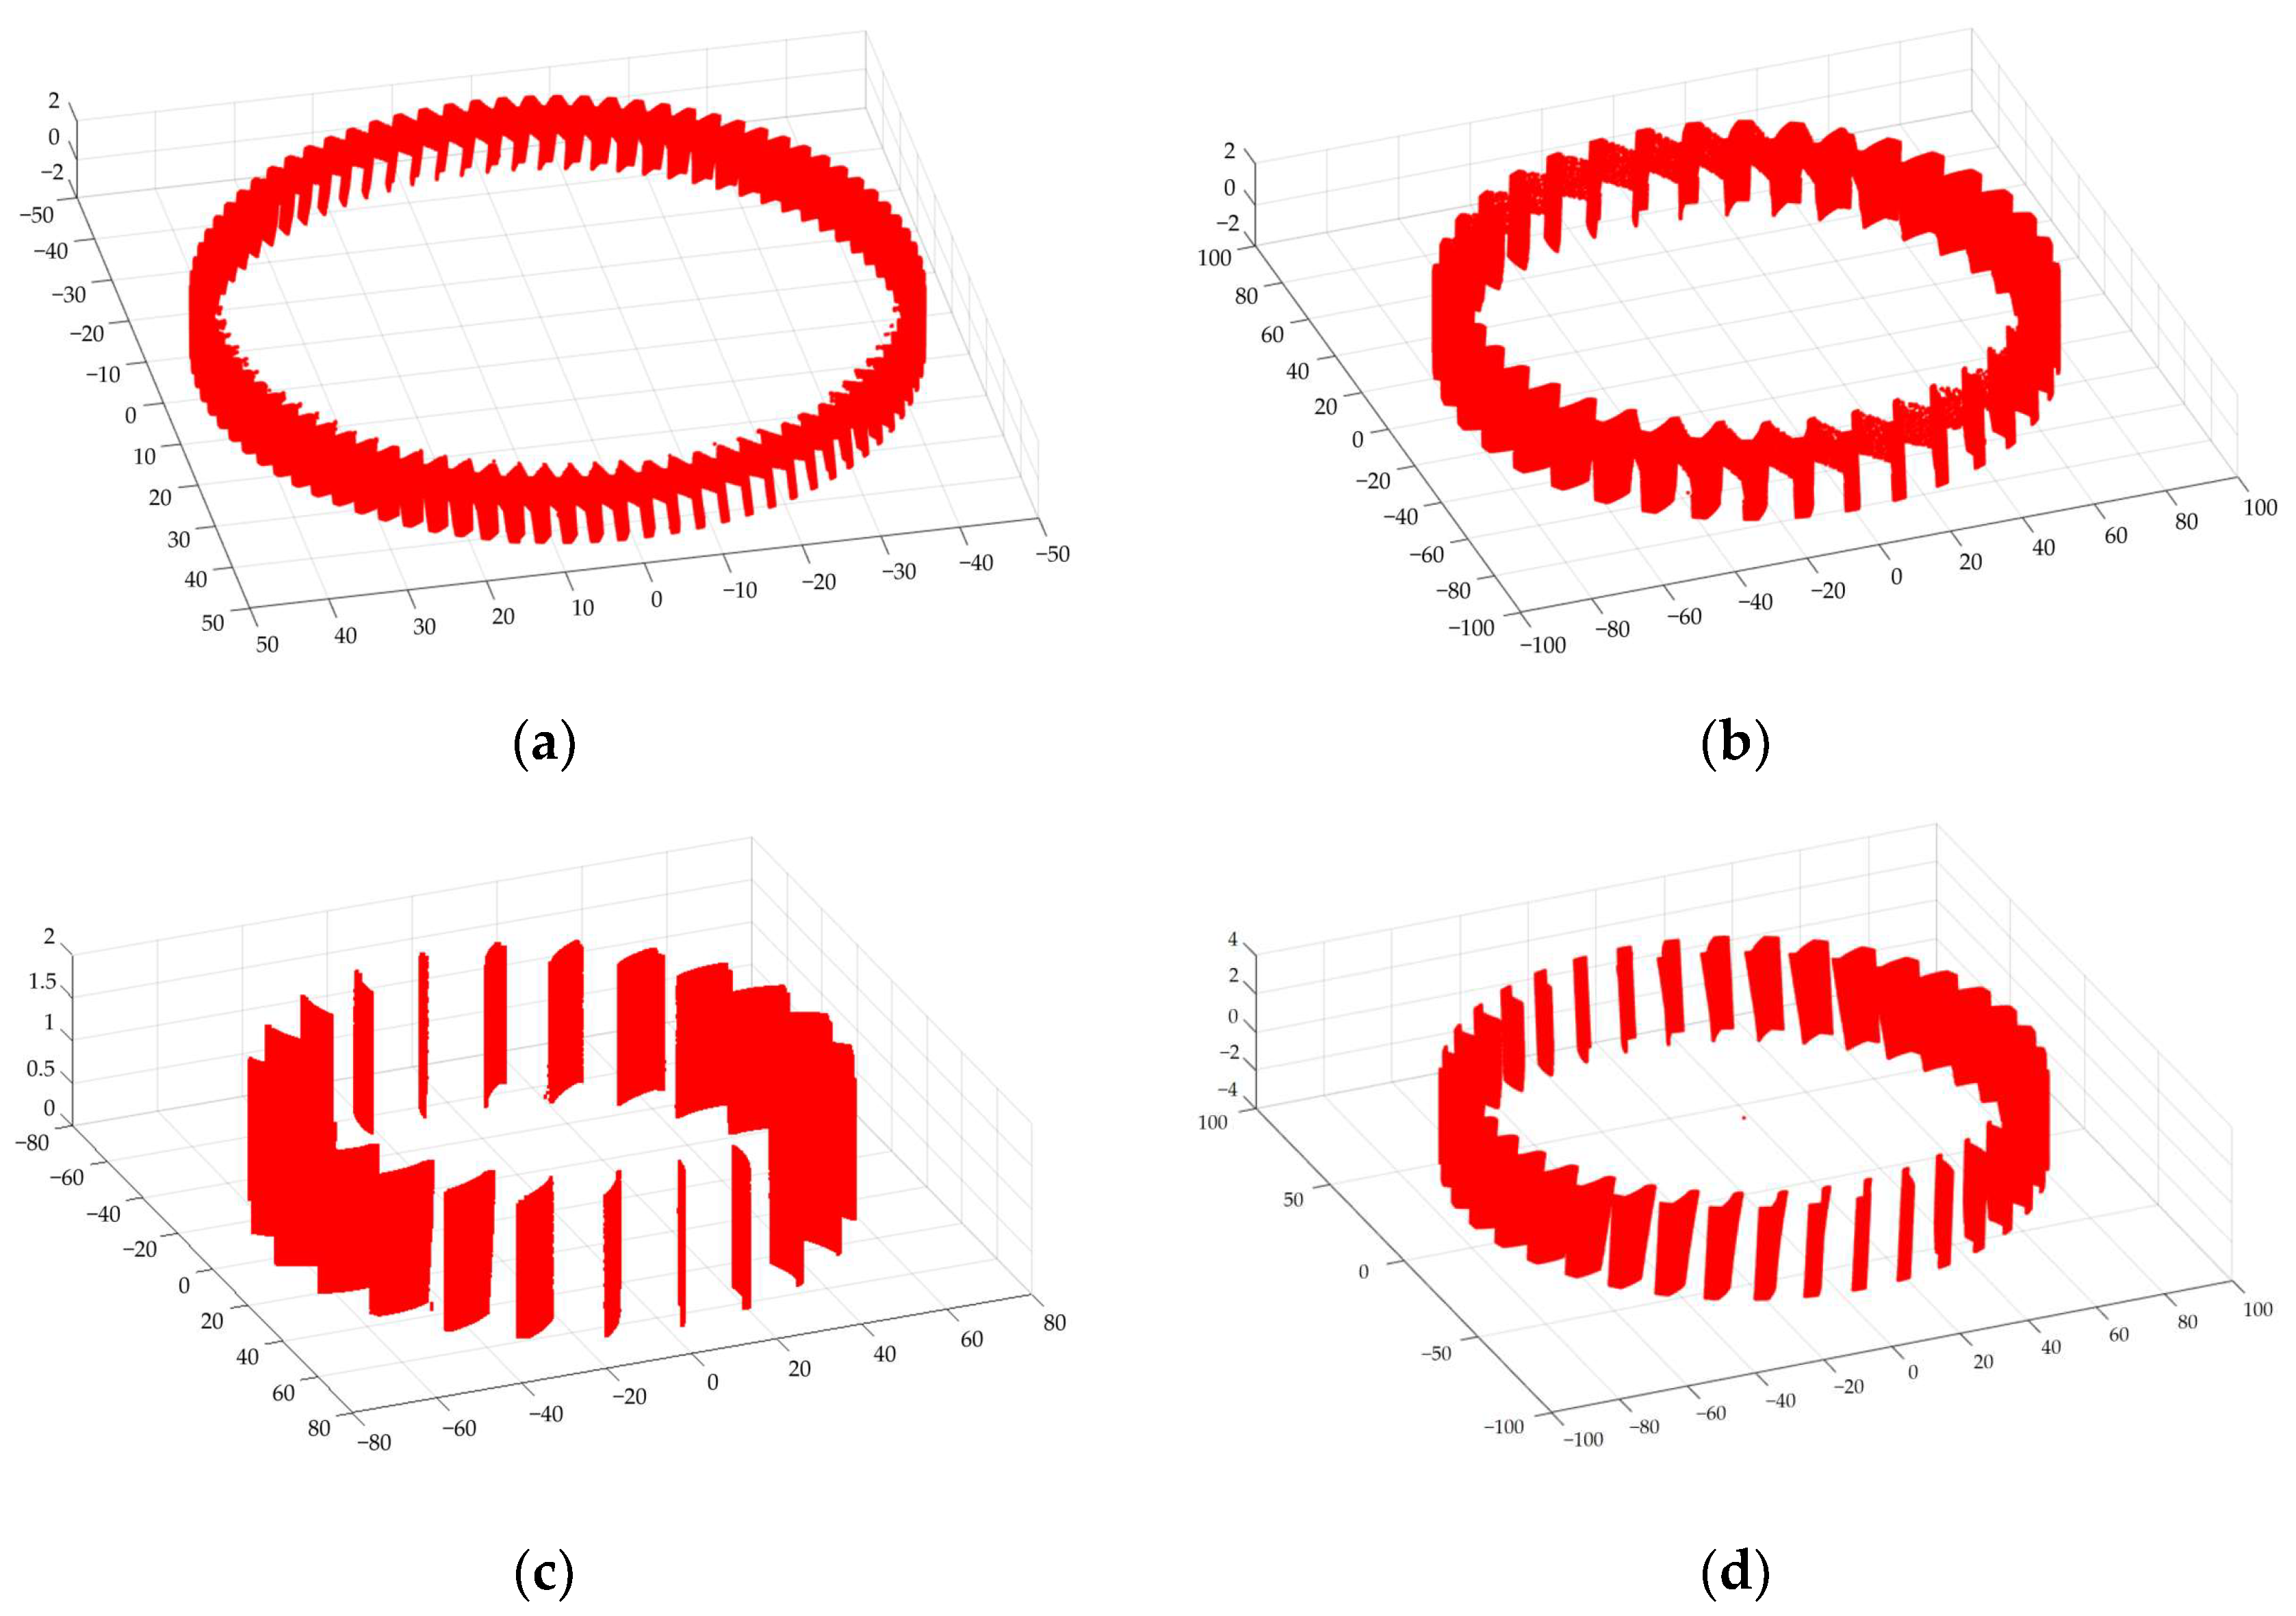
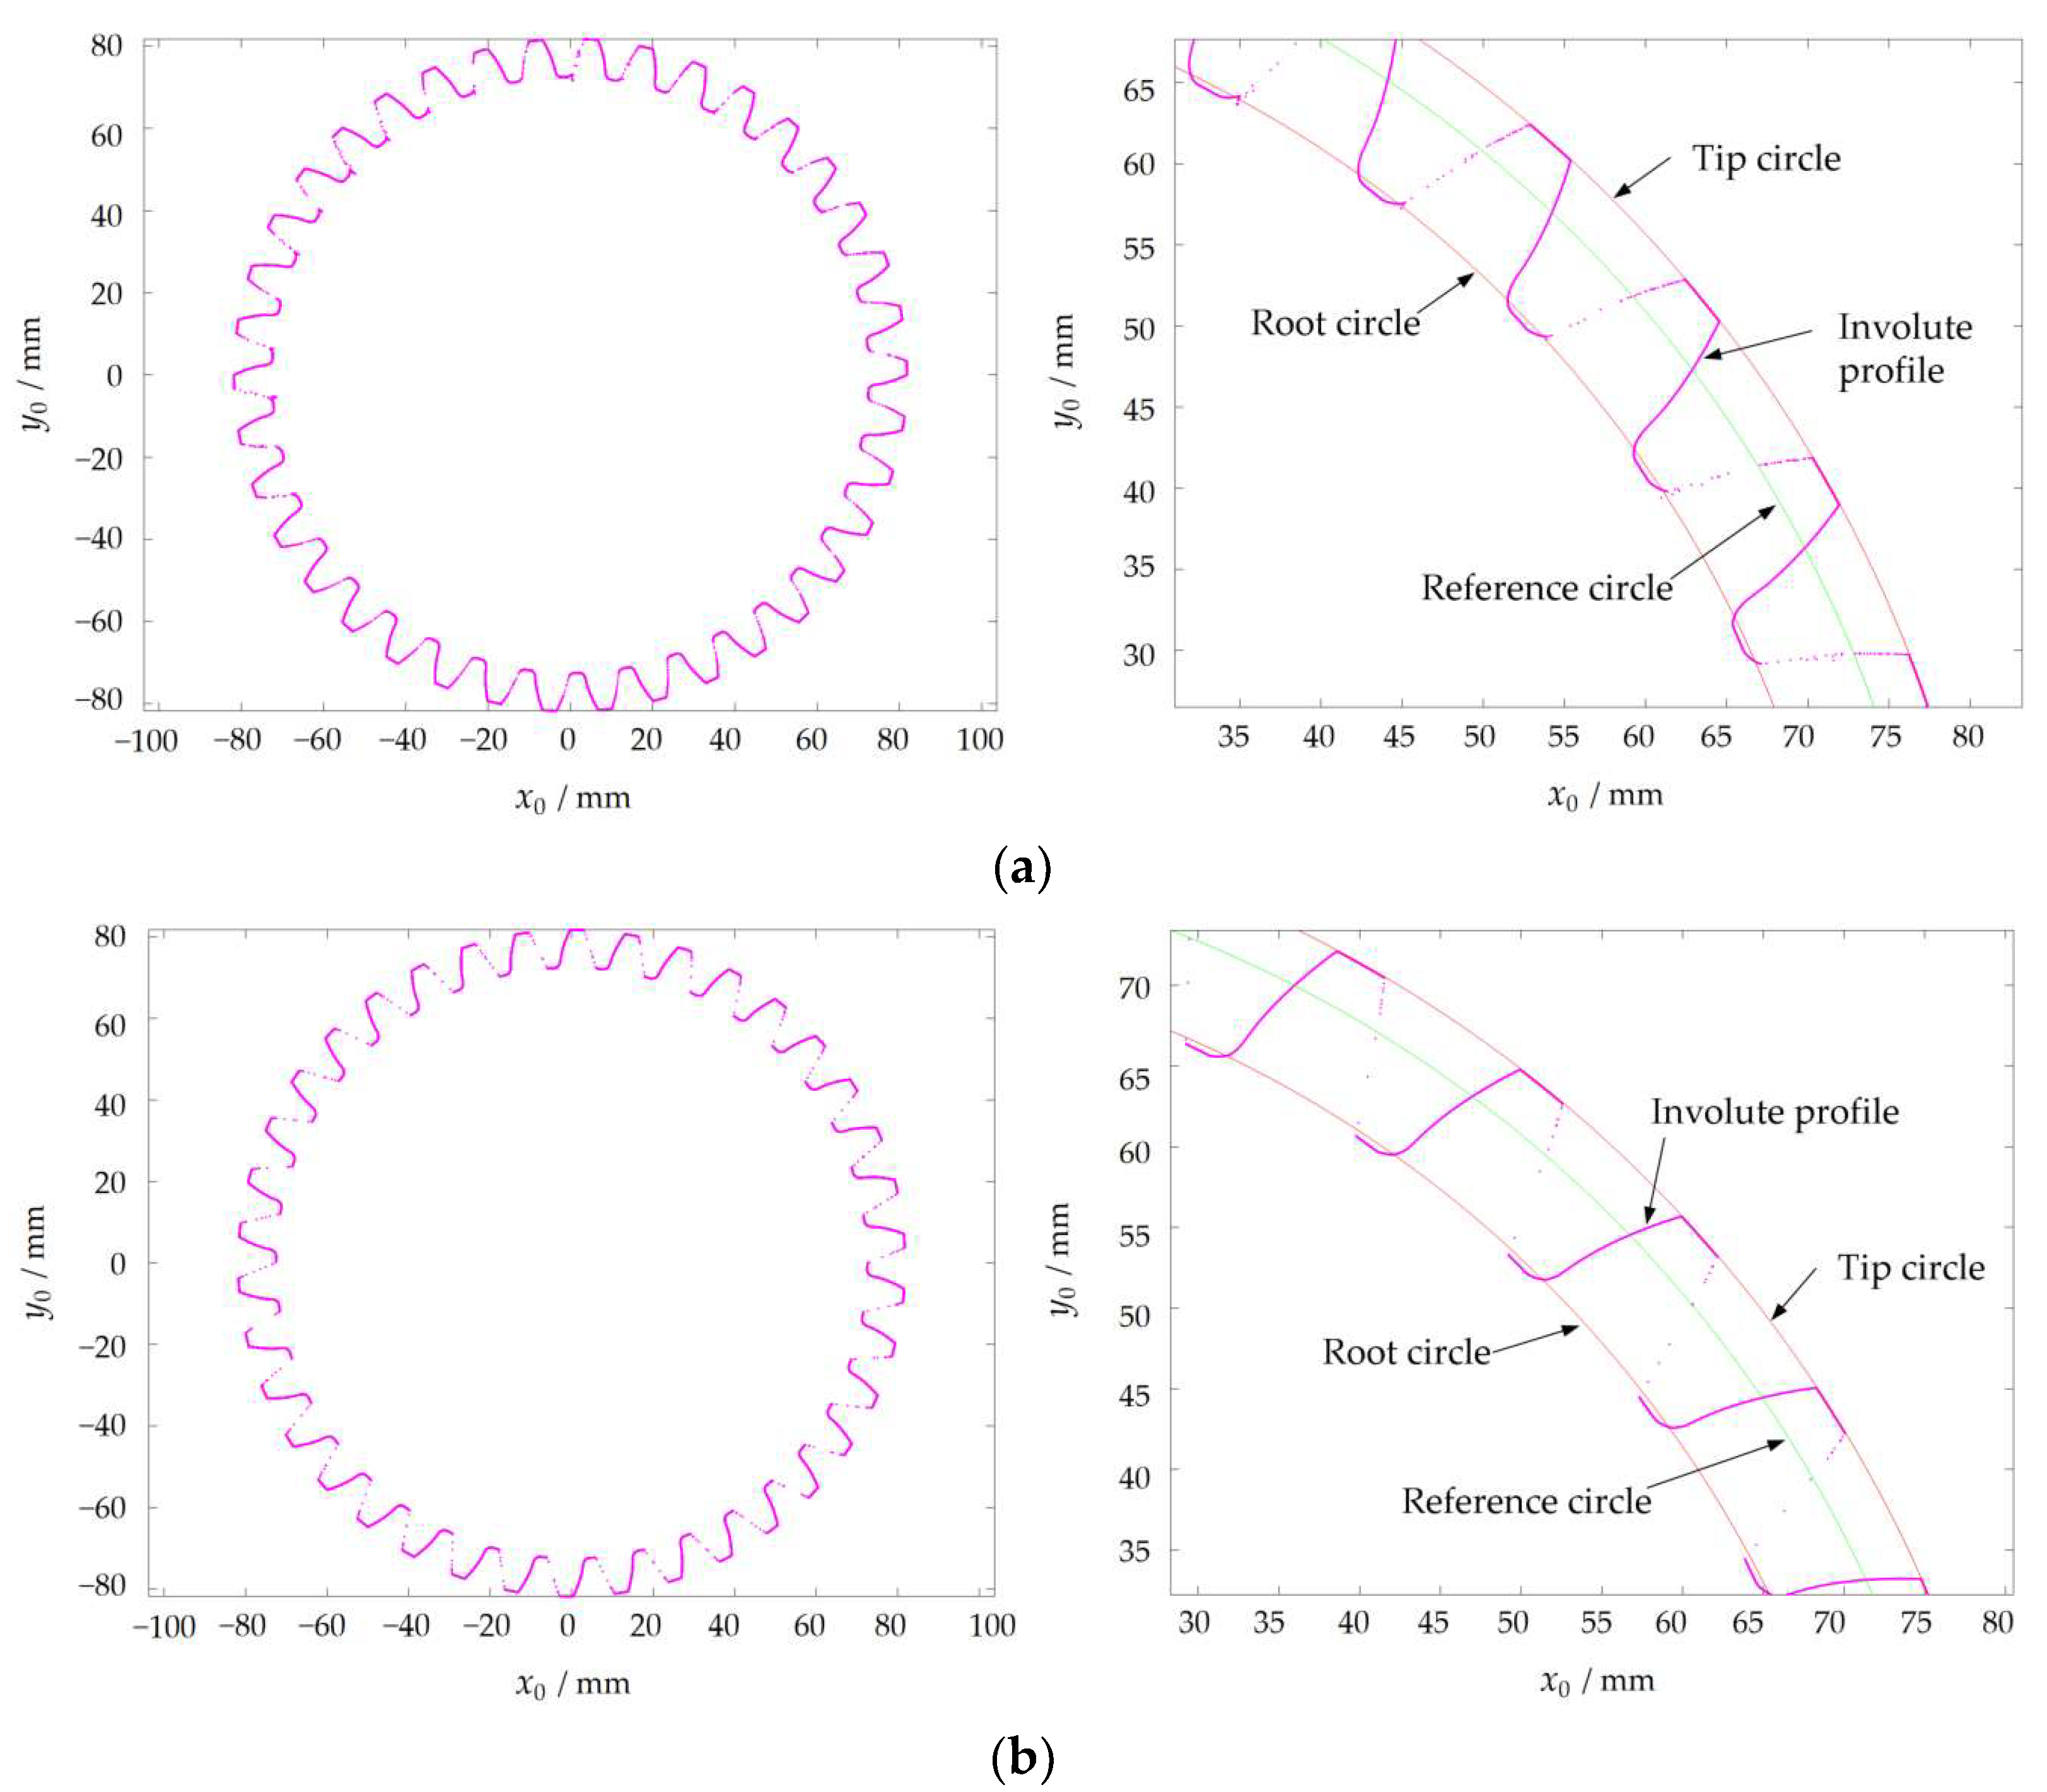
5.3.1. Raw Data of 3D Tooth Surface
5.3.2. Measurement Repeatability Analysis
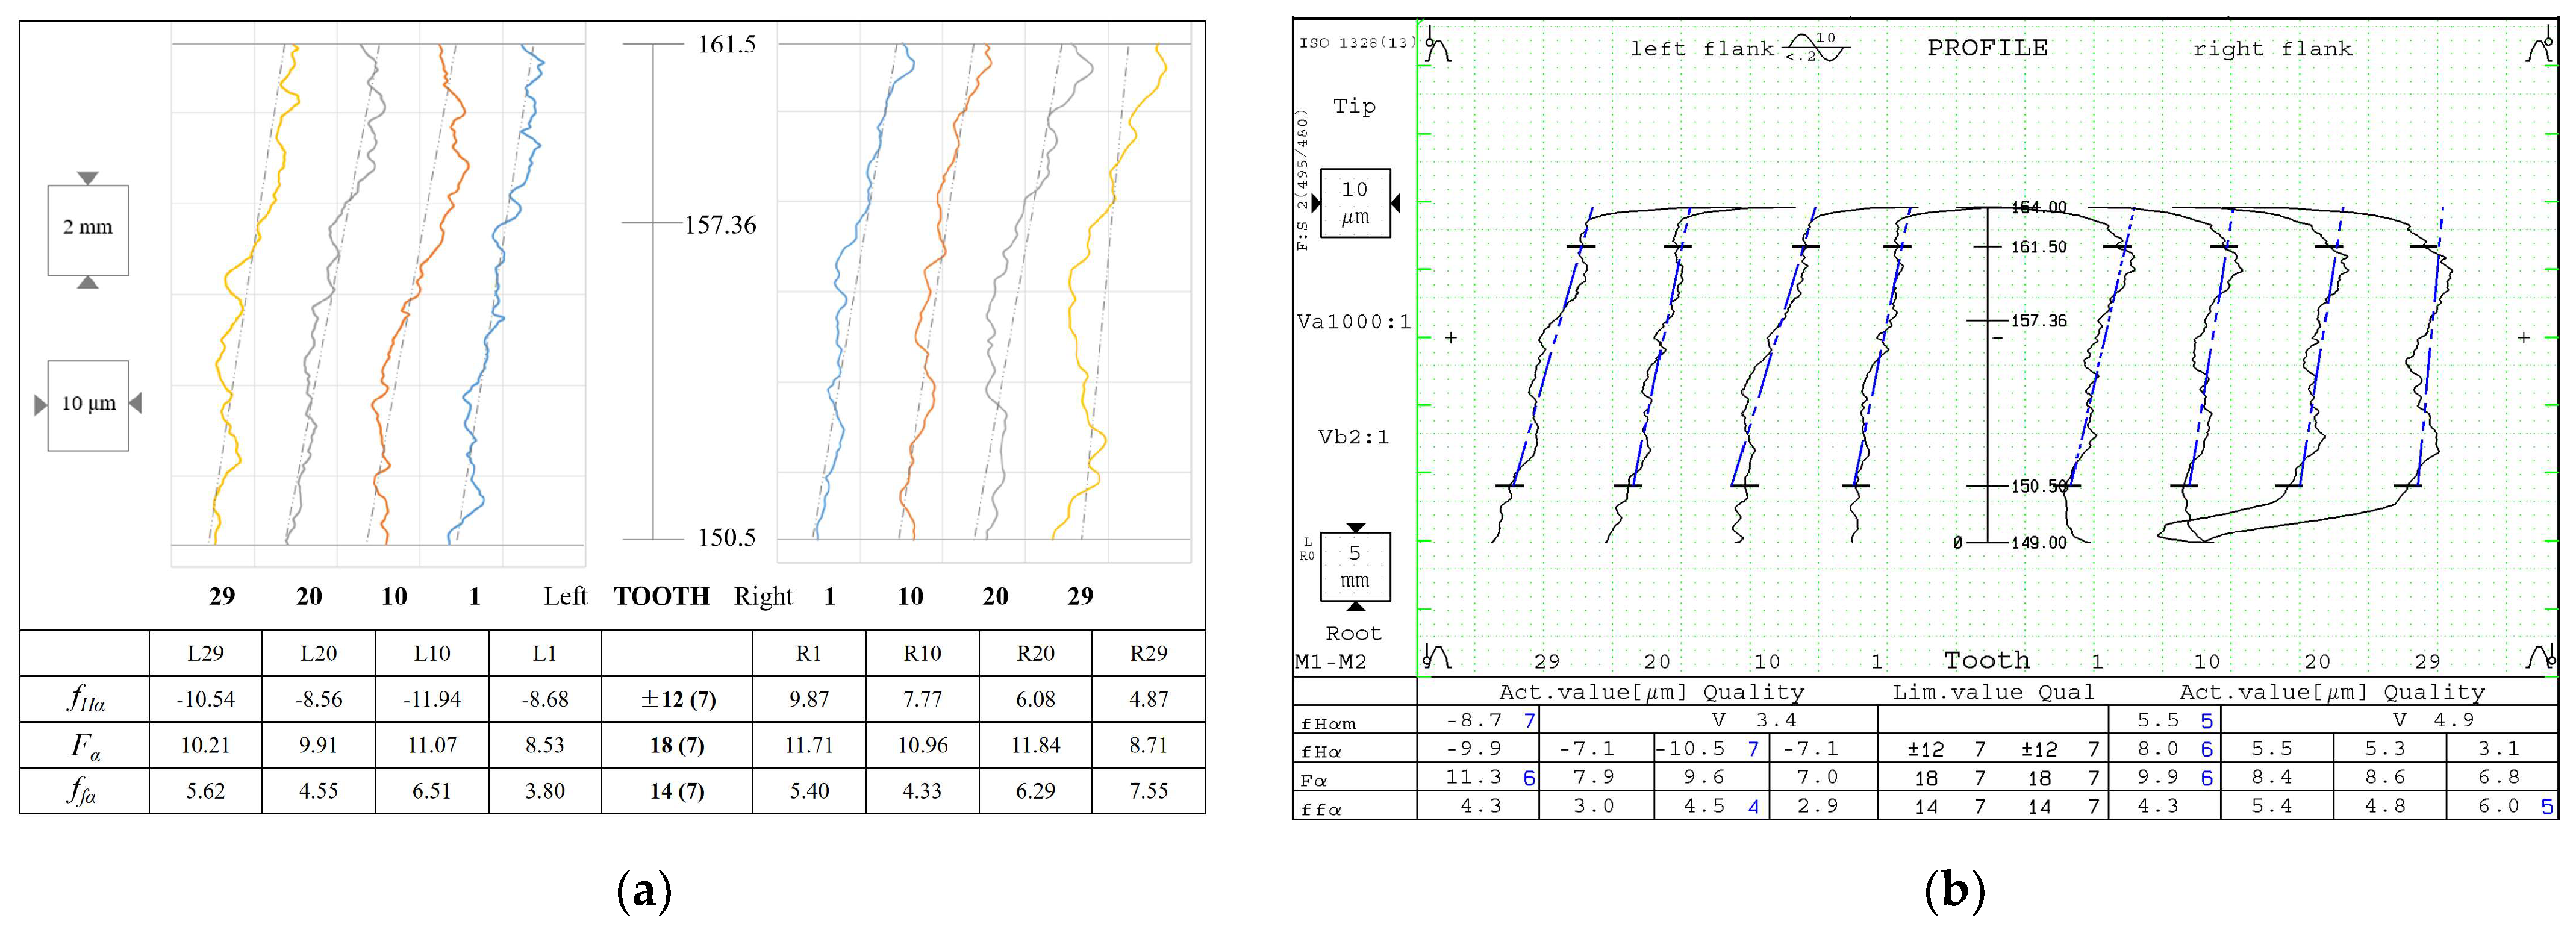
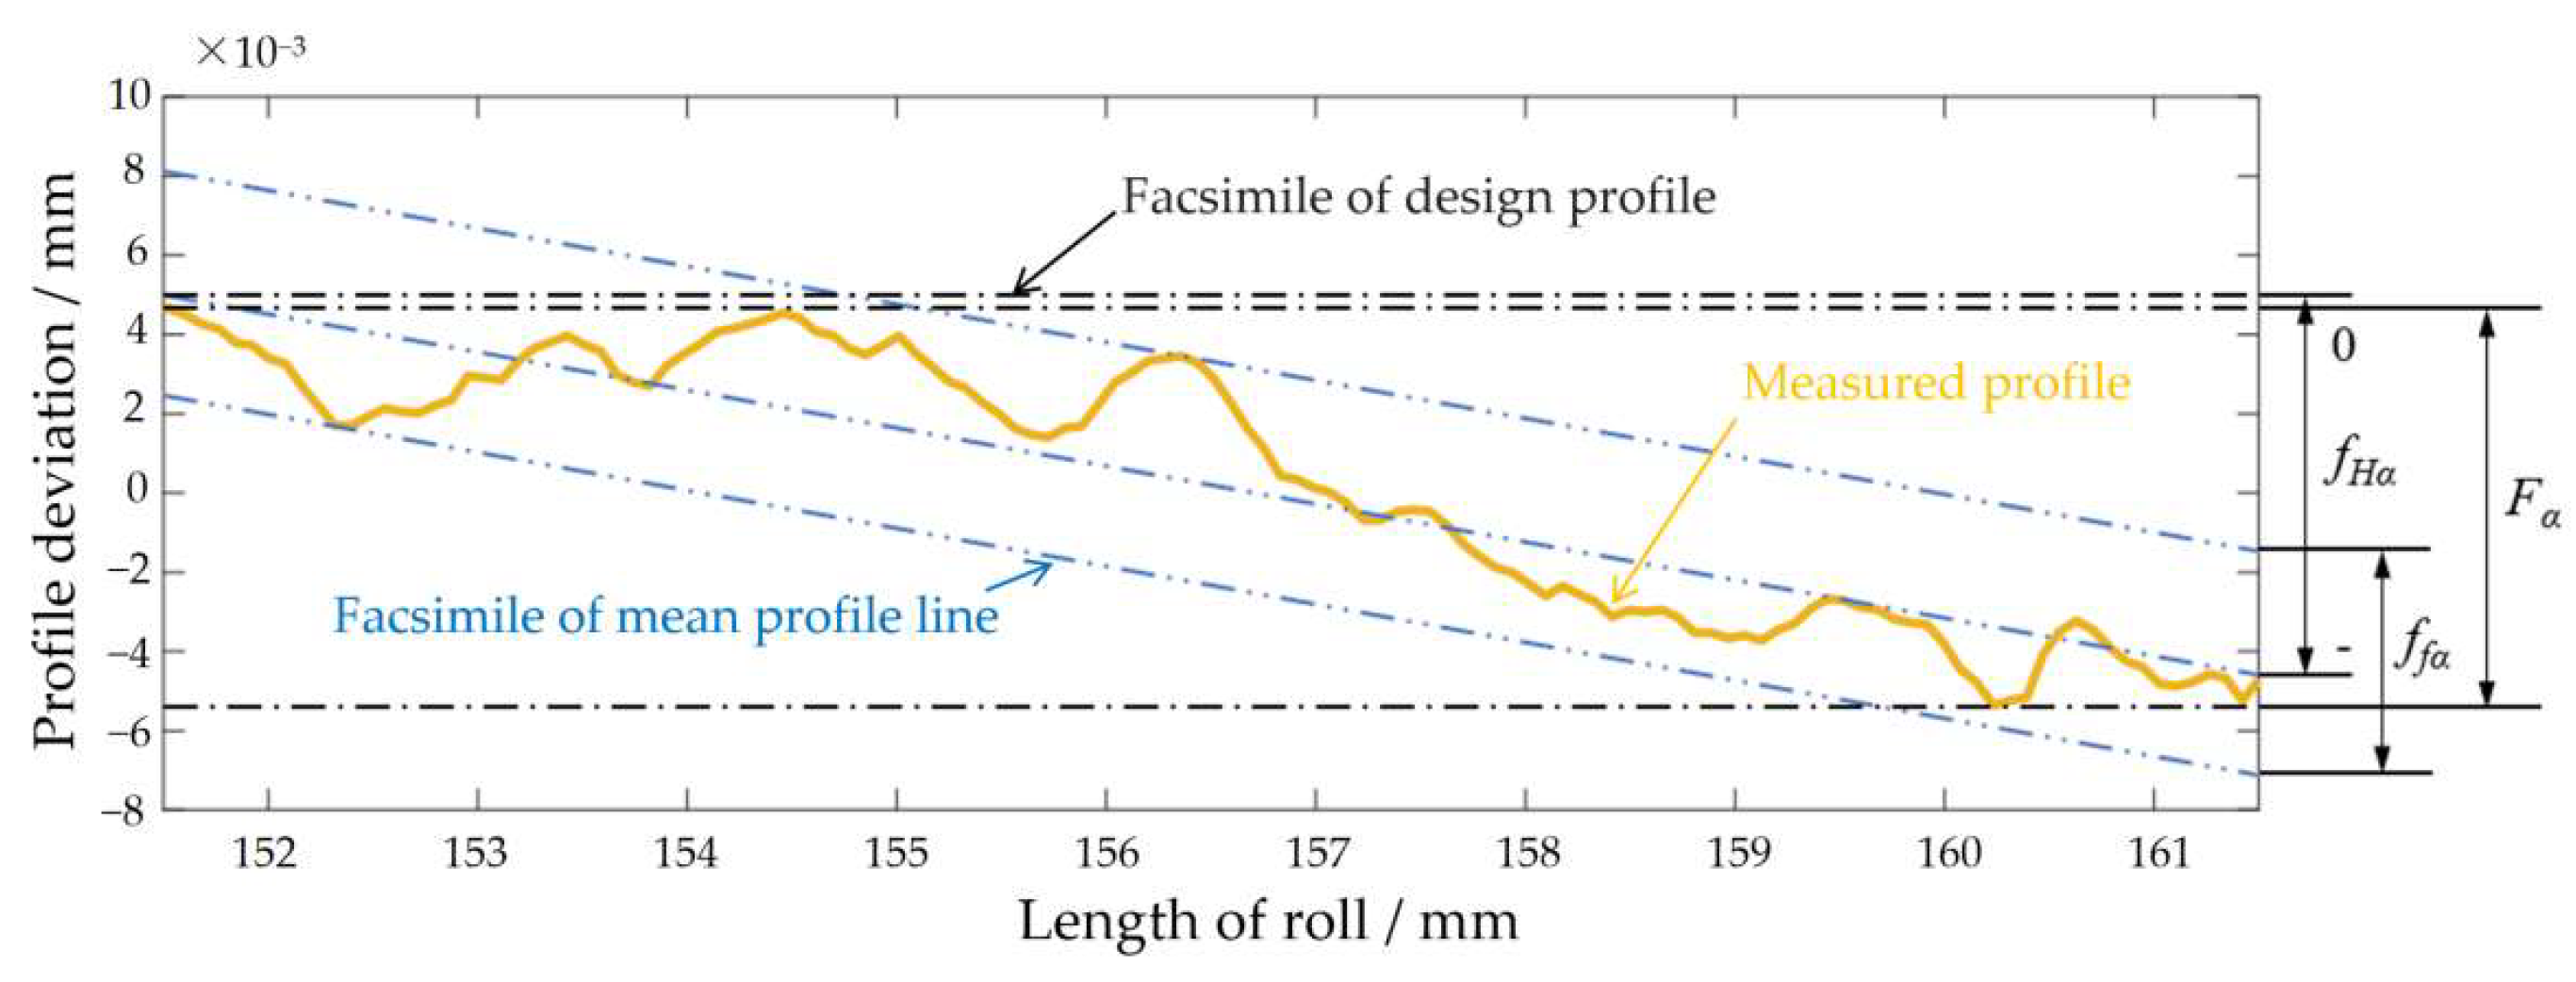
5.3.3. Accuracy Inspection of 3D Tooth Surface
- Profile Deviation.
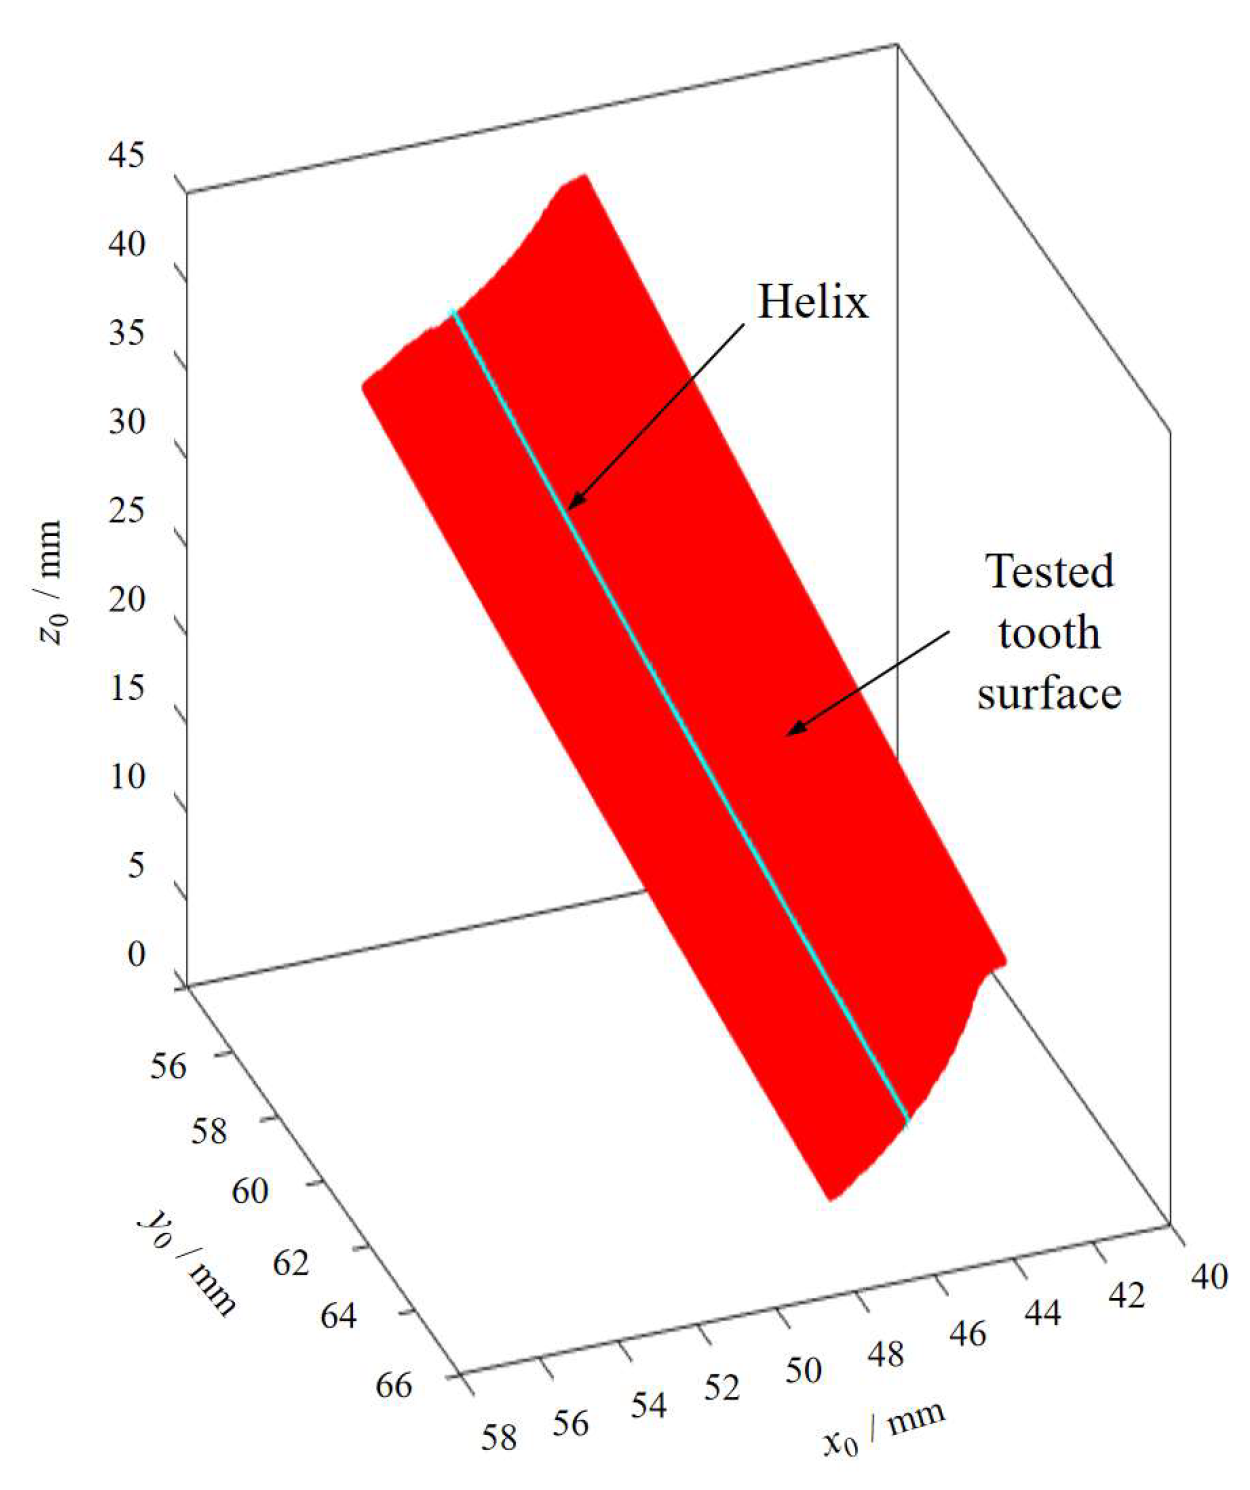
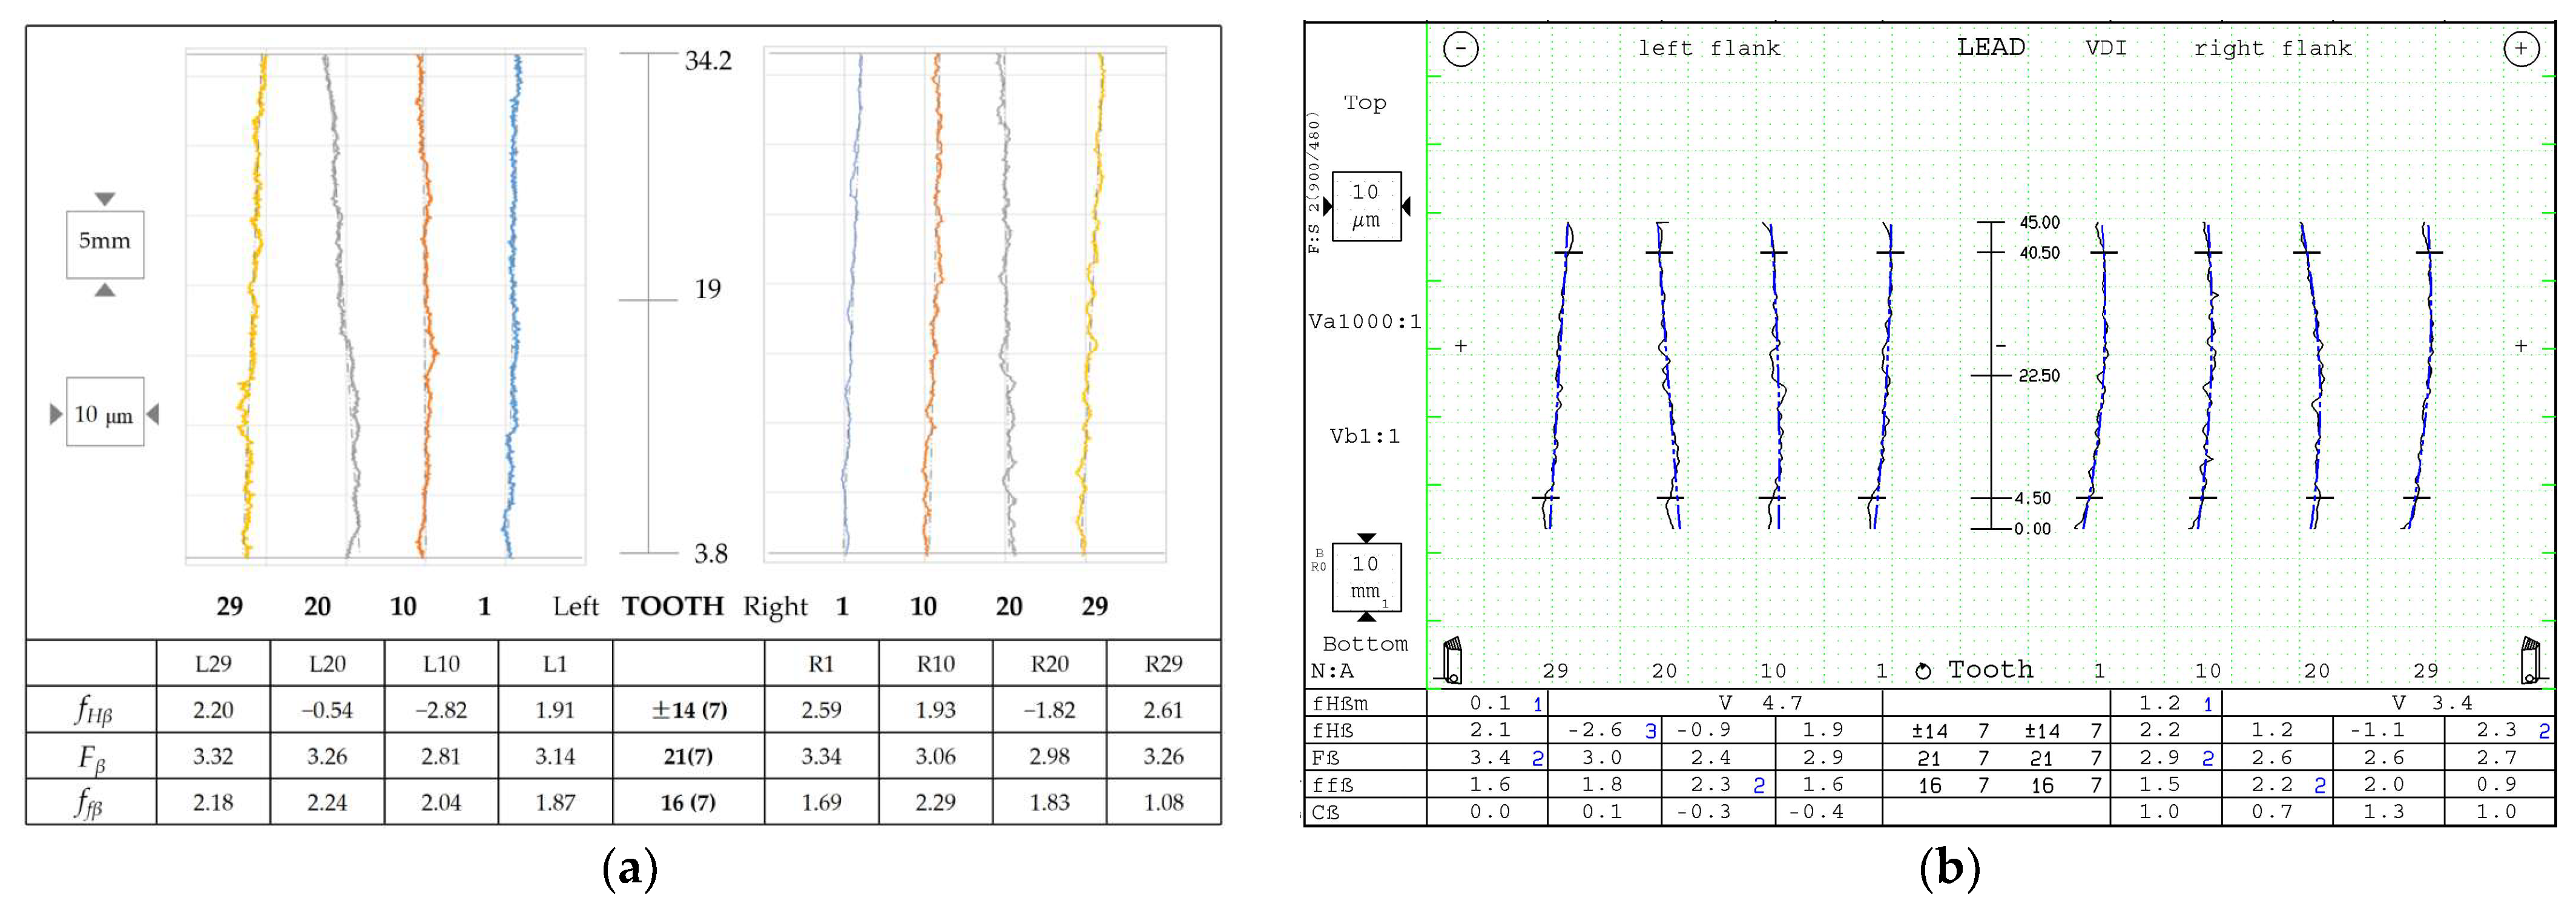
- Helix Deviation.
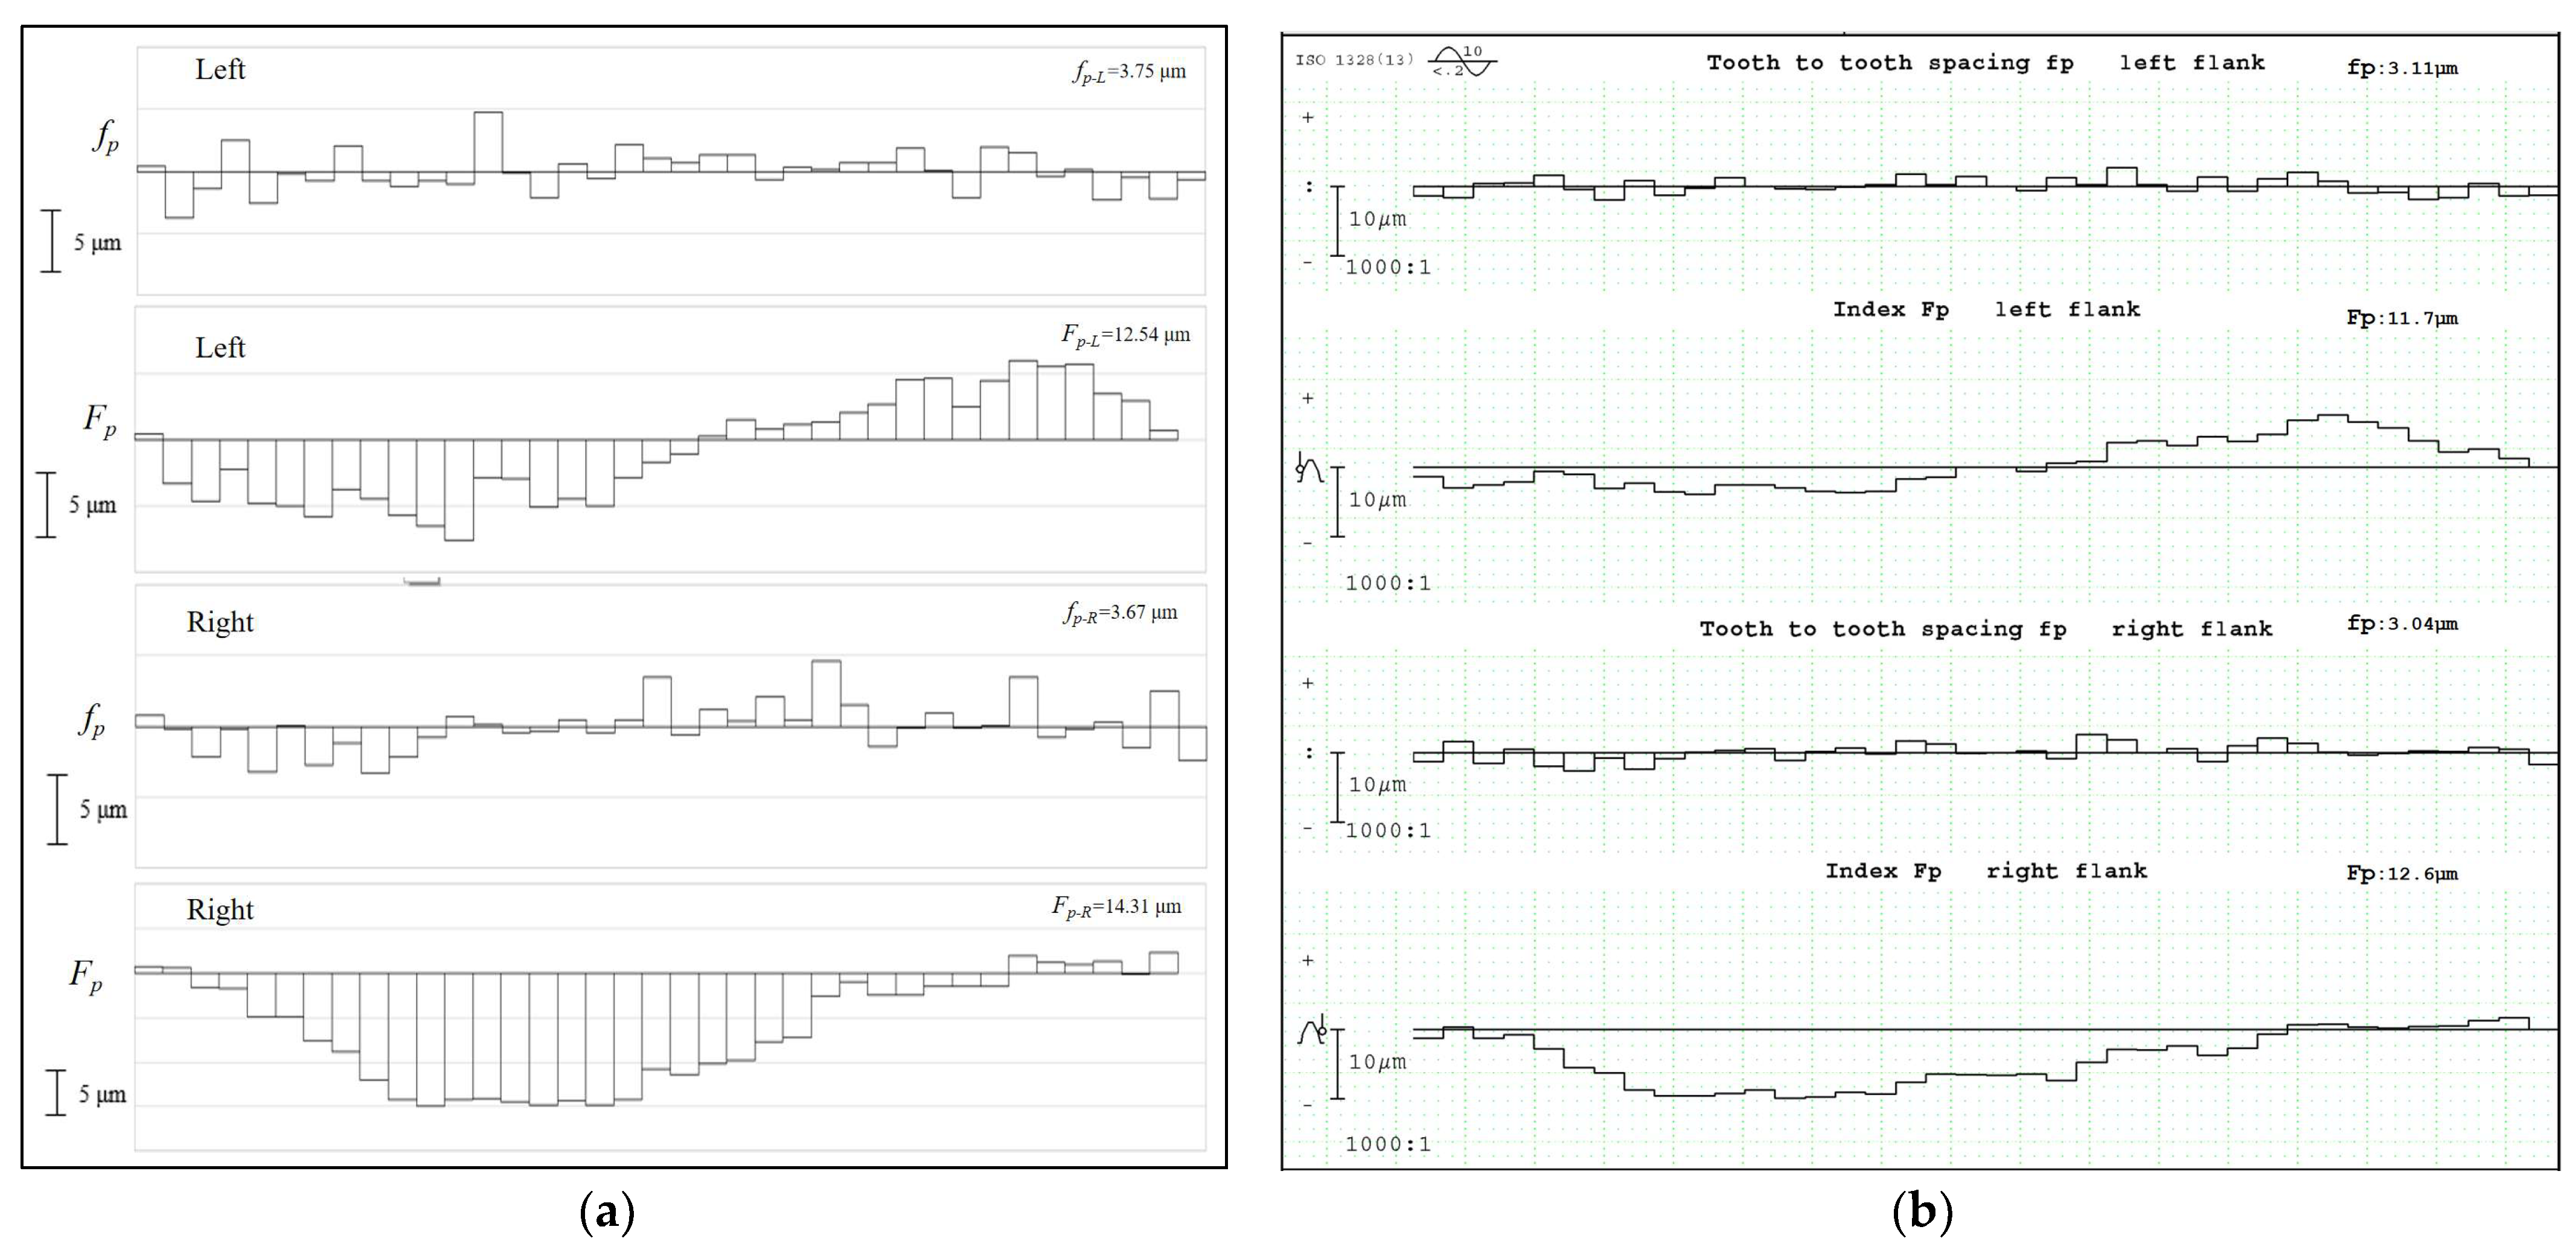
- Pitch Deviation.
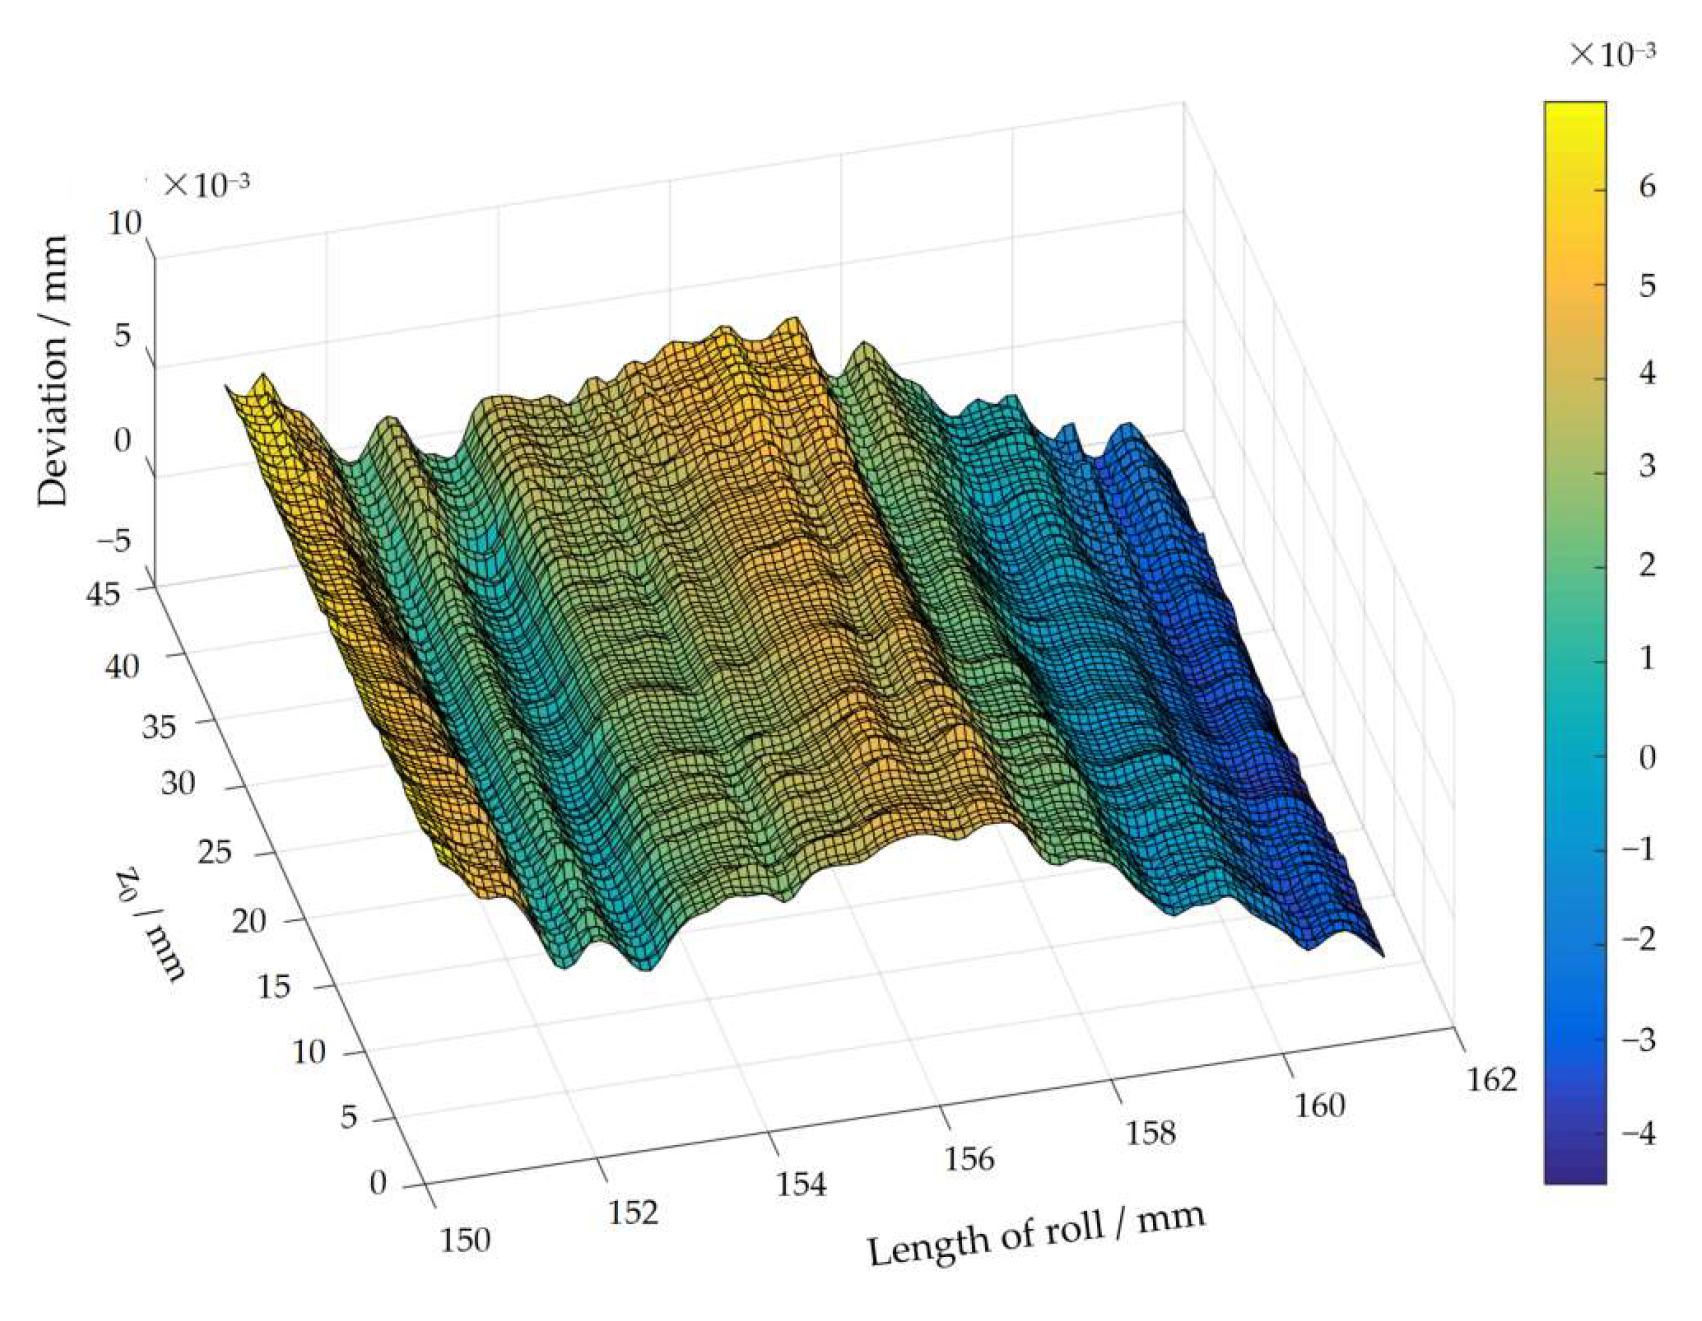
- Topological Deviation.
6. Conclusions
Author Contributions
Funding
Institutional Review Board Statement
Informed Consent Statement
Data Availability Statement
Conflicts of Interest
References
- Steinle, A. New gear testers. Werkstattstechnik 1927, 21, 153–156. [Google Scholar]
- Freeth, T.; Bitsakis, Y.; Moussas, X.; Seiradakis, J.H.; Tselikas, A.; Mangou, H.; Zafeiropoulou, M.; Hadland, R.; Bate, D.; Ramsey, A.; et al. Decoding the ancient Greek astronomical calculator known as the Antikythera Mechanism. Nature 2006, 444, 587–591. [Google Scholar] [CrossRef] [PubMed]
- Ignacio, G.P.; Pedro, G.S.; Alfonso, F.A. Virtual Metrology of Helical Gears Reconstructed from Point Clouds. In Gears in Design, Production and Education; Springer: Berlin/Heidelberg, Germany, 2021. [Google Scholar]
- Goch, G. Gear Metrology-An update. CIRP Ann.-Manuf. Technol. 2023, 72, 725–751. [Google Scholar] [CrossRef]
- Vukasinovic, N.; Urbas, U. Optical areal geometrical quality control of gears. In Polymer Gears; Elsevier: Amsterdam, The Netherlands, 2025; pp. 423–451. [Google Scholar]
- Shi, Z.Y.; Yu, B.; Song, H.X.; Wang, X. Development of Gear Measurement Technology during Last 20 Years. China Mech. Eng. 2022, 33, 1009–1024. [Google Scholar]
- Przyklenk, A.; Reavie, T.; Stein, M.; Frazer, R. Holistic Evaluation of Involute Gears. Power Transm. Eng. 2022, 4, 40–48. [Google Scholar]
- Stein, M.; Härtig, F. 3D involute gear evaluation—Part II: Deviations—Basic algorithms for modern software validation. Meas. Sci. Technol. 2022, 33, 125003. [Google Scholar] [CrossRef]
- Shi, Z.Y.; Sun, Y.Q. An overview on line laser 3D measurement of gears. Precis. Eng. 2025, 88, 823–844. [Google Scholar] [CrossRef]
- Vukasinovic, N.; Bracun, D.; Mozina, J.; Duhovnik, J. A new method for defining the measurement-uncertainty model of CNC laser-triangulation scanner. Int. J. Adv. Manuf. Technol. 2012, 58, 1097–1104. [Google Scholar] [CrossRef]
- Fujio, H.; Kubo, A.; Saitoh, S.; Suzuki, M.; Tochimoto, S.; Hanaki, H.; Honda, T. Laser Holographic Measurement of Tooth Flank Form of Cylindrical Involute Gear. ASME J. Mech. Des. 1994, 116, 721–729. [Google Scholar] [CrossRef]
- Bartscher, M.; Hilpert, U.; Goebbels, J.; Weidemann, G. Enhancement and Proof of Accuracy of Industrial Computed Tomography (CT) Measurements. CIRP Ann.-Manuf. Technol. 2007, 56, 495–498. [Google Scholar] [CrossRef]
- Christof, G.; Markus, F. Hybrid gear metrology with Klingelnberg: An overview of tactile and optical gear metrology. Gear Technol. 2021, 6, 26–27. [Google Scholar]
- Shi, Z.Y.; Li, M.C.; Sun, Y.Q. Development of three-dimensional gear measuring instrument with line laser. Chin. J. Sci. Instrum. 2024, 45, 95–103. [Google Scholar]
- Matthias, M.A.; Axel, V.F.; Andreas, F. Laser line triangulation for fast 3D measurements on large gears. Int. J. Adv. Manuf. Technol. 2019, 100, 2423–2433. [Google Scholar]
- Goch, G.; Ni, K.; Peng, Y.; Guenther, A. Future gear metrology based on areal measurements and improved holistic evaluations. CIRP Ann.-Manuf. Technol. 2017, 66, 469–474. [Google Scholar] [CrossRef]
- Yu, B.; Li, Z.G.; Sun, Y.Q.; Shi, Z. A method combining laser and vision detection for on-line measurement of small modules gears. Meas. Sci. Technol. 2024, 35, 055014. [Google Scholar] [CrossRef]
- Guo, S.; Song, H.X.; Sun, Y.Q.; Shi, Z.; Yu, B. Rapid and high-precision measurement method for fine pitch gears without high-precision installation. Measurement 2024, 237, 115157. [Google Scholar] [CrossRef]
- Mies, G.; Gorgels, C. Device with a Tactile System and with a Contactless Operation Sensor, and Corresponding Method and Use Thereof. U.S. Patent US2019064031A1, 28 February 2019. [Google Scholar]
- Rajagopalan, L. DWFritz Receives Frost & Sullivan Best Practices Award; DWFritz Automation, Inc.: Wilsonville, OR, USA, 2020. [Google Scholar]
- Kerforn, N. Gear Inspection in Record Time. Opt. Photonik 2017, 12, 56–57. [Google Scholar] [CrossRef]
- Beerck, D.C. In-process, complete gear inspection at light speeds. Gear Technol. 2018, 6, 32–33. [Google Scholar]
- DMG MORI. Ultra High-Speed Non-Contact On-Machine Measuring System Integrating Machine Tool and Measuring Technology. 2021. Available online: https://www.dmgmori.co.jp/en/products/machine/id=6330 (accessed on 8 July 2025).
- Gene, H. Multisensor CMMs for Gear Inspection. Gear Technol. 2022, 6, 33–35. [Google Scholar]
- Urbas, U.; Hrga, T.; Povh, J.; Vukašinović, N. Novel alignment method for optical 3D gear metrology of spur gears with a plain borehole. Measurement 2022, 192, 110839. [Google Scholar] [CrossRef]
- Edward, M.; Prashanth, J. 6 DOF calibration of profile sensor locations in an inspection station. CIRP Ann.-Manuf. Technol. 2020, 69, 465–468. [Google Scholar]
- ISO 1328:2013; Cylindrical Gears—ISO 1328:2013 System of Flank Tolerance Classification—Part 1: Definitions and Allowable of Value of Deviations Relevant to Flanks of Gear Teeth. Central Secretariat: Geneva, Switzerland, 2013.


| Technical Index | Parameters |
|---|---|
| Tested gear module | 1~5 mm |
| Maximum addendum diameter of tested gears | 230 mm |
| Flank direction of tested gears | Spur gears and helix gears |
| Accuracy evaluation class | grades 5 (ISO 1328-1:2013 [27]) |
| Measurement repeatability | 0.002 mm |
| Minimum resolution of rotating shaft system | 0.0001° |
| Measurement items | Profile deviation, helix deviation, pitch deviation, etc. |
| Parameters | Symbols/Units | Gear 1 | Gear 2 | Gear 3 | Gear 4 |
|---|---|---|---|---|---|
| Tooth number | Z | 84 | 38 | 24 | 48 |
| Module | mn/mm | 1 | 4 | 5 | 4 |
| Pressure angle | α/° | 20 | 20 | 24 | 20 |
| Helix angle | β/° | 18.75 | 15 | — | 30 |
| Face width | b/mm | 20 | 45 | 53 | 40 |
| Flank direction | — | Left-handed | Left-handed | — | Right-handed |
| Modification | — | None | None | Crowned | Twist |
| Tip diameter | da/mm | 90.85 ± 0.02 | 229.70 | ||
| Root diameter | df/mm | 85.94 ± 0.1 | 145.817 | 211.70 | |
| Accuracy class | — | 5 | 7 | 6 | 6 |
| Parameters | Units | Value |
|---|---|---|
| Measuring mode | — | data diffuse reflection |
| Reference distance | mm | 60 |
| Measuring range: Z-axis | mm | ±8 |
| Measuring range: X-axis (Near) | mm | 13.5 |
| Measuring range: X-axis (Far) | mm | 15 |
| Measuring accuracy: Z-axis | μm | 0.4 |
| Measuring accuracy: X-axis | μm | 5 |
| Linearity (Z-axis) | — | ±0.1% of F.S. |
| Measuring point interval | μm | 20 |
| Sampling period (trigger interval) | μs | 16 (high-speed), 32 (efficient) |
| Measuring Point | 1st Time | 2nd Time | 3rd Time | 4th Time | 5th Time | Standard Deviation | Range |
|---|---|---|---|---|---|---|---|
| 1 | 2.2315 | 2.2318 | 2.2308 | 2.2319 | 2.2316 | 0.000387 | 0.0011 |
| 2 | 2.229 | 2.229 | 2.229 | 2.2295 | 2.2299 | 0.000366 | 0.0009 |
| 3 | 2.2233 | 2.2231 | 2.2235 | 2.2236 | 2.2242 | 0.000372 | 0.0011 |
| 4 | 2.2222 | 2.2226 | 2.2226 | 2.2233 | 2.2234 | 0.000458 | 0.0012 |
| 5 | 2.22 | 2.2197 | 2.2195 | 2.2197 | 2.2199 | 0.000174 | 0.0005 |
| 6 | 2.2189 | 2.219 | 2.2188 | 2.2193 | 2.2193 | 0.000206 | 0.0005 |
| 7 | 2.2144 | 2.2147 | 2.2148 | 2.2151 | 2.215 | 0.000245 | 0.0007 |
| 8 | 2.2128 | 2.2129 | 2.2129 | 2.2132 | 2.2132 | 0.000167 | 0.0004 |
| 9 | 2.2013 | 2.201 | 2.2016 | 2.2016 | 2.2026 | 0.000538 | 0.0016 |
| 10 | 2.1742 | 2.1753 | 2.1746 | 2.176 | 2.1754 | 0.000632 | 0.0018 |
| 11 | 2.1605 | 2.1597 | 2.1607 | 2.1598 | 2.1605 | 0.000408 | 0.001 |
| 12 | 2.094 | 2.0954 | 2.0951 | 2.0953 | 2.0944 | 0.000546 | 0.0014 |
| 13 | 2.0717 | 2.0725 | 2.0722 | 2.0731 | 2.0727 | 0.000472 | 0.0014 |
| 14 | 2.0385 | 2.0382 | 2.0392 | 2.039 | 2.0393 | 0.000422 | 0.0011 |
| 15 | 1.982 | 1.9805 | 1.9809 | 1.9808 | 1.9809 | 0.000511 | 0.0015 |
| 16 | 1.6776 | 1.6784 | 1.6771 | 1.6775 | 1.6778 | 0.000426 | 0.0013 |
| 17 | 1.6357 | 1.6371 | 1.6365 | 1.6363 | 1.6353 | 0.000627 | 0.0018 |
| 18 | 1.5746 | 1.5758 | 1.5751 | 1.5752 | 1.576 | 0.000504 | 0.0014 |
| 19 | 1.3636 | 1.3652 | 1.3636 | 1.3638 | 1.3638 | 0.000607 | 0.0016 |
| 20 | 1.3184 | 1.3188 | 1.3186 | 1.3194 | 1.3186 | 0.000344 | 0.001 |
| 21 | 1.3013 | 1.3024 | 1.3028 | 1.3017 | 1.3029 | 0.000624 | 0.0016 |
| 22 | 1.2175 | 1.2167 | 1.2176 | 1.2185 | 1.2170 | 0.000615 | 0.0018 |
| 23 | 1.0682 | 1.0680 | 1.0692 | 1.0689 | 1.0681 | 0.000479 | 0.0012 |
| 24 | 1.0435 | 1.0441 | 1.0431 | 1.0446 | 1.0440 | 0.000516 | 0.0015 |
| 25 | 0.9629 | 0.9638 | 0.9633 | 0.9634 | 0.9630 | 0.000319 | 0.0009 |
| maximum | 0.000632 | 0.0018 |
Disclaimer/Publisher’s Note: The statements, opinions and data contained in all publications are solely those of the individual author(s) and contributor(s) and not of MDPI and/or the editor(s). MDPI and/or the editor(s) disclaim responsibility for any injury to people or property resulting from any ideas, methods, instructions or products referred to in the content. |
© 2025 by the authors. Licensee MDPI, Basel, Switzerland. This article is an open access article distributed under the terms and conditions of the Creative Commons Attribution (CC BY) license (https://creativecommons.org/licenses/by/4.0/).
Share and Cite
Sun, Y.; Shi, Z.; Yu, B.; Li, M. Line Laser 3D Measurement Method and Experiments of Gears. Photonics 2025, 12, 782. https://doi.org/10.3390/photonics12080782
Sun Y, Shi Z, Yu B, Li M. Line Laser 3D Measurement Method and Experiments of Gears. Photonics. 2025; 12(8):782. https://doi.org/10.3390/photonics12080782
Chicago/Turabian StyleSun, Yanqiang, Zhaoyao Shi, Bo Yu, and Meichuan Li. 2025. "Line Laser 3D Measurement Method and Experiments of Gears" Photonics 12, no. 8: 782. https://doi.org/10.3390/photonics12080782
APA StyleSun, Y., Shi, Z., Yu, B., & Li, M. (2025). Line Laser 3D Measurement Method and Experiments of Gears. Photonics, 12(8), 782. https://doi.org/10.3390/photonics12080782