1. Introduction
Steel/concrete structures are widely used in many super projects due to their excellent load-bearing capacity, stability, and durability. However, as the service life increases, localized damage (i.e., large deformations, cracks, and corrosion) may occur in these structures due to their design and construction defects, extremely harsh environments (i.e., earthquakes, typhoons, fires, and atmospheric pollution), or poor operation and management. The accumulation and expansion of localized damage reduces the load-bearing capacity of the structure. If no measures are promoted to control the degradation, it may cause strength, instability, or fatigue damage to the entire project. Since new construction or the replacement of structures requires more human, material, and time resources to prevent the overall failure of the structure caused by the accumulation of localized damage, the most cost-effective way is to carry out repair and reinforcement treatments for these in-service structures for restoring or enhancing their resistance [
1,
2,
3]. In European and American countries, the investment in building reinforcement and renovation has accounted for more than 50% of the total industry investment; building repair and reinforcement will be one of the most popular industries in the 21st century. The rapid development of infrastructure construction, urban upgrading, and the operation, maintenance, and performance improvement of existing buildings also brings unprecedented development opportunities to the reinforcement and repair industry. Therefore, the development of reinforcement methods for steel/concrete structures and the improvement of reinforcement design theory will be the key scientific and technological topics in the field of structural engineering. CFRP composite structures are widely used as the coatings in the reinforcement field due to their advantages of being lightweight, having high strength, high stiffness, corrosion resistance, and good fatigue resistance [
4,
5,
6,
7,
8,
9,
10]. With the advancement of structural reinforcement and renovation projects for old buildings and dilapidated bridges, CFRP-coated structures are becoming more and more common in projects. The service state, mechanical action mechanism, damage evolution characteristics, and resistance recovery effect of CFRP-coated structures have thus become hot topics and challenges in engineering research [
11,
12,
13,
14,
15]. It is of great significance to realize the whole life-cycle monitoring of CFRP-coated structures so as to provide scientific support for accurately determining the structural performance, evaluating the strengthening effect, and improving the design of reinforcement methods.
Research investigation on the performance of CFRP-coated structures is mostly focused on finite element simulation analysis and the experimental exploration stage. The evaluation of the bearing capacity, fatigue characteristics, and wind/earthquake/fire-resistance of reinforced structures are in the qualitative description stage [
16,
17,
18,
19,
20,
21,
22]. These research conclusions obtained from model tests and approximate structural theory analysis, supplemented by finite element and testing techniques, differ from the actual engineering in terms of loads, size effects, and constraints, which thus brings about unknown risks by using the study for guiding the design of reinforcement of steel/concrete structures [
23]. Therefore, it is necessary to develop a long-term, stable, real-time, continuous, and economically feasible in situ monitoring technology to track the information of the whole process of the reinforced structure during the forming and service periods. It can provide effective response data for the damage identification, safety assessment, and comprehensive evaluation of the reinforcement effect under the action of harsh service environments.
Due to the advantages of high sensitivity and precision, absolute measurement, anti-electromagnetic interference, good geometrical shape-versatility, long-term stability, a small size, a light weight, convenient multiplexing, and integration of the sensing network over other sensors [
23,
24,
25,
26,
27,
28,
29], optical fiber sensing technology has been extensively adopted not only in structural engineering, but also in emerging interdisciplinary applications such as wearable photonic devices for cardiorespiratory function assessment and biometric identification [
27]. These recent advances further demonstrate the versatility, reliability, and cutting-edge nature of optical fiber sensors across different application domains. Therefore, optical fiber sensing technology has been assembled with CFRP laminates to configure smart CFRP components. The CFRP structure can be regarded as the protection of the sensing fiber, and the interfacial transfer performance is simple. It enhances the survivability and stability of optical fiber sensors in harsh construction and service environments. Some attempts on improving the structural and sensing performances of smart CFRP composites with optical fiber sensing elements embedded have been investigated by impact, vibration, and fatigue tests [
30,
31,
32,
33], which aim to promote the application of these smart CFRP composite structures for simultaneously strengthening and monitoring practical bridge projects. Academician Ou Jinping’s team realized the monitoring of stress–strain information related to in-service bridge structures by replacing some of the rods of bridge structures with Smart FRP-FBG bars [
34,
35]. Some scholars have monitored the structural resistance recovery level of old bridges strengthened with CFRP by laying displacement sensors or wireless sensors and evaluating their bearing capacity based on long-term in situ monitoring data [
23,
36,
37]. However, the quality and effectiveness of the data in long-term service are highly correlated to the adopted sensors, and thus optical fiber sensors, with high robustness to environmental interference, are recommended. It can be concluded that the health monitoring of CFRP-reinforced structures based on optical fiber sensing technology and service performance evaluation based on effective monitoring data needs further detailed and in-depth research. Therefore, it is necessary to develop a long-term, stable, real-time continuous, economical, and feasible in situ monitoring technology for smart CFRP-reinforced structures, so as to provide a scientific basis for the safety assessment, intelligent operation, and maintenance management of reinforced structures.
Therefore, a whole-process monitoring test on structural characteristics of CFRP-coated steel beams before the reinforcement, during the curing process, and after the reinforcement has been carried out in this paper. A double-layer CFRP plate assembled with optical fiber sensors for coating on the beam bottom of a steel beam has been adopted to explore the feasibility of the whole life-cycle monitoring of CFRP-coated structures. Furthermore, the effectiveness and reliability of using optical fiber sensing information to monitor the structural performance of the CFRP-coated steel beam has been demonstrated and validated by comparison analysis with the finite element method (FEM) and simplified theoretical analysis. The strengthening effect has also been judged based on the monitoring data during the whole process.
2. Sensor Design for Structural Monitoring
To perform life-cycle monitoring of CFRP-coated structures in harsh service environments, two kinds of FBG sensors have been designed: silicone rubber-packaged FBGs in series and FBGs in series inserted in CFRP plates. It aims to provide long-term and stable monitoring of CFRP-reinforced structures during the operation stages.
- (1)
Silicone rubber-packaged FBGs in series
Due to the brittle nature of optical fiber materials, protection is required to ensure the FBG sensing elements survive in relatively large deformation measurements. Since the monitored structure is made of steel material, flexible protection is thus suggested to maintain the sensing fiber deformation compatibility with the rigid steel material during testing [
29]. A flexible silicone rubber material made of SYLGARD 184 silicone elastomer is thus adopted, which can always stay in the elastic stage during the measurement of long-term and large deformations. The structure of the sensor is displayed in
Figure 1a, and the practical product follows in
Figure 1b. The silicone rubber-packaged FBGs in series have been attached on the beam bottom and web side by using SYLGARD 184 silicone elastomer adhesion. The packaged sensors are mainly developed to detect the tensile and compression strain information of the beam, as shown in
Figure 1c. The distance of each adjacent FBG in FBGs in series is 50 mm, and the external diameter of the silicone rubber cylinder protection is 5 mm. It should be noted that the slight and slender flexible sensors bonded on the steel beam have no additional influence on the deformation or bearing capacity of the monitored structure. For the use of FBGs in series, multi-point information of the beam can be obtained at the same time, which can provide more useful information than a one-point FBG sensor. Due to the presence of protective materials, it is necessary to correct for strain transfer errors when interpreting the sensing signals, which can also be equivalently replaced by calibration testing [
28].
- (2)
FBGs in series inserted in CFRP plates
Since the CFRP composites can be fabricated layer by layer, the FBG sensing element can be inserted during the fabrication of CFRP components, which produces the smart CFRP structures. The CFRP composites can be regarded as the protective layer of the FBG sensors. Therefore, FBGs in series have been inserted in CFRP plates to configure the smart CFRP components with both strengthening and sensing functions. Two bare FBGs in series with four sensing points have been inserted in the CFRP laminates for the inner strain measurement, and the flexible white pipe-packaged FBGs in series with two sensing points have also been laid in the laminates for temperature measurement, as shown in
Figure 2a. Epoxy resin has been used to hold the embedded FBGs in series in the laminates, as displayed in
Figure 2b,c. The curing process of the smart CFRP composites with FBGs assembled has been monitored by using the Optical system 200 for data collection. Complicated interfacial action and temperature variations have been observed during the curing process, which can be reflected from the measured temperature and strain profiles in 48 h, and are provided in the published reference [
38]. Therefore, the curing process-induced thermal effect should be carefully considered and controlled during the fabrication of CFRP composites. The molded CFRP component with FBGs in series inserted has then been bonded on the beam bottom with epoxy resin to strengthen the steel beam. This curing process has also been monitored, as shown in
Figure 2d, which is also important for the relatively accurate evaluation of the bonding quality [
39].
- (3)
Working principle of the FBG sensors
For the bare FBG, the Bragg wavelength
λB of the FBG sensing element is related to the grating period Λ and the effective refractive index
neff of the fiber core, which are both influenced by
where
ε is the axial strain, and
T is the environmental temperature. It means that both the axial tensile and compression strain can lead to the Bragg wavelength shift in FBG sensing elements [
29,
40].
The force or temperature loaded on the FBG sensing element can affect the variation in the effective refractive index and grating period, and then the Bragg wavelength shifts away from the original value. Strain affects the grating period, and the strain-induced photo-elastic effect changes the effective refractive index, both of which lead to the variation in Bragg wavelength. The temperature-induced thermo-optical effect changes the effective refractive index, and the thermal strain affects the grating period, both of which contribute to the shift in Bragg wavelength. A linear relationship between the wavelength increment Δ
λB and the strain
ε or temperature variation Δ
T can be established by the calibration test:
where
and
are the strain and temperature sensitivity coefficients, respectively. The accepted value of
is about 0.79. The general value of
is 7.55 × 10
−6/°C. For FBG sensing elements with typical central wavelengths in intervals of 1520~1560 nm, the value of
is about 1.20 pm/(μm/m). For this reason, the wavelength increments of surface-attached bare FBG sensors induced by force and temperature variation can be transferred to the strain of the monitored structure. For the packaged FBG sensors, a coefficient is required to modify the transferred strain to accurately reflect the true strain of the structure, which is based on the strain transfer model [
29]. Since the whole test has been conducted in laboratory, the room temperature remains stable, and then no temperature compensation measure is required to delete the temperature effect on the FBG sensors.
3. Strengthening-Effect Monitoring of Smart CFRP-Coated Composite Beams
Based on the reinforcement characteristics of engineering structures, a whole-process test program for CFRP-reinforced steel beam structures and their changes in structural characteristics before reinforcement, during reinforcement curing, and after reinforcement has been designed with the goal of achieving the whole life-cycle monitoring of CFRP-reinforced structures. This test mainly consists of three working conditions: (1) a bearing-capacity test of pure steel beam before reinforcement, (2) monitoring of the inner deformation of CFRP-reinforced steel beam structures during the CFRP-reinforcement curing process, and (3) a bearing-capacity test of CFRP-reinforced steel beams. The experimental model description and test data analysis are described below.
3.1. Testing Model and Sensor Layout
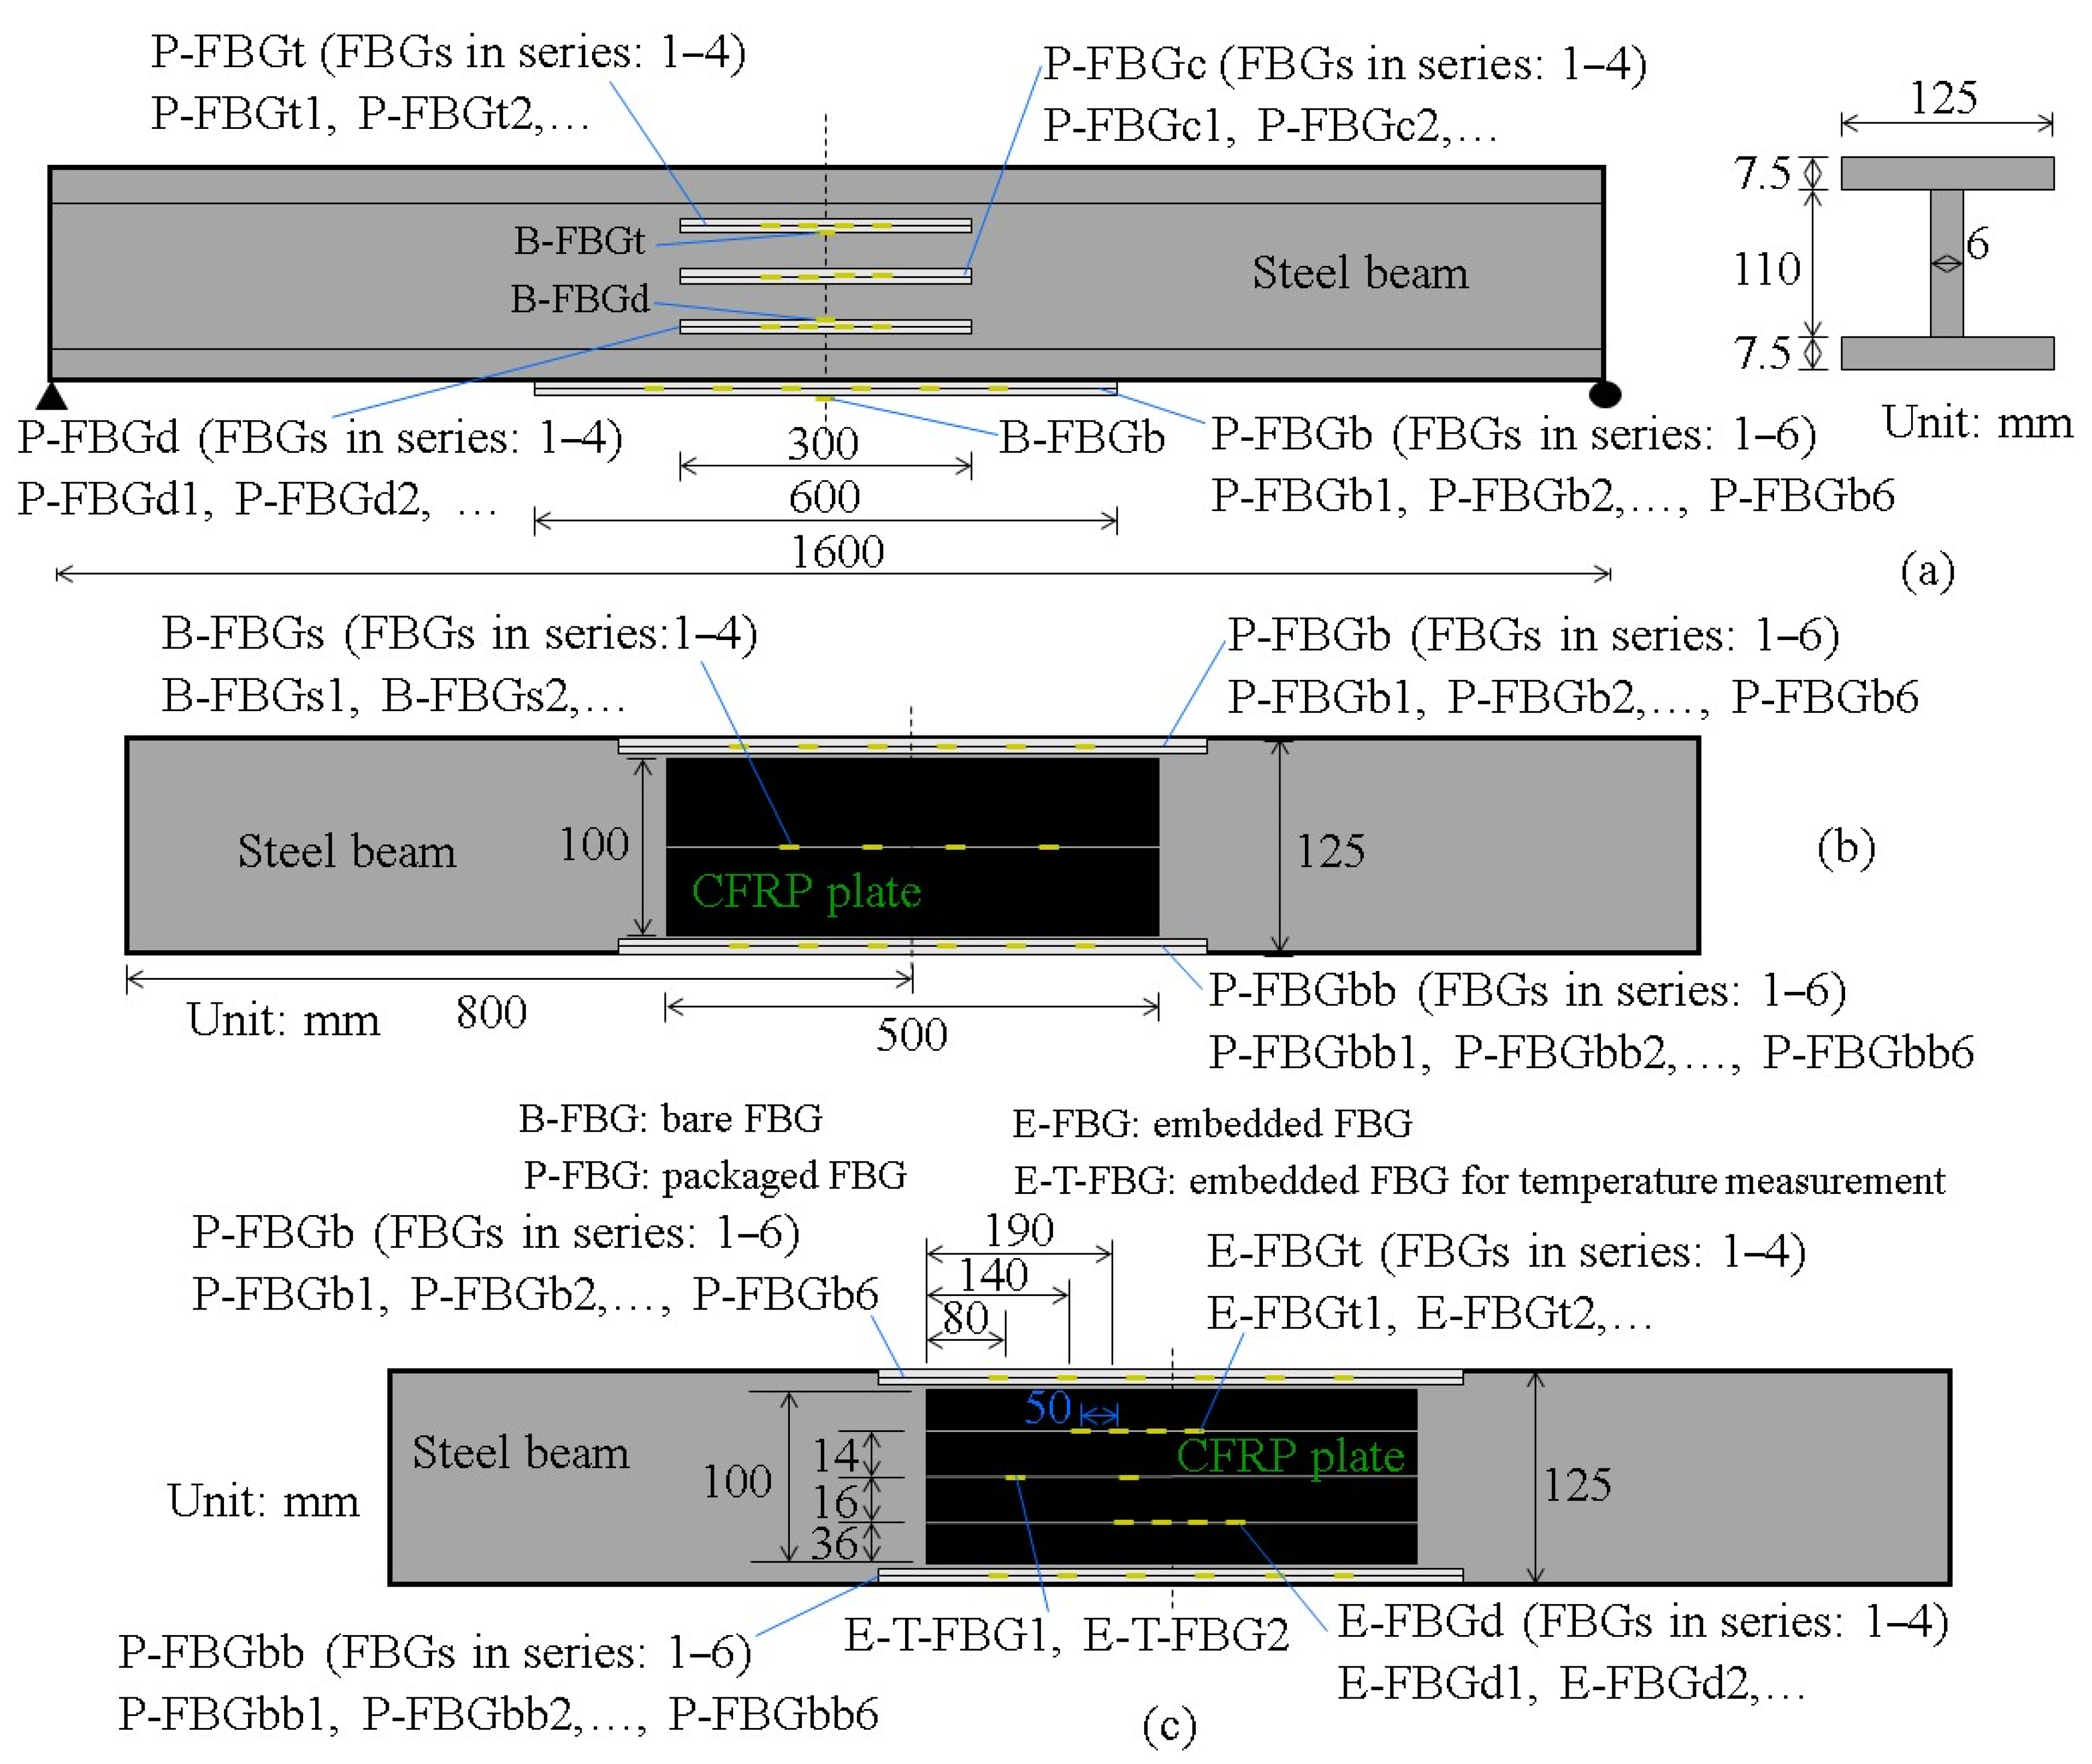
Figure 3 shows the testing device of an I-steel beam with and without smart CFRP plates. The cross-section and span of the I-steel beam is 125 × 125 mm
2 and 1600 mm. The adopted standard code of steel material properties is GB/T 11263-2017 [
41]; Hot rolled H and cut T section steel. 2017. Before the reinforcement, 27 sensing points have been installed on the pure steel beam. In total, 14 sensing points can be located on the web surface of the beam, namely, P-FBGt (FBGs in series 1–4), P-FBGc (FBGs in series 1–4), P-FBGd (FBGs in series 1–4), B-FBGt, and B-FBGd, as shown in
Figure 4a. It should be noted that both the bare and packaged FBG sensors have been adopted. In total, 13 sensing points can be located on the beam bottom, namely, P-FBGb (FBGs in series 1–6), P-FBGbb (FBGs in series 1–6), and B-FBGb, as shown in
Figure 4a,b. When the smart CFRP plate has been bonded on the beam bottom, 14 additional sensing points are added on the steel beam. It mainly contains the FBGs in series inserted into the CFRP plates (E-FBGt (FBGs in series 1–4), E-FBGd (FBGs in series 1–4), E-T-FBG1, and E-T-FBG2), and bare FBGs bonded on the surface of the CFRP plates (B-FBGs (FBGs in series 1–4)), as displayed in
Figure 4b,c. P-FBG refers to the flexible silicone rubber-packaged FBG. B-FBG refers to the bare FBG. E-FBG refers to the embedded FBG. E-T-FBG refers to the embedded FBG without constraint, and is just used for temperature measurement [
40,
42].
All the externally bonded FBG sensors have been attached to the surface of the steel beam by a mixture composed of Dow Corning SYLGARD™ 184 Silicone Elastomer and curing agent. It should be noted that by using the same adhesion for the bonding and protection of the externally installed FBG sensors, relatively good deformation compatibility can be obtained. All the FBG sensors have been connected to FBG interrogator si255 produced by Micron Optics (MOI), and the sampling frequency is set to be 1 Hz. Considering the quasi-static nature of the loading condition, this frequency is adequate to capture the strain response accurately without introducing excessive data redundancy. After the bonding and connection of the FBG sensors, a sensor installation quality inspection can be conducted to ensure the reliability of the monitoring data. This inspection process includes the following steps:
(1) Visual inspection after installation to confirm that the sensors are securely bonded or mounted, properly aligned, and physically intact.
(2) Initial signal testing to assess signal quality and verify baseline readings under known conditions.
(3) Preliminary strain loading testing by applying small-scale loads to ensure all sensors respond consistently and predictably.
(4) For FBG sensors, spectral inspection is performed to confirm that the reflected wavelength and signal-to-noise ratio meet expected standards.
Any sensors that do not meet these standards are either reinstalled or excluded from the final analysis. The static loads have been implemented by adding different weights at different steps, and four weights have been generally used in the testing, namely, 20 kg, 40 kg, 60 kg, and 80 kg, as shown in
Figure 3a. The loading points are located at the mid span of the beam, as shown in
Figure 5. During each testing, all the FBG sensing signals have been automatically interpreted and collected by the interrogator system.
3.2. Data Interpretation Under Different Working Conditions
The main objective is to declare the variation principles of measurement signals of the specially designed FBG sensors attached on the steel beam (Condition 1) and the CFRP-reinforced steel beam (Condition 1) under different static loads. The general connection with the physical state has also been discussed. The correlated signals read directly from bare FBGs and packaged FBGs have been transferred to the deformation by using Equation (2), as shown in
Figure 6,
Figure 7,
Figure 8,
Figure 9,
Figure 10,
Figure 11,
Figure 12,
Figure 13,
Figure 14,
Figure 15,
Figure 16 and
Figure 17, respectively.
3.2.1. Investigation on Bearing Capacity of the Pure Steel Beam Before Reinforcement
- (1)
Signals measured by packaged FBG sensors
Figure 6 shows the signals of the packaged optical fibers under different point loads acted on the steel beam. From
Figure 6a, it can be seen that there is a clear gradation of FBG signals at all loading levels.
Figure 6b obviously shows that the strains measured by the FBG sensors increase gradually with the increase in load. From
Figure 6b–d, it can be seen that the packaged optical fibers on the web surface are all in compression. By comparing the magnitude of the strain under the same load, it can be analyzed that the height where P-FBGd is located is the closest to the centroidal-axis height of the pure steel beam. From
Figure 6e, it can be seen that the strain measured by P-FBGb3 on the bottom flange is about zero. The reason for this may be the insufficient bonding of this measuring point on the bottom flange of the steel beam. However, from the remaining five measured points of the FBGs in series, it can be still concluded that the four-stage loads have been performed, and the strains of the FBG sensors increase with the load growth. From
Figure 6e,f, it can be seen that the packaged FBGs on the bottom flange are all in tension. The measured deformation state of the beam generally obeys the basic beam theory, which can validate the feasibility and reliability of the monitoring system.
Figure 6.
Signals of the packaged optical fibers under different point loads applied on the steel beam: (a) P-FBGbb with time; (b) P-FBGt; (c) P-FBGc; (d) P-FBGd; (e) P-FBGb; (f) P-FBGbb.
Figure 6.
Signals of the packaged optical fibers under different point loads applied on the steel beam: (a) P-FBGbb with time; (b) P-FBGt; (c) P-FBGc; (d) P-FBGd; (e) P-FBGb; (f) P-FBGbb.
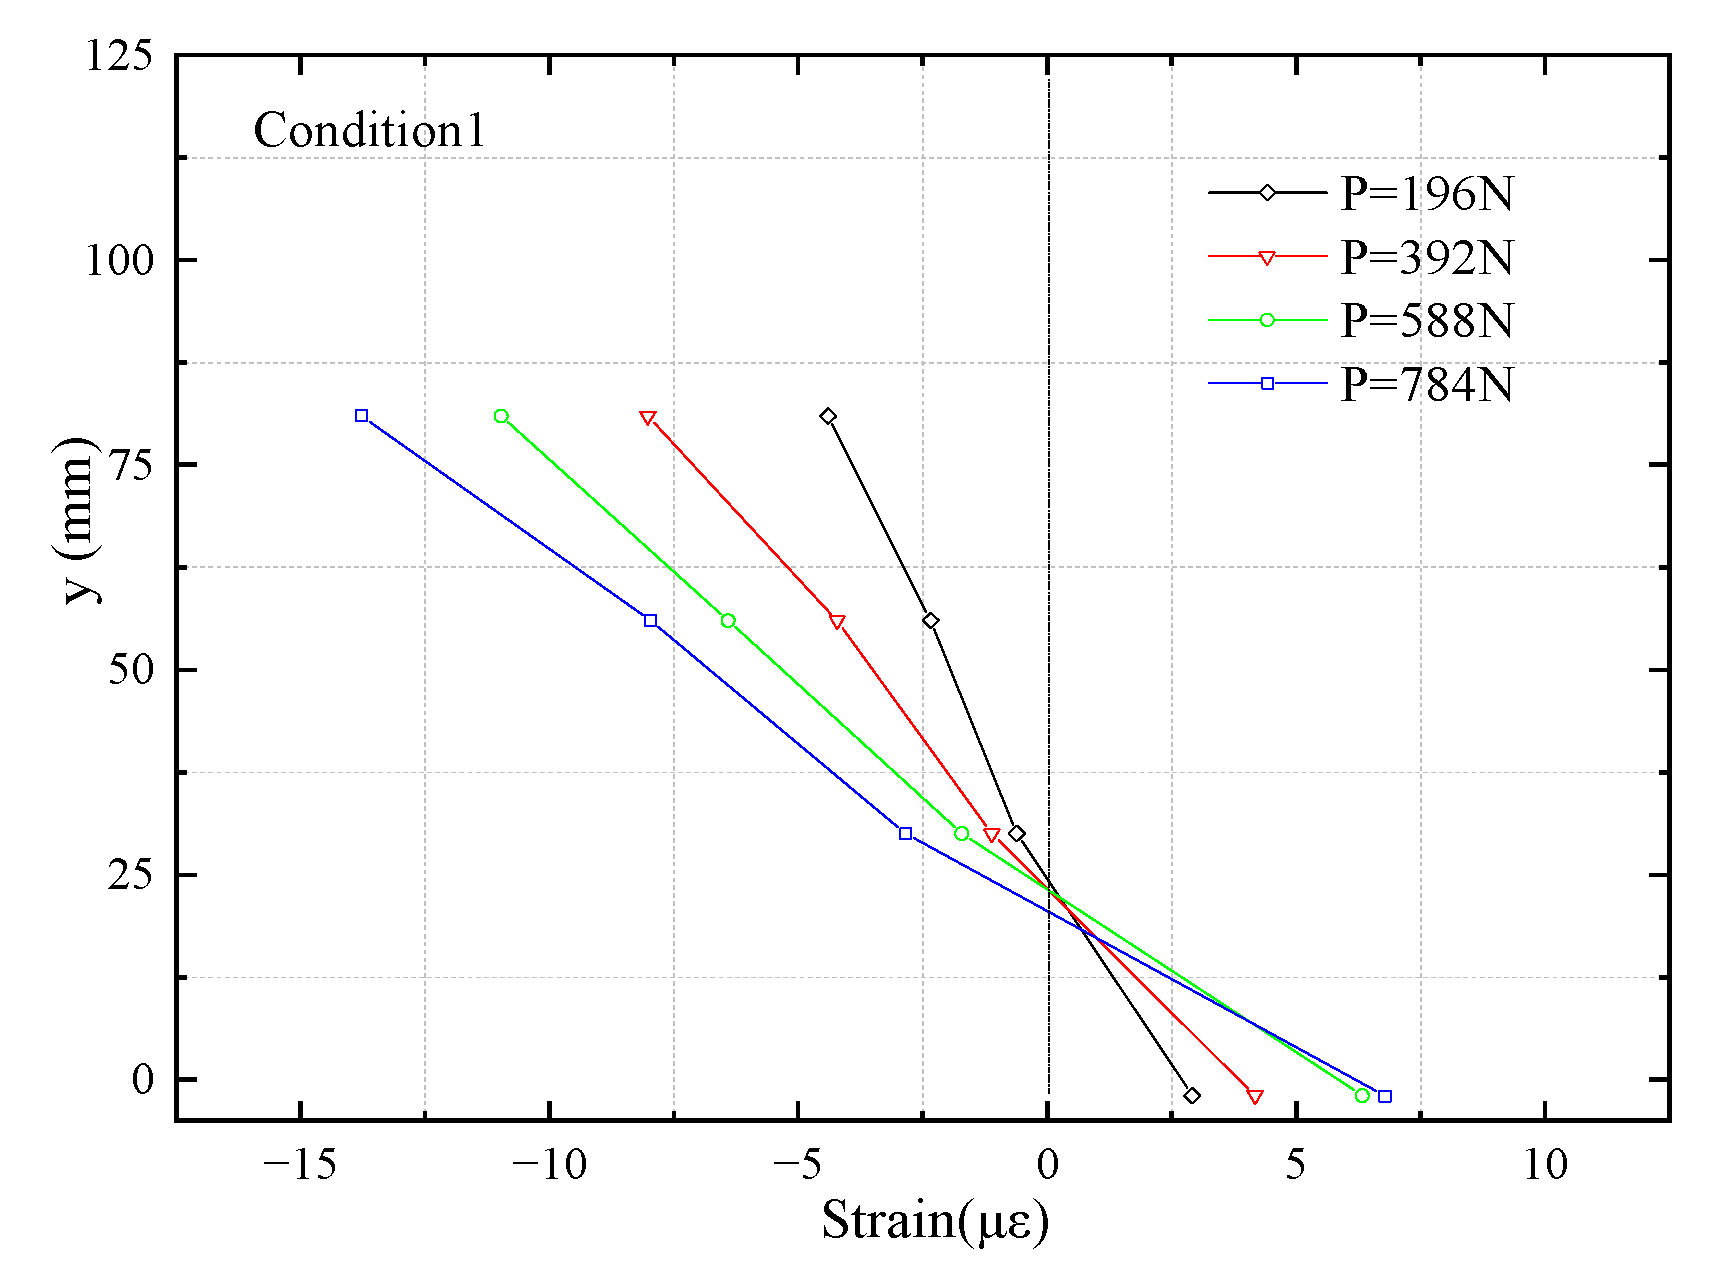
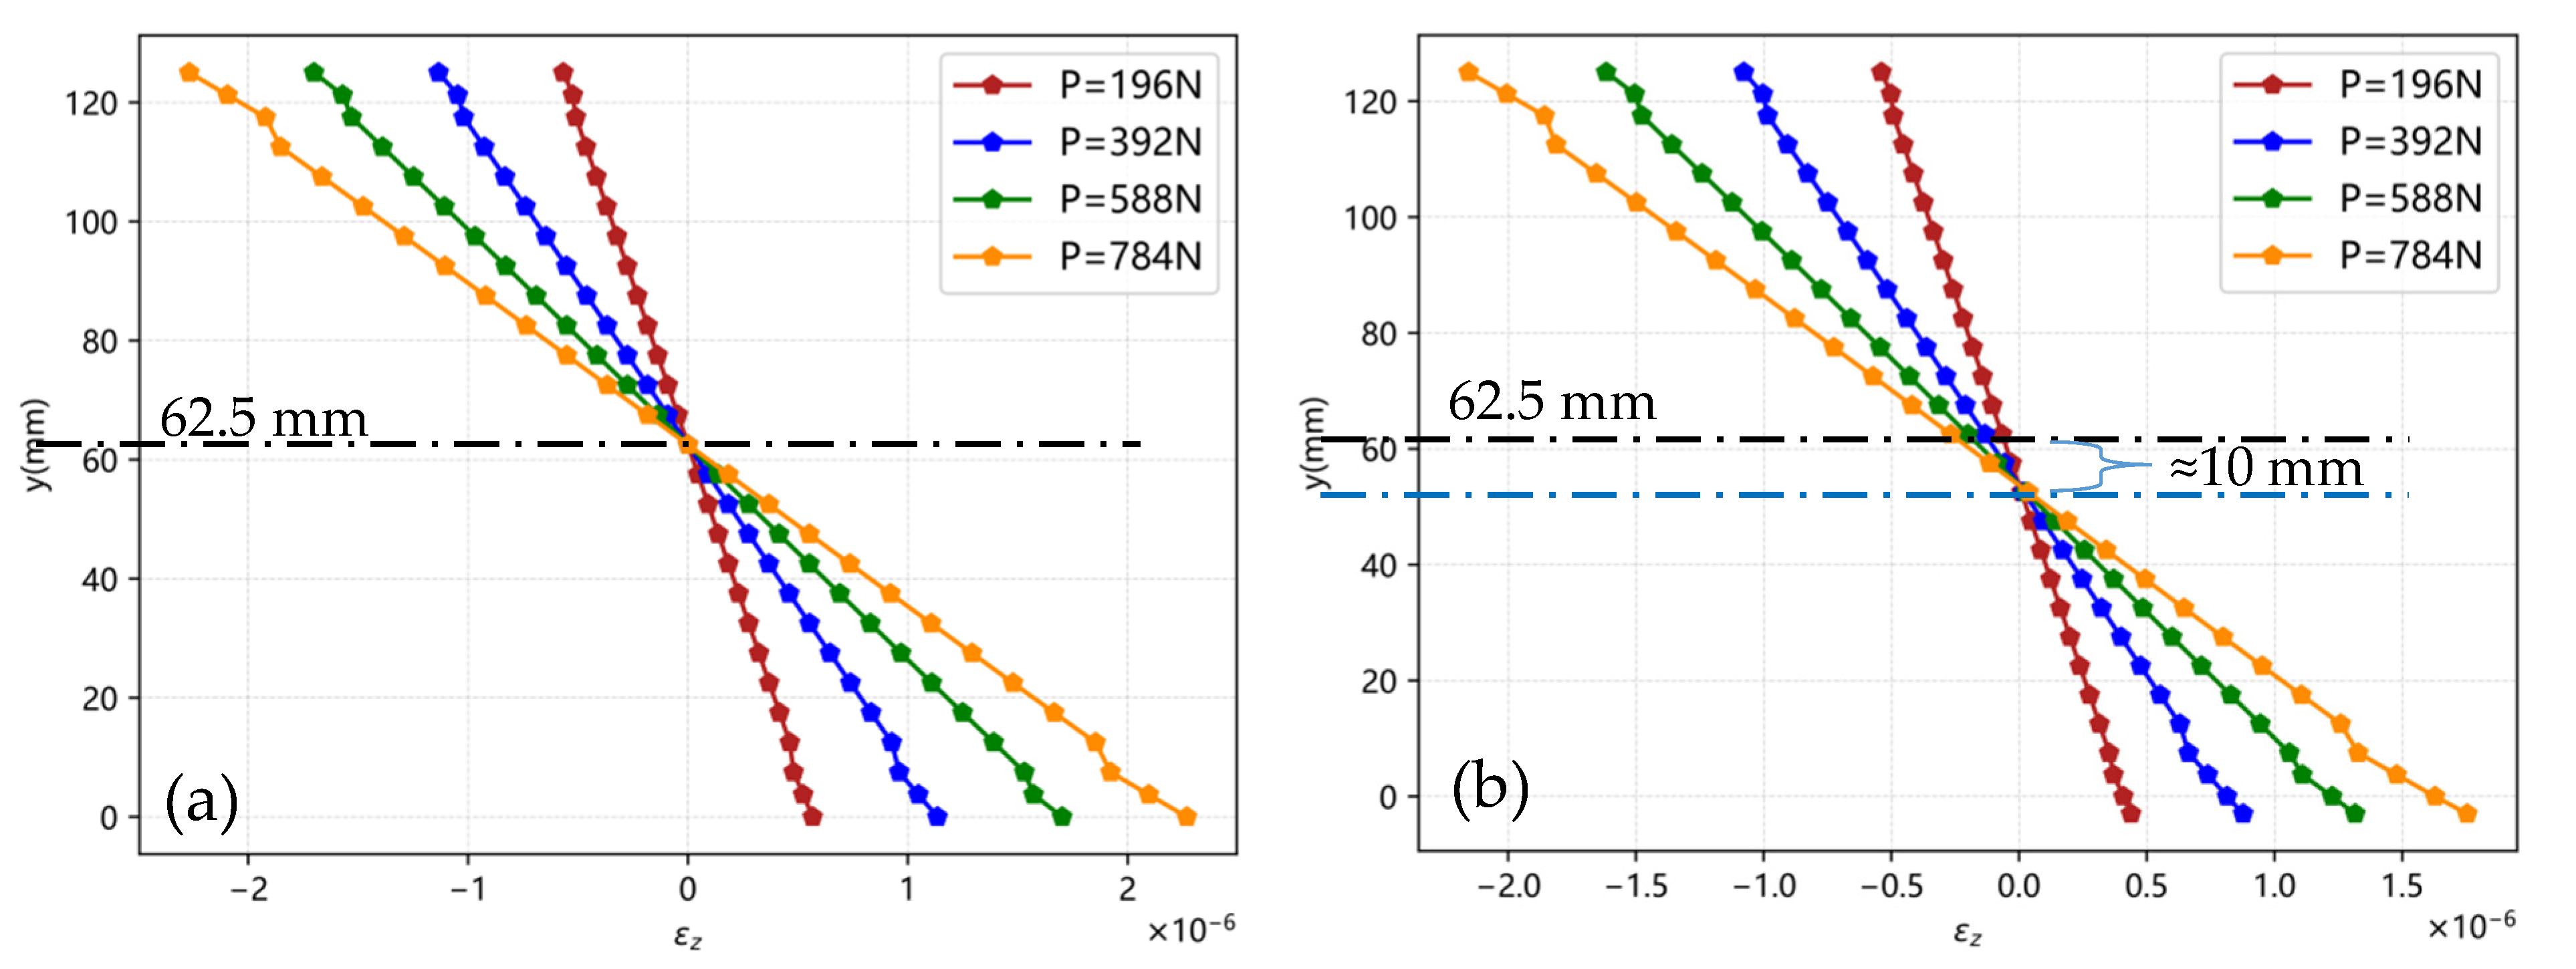
Figure 7 shows the deformation distributions of the steel beam under different point loads along the cross-section height. The strains of the measuring points in the packaged sensors (P-FBGt, P-FBGc, P-FBGd, P-FBGb, and P-FBGbb) close to the symmetrical axis of the beam are taken for the analysis. From
Figure 7, it can be seen that the strains of the measuring points close to the symmetrical axis of the beam increase with the load growth. It thus reflects that the deformation characteristics of the steel beam under four levels of loading, and the deformation magnitude increases with the increase in load. In the elastic stage, the height of the centroidal axis of the steel beam is almost unchanged. Above the height of the centroidal axis of the steel beam, the strains obtained from the measuring points are negative with different magnitudes. This indicates that the deformation of the beam above the height of the centroidal axis is in the compression state. On the contrary, the deformation of the beam below the height of the centroidal axis is in the tension state. Due to the discrete layout of the measurement points, the current monitoring data is difficult to accurately characterize the practical height of the centroidal axis in the cross-section.
Figure 7.
Deformation distributions of the steel beam under different point loads along the cross-section height.
Figure 7.
Deformation distributions of the steel beam under different point loads along the cross-section height.
- (2)
Signals measured by bare FBGs
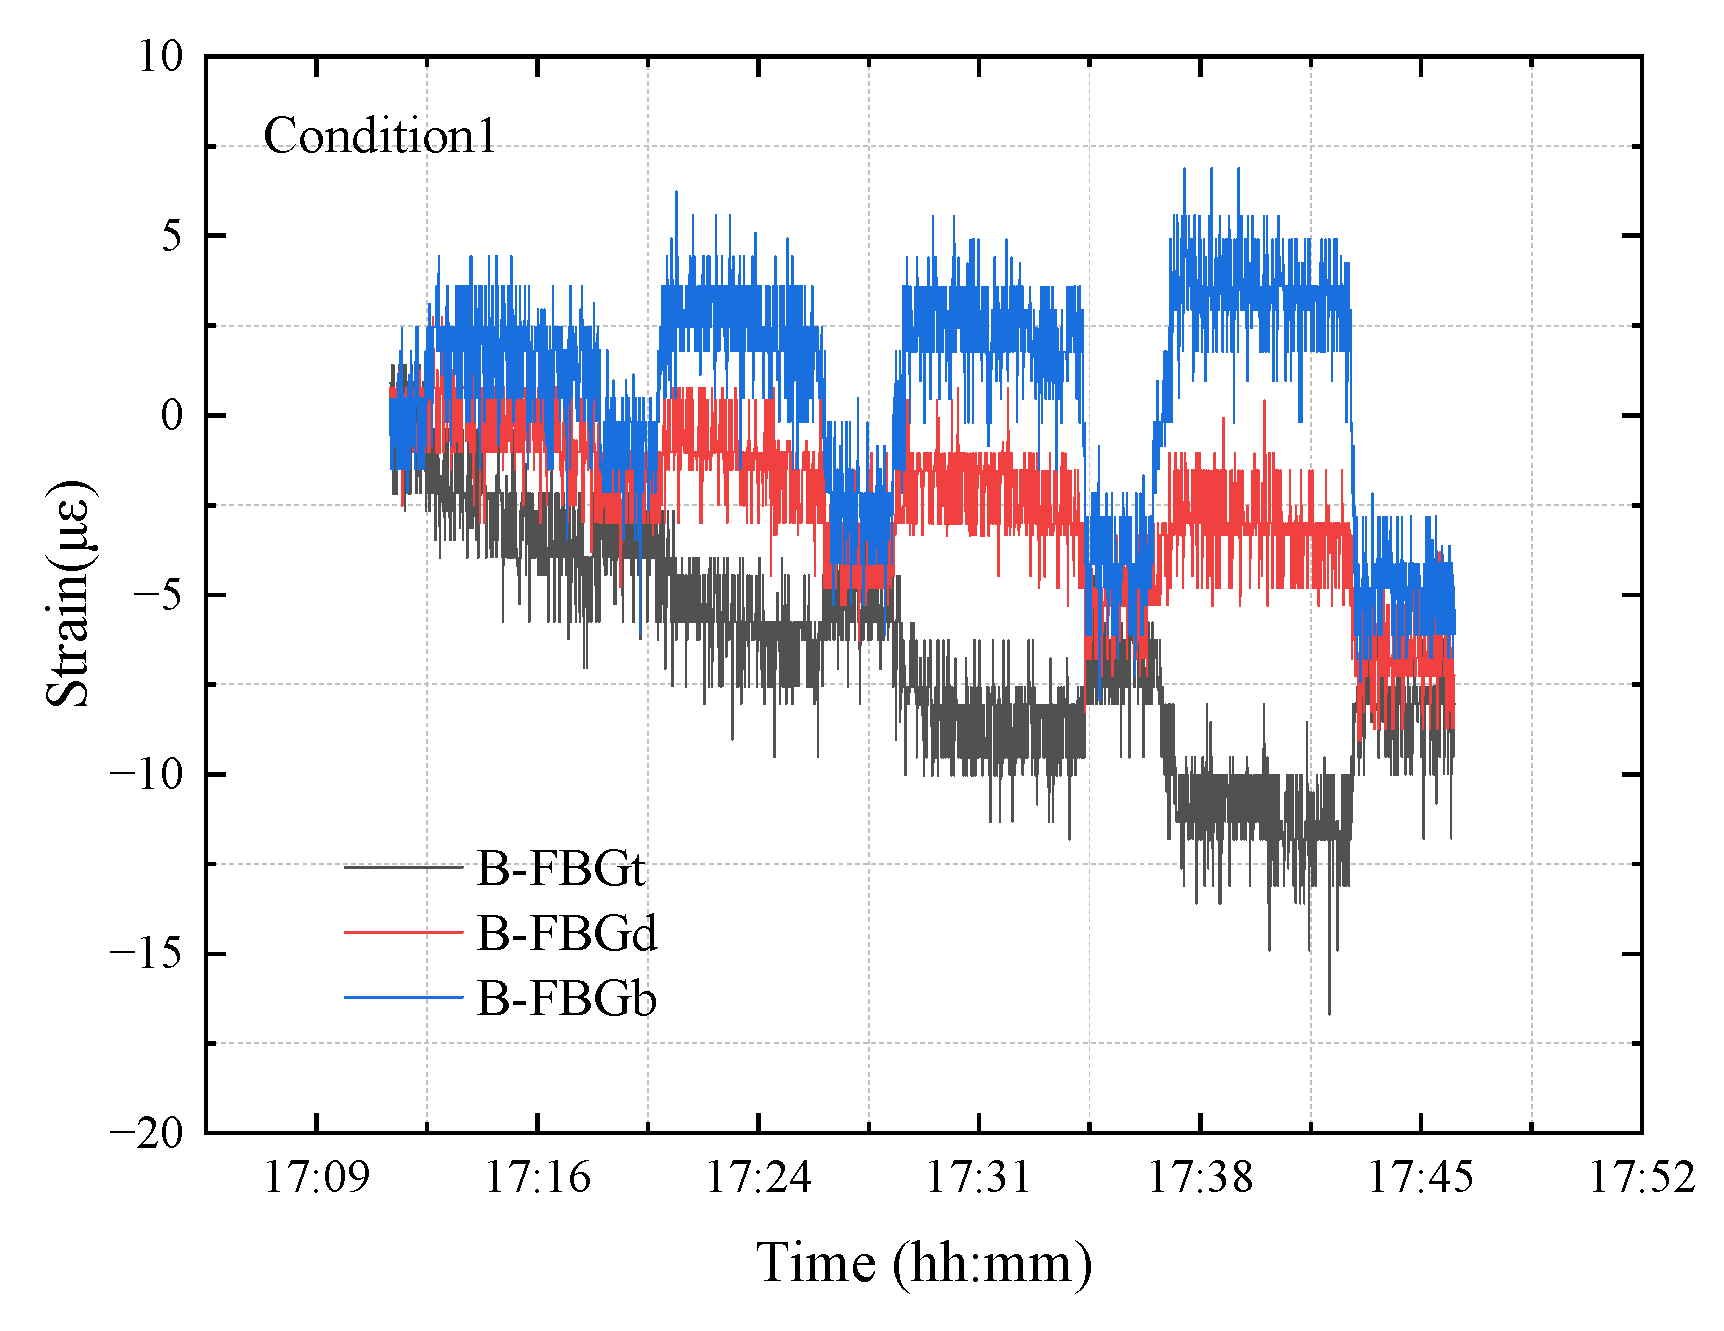
Similarly to the time-domain analysis of the measured signals of the packaged optical fiber, it was found from the strains measured by the bare FBG sensors that a clear gradation exists at all loading levels.
Figure 8 shows the signals of the bare FBGs under different point loads applied on the steel beam. From
Figure 8, it can be seen the measured strain increases gradually with the increase in the load during the four loading tests. B-FBGt, P-FBGt2, and P-FBGt3 are located in the adjacent positions of the composite structure. From
Figure 6b and
Figure 8, it can be seen that B-FBGt, P-FBGt2, and P-FBGt3 are in the compression state, and the magnitude of the strain is similar. B-FBGd, P-FBGd2, and P-FBGd3 are located in the adjacent positions. From
Figure 6d and
Figure 8, B-FBGd, P-FBGd2, P-FBGd3 are all in the compression state and the strains have similar magnitude. B-FBGb, P-FBGbb3, and P-FBGbb4 are located in adjacent positions. From
Figure 6f and
Figure 8, it can be seen that B-FBGb, P-FBGbb3, and P-FBGbb4 are all in the tension state. Overall, the monitoring effect of the bare optical fiber is obvious, and the conclusions drawn can be mutually verified with some results from the packaged optical fiber.
Figure 8 also indicates that during the unloading process, the strains of the steel beam almost recover to the initial state, which validates that the measurement is repeatable.
Figure 8.
Signals of bare optical fibers under different point loads applied on the steel beam.
Figure 8.
Signals of bare optical fibers under different point loads applied on the steel beam.
3.2.2. Deformation Monitoring of the Externally Bonded CFRP Coating During the Curing and Molding Processes
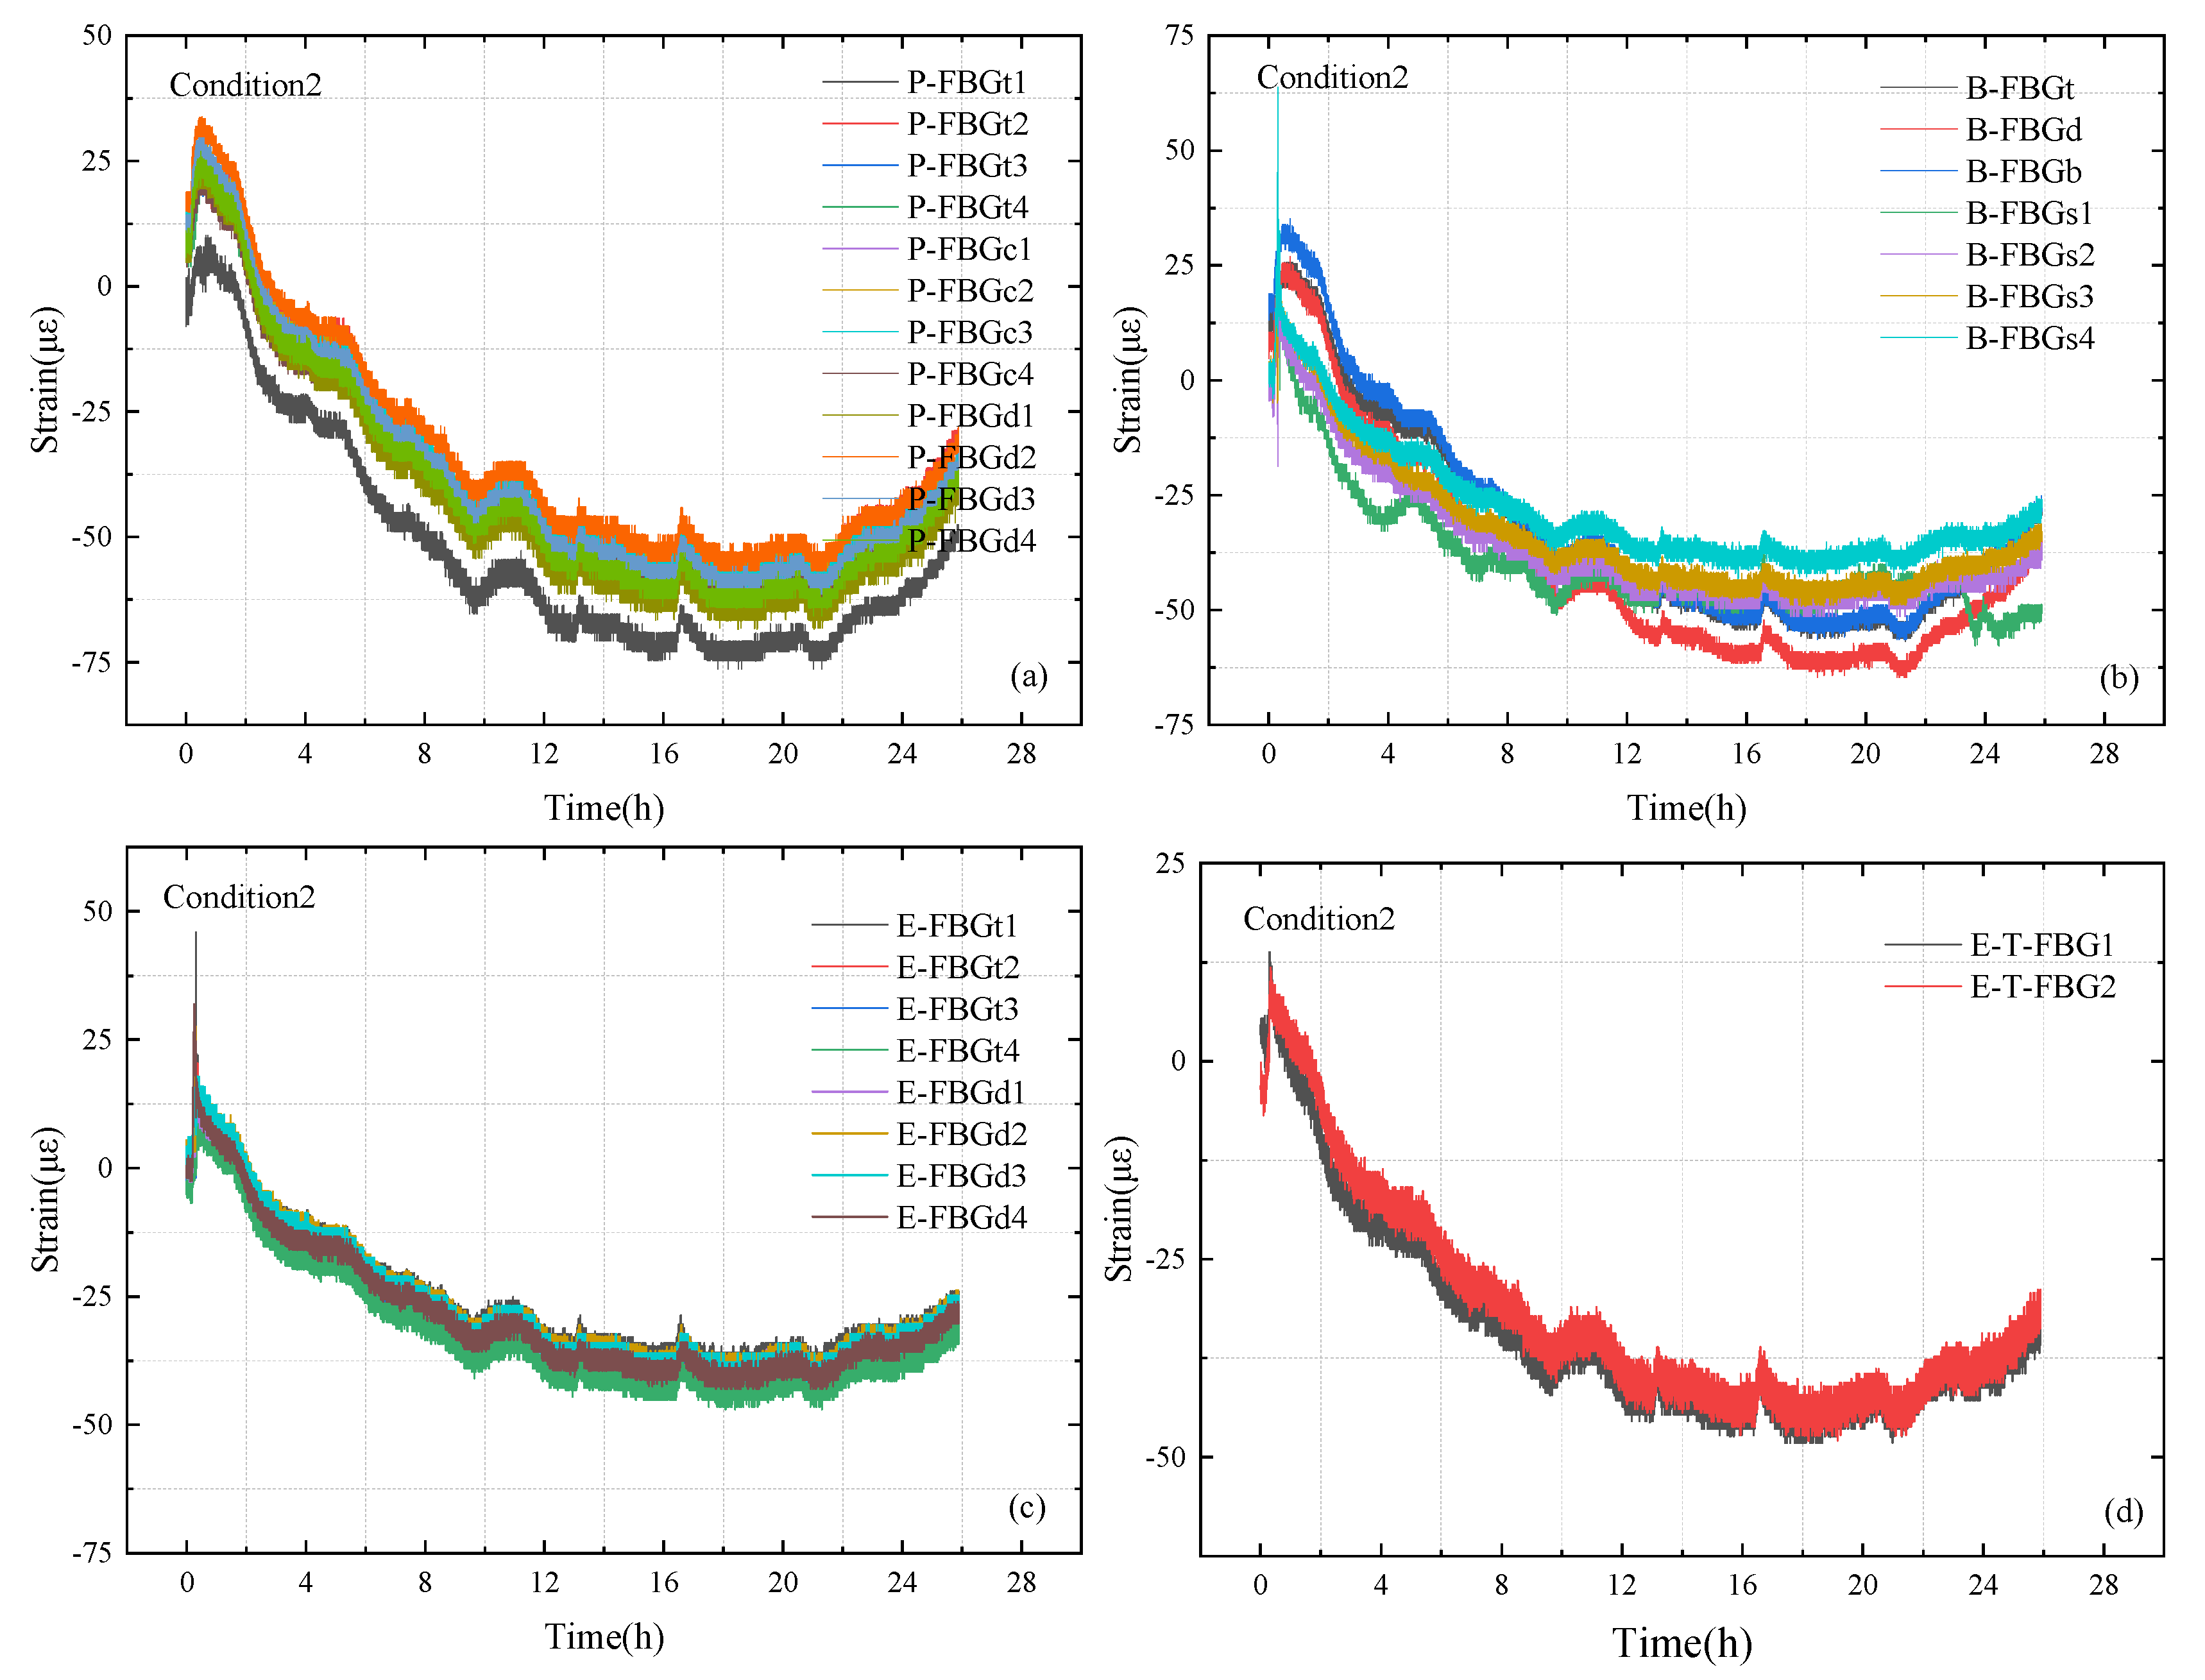
Figure 9 shows the wavelength variables of each sensor on the CFRP-reinforced steel beam during the curing and molding process. The local temperature of the structure increases when the epoxy resin is curing and exothermic, and the strains perceived by each sensor increase significantly. After curing, the local temperature of the structure gradually decreases, and the strain sensed by each sensor also gradually decreases, and finally returns to a stable level with the passage of time. Based on the differences in the amplitude of the strains perceived by the FBG sensors at different locations, it can be seen that during the curing and molding process, there is a temperature stress effect between the CFRP plates and the steel beam generated by the exothermic curing process. The maximum change amplitude of the strain is about 125 με [
40]. The monitoring data in this period also indicates that the FBG sensor just for measuring the temperature of the CFRP laminates and for temperature compensation of other strain sensors in the CFRP laminates can only be freely laid on the surface of the CFRP laminate. An embedded measurement is not feasible. The testing result provides useful sensor layout suggestions for the temperature compensation measure.
Figure 9.
Strain variation measured by FBG sensors attached on the CFRP-reinforced steel beam during the curing and molding process: (a) P-FBGt, P-FBGc, and P-FBGd; (b) B-FBGt, B-FBGd, B-FBGb, and B-FBGs; (c) E-FBGt and E-FBGd; (d) E-T-FBG.
Figure 9.
Strain variation measured by FBG sensors attached on the CFRP-reinforced steel beam during the curing and molding process: (a) P-FBGt, P-FBGc, and P-FBGd; (b) B-FBGt, B-FBGd, B-FBGb, and B-FBGs; (c) E-FBGt and E-FBGd; (d) E-T-FBG.
3.2.3. Investigation into the Bearing Capacity of the CFRP-Reinforced Steel Beam
- (1)
Signals measured by packaged FBG sensors
Figure 10 shows the signals of the packaged optical fiber under different point loads applied on the steel beam. From
Figure 10a, it can be seen that the FBG signals under various loading levels are clearly graded.
Figure 10b straightforwardly declares the four loading levels, and the strains reflected from the FBG sensors increase with the increase in the load. From
Figure 10b–d, it can be seen that the packaged optical fibers on the web surface are in the compression state. The grading of the strains measured by P-FBGd is not obvious from
Figure 10e. The reason for this may be that working condition 2 causes some disturbance to the packaged optical fiber (P-FBGb) during the unloading process. However, the positive and negative values of the strains still support the conclusion that the packaged optical fibers on the bottom flange are all in the tension state. From
Figure 10f, it can be seen that the disturbance on the packaged optical fiber (P-FBGbb) is small, and there is a more obvious grading of the measured strains.
Figure 10.
Signals of packaged optical fibers under different point loads applied on the CFRP-reinforced steel beam: (a) P-FBGbb with time; (b) P-FBGt; (c) P-FBGc; (d) P-FBGd; (e) P-FBGb; (f) P-FBGbb.
Figure 10.
Signals of packaged optical fibers under different point loads applied on the CFRP-reinforced steel beam: (a) P-FBGbb with time; (b) P-FBGt; (c) P-FBGc; (d) P-FBGd; (e) P-FBGb; (f) P-FBGbb.
Figure 11 shows the deformation distribution of the CFRP-reinforced steel beam under different loads along the cross-section height. Similarly, the strains of the measuring points of the packaged sensors (P-FBGt, P-FBGc, P-FBGd, P-FBGb, and P-FBGbb) near the symmetrical axis of the beam are taken for comparison analysis. It can be seen that the strains obtained from the measuring points close to the symmetrical axis increase with the increase in load. From this, it can be reflected that the deformation characteristics of the CFRP-reinforced steel beams under four loading levels, and the deformation magnitude of the CFRP-reinforced steel beam also increases with the increase in load. From the positive and negative values and magnitudes of the strains, it can be analyzed that the steel beam strengthened with the CFRP plate can obtain the same conclusion as the pure steel beam. Comparing
Figure 7 and
Figure 11, it can be concluded that after the CFRP reinforcement, the overall structure is changed from a pure steel beam to a CFRP-reinforced composite beam, and the height of the centroidal axis is shifted down from about 10 mm. The reason is that the CFRP plate bears a part of the tensile stress in the composite structure, and much more compression zones are required in the steel beam to achieve the force balance in the whole cross-section. In other words, CFRP plates have enhanced the bearing capacity of the steel beam.
Figure 11.
Deformation distributions measured by sensors attached on the web surface of the CFRP-reinforced beam under different point loads along the cross-section height.
Figure 11.
Deformation distributions measured by sensors attached on the web surface of the CFRP-reinforced beam under different point loads along the cross-section height.
- (2)
Signals measured by bare FBGs
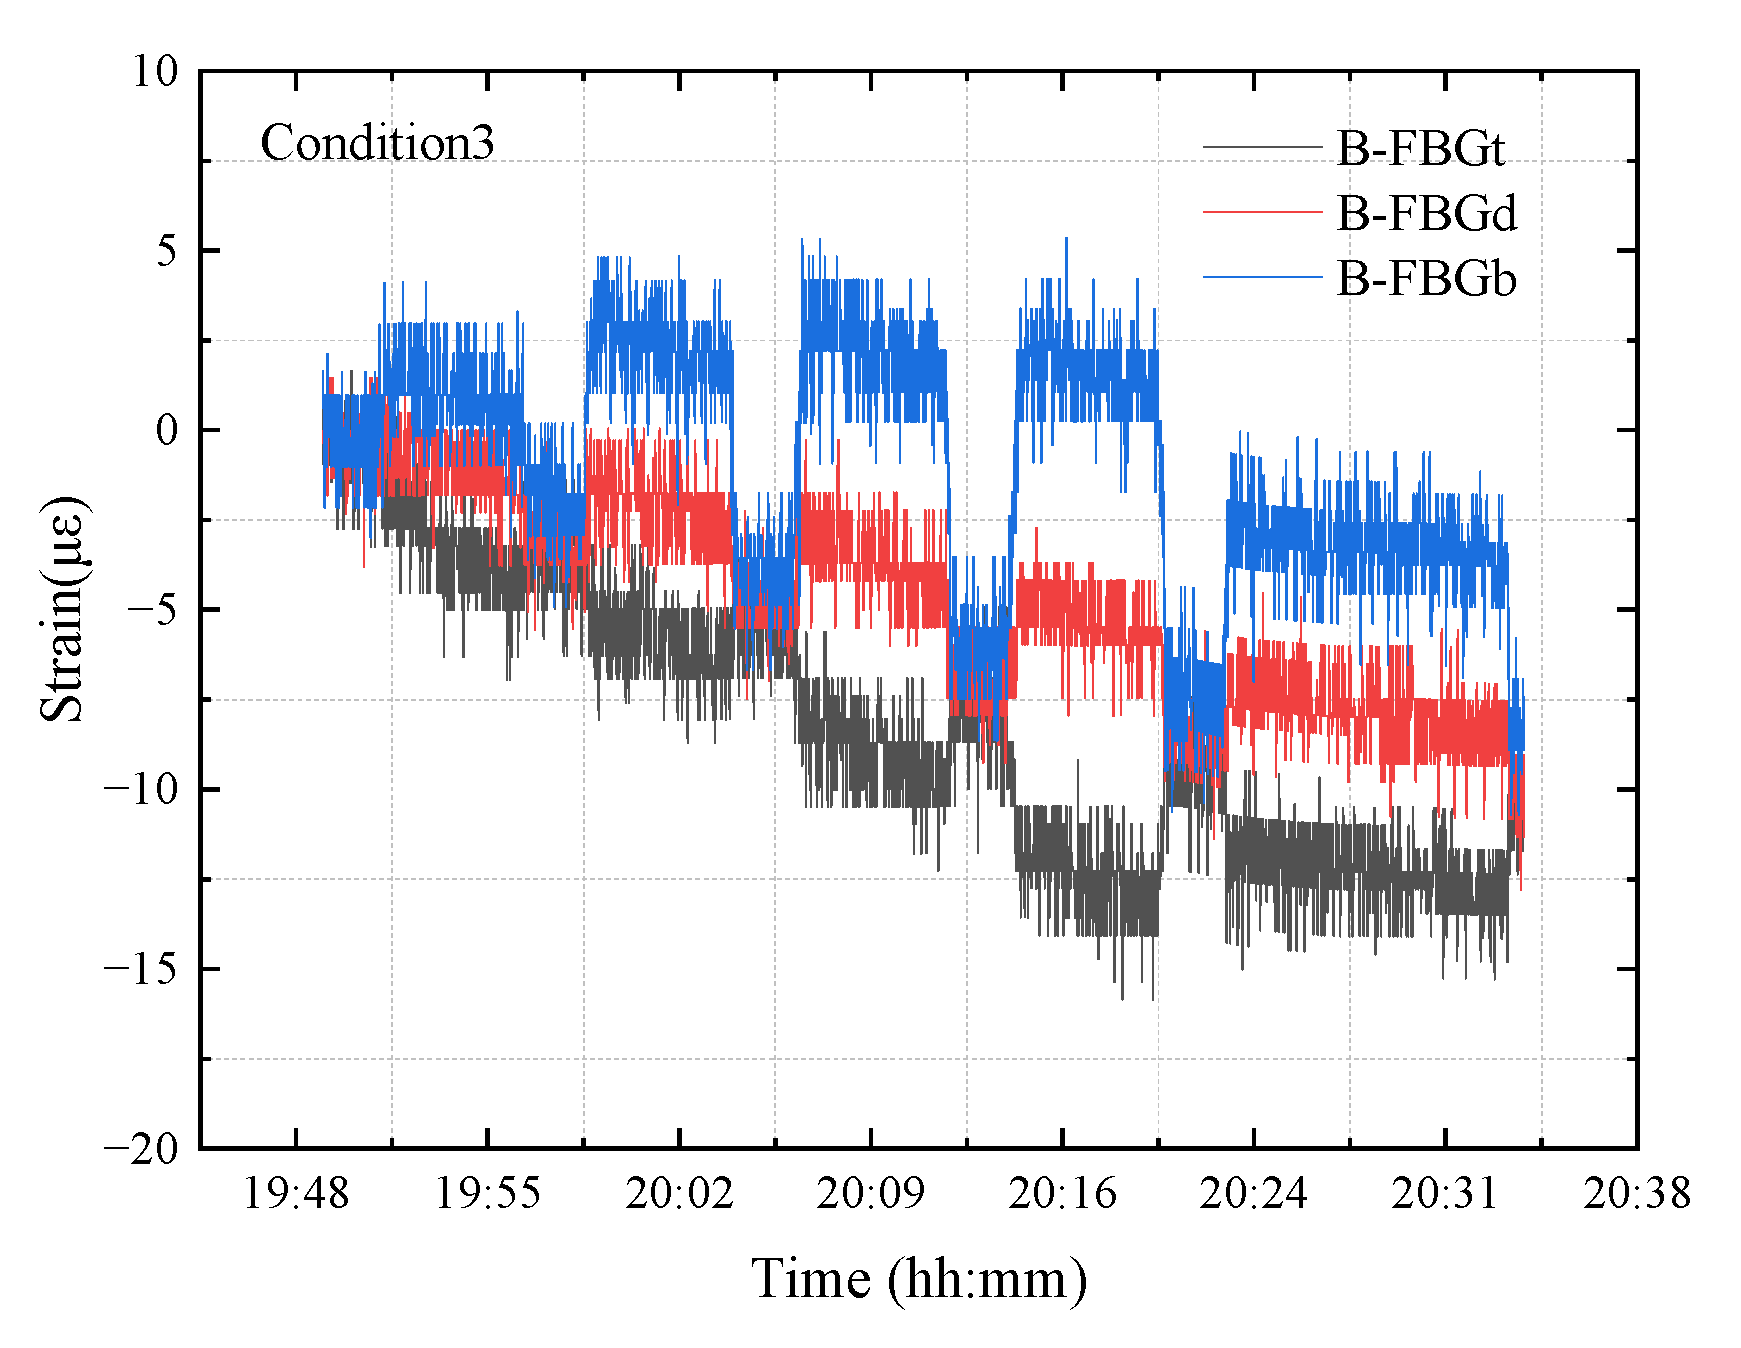
Similarly to the time-domain analysis of the measured signal of the packaged optical fiber, it is found from the strain diagram that the bare FBG signals under various loads also have obvious classifications.
Figure 12 shows the signals of the bare optical fiber on the surface of the beam under different loads applied on the CFRP-reinforced steel beam. From
Figure 12, it can be seen that the strains measured by the bare FBGs increases with the increase in load, and the same conclusion as that of the pure steel beam is obtained. In general, the monitoring effect of bare optical fibers on the CFRP-reinforced steel beam is obvious, and the conclusion can be verified with some results measured by the packaged optical fiber sensors.
Figure 12.
Signals of bare optical fibers under different point loads applied on the CFRP-reinforced beam.
Figure 12.
Signals of bare optical fibers under different point loads applied on the CFRP-reinforced beam.
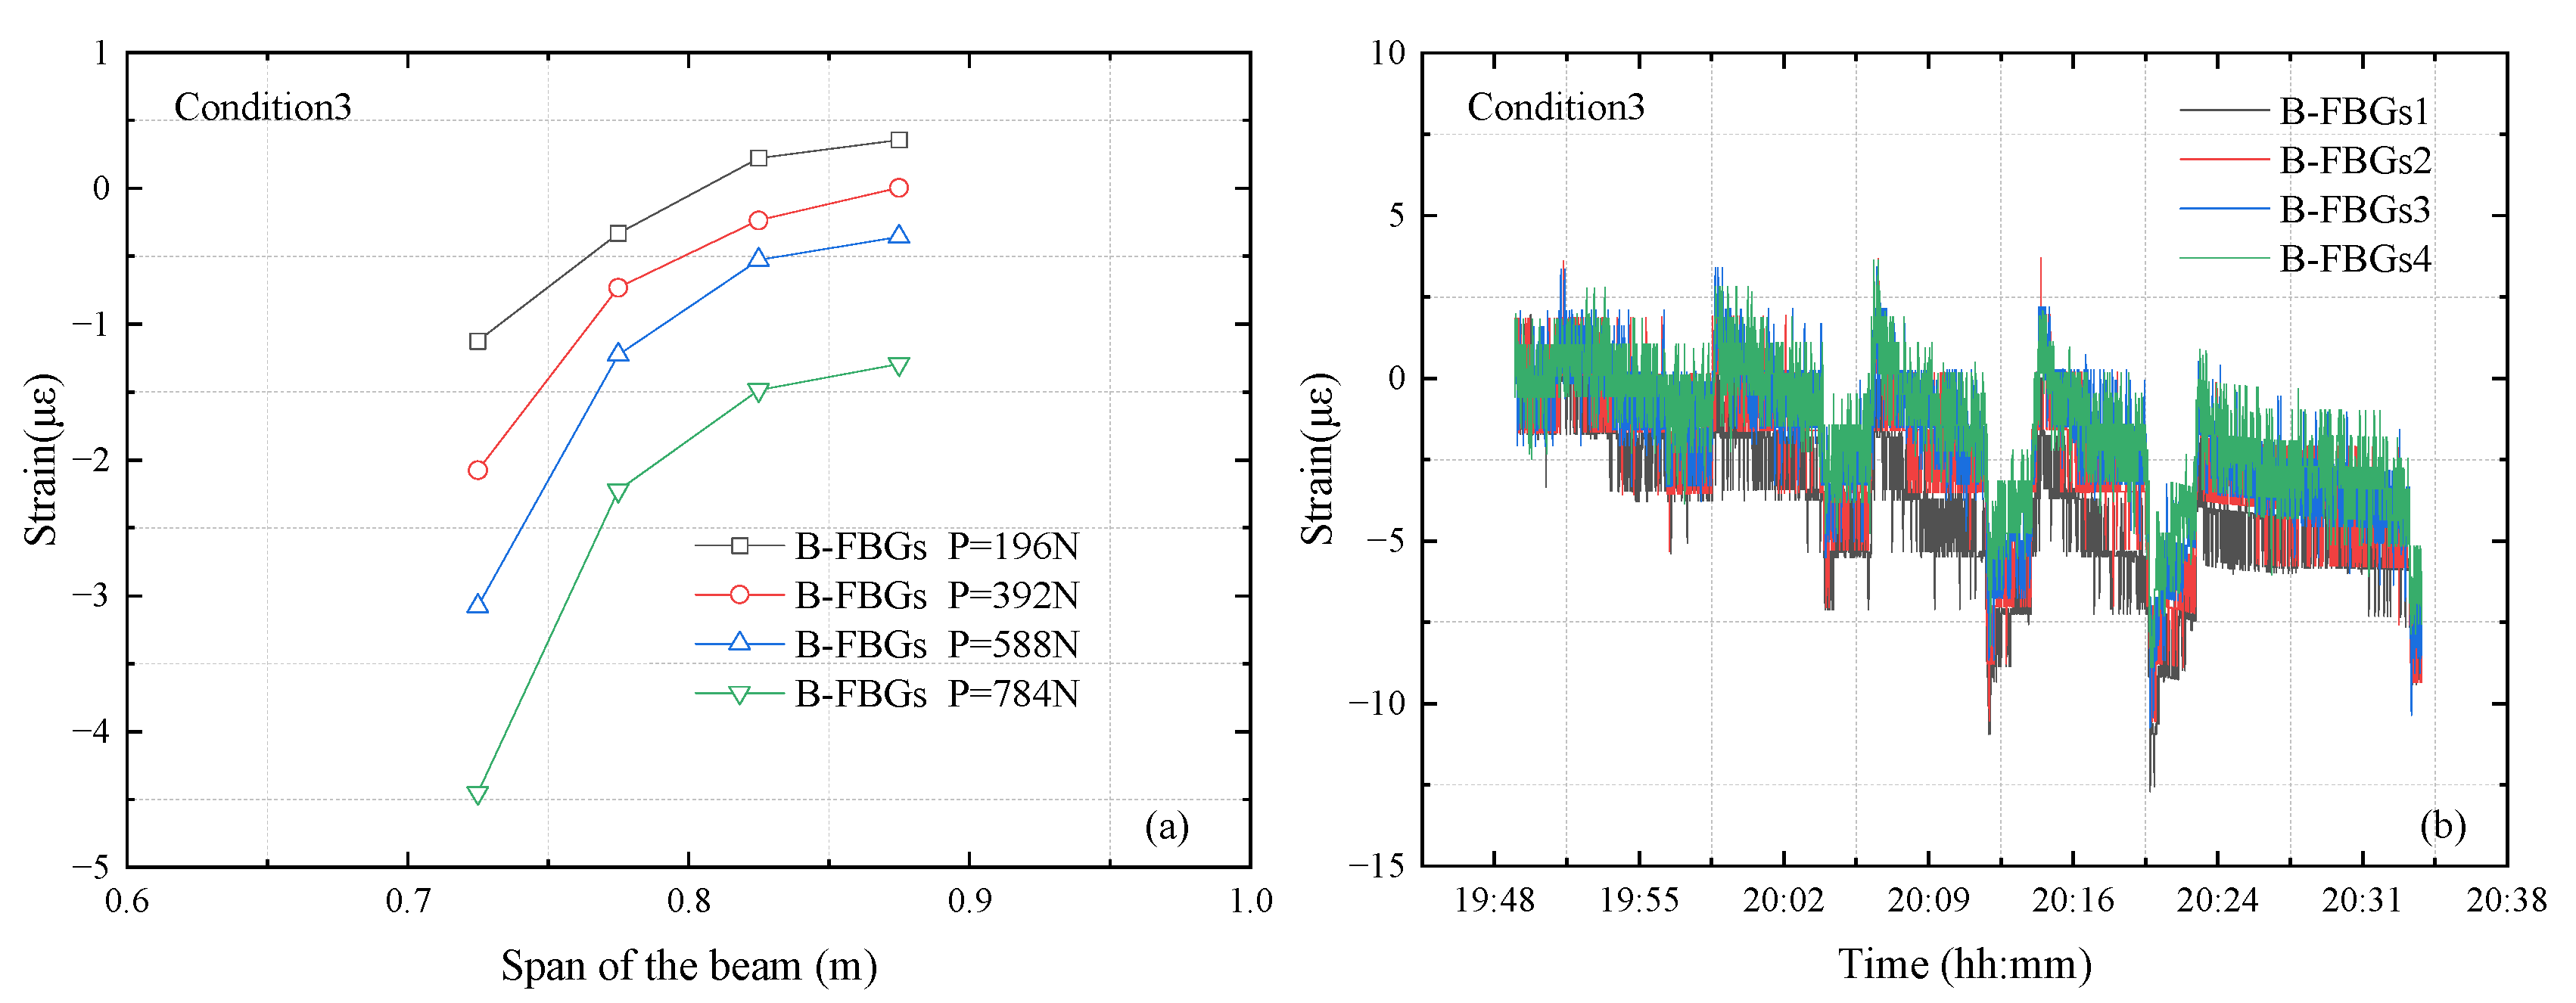
Figure 13 shows the signals of B-FBGs under different point loads applied on the CFRP-reinforced steel beam. From
Figure 13a, it can be seen that the strains of the FBG signals are negative at all loading levels. By comparing and analyzing
Figure 13b, it can be seen that the reason may be that the unloading time, taken as 2 min, is too short, and the deformation at the measuring points is not fully recovered, leading to the negative strain. This can be avoided by extending the times between the loading and unloading processes.
Figure 13.
Strains measured by B-FBGs attached on the bottom surface of the CFRP-reinforced steel beam: (a) strain variations along the span; (b) strain variations with time.
Figure 13.
Strains measured by B-FBGs attached on the bottom surface of the CFRP-reinforced steel beam: (a) strain variations along the span; (b) strain variations with time.
- (3)
Signals measured by FBGs embedded in CFRP plate
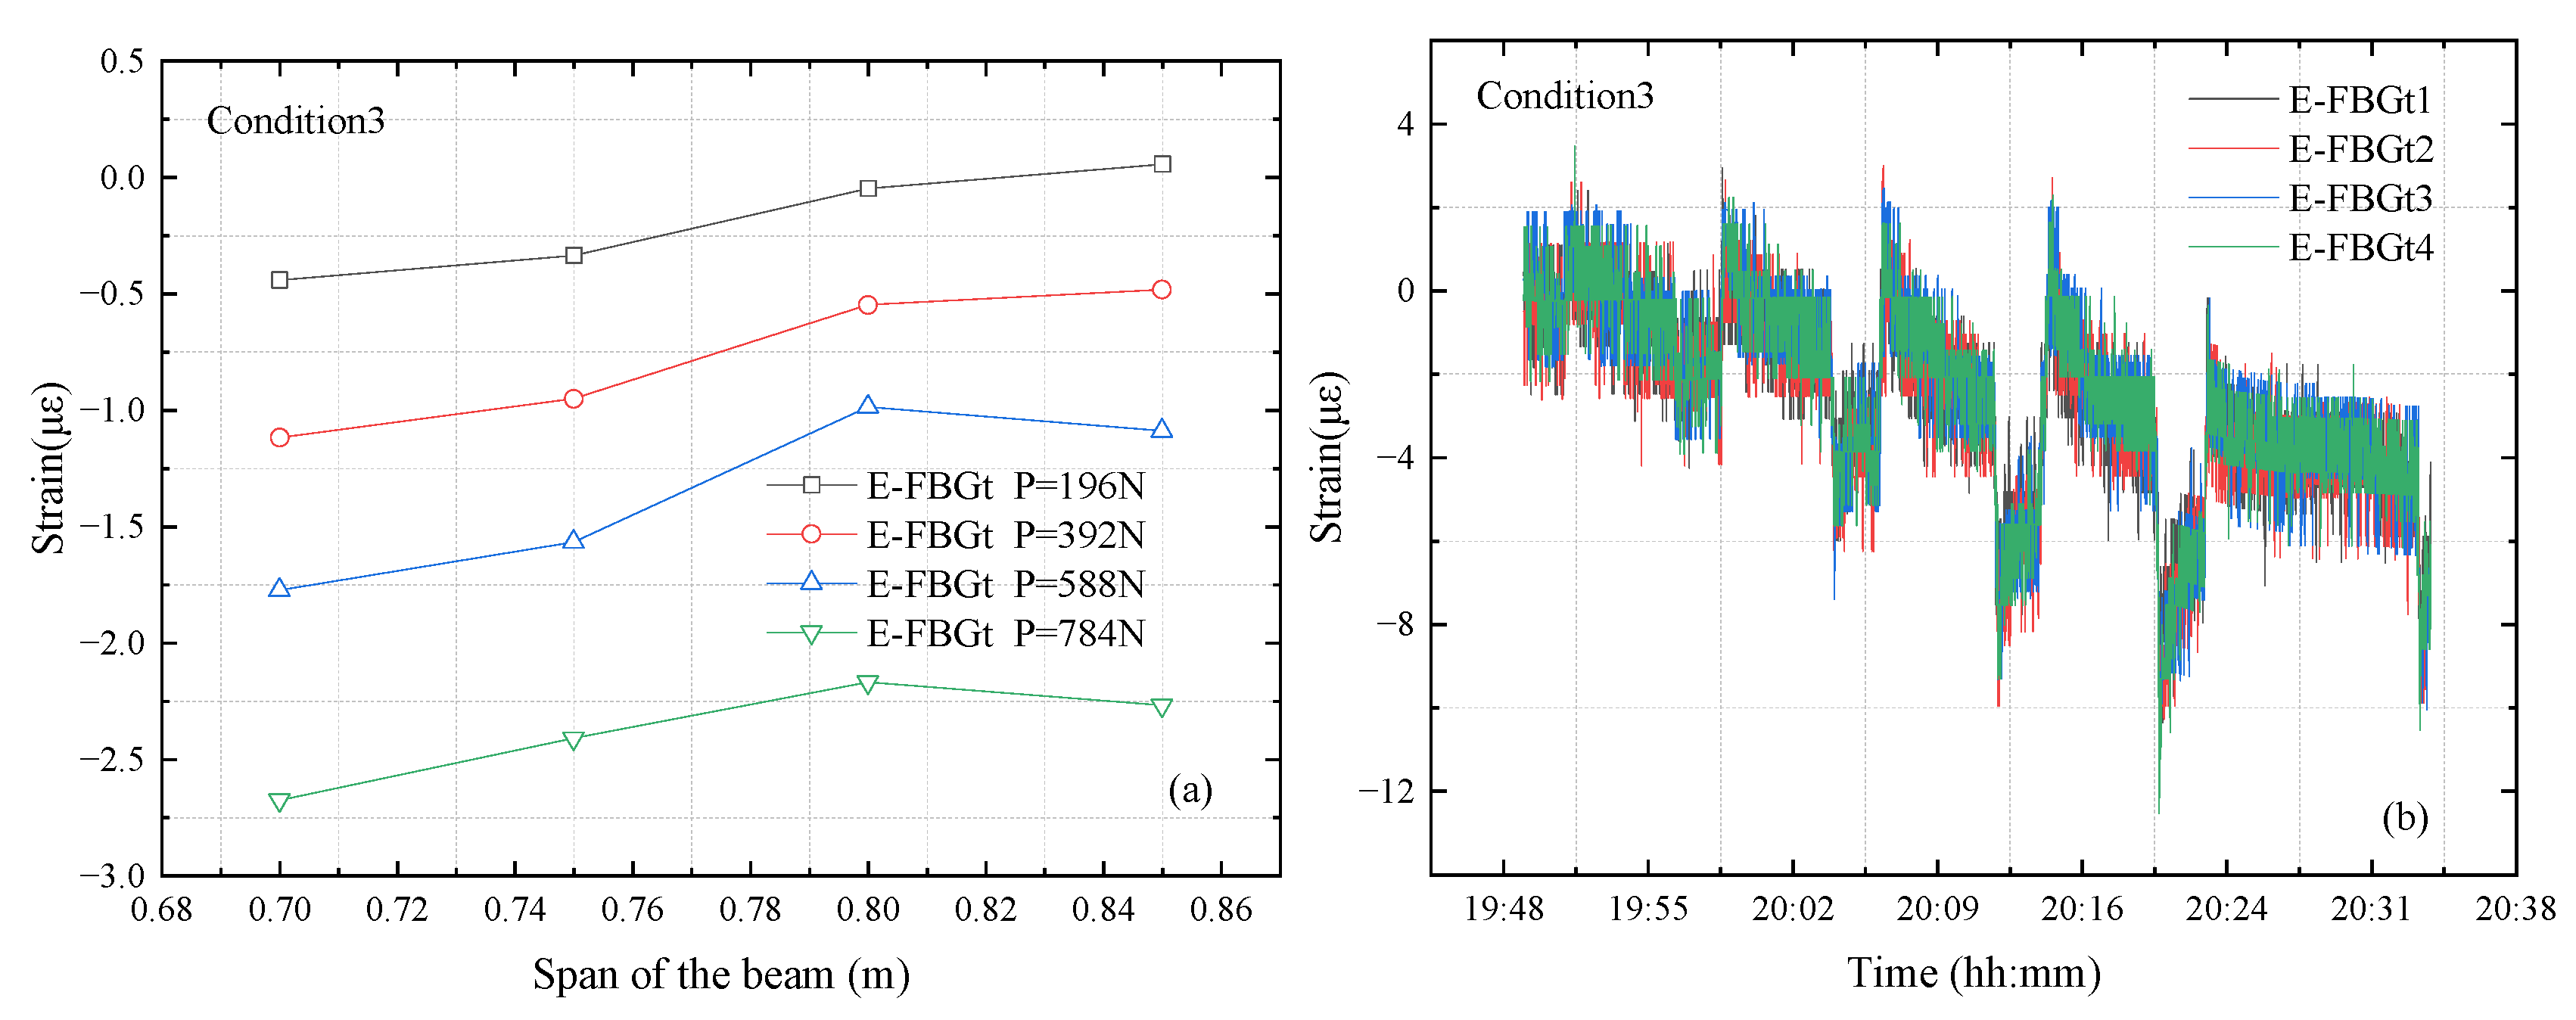
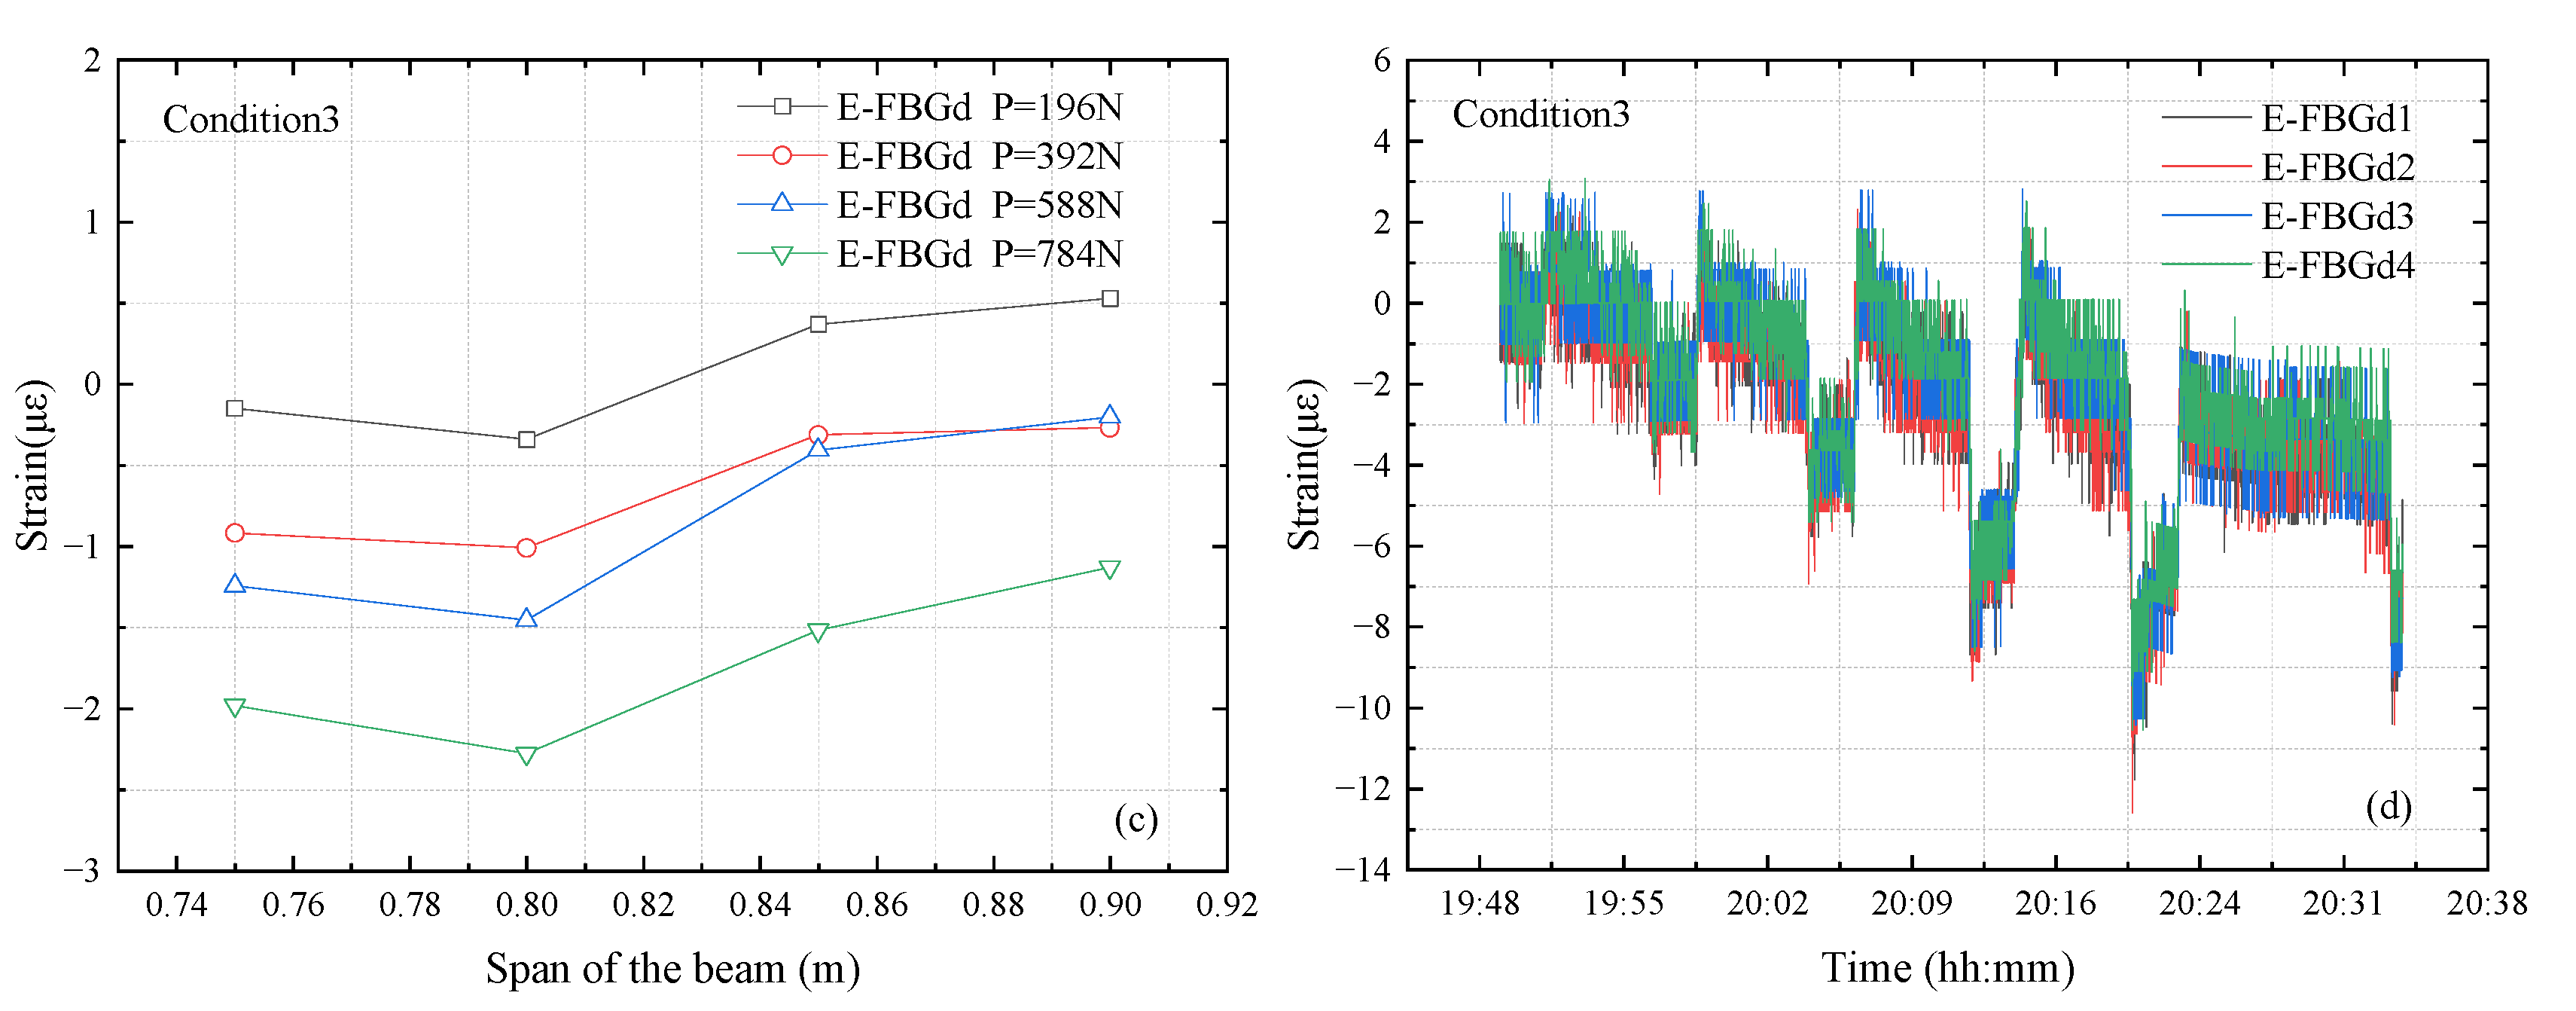
Figure 14 shows the signals of E-FBGt and E-FBGd under different loads applied on the CFRP-reinforced steel beam. Similarly to the time-domain analysis of the measured signals of the packaged and bare optical fibers, the strain diagrams of the FBGs embedded in the CFRP laminate also have obvious classifications under various loads. Similarly to the bare optical fiber (B-FBGs) bonded on the surface of the CFRP plate, the strains increase under different loading levels. However, most of the strains measured by the embedded FBGs are negative, which means that the FBG sensing fibers embedded in CFRP plate are in the compression state. The reason may be that in the fabrication process, a significant interface effect exists in the smart CFRP plate, which leads to a stress mode beyond the ideal interface connection state. Therefore, the layout design of the embedded FBG sensor needs to be refined to reduce the impact on the performance of the CFRP plate itself [
43].
Figure 14.
Measurement information of E-FBGt and E-FBGd under different point loads applied on the CFRP-reinforced steel beam: (a) strain profiles along the span and (b) strain variations with time measured by E-FBGt; (c) strain profiles along the span and (d) strain variations with time measured by E-FBGd.
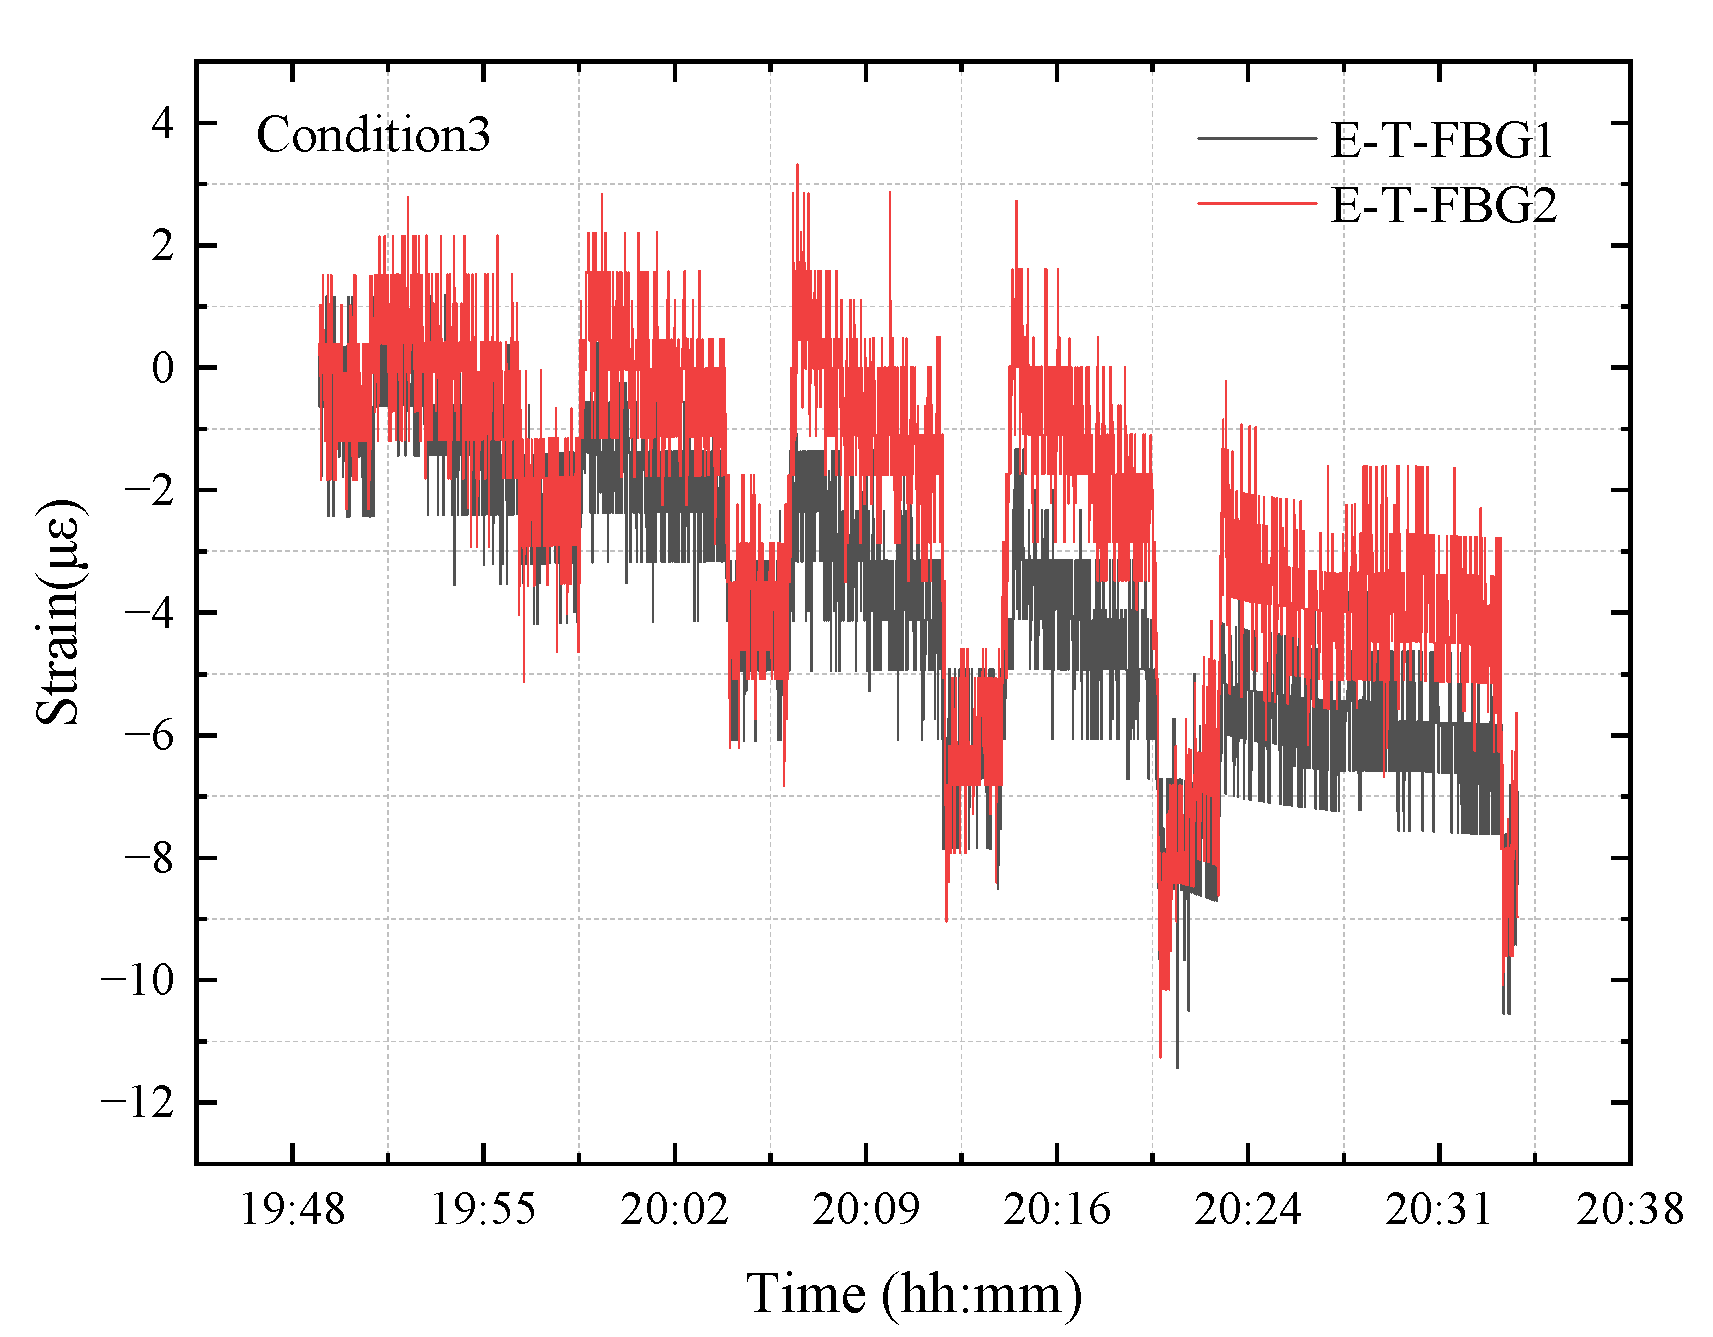
Figure 15 shows the signals of the E-T-FBG under different loads on the CFRP plate reinforced steel beam. Similarly to the analysis of temperature sensor in the impact experiment of CFRP-reinforced beams [
37],
Figure 15 also shows that E-T-FBG, as a temperature sensor, can also sense the mechanical strain. The reason may be that the embedded free FBG is constrained by the surrounding pipe, and the white pipe has been squeezed and deformed during the forming process to constrain the free FBG. This indicates that it is impossible to insert a free FBG in CFRP laminates to sense the temperature effect. Other measures (i.e., the surface sensor) should be considered to characterize the temperature variation in the CFRP laminates.
Figure 15.
Signals of E-T-FBG at different moments under various point loads applied on the CFRP-reinforced beam.
Figure 15.
Signals of E-T-FBG at different moments under various point loads applied on the CFRP-reinforced beam.
3.3. Assessment on Strengthening Effect
To declare the strengthening effect of the CFRP component on the bearing capacity of the steel beams, the strains reflected from the same sensors on the web and bottom surfaces of the steel beam before and after the reinforcement under the same load are compared and analyzed. Condition 1 refers to the pure steel beam and Condition 3 refers to the CFRP-reinforced steel beam.
Figure 16 shows the comparison of signals sensed by P-FBGb and P-FBGbb under different point loads applied on the pure steel beam and CFRP-reinforced steel beam. The third-level loading (588 N) and fourth-level loading (784 N) for Condition 1 and Condition 3 have been taken for comparison. From
Figure 16, it can be seen that the strains of each measuring point decrease to a certain extent after the steel beam has been strengthened with the CFRP component. The reason is that the CFRP component shares a part of the tensile stress for the steel beam bottom flange. Therefore, the proposed CFRP component has a certain enhancement effect on the bearing capacity of the steel beam.
Figure 16.
Comparison on sensing signals of P-FBGb and P-FBGbb attached on the pure steel beam (Condition 1) and CFRP plate-reinforced steel beam (Condition 3) under different loads: (a,c) P = 588 N; (b,d) P = 784 N.
Figure 16.
Comparison on sensing signals of P-FBGb and P-FBGbb attached on the pure steel beam (Condition 1) and CFRP plate-reinforced steel beam (Condition 3) under different loads: (a,c) P = 588 N; (b,d) P = 784 N.
To intuitively illustrate the enhanced effect of CFRP reinforcement on the beam’s bearing capacity, the measured deformation distributions from the packaged FBG sensors (P-FBGt, P-FBGc, P-FBGd, and P-FBGb) attached on the beam web have been given along the cross-section height of the pure steel beam (Condition 1) and CFRP-reinforced steel beam (Condition 3).
Figure 17 shows the deformation distribution along the cross-section height of the steel beam before and after the reinforcement under the point loads. It can be seen that the strain of the beam bottom flange is significantly reduced after the steel beam is reinforced with CFRP plate. The reason is that the tensile stress of the CFRP-reinforced steel beam is partly carried by CFRP plates, and the deflection of steel beams is reduced after the CFRP reinforcement. It also indicates that the height of the centroidal axis of the steel beam decreases about 10 mm after the reinforcement, as shown in
Figure 18. Therefore, under the same static load, the CFRP plate reduces the deflection of the beam to a certain extent. The reinforcement effect and self-sensing function of the smart CFRP plate have good application value in practical engineering. The continuous and stable monitoring of smart CFRP-reinforced steel beams in different stages validates that the proposed sensors, sensor layouts and the monitoring measure can perform the whole life-cycle monitoring.
Figure 17.
Comparison on deformation distributions of the pure steel beam (Condition 1) and CFRP-reinforced steel beam (Condition 3) along the cross-section height: (a) P = 588 N; (b) P = 784 N.
Figure 17.
Comparison on deformation distributions of the pure steel beam (Condition 1) and CFRP-reinforced steel beam (Condition 3) along the cross-section height: (a) P = 588 N; (b) P = 784 N.
Figure 18.
Variation in the height of the centroidal axis of the steel beam before and after the strengthening measure: (a) pure steel beam; (b) CFRP reinforced steel beam.
Figure 18.
Variation in the height of the centroidal axis of the steel beam before and after the strengthening measure: (a) pure steel beam; (b) CFRP reinforced steel beam.
5. Conclusions
The strengthening process and strengthening effect of CFRP-coated structures have always been attractive for improving the convenient construction and quick performance enhancement of aged or damaged structures. Therefore, a monitoring system based on FBG sensors has been proposed to characterize the structural performance and the strengthening effect of the smart CFRP-coated structures. Both experimental investigation and FEM-based simulation analysis have been conducted to validate the effectiveness and feasibility of the proposed method, which can be further considered for application in practical projects. The following conclusions can be drawn from the study:
(1) The general structural performance of the steel beam before and after the reinforcement can be accurately characterized from the externally bonded bare and packaged optical fiber sensors. The monitoring quality has been validated by the FEM-based simulation results, which indicates that the suggested sensing system can be further adopted in practical engineering.
(2) Both the bare and packaged FBG sensors can sensitively measure the deformation of the beam under different loads, and the general deformation profiles can also be accurately characterized. Therefore, in practical engineering applications, it is recommended to use both FBG sensors for monitoring data alignment, calibration, and correction. The bonding quality of the sensors should be carefully controlled. It is generally suggested that the bare FBG sensor is just for sensing the tensile deformation, and the packaged sensor can be adopted for both the compression and tensile deformation.
(3) The strengthening effect can also be accurately read from the monitoring data of the discrete measurement points accompanied with the theoretical basis. The FBGs embedded in the CFRP laminates are generally suggested to primarily measure the strain response. The current results indicate that the embedded free FBGs can be influenced by the fabrication process, which may cause pre-strain or bonding imperfections and affect measurement accuracy. Furthermore, embedded sensors are difficult to access or replace once the composite is fabricated, making maintenance and recalibration challenging during long-term service. In addition, the embedding process may introduce local material discontinuities or weaken the structural integrity of the CFRP laminate if not properly executed. For temperature measurement and compensation purposes, it is therefore recommended to place free FBGs on the surface of the laminate without constraint to avoid strain interference and ensure reliable thermal readings. Overall, while embedded FBGs offer effective strain monitoring capabilities, their limitations in terms of installation complexity and maintainability should be carefully considered in practical applications.
Based on the continuous and stable monitoring data analysis of smart CFRP-coated steel beams in different stages, it can be concluded that the proposed sensors, sensor layout, and the monitoring measure can perform the whole life-cycle monitoring for CFRP-coated structures. In future research, CFRP-reinforced structures under complex dynamic loading conditions (i.e., fatigue tests) will be investigated to further explore the reliability and reinforcement effect. Long-term monitoring experiments will also be conducted over extended service periods to provide scientific basis for understanding the structural performance degradation and guide structural maintenance strategies. Comparative reinforcement analysis on structures with alternative reinforcement methods (i.e., steel plate bonding, prestressing) via experiments or simulations will also be considered in future work to better understand the advantages and limitations of CFRP-reinforced structures. This can promote the development and application of optical fiber sensor-based smart health monitoring systems in CFRP structures.

 ,
, 


