Abstract
Full control of the light field at the tip of the fiber holds the possibility of producing structured illumination patterns such as LG-beams or vector light fields, which have important applications in different fields such as imaging and quantum technologies. In this work, we show how, by measuring the transmission matrix (TM) and shaping the input of a few-mode fiber, we are able to produce cylindrical vector beams at the fiber output. We use singular value decomposition (SVD) to analyze the TM and use the singular vectors as the basis for beam shaping. We demonstrate the method in three different commercially available fibers supporting 6, 12 and 16 modes each.
1. Introduction
In recent years adaptive optics have allowed for the control of the light field through multiple scattering media [1,2,3,4,5] and optical multimode fibers (MMFs) [6,7,8,9]. In essence, by shaping the wavefront launched into the scatterer, it is possible to attain full control of the spatial distribution of the light after the scattering event. Moreover, multiple experimental results have shown the possibility of controlling the output polarization as well [10,11,12,13]. One of the most popular methods to achieve this is by acquiring the transmission matrix, TM, of the scatterer or optical fiber [14,15,16]. MMFs in conjunction with this approach have since been demonstrated as a useful tool in a variety of applications ranging from sensing [17,18] to minimally invasive tissue imaging [19,20,21]. These applications find an advantage in the fiber’s small diameter, which can be well below 100 μm, giving the fiber an upper hand in accessing difficult-to-reach places. Additionally, optical fibers are resistant to harsh environmental conditions, making them a very attractive option for sensing applications in such environments [13]. Other applications can be found in telecommunications, e.g., mode-division multiplexing [22], where the characterization of the fiber through its TM can lead to increased bandwidth.
Full control of the light field at the tip of the fiber holds the possibility of producing structured light patterns such as cylindrical vector (CV) beams [23]. Structured light has important applications in optical trapping [24,25], telecommunications [26] and imaging [11,19,27,28,29]. Moreover, CV beams have gained wide interest in the field of quantum technologies [30,31] such as in quantum key distribution (QKD) [32] and quantum memories [33]. The generation of CV beams includes numerous passive and active approaches, ranging from specially designed optics [34,35], computer holography [36,37], specialty fibers [38,39,40] and standard fibers under special configurations [41]. The full control of the polarization of a tightly focused spot through MMFs and few-mode fibers (FMFs) has been demonstrated in other publications [11,15,42,43]. Work in structured vector light fields is more scarce [44,45]. It is worth noting that the few-mode regime remains an active area of interest since it can provide significant advantages over both single-mode (SM) and MMFs [46]. Both FMFs and MMFs can transmit spatially encoded information, a physical impossibility in the SM regime, or act as a sensor via intermodal coupling [47]. However, FMFs maintain a small and manageable mode set that is easier to control and analyze. A fiber originally designed for SM operation can be brought to a few-mode regime simply by using a shorter wavelength. Importantly, SM fibers form the bulk of current optical communication infrastructure, and their operation in a few-mode regime aided by advanced light shaping techniques can enable new applications. However, SM fibers have refractive index profiles that can differ substantially from the typical step-index configuration [48] making the calculation of the guided modes difficult. This can be circumvented by characterizing the fiber through its TM.
In this work, we demonstrate how the TM approach can be applied to generate high-quality CV beams at the tip of commercially available optical fibers, as a step towards applications in sensing and communications, both classical and quantum. We utilize the singular vectors derived from the singular value decomposition (SVD) of the TM to calculate the required fiber input light field so that CV beams are obtained at the output of three different fibers supporting 6, 12 and 16 modes. To determine the required input, we treat the CV beams as the superposition of two OAM Laguerre–Gaussian-like modes with orthogonal circular polarizations and opposite topological charge [23]. The fibers used were designed for single-mode (SM) operation but are shifted to a few-mode guiding regime by employing a shorter wavelength.
2. Methods
2.1. Experimental Setup
Our setup characterizes the light transport properties of the fiber by successively projecting a series of spots in a raster scan manner across a area on the fiber input. The scan is run twice using first left- and, afterwards, right-handed circular polarization, forming a basis, , of independent input locations. Each of these input focal points corresponds to displaying a blazed grating on the SLM and are a subset of the discretized SLM far-field, . A simplified schematic of the experimental setup can be seen in Figure 1.
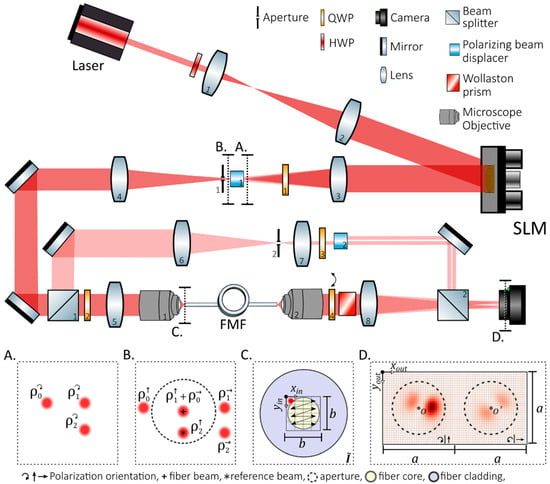
Figure 1.
Schematic diagram of the experimental setup used. (A,B): Cross-section of the beams seen near the focal plane of lens 3, i.e., Fourier plane of the SLM, before and after a calcite polarizing beam displacer (PBD), respectively. Beams, and , circularly polarized by QWP-1, correspond to three different blazed gratings on the SLM, which can be simultaneously displayed. After the PBD, the vertical and horizontal polarization components of and overlap resulting in a beam whose polarization can be systematically controlled solely by varying the SLM pattern. Aperture-1 blocks unwanted light allowing + and to pass. BS-1 splits the beam into a reference and object arm. On the object arm, the fiber beam, composed of + , is launched into the fiber after going through QWP-2; the fiber itself acts as an additional spatial filter rejecting , which is positioned outside the fiber core and is therefore not guided. On the reference arm, is used as the reference beam for interferometric measurements while all other remaining light is blocked using aperture 2. (C): Input plane showing the raster scanning of the input facet, the fiber acts as an additional spatial filter since light falling outside the fiber core is not guided. (D): Imaging of the output fiber facet showing a typical speckle pattern. A Wollaston prism inserted in the infinity space of microscope objective 2 allows for orthogonal polarization components to be imaged in two sections of the imaging sensor; and indicate the central axis of the fiber for a given polarization. Whether circular or linear polarization is measured is determined by QWP number four. Circular polarization was used for the measurement of the TM, while linear polarization was used when analyzing the resulting CV beams. The FMF was wound into a 10 cm diameter coil and fixed to the optical table.
For this work we used a narrow linewidth butterfly laser working with a wavelength, , of . The beam was expanded to illuminate a sufficiently large portion of the screen of a liquid crystal on silicon (LCoS) Thorlabs Exulus HD-2 spatial light modulator (SLM) in an off-axis configuration. A quarter waveplate (QWP) in conjunction with a birefringent beam displacer (BD40 Thorlabs) was placed after an imaging lens following the SLM (Figure 1, L-3, QWP-1 and BD-1). The BD’s function is to shift the vertical component from the horizontal component of the circularly polarized beams by a fixed distance, . A SLM can display a single hologram that will generate multiple spots, with varying amplitude and phase, when imaged. This hologram results from the phase distribution obtained from the complex weighted addition of the gratings corresponding to those spots [9,15]. By locating two beams at a distance of from each other, we can overlap the horizontal component of one with the vertical component of the other using the BD. This allowed us to create a region of the focal plane where horizontal and vertical polarization could be controlled independently by varying the phase and amplitude of each of the overlapped spots ( and in Figure 1 inserts A and B); an aperture was used to block unwanted light, in a similar way to previously reported works [15,18,19]. A third spot ( Figure 1 inserts A and B) was generated for use as a reference in interferometric measurements performed on the output end of the fiber. For this purpose, the light path is split into a reference and object path using beam splitter (BS) 1, as seen in Figure 1. On the reference arm, the reference beam is then picked using an aperture (Figure 1, aperture-2).
On the object arm, an additional QWP (Figure 1, QWP-2) sets the polarization basis back to circular before coupling the light into the fiber core using a 160 mm rear conjugated microscope objective (Newport, Irvine, CA, USA, M-20X 0.4 NA) and its corresponding lens. The fiber itself functioned as a spatial filter since light from the reference spot fell outside the fiber core and was therefore not guided by the fiber. The speckle patterns at the fiber output were imaged onto a NIR-enhanced CMOS camera (Thorlabs, Newton, NJ, USA, CS135MUN) using a second microscope objective (Olympus, Tokyo, Japan, 1-U2B5252 UPlanFL 20× 0.5 NA) and a 150 mm lens; QWP-4 paired with a Wollaston prism allowed us to simultaneously image right-handed (RH) and left-handed (LH) circular polarization (CP) onto different positions of the imaging sensor. A region of interest (ROI) of pixels on the image was defined for each output polarization. These two ROIs will become the TM output basis, , with a total of elements. The ROIs are selected so that the ROI centers, and , coincide with the center of the fiber core. Using BS-2 we combined the fiber output with the reference ( Figure 1, insert B) [49], and, using 3-step phase shifting interferometry, we reconstructed the output complex amplitude for each input location, . The phase shifts between the reference and object arm were performed by varying the relative phase between the gratings on the SLM.
Three different commercial-grade 1 m long fibers were used for this work: (I) Thorlabs (Newton, NJ, USA) HI1060-J9 (), (II) Thorlabs (Newton, NJ, USA) 1550BHP () and (III) Thorlabs (Newton, NJ, USA) SM2000 (), where is the core diameter of the fiber. When guiding 810 nm light the fibers are expected to support a few higher order modes. In general, we look for both and to be larger than the number of guided fiber modes so that the measured TM is oversampled and fully describes the light transport through the system [9].
2.2. TM Analysis and Hologram Generation
The resulting TM, , is an rectangular matrix,
where is the vectorization operator [50]. can be decomposed using SVD such that , the left, , and right, , singular vectors form an orthonormal basis for the fiber’s input and output, respectively. The resulting basis, being smaller than the original oversampled matrix, is more manageable and easier to work with. The singular values, , should allow us to determine the matrix rank given by the number of non-zero elements; however, due to noise during the measurement of , zero is not reached. Nonetheless, a sharp drop can be observed after element (see Figure 2) and we can assume that is equal to the rank of our system and therefore to the number of modes guided by the fiber [51]. Therefore, in order to describe the fiber’s light transport characteristics accurately, we need to employ a total of input/output singular vector pairs (Figure 2).
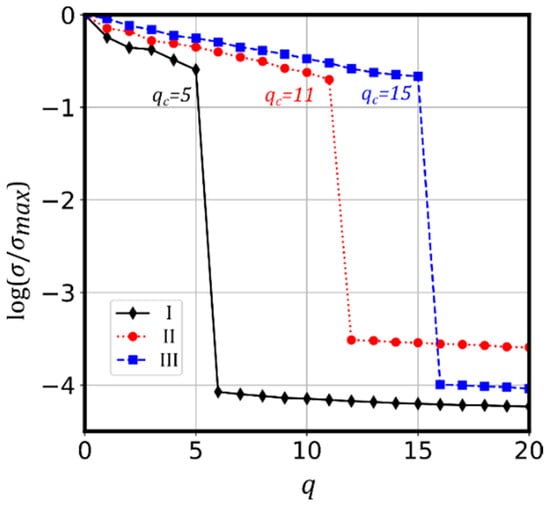
Figure 2.
Singular values, , for fibers I, II and III. The sharp drop seen after element allows us to determine the rank of the system and therefore the number of modes.
To obtain a CV beam we first need to define the desired output field, , in terms of the output basis . In our case, two single ringed Laguerre–Gaussian (LG) modes [23], , with RHCP and LHCP and opposite topological charge, i.e., and [52], that overlap at the fiber tip, giving us a CV beam.
Since we have split the polarization onto two halves of the output imaging plane, a physical overlap of and at the tip of the fiber in our output configuration, , can be represented by displacing the basis origin at and , respectively, and masking each output polarization so that
and, since the LHCP and RHCP correspond to the left and right halves of the output imaging plane we mask them accordingly, such that
where denotes elementwise multiplication and is a relative phase between LHCP and RHCP outputs.
The light-structuring capabilities of the fiber are limited by the number of available modes, so exact LG modes are not expected to be attainable; nevertheless, given a sufficient number of modes, a good approximation should be within reach. As an initial step to approximate and , we estimated the fiber’s total spatial–frequency content. This was performed by accumulating the amplitude of the far-field, obtained as the Fourier transform of the fiber’s output basis; it should be noted that LHCP and RHCP are propagated along their own optical axis, i.e., and ,
applying a threshold so that 86% (D86) of the power is accounted for [53],
Afterwards we fitted circular apertures, , to and applied the desired topological charge to the azimuthal phase (see Figure 3) so that
where the function denotes the complex phase. This results in a numerical estimate of the desired LG modes. We then projected onto :
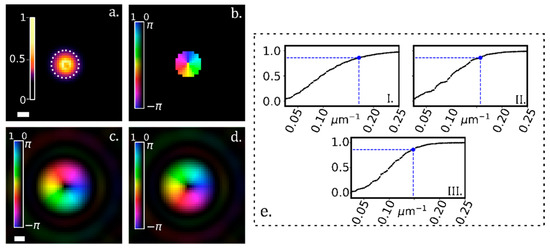
Figure 3.
(a): Accumulated far-field intensity for fiber I. Scale bar equals 0.1 . (b): Thresholded far-field with azimuthal phase corresponding to a topological charge (c,d): Inverse Fourier transform of b and its conjugate, corresponding to and , respectively; scale bar equals 1 . (e): Cumulative plots of the normalized intensity for fibers I, II and III. The intensity was obtained by propagating the output speckle patterns, , to the far-field (by means of a Fourier transform) and accumulating their squared modulus. Each polarization is propagated along its optical axis and then overlapped. The blue marker shows the point where 86% of the power has been accumulated: I.: 0.17, II.: 0.16, III.: 0.15 .
This projection allows us to find the field attainable by the fiber being used,
which has the highest overlap with the desired field . The required fiber input is therefore determined from the left singular vectors and the singular values:
It should be pointed out that, while our main goal in this work is to generate CV beams, we can use this procedure to project any desired field, , and calculate the attainable field , e.g., a tightly focused spot, or set of tightly focused spots, commonly used in micro-endoscopic applications or trapping [11,19,20]. Figure 4 illustrates sucha scenario, where a desired field consisting of two tightly focused FWHM gaussian spots is projected onto the output basis. To create this figure, both LHCP and RHCP outputs were overlapped.
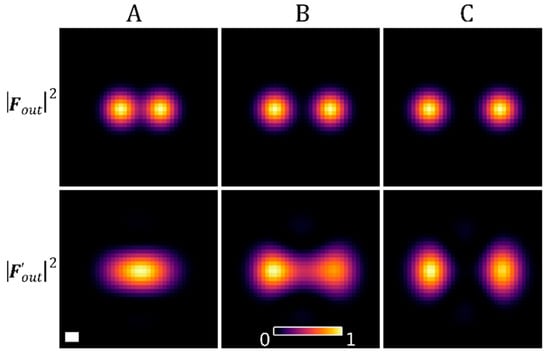
Figure 4.
Intensity of two desired spots, , and intensity of the projection, , onto the output basis of fiber III (see Equation (9)). Spot pairs (A–C) are separated by 1.6, 2.3 and 3.1 respectively. Scalebars are long.
To calculate the hologram required on the SLM screen, we populate input plane (i.e., the SLM’s far-field), , with the elements in and apply the inverse Fourier transform . Although our SLM is a phase-only modulator, we are able to modulate the amplitude as well by operating it in the off-axis configuration [15,54] and including a dump term [55], , before calculating the SLM phase pattern, [56].
3. Results
Figure 5 shows the CV beam output of the used fibers; columns a and b show the reconstructed complex amplitude, using phase shifting interferometry, for RHCP and LHCP; columns c through e show the characteristic petal-like patterns of CV beams obtained by measuring the intensity of the linear polarization (horizontal in this case) by removing QWP-4 (see Figure 1) and observing the right section of the imaging sensor ROI. As expected, with an increasing number of modes, a given fiber is able to support larger topological charges. While fiber I is limited to , fibers II and III can support higher order LG-like modes.
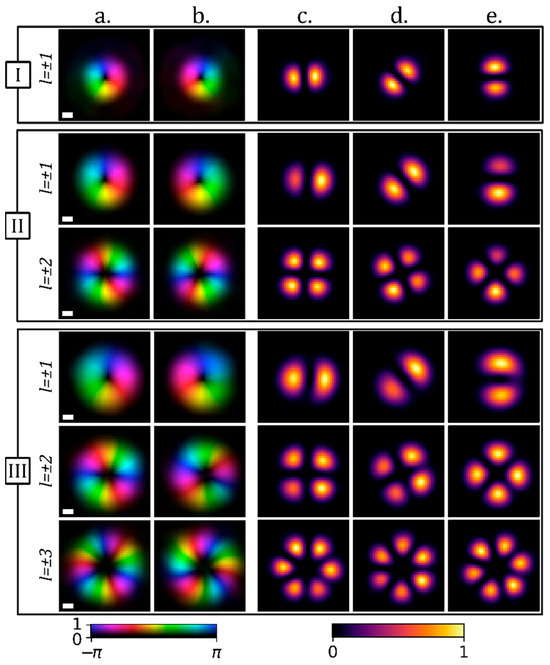
Figure 5.
Columns (a,b): Experimental RHCP and LHCP complex amplitude, , of the output of optical fibers I, II and III. Topological charges ranging from one to the maximum supported by the given fiber are shown. Columns (c–e): Horizontally polarized intensity of the fiber output after shifting the phase between the RHCP and LHCP components by , respectively. Scalebars are .
A numerical procedure, loosely based on Ref. [57], was employed to correct for small misalignments (tip, tilt and defocus) in the reconstruction of the complex amplitude shown in Figure 5a,b. These misalignments can arise during the manipulation of the output imaging optics, e.g., when rotating waveplates. Tip and tilt misalignments are corrected by iteratively centering the Fourier and imaging planes of the acquired interferogram. Defocus is addressed by applying a lens phase to the Fourier plane, with the focal length of the lens determined through brute-force optimization. The optimization uses the area containing of the power of as the cost function.
The effect of can be seen in Figure 5 columns c, d and e, respectively. For we see the transition from a radially to a tangentially polarized beam and in the case of fibers II and III, where larger values of are supported, we see the higher order polarization distributions.
To showcase the high quality of the vector beams obtained, we proceeded to numerically project the fields, seen in Figure 5a,b, onto a subset of the LG mode basis, , with radial indices, , ranging from 0 to 10 and azimuthal indices, , from −5 to 5 such that , where the coefficients, , were chosen to ensure orthonormality. The numerical mode subset was generated using LightPipes for Python 2.1.5 [58] and a spatial scaling factor was fitted prior to the projection. In Figure 6’s upper and lower left panels, we show the results expressed as power ratio
in decibels, for each projected LG mode.
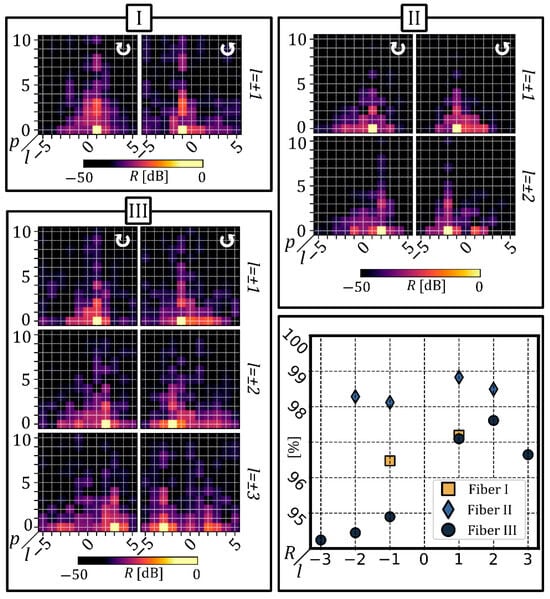
Figure 6.
(Upper) and (lower left) panels: power contained within each projected LG mode, expressed as the power ratio, for fibers (I–III), corresponding to the fields shown in Figure 5a,b. ↻ and ↺ denote RHCP and LHCP, respectively. Note that the scale is in decibels. The desired topological charge is shown at the left of each graph. (Lower right) panel: plot showing the power ratio, as a percentage, for the desired LG mode for all three fibers.
The lower right panel of Figure 6 clearly demonstrates the high-quality light shaping achieved at the fiber output, with fibers I, II, and III reaching noteworthy R averages of 96.8%, 98.4%, and 95.9%, respectively. Nonetheless, negative values exhibit a slight, although consistent, drop in power ratio, with the difference being even smaller for fibers I and II. While we do not currently hold a conclusive explanation for this, orbital chiral effects have been reported in these types of fibers and could potentially explain the observed dependence of R on the handedness of the LG mode [59]. However, further study would be required to determine if this effect is due to systematic or experimental variability or if an underlying phenomenon is behind it. That said, the effect is small and does not significantly impact the overall conclusions.
4. Discussion and Conclusions
We have described and demonstrated a method for obtaining high-quality CV beams at the distal end of an optical fiber operated in a few-mode regime. We have shown how SVD can be used as a framework for analyzing the TM of a FMF to gain insight into the light-structuring capabilities. Furthermore, we have proved that commercially available single-mode fibers, operated in a few-mode regime, can produce high quality vector beams, therefore avoiding the need for specialty fibers, and possibly allowing for the use of currently installed fiber infrastructure.
With the broad range of applications of vector beams encompassing areas such as optical communication, metrology, and sensing, as well as quantum information [23,31], we see this as a step toward bringing some of these applications to the tip of an optical fiber. Sensing applications, for example, can benefit from the ability to gain access to difficult-to-reach locations or harsh environments, i.e., CV beams could be used to track fluorescent particles in endoscopic applications [18]. Another active area of interest lies in quantum communications, where vector beams have shown potential for enhancing techniques such as device-independent QKD [60,61], which relies on the entanglement of spatial degrees of freedom of the vector beams; the propagation of such states through fibers requires fine-tuned control of the transport of light through these fibers, as presented in this article. While work remains to be done to fully take advantage of these types of developments, this work brings confirmation that high quality CV beams can be shaped at the fiber tip.
Author Contributions
Conceptualization, A.C. and G.M.-T.; Methodology, A.C.; Software, A.C.; Formal analysis, A.C. and G.M.-T.; Investigation, A.C. and M.V.; Writing—original draft, A.C.; Writing—review and editing, A.C. and G.M.-T.; Project administration, M.V.; Funding acquisition, G.M.-T. All authors have read and agreed to the published version of the manuscript.
Funding
CSIC Research Platform on Quantum Technologies PTI-001, the IKUR Strategy under the collaboration agreement between Ikerbasque Foundation and DIPC/MPC on behalf of the Department of Education of the Basque Government and from the projects EQC2018-004060-P, PLEC2021-008251 and PID2022-143268NB-I00 of Ministerio de Ciencia, Innovación y Universidades.
Data Availability Statement
The raw data supporting the conclusions of this article will be made available by the authors on request.
Conflicts of Interest
The authors declare no conflict of interest.
References
- Vellekoop, I.M.; Mosk, A. Focusing Coherent Light through Opaque Strongly Scattering Media. Opt. Lett. 2007, 32, 2309–2311. [Google Scholar] [CrossRef] [PubMed]
- Vellekoop, I.M.; Lagendijk, A.; Mosk, A. Exploiting Disorder for Perfect Focusing. Nat. Photonics 2010, 4, 320–322. [Google Scholar] [CrossRef]
- Mosk, A.P.; Lagendijk, A.; Lerosey, G.; Fink, M. Controlling Waves in Space and Time for Imaging and Focusing in Complex Media. Nat. Photonics 2012, 6, 283–292. [Google Scholar] [CrossRef]
- Cao, N.; Zhang, L.; Mi, S.; Chew, K.-H.; Chen, R.-P. Flexible Manipulation of Polarization Conversion and Compact Generation of Multiple Beams with Desired Polarization States through a Highly Anisotropic Scattering Medium. Laser Phys. Lett. 2025, 22, 046001. [Google Scholar] [CrossRef]
- Qi, B.; Shen, L.; Chew, K.-H.; Chen, R.-P. Vectorial Manipulation of High-Resolution Focusing Optical Field through a Scattering Medium. Photonics 2022, 9, 737. [Google Scholar] [CrossRef]
- Boniface, A.; Dong, J.; Gigan, S. Non-Invasive Focusing and Imaging in Scattering Media with a Fluorescence-Based Transmission Matrix. Nat. Commun. 2020, 11, 6154. [Google Scholar] [CrossRef] [PubMed]
- Psaltis, D.; Moser, C. Imaging with Multimode Fibers. Opt. Photonics News 2016, 27, 24–31. [Google Scholar] [CrossRef]
- Caravaca-Aguirre, A.M.; Piestun, R. Single Multimode Fiber Endoscope. Opt. Express 2017, 25, 1656–1665. [Google Scholar] [CrossRef] [PubMed]
- Jákl, P.; Šiler, M.; Ježek, J.; Cifuentes, Á.; Trägårdh, J.; Zemánek, P.; Čižmár, T. Endoscopic Imaging Using a Multimode Optical Fibre Calibrated with Multiple Internal References. Photonics 2022, 9, 37. [Google Scholar] [CrossRef]
- Mi, S.; Chen, Y.; Gao, J.; Wang, G.; Chew, K.-H.; Chen, R.-P. Dynamic Manipulation of Orthogonal Polarization Components in a High-Resolution Twisted Vector Light Field with a Highly Scattering Medium. Opt. Lasers Eng. 2024, 176, 108069. [Google Scholar] [CrossRef]
- Cifuentes, A.; Pikálek, T.; Ondráčková, P.; Amezcua-Correa, R.; Antonio-Lopez, J.E.; Čižmár, T.; Trägårdh, J. Polarization-Resolved Second-Harmonic Generation Imaging through a Multimode Fiber. Optica 2021, 8, 1065–1074. [Google Scholar] [CrossRef]
- Xiong, W.; Hsu, C.W.; Bromberg, Y.; Antonio-Lopez, J.E.; Amezcua Correa, R.; Cao, H. Complete Polarization Control in Multimode Fibers with Polarization and Mode Coupling. Light Sci. Appl. 2018, 7, 54. [Google Scholar] [CrossRef] [PubMed]
- Lamb, E.S.; Kremp, T.; DiGiovanni, D.J.; Westbrook, P.S. Polarization-Resolved Transmission Matrices of Specialty Optical Fibers. Rev. Sci. Instrum. 2024, 95, 123705. [Google Scholar] [CrossRef] [PubMed]
- Popoff, S.; Lerosey, G.; Fink, M.; Boccara, A.C.; Gigan, S. Controlling Light through Optical Disordered Media: Transmission Matrix Approach. New J. Phys. 2011, 13, 123021. [Google Scholar] [CrossRef]
- Plöschner, M.; Tyc, T.; Čižmár, T. Seeing through Chaos in Multimode Fibres. Nat. Photonics 2015, 9, 529–535. [Google Scholar] [CrossRef]
- Gobé, B.; Saucourt, J.; Shpakovych, M.; Helbert, D.; Desfarges-Berthelemot, A.; Kermene, V. Retrieving the Complex Transmission Matrix of a Multimode Fiber by Machine Learning for 3D Beam Shaping. J. Light. Technol. 2024, 42, 4681–4688. [Google Scholar] [CrossRef]
- Kurekci, S.; Kahraman, S.S.; Yuce, E. Single-Pixel Multimode Fiber Spectrometer via Wavefront Shaping. ACS Photonics 2023, 10, 2488–2493. [Google Scholar] [CrossRef]
- Cifuentes, A.; Trägårdh, J. A Method for Single Particle Tracking through a Multimode Fiber. Opt. Express 2022, 30, 36055–36064. [Google Scholar] [CrossRef] [PubMed]
- Trägårdh, J.; Pikálek, T.; Šerỳ, M.; Meyer, T.; Popp, J.; Čižmár, T. Label-Free CARS Microscopy through a Multimode Fiber Endoscope. Opt. Express 2019, 27, 30055–30066. [Google Scholar] [CrossRef] [PubMed]
- Turtaev, S.; Leite, I.T.; Altwegg-Boussac, T.; Pakan, J.M.; Rochefort, N.L.; Čižmár, T. High-Fidelity Multimode Fibre-Based Endoscopy for Deep Brain in Vivo Imaging. Light Sci. Appl. 2018, 7, 92. [Google Scholar] [CrossRef] [PubMed]
- Cifuentes, A.; Trägårdh, J.; Pikálek, T.; Ondráčková, P.; Amezcua-Correa, R.; Antonio-Lopez, J.E.; Čižmár, T. Excitation Polarization Resolved Second Harmonic Generation Microscopy Through a Multimode Optical Fiber. In Proceedings of the Novel Techniques in Microscopy, Washington, DC, USA, 12–16 April 2021; Optica Publishing Group: Washington, DC, USA, 2021; p. NTh1C-3. [Google Scholar]
- Rothe, S.; Radner, H.; Koukourakis, N.; Czarske, J.W. Transmission Matrix Measurement of Multimode Optical Fibers by Mode-Selective Excitation Using One Spatial Light Modulator. Appl. Sci. 2019, 9, 195. [Google Scholar] [CrossRef]
- Zhan, Q. Cylindrical Vector Beams: From Mathematical Concepts to Applications. Adv. Opt. Photonics 2009, 1, 1–57. [Google Scholar] [CrossRef]
- Zhan, Q. Trapping Metallic Rayleigh Particles with Radial Polarization. Opt. Express 2004, 12, 3377–3382. [Google Scholar] [CrossRef] [PubMed]
- Gómez-Viloria, I.; Nodar, Á.; Molezuelas-Ferreras, M.; Olmos-Trigo, J.; Cifuentes, Á.; Martínez, M.; Varga, M.; Molina-Terriza, G. On-Axis Optical Trapping with Vortex Beams: The Role of the Multipolar Decomposition. ACS Photonics 2024, 11, 626–633. [Google Scholar] [CrossRef] [PubMed]
- Qiao, W.; Lei, T.; Wu, Z.; Gao, S.; Li, Z.; Yuan, X. Approach to Multiplexing Fiber Communication with Cylindrical Vector Beams. Opt. Lett. 2017, 42, 2579–2582. [Google Scholar] [CrossRef] [PubMed]
- Lerman, G.M.; Levy, U. Effect of Radial Polarization and Apodization on Spot Size under Tight Focusing Conditions. Opt. Express 2008, 16, 4567–4581. [Google Scholar] [CrossRef] [PubMed]
- Sheppard, C.J.; Choudhury, A. Annular Pupils, Radial Polarization, and Superresolution. Appl. Opt. 2004, 43, 4322–4327. [Google Scholar] [CrossRef] [PubMed]
- Trägårdh, J.; Pikálek, T.; Stibuurek, M.; Simpson, S.; Cifuentes, A.; Čižmár, T. CARS Microscopy through a Multimode Fiber Probe with Reduced Four-Wave Mixing Background. In Proceedings of the Clinical and Translational Biophotonics, Fort Lauderdale, FL, USA, 24–27 April 2022; Optica Publishing Group: Washington, DC, USA, 2022; p. JM3A-43. [Google Scholar]
- Ndagano, B.; Nape, I.; Cox, M.A.; Rosales-Guzman, C.; Forbes, A. Creation and Detection of Vector Vortex Modes for Classical and Quantum Communication. J. Light. Technol. 2017, 36, 292–301. [Google Scholar] [CrossRef]
- Li, Z.-X.; Ruan, Y.-P.; Chen, P.; Tang, J.; Hu, W.; Xia, K.-Y.; Lu, Y.-Q. Liquid Crystal Devices for Vector Vortex Beams Manipulation and Quantum Information Applications. Chin. Opt. Lett. 2021, 19, 112601. [Google Scholar] [CrossRef]
- Souza, C.; Borges, C.; Khoury, A.; Huguenin, J.; Aolita, L.; Walborn, S. Quantum Key Distribution without a Shared Reference Frame. Phys. Rev. A 2008, 77, 032345. [Google Scholar] [CrossRef]
- Parigi, V.; D’Ambrosio, V.; Arnold, C.; Marrucci, L.; Sciarrino, F.; Laurat, J. Storage and Retrieval of Vector Beams of Light in a Multiple-Degree-of-Freedom Quantum Memory. Nat. Commun. 2015, 6, 7706. [Google Scholar] [CrossRef] [PubMed]
- Qi, J.; Wang, W.; Shi, B.; Zhang, H.; Shen, Y.; Deng, H.; Pu, W.; Liu, X.; Shan, H.; Ma, X.; et al. Concise and Efficient Direct-View Generation of Arbitrary Cylindrical Vector Beams by a Vortex Half-Wave Plate. Photonics Res. 2021, 9, 803–813. [Google Scholar] [CrossRef]
- Chen, P.; Ji, W.; Wei, B.-Y.; Hu, W.; Chigrinov, V.; Lu, Y.-Q. Generation of Arbitrary Vector Beams with Liquid Crystal Polarization Converters and Vector-Photoaligned q-Plates. Appl. Phys. Lett. 2015, 107, 241102. [Google Scholar] [CrossRef]
- Maurer, C.; Jesacher, A.; Fürhapter, S.; Bernet, S.; Ritsch-Marte, M. Tailoring of Arbitrary Optical Vector Beams. New J. Phys. 2007, 9, 78. [Google Scholar] [CrossRef]
- Rosales-Guzmán, C.; Bhebhe, N.; Forbes, A. Simultaneous Generation of Multiple Vector Beams on a Single SLM. Opt. Express 2017, 25, 25697–25706. [Google Scholar] [CrossRef] [PubMed]
- Chen, W.; Han, W.; Abeysinghe, D.C.; Nelson, R.L.; Zhan, Q. Generating Cylindrical Vector Beams with Subwavelength Concentric Metallic Gratings Fabricated on Optical Fibers. J. Opt. 2010, 13, 015003. [Google Scholar] [CrossRef]
- Brunet, C.; Ung, B.; Bélanger, P.-A.; Messaddeq, Y.; LaRochelle, S.; Rusch, L.A. Vector Mode Analysis of Ring-Core Fibers: Design Tools for Spatial Division Multiplexing. J. Light. Technol. 2014, 32, 4648–4659. [Google Scholar] [CrossRef]
- Zhao, C.; Gan, X.; Li, P.; Fang, L.; Han, L.; Tu, L.; Zhao, J. Design of Multicore Photonic Crystal Fibers to Generate Cylindrical Vector Beams. J. Light. Technol. 2015, 34, 1206–1211. [Google Scholar] [CrossRef]
- Feng, L.; Li, Y.; Wu, S.; Guan, X.; Yang, C.; Tong, W.; Li, W.; Qiu, J.; Hong, X.; Zuo, Y.; et al. All-Fiber Generation of Arbitrary Cylindrical Vector Beams on the First-Order Poincaré Sphere. Photonics Res. 2020, 8, 1268–1277. [Google Scholar] [CrossRef]
- Fan, W.; Chen, Z.; Chen, L.; Wu, L.; Ji, X.; Pu, J. Polarization Transmission Matrix for Completely Polarization Control of Focal Spots in Speckle Field of Multimode Fiber. IEEE J. Sel. Top. Quantum Electron. 2020, 26, 1–5. [Google Scholar] [CrossRef]
- Čižmár, T.; Dholakia, K. Shaping the Light Transmission through a Multimode Optical Fibre: Complex Transformation Analysis and Applications in Biophotonics. Opt. Express 2011, 19, 18871–18884. [Google Scholar] [CrossRef] [PubMed]
- Lin, D.; Carpenter, J.; Feng, Y.; Jain, S.; Jung, Y.; Feng, Y.; Zervas, M.N.; Richardson, D.J. Reconfigurable Structured Light Generation in a Multicore Fibre Amplifier. Nat. Commun. 2020, 11, 3986. [Google Scholar] [CrossRef] [PubMed]
- Volpe, G.; Petrov, D. Generation of Cylindrical Vector Beams with Few-Mode Fibers Excited by Laguerre–Gaussian Beams. Opt. Commun. 2004, 237, 89–95. [Google Scholar] [CrossRef]
- Kitayama, K.; Diamantopoulos, N.-P. Few-Mode Optical Fibers: Original Motivation and Recent Progress. IEEE Commun. Mag. 2017, 55, 163–169. [Google Scholar] [CrossRef]
- Ashry, I.; Mao, Y.; Trichili, A.; Wang, B.; Ng, T.K.; Alouini, M.-S.; Ooi, B.S. A Review of Using Few-Mode Fibers for Optical Sensing. IEEE Access 2020, 8, 179592–179605. [Google Scholar] [CrossRef]
- Hotate, K.; Okoshi, T. Measurement of Refractive-Index Profile and Transmission Characteristics of a Single-Mode Optical Fiber from Its Exit-Radiation Pattern. Appl. Opt. 1979, 18, 3265–3271. [Google Scholar] [CrossRef] [PubMed]
- Pikálek, T.; Trägårdh, J.; Simpson, S.; Čižmár, T. Wavelength Dependent Characterization of a Multimode Fibre Endoscope. Opt. Express 2019, 27, 28239–28253. [Google Scholar] [CrossRef] [PubMed]
- Macedo, H.D.; Oliveira, J.N. Typing Linear Algebra: A Biproduct-Oriented Approach. Sci. Comput. Program. 2013, 78, 2160–2191. [Google Scholar] [CrossRef]
- Yoon, C.; Choi, Y.; Kim, M.; Moon, J.; Kim, D.; Choi, W. Experimental Measurement of the Number of Modes for a Multimode Optical Fiber. Opt. Lett. 2012, 37, 4558–4560. [Google Scholar] [CrossRef] [PubMed]
- Allen, L.; Beijersbergen, M.W.; Spreeuw, R.; Woerdman, J. Orbital Angular Momentum of Light and the Transformation of Laguerre-Gaussian Laser Modes. Phys. Rev. A 1992, 45, 8185. [Google Scholar] [CrossRef] [PubMed]
- Wright, D. Beamwidths of a Diffracted Laser Using Four Proposed Methods. Opt. Quantum Electron. 1992, 24, S1129–S1135. [Google Scholar] [CrossRef]
- Frumker, E.; Silberberg, Y. Phase and Amplitude Pulse Shaping with Two-Dimensional Phase-Only Spatial Light Modulators. JOSA B 2007, 24, 2940–2947. [Google Scholar] [CrossRef]
- Bowman, R.; D’Ambrosio, V.; Rubino, E.; Jedrkiewicz, O.; Di Trapani, P.; Padgett, M.J. Optimisation of a Low Cost SLM for Diffraction Efficiency and Ghost Order Suppression. Eur. Phys. J. Spec. Top. 2011, 199, 149–158. [Google Scholar] [CrossRef]
- Stilgoe, A.B.; Kashchuk, A.V.; Preece, D.; Rubinsztein-Dunlop, H. An Interpretation and Guide to Single-Pass Beam Shaping Methods Using SLMs and DMDs. J. Opt. 2016, 18, 065609. [Google Scholar] [CrossRef]
- Boonzajer Flaes, D.E.; Stopka, J.; Turtaev, S.; De Boer, J.F.; Tyc, T.; Čižmár, T. Robustness of Light-Transport Processes to Bending Deformations in Graded-Index Multimode Waveguides. Phys. Rev. Lett. 2018, 120, 233901. [Google Scholar] [CrossRef] [PubMed]
- Vdovin, G.; van Goor, F. LightPipes for Python 2.1.5; Flexible Optical: Rijswijk, The Netherlands, 2017. [Google Scholar]
- Stefańska, K.; Hertz, E.; Tarnowski, K.; Kibler, B.; Béjot, P. Orbital Chirality of Light in Few-Mode Step-Index Optical Fibers. APL Photonics 2025, 10, 040804. [Google Scholar] [CrossRef]
- Chen, D.; Zhao, S.-H.; Shi, L.; Liu, Y. Measurement-Device-Independent Quantum Key Distribution with Pairs of Vector Vortex Beams. Phys. Rev. A 2016, 93, 032320. [Google Scholar] [CrossRef]
- Alarcon, A.; Argillander, J.; Lima, G.; Xavier, G.B. Few-Mode-Fiber Technology Fine-Tunes Losses in Quantum Communication Systems. Phys. Rev. Appl. 2021, 16, 034018. [Google Scholar] [CrossRef]
Disclaimer/Publisher’s Note: The statements, opinions and data contained in all publications are solely those of the individual author(s) and contributor(s) and not of MDPI and/or the editor(s). MDPI and/or the editor(s) disclaim responsibility for any injury to people or property resulting from any ideas, methods, instructions or products referred to in the content. |
© 2025 by the authors. Licensee MDPI, Basel, Switzerland. This article is an open access article distributed under the terms and conditions of the Creative Commons Attribution (CC BY) license (https://creativecommons.org/licenses/by/4.0/).