Article

Microwave-Controlled Spectroscopy Evolution for Different Rydberg States

1
China Electric Power Research Institute Wuhan Branch, Wuhan 430074, China
2
Wuhan Yunheng Technology Co., Ltd., Wuhan 430056, China
*
Author to whom correspondence should be addressed.
Photonics 2025, 12(7), 715; https://doi.org/10.3390/photonics12070715
Submission received: 7 May 2025 / Revised: 14 July 2025 / Accepted: 14 July 2025 / Published: 16 July 2025

Abstract

In this paper, a series of electromagnetically-induced-transparent (EIT) spectra of different Rydberg states, controlled by microwaves, in rubidium (Rb) thermal vapor are presented. The novel evolution regularity for different Rydberg states can be found by experimentally detected transmitted EIT spectra, which can reveal the primary quantum number of different Rydberg states and how to influence microwave control spectroscopy evolution regularity, and which can pave the way in order to address the challenge of selecting Rydberg states for applications in Rydberg microwave field detection. This is helpful for the development of measuring standards of the microwave field in Rydberg states.

1. Introduction

Rydberg atoms have a high response to microwave frequencies due to their large electric dipole moments, which makes them ideal for microwave field measurements [1]. The application of Rydberg atoms in microwave field measurement has broad prospects, especially in fields such as communication, navigation, radar, and astronomical detection [2,3,4]. The analysis of microwave field control regulation under different Rydberg states is helpful for studying the interaction between Rydberg states and the microwave field, and for improving microwave field measurement technology [5]. Rydberg atoms will undergo energy level splitting under microwave field control, which can be observed as the term of EIT spectroscopy [6]. EIT is a quantum interference phenomenon where atomic medium becomes transparent to a weak probe field when a strong control field is applied simultaneously [7]. In the context of microwave field measurement, EIT can play a pivotal role by enabling the highly sensitive and non-invasive detection of weak microwave fields [8]. In EIT spectroscopy, Rydberg states with different principal quantum numbers show different responses to microwave fields at different center frequencies, which provides flexibility and selectivity for the measurement of microwave fields.
Some drawbacks of the conventional microwave field measurement technique include low sensitivity, calibration requirements, and potential microwave field disturbance. The microwave field measurement technique based on Rydberg atoms converts the microwave field into a frequency interval and then uses the optical method to measure it, so as to obtain the distribution of the microwave field intensity with a high resolution [9]. In experiments, Rydberg atoms in cesium vapor are often used as sensors to convert the microwave field into a frequency interval through an antenna, and the detected Autler–Townes (AT) splitting distance is analyzed to detect the intensity of the microwave field [10]. Although significant progress has been made, there are still some challenges, such as the limited bandwidth of the real-time signal reception, which is limited by the relaxation time required by the atomic system to reach the steady state, so that spectrum splitting results are different in the same microwave field intensity [11]. Thus, microwave field spectroscopy regulation in different Rydberg states is helpful in utilizing the high sensitivity and large dynamic range of Rydberg atoms to measure microwave fields [12]. The study of the regulation of microwave fields for Rydberg states with different principal quantum numbers holds significant importance for promoting scientific development and technological progress [13]. By enhancing measurement accuracy and sensitivity and by exploiting Rydberg states with diverse principal quantum numbers, the response range of atoms to microwave fields can be broadened, facilitating an absolute frequency measurement within a wider frequency band [14].
In this paper, we experimentally obtain the EIT spectrum of Rydberg states in a collective ensemble of Rb thermal vapors, and then study the linewidth and splitting distance variation regularity with microwave field control for different primary quantum numbers n. An n-dependent application strategy is proposed. By examining the large dynamic range of Rydberg atoms under the microwave field control from n = 30 to 80, one can show which range of n makes microwave field measurement devices the most appropriate for different application scenarios. This experimentally validated limitation provides a critical design rule for Rydberg sensors operating in thermal vapor cells, which has not been quantitatively established in the prior literature.

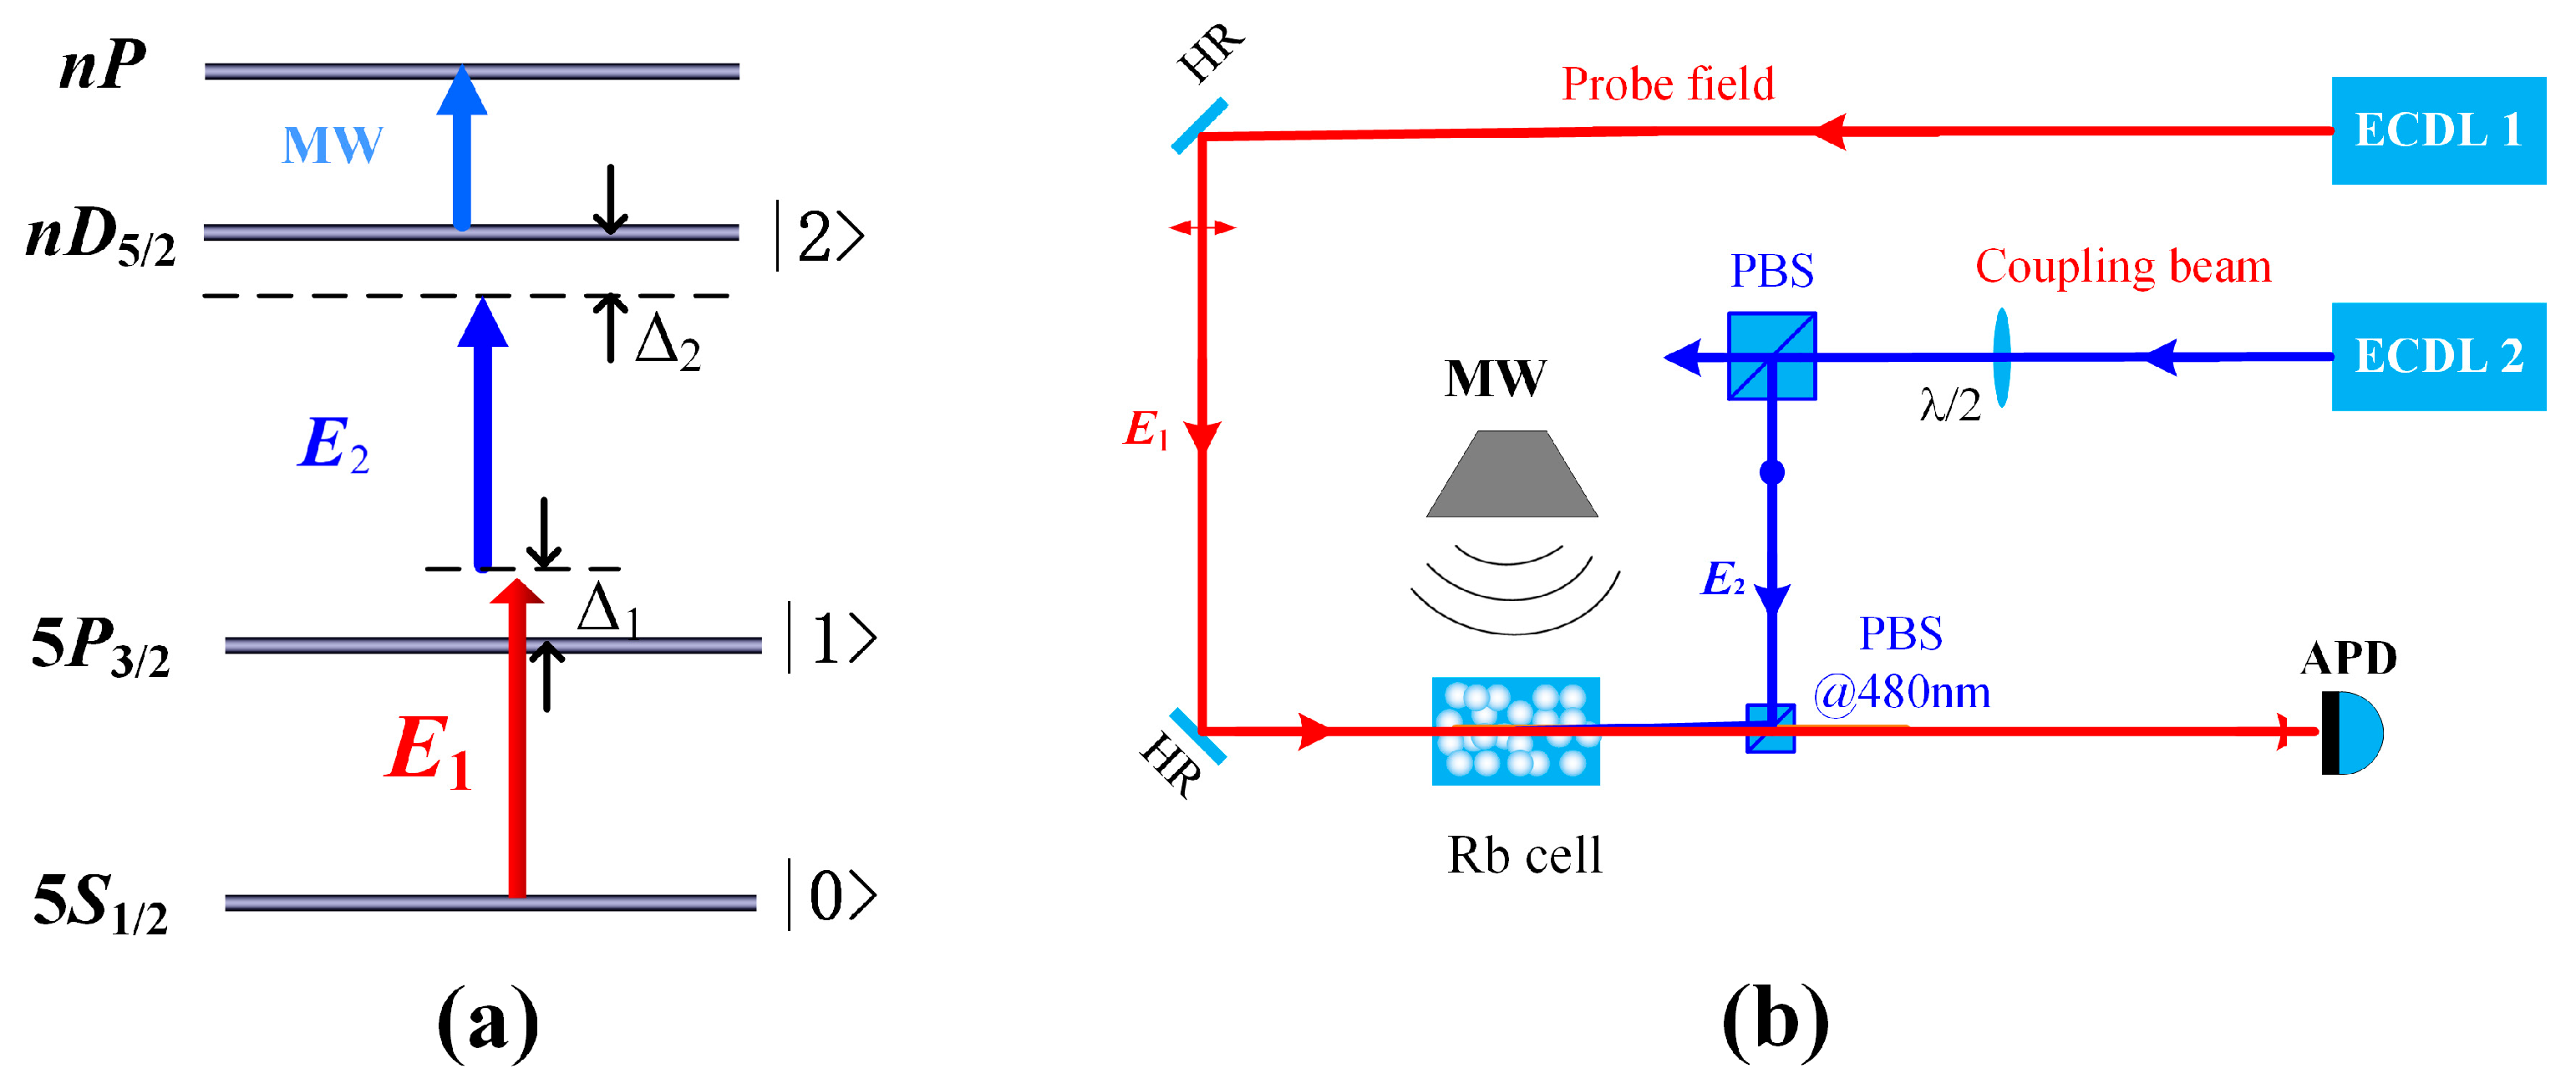
2. Experimental Scheme and Theoretical Model

To achieve Rydberg EIT, a ladder-type four-level atomic system is used in our experiment. As shown in Figure 1a, ground state 5S1/2, F = 3 (∣0〉) is excited to the first excited state 5P3/2 (∣1〉), and then 5P3/2 (∣1〉) is excited to the second high-lying Rydberg state nD5/2 (∣2〉) of 85Rb. The microwave field is used to excite nD5/2 (∣2〉) to their adjacent nP state. The corresponding resonant frequencies are ϖ1, ϖ2, and ϖ3 for transitions ∣0〉 to ∣1〉, ∣1〉 to ∣2〉, and ∣2〉 to ∣3〉, respectively. Two external cavity diode lasers (ECDLs) are used to provide the two light beams which couple the corresponding transition Rabi frequency. The Rabi frequency is Ωi = μiEi/ħ (I = 1, 2, 3), where μi is the electric dipole moment, Ei is the electric field strength of the corresponding fields, and ħ is Plank’s constant h/2π. The experimental setup is shown in Figure 1b, where the long 10 cm Rb thermal cell is located in the center of the optical path. As the probe field, a weak beam E1 (wave vector k1, frequency ω1, beam radius 1 mm) generated by an external cavity semiconductor laser (Toptica, Berlin, Germany, DLC Pro) probes the transition ∣0〉 to ∣1〉 with a wavelength of 780.24 nm and a maximum output power of 30 mW. Coupling beams E2 (k2, ω2, 1 mm), using a frequency-doubled laser (Toptica, DL⁃SHG Pro), drive the transition ∣1〉 to ∣2〉 with a wavelength of ~480 nm and maximum output power of 380 mW. The Rydberg atoms of the target state can be obtained at the position where the two beams of light coincide in the center of the gas cell. The microwave field is generated by an analog signal generator (Keysight E8257D, frequency range: 100 kHz to 67 GHz), and emitted with some antennas consisting of (A-INFO LB-15-15-c-185F, frequency range 50–65 GHz), (R&S HF906, 1–20 GHz) and a frequency-doubling module (Virginia Diode WR6.5, 90–140 GHz), covering the nD1/2nP transition for different n. The microwave field as a tuning field is located at a distance of 26 cm near the cell. The probe field passes through a pair of high-reflection mirrors and then enters in the atomic cell. The coupling beam inversely enters in the atomic cell and coincides with the probe field at the center of the gas cell. Then, the probe field is fully transparent and transmits across the polarized beam splitter (PBS), arriving at the avalanche photodiode (APD), and the APD receives the probe field signal through the front amplifier before finally transmitting to the oscilloscope, where an EIT spectrum signal can be observed.
Generally, the relation between the AT splitting distances Δf and the microwave field intensity EMW is:
E MW = μ MW λ p λ c 2 π Δ f ,
where μ MW is the electric dipole moment of the microwave field, λp is the probe field wavelength, and λc is the coupling beam wavelength. Thus:
Δ f Ω MW 2 π .
In this way, measuring the microwave field can be transformed into a simple measurement of the frequency difference in the AT splitting. The detected spectrum signal can be simulated via a theory model of the interaction between light and atoms. The polarization rate χ of atoms can be calculated by the theory model as:
χ = N μ p Ω p E p ε 0 Ω MW 2 + 4 D 02 D 03 D 01 Ω MW 2 + D 03 Ω c 2 + 4 D 01 D 02 D 03
where D 0 i = Γ 0 i Δ p , N is the atomic density, 0i is the state |0> transit to state |i>, Δ p = ω 0 ω p , and Γ 0 i is the relaxation rate between the state |0> and |i>. The detected spectrum signals can be described as:
I = I 0 e x p ( - 2 π L Im χ λ p )
where I0 is the initial intensity of the detection signals, and L is the transmission distance of the probe field in the atomic medium.

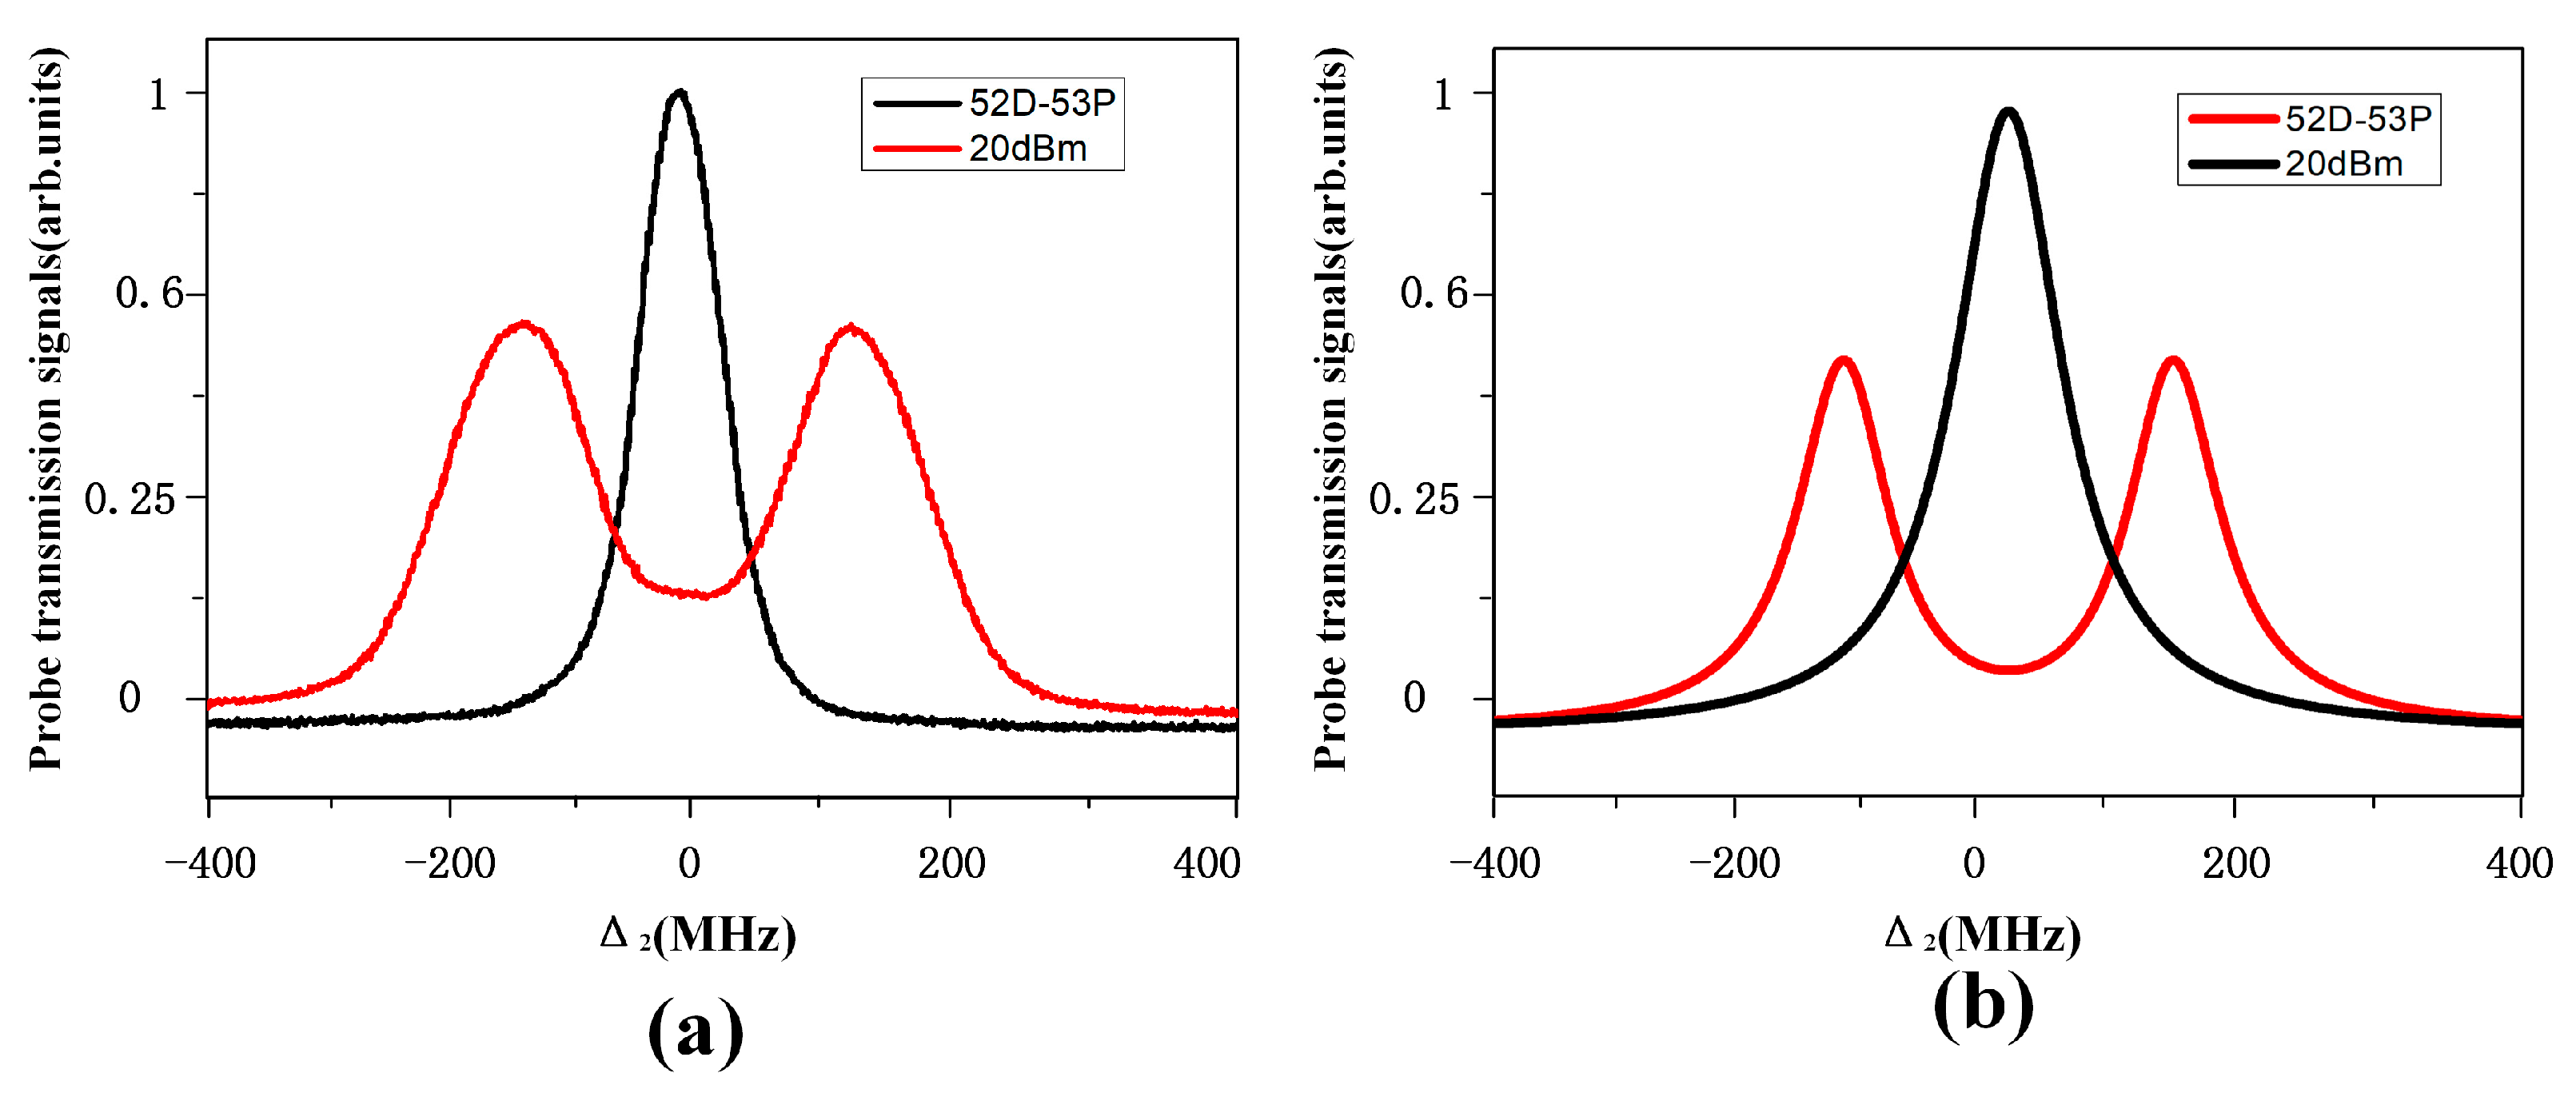
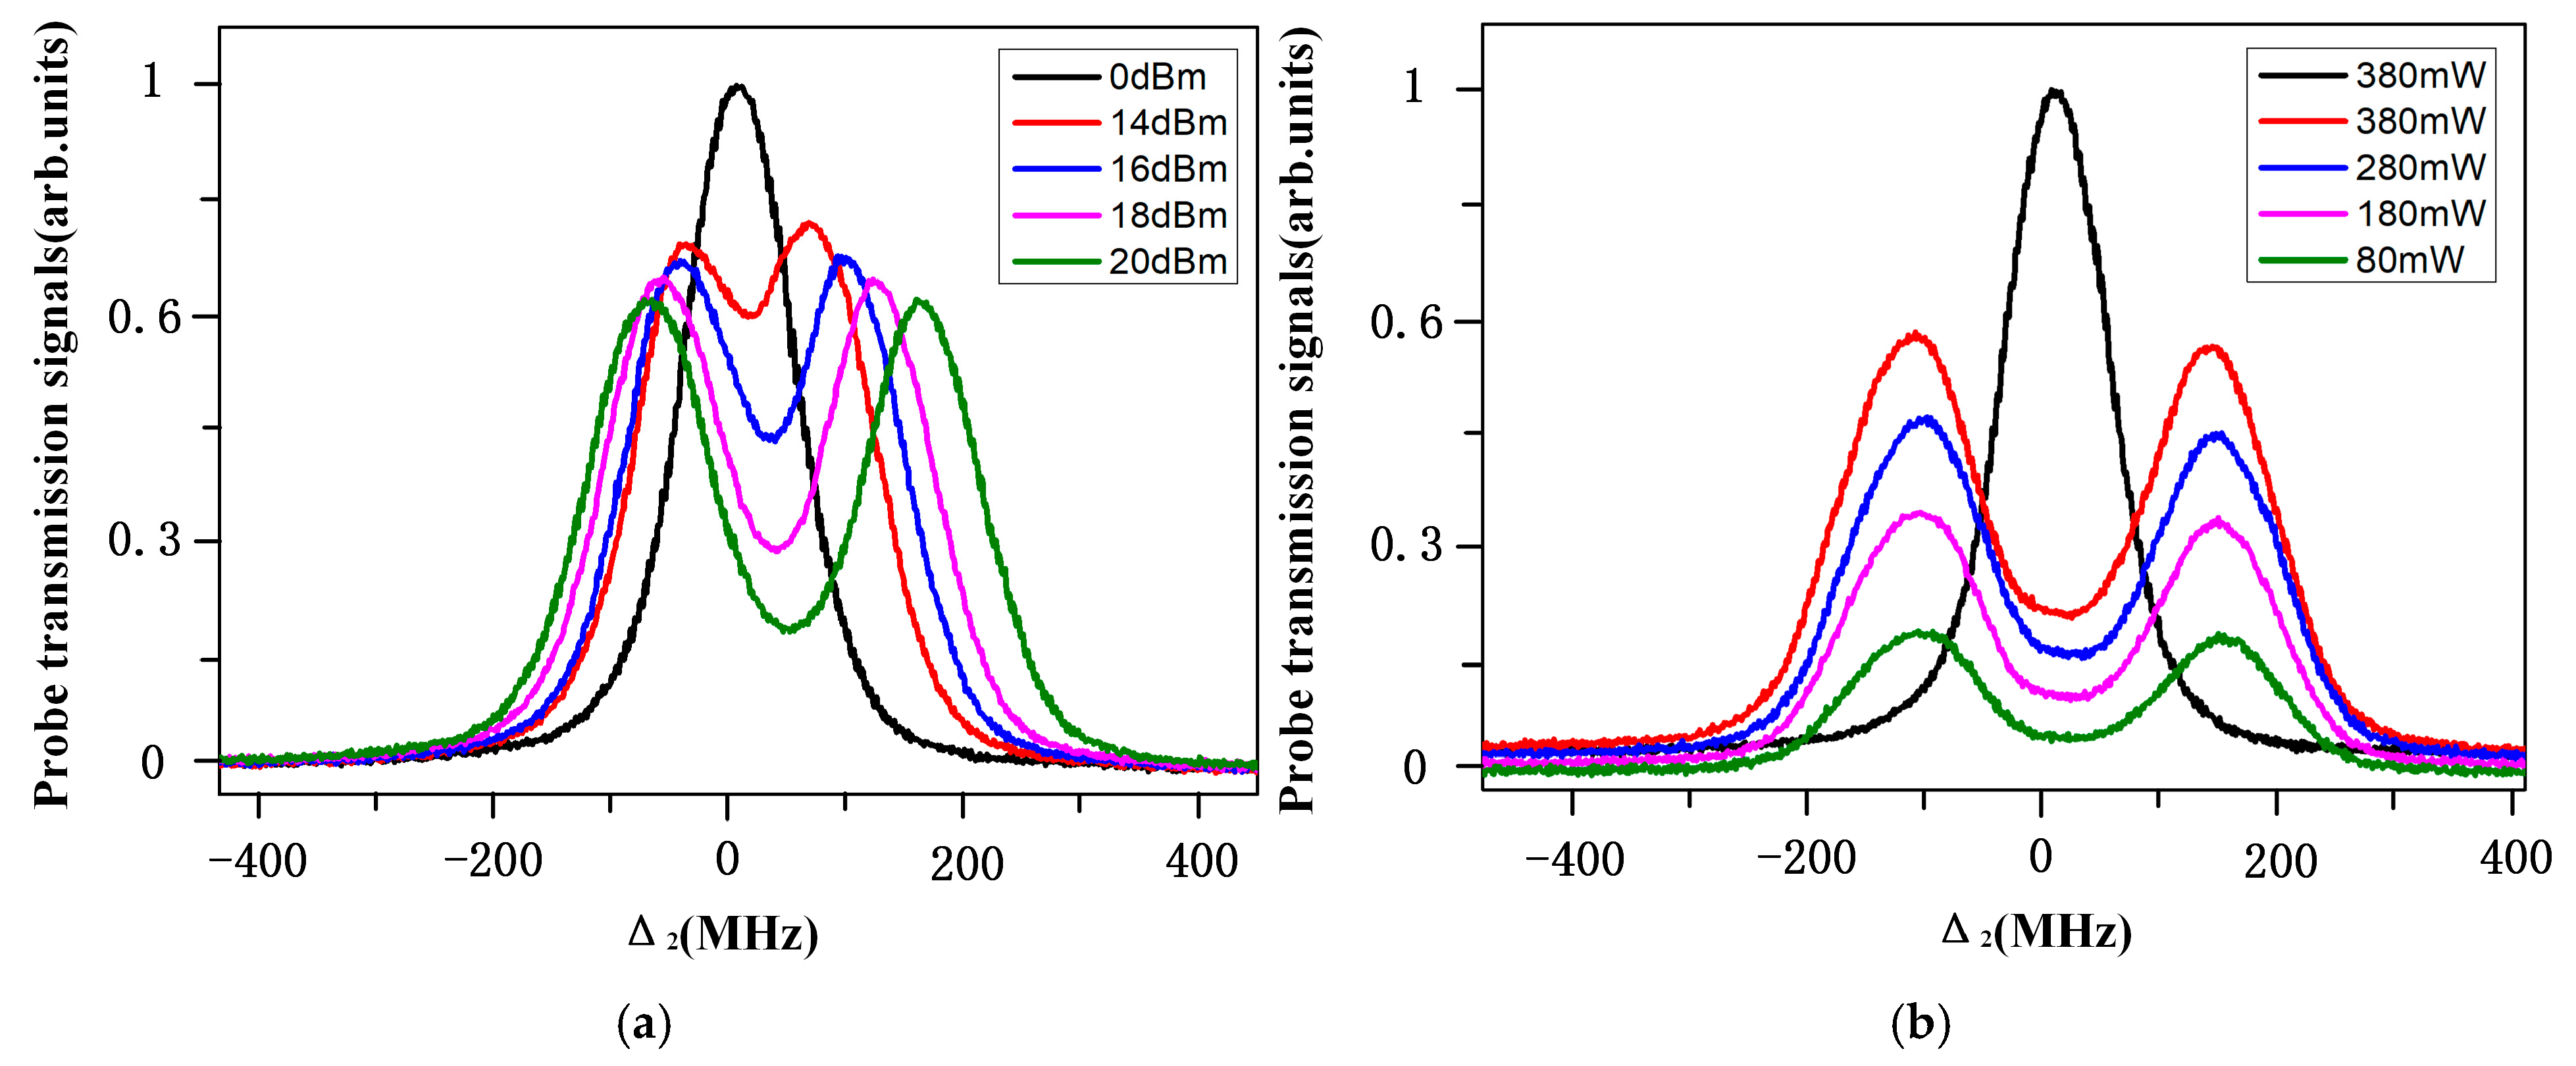
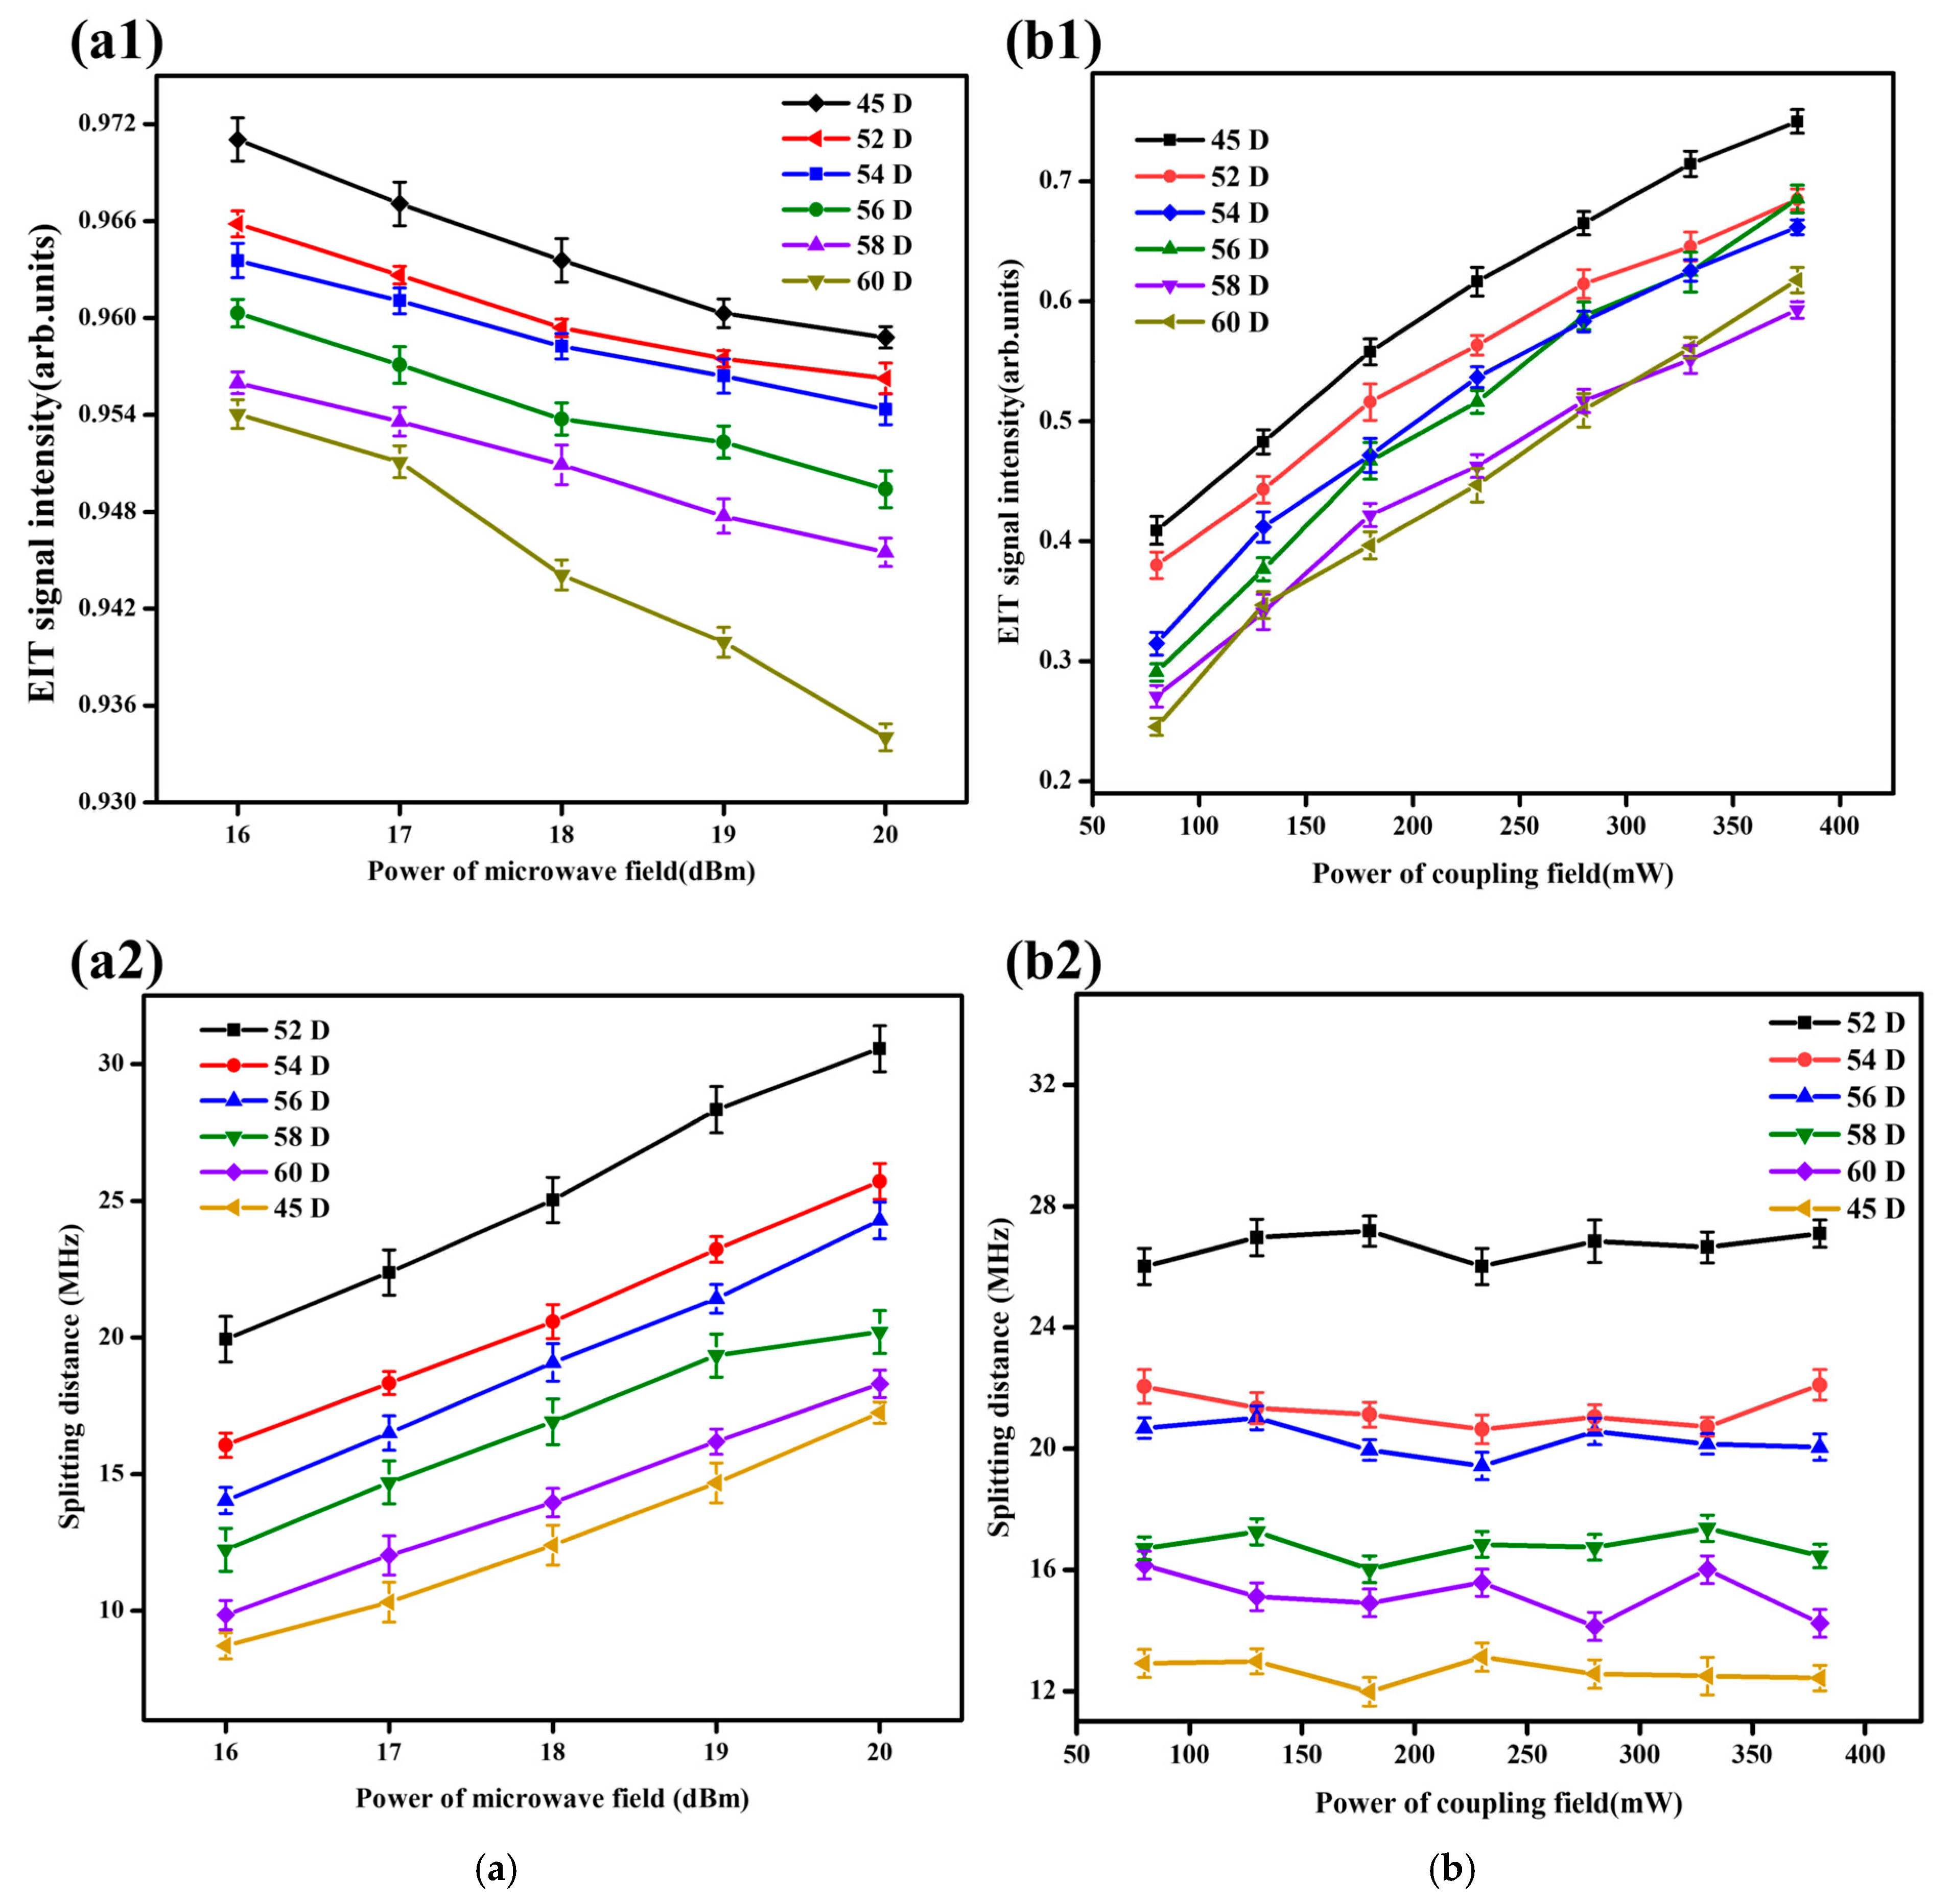
3. Results and Discussions

As a result of the microwave field either exciting or not exciting the 52D Rydberg state, the transmission spectrum results are shown in Figure 2a. Under the combined action of a weak probe field of 1 mW and a strong coupling beam of 380 mW, due to the quantum coherence effect, the probe field will be absorbed by the atom before becoming a transparent window that appears near the resonant frequency, which is the EIT spectrum via the scanning coupling beam. The transmission’s EIT spectrum is shown as a black line in Figure 2a. When a microwave resonating with the Rydberg level is applied to the atom under the tested microwave field (52D5/2→53P3/2), the large transition dipole moment of the Rydberg atom leads to the weak microwave field producing a larger Rabi frequency rate, causing the EIT transmission peak to split into two peaks, which is called the AT splitting effect and is shown by a red line in Figure 2a. This is because when the microwave field is coupled to adjacent energy levels of Rydberg atoms, the third dressing state is introduced into the EIT, causing the EIT resonance to split into two peaks. The EIT-AT effect is determined by the Rabi frequency of the microwave field. The size of the splitting is related to the applied microwave field strength. The AT splitting distance Δf is determined by the Rabi frequency Ω MW , which is seen clearly in Equation (2). From this, we can see that the AT splitting distance can be modulated by the microwave field intensity and dipole moment. The corresponding theoretical simulation results can be calculated via Equation (4) and are shown in Figure 2b, which is in accordance with experimental results.
In what follows, with the fixed power of the probe field at 1 mW, the evolution regularities of probe transmission signals are observed by modulating the powers of the microwave field from 0 dBm to 20 dBm along with the coupling beam. As shown in Figure 3a, clear regularity can be seen insofar as the splitting distance and linewidth increase with the increasing power of the microwave field intensity. In addition, splitting peaks are also shifted with a variation in the power of the microwave field intensity. The shift appearance is due to the fact that the applied microwave field itself is an oscillating electric field, which couples with the dipole moment emission of Rydberg atoms. The uncoupled atoms in other states do not resonate with the oscillating electric field, thereby producing the Stark effect and causing energy level shifts. For a non-resonant field, detuning Δ = ω3 − ϖ3, and energy level shift ΔE E 2 / Δ . The splitting distance variation can be interpreted by the expression equation of Δf in Equation (2). The linewidth of EIT is the frequency range of the transparency window, which is related to the decoherence rate of the energy level excitation system. In the excitation process of the microwave field, a stark shift appears, and the splitting distance variation leads to a decoherence rate variation, so that the linewidth is changed. Then, with a fixed microwave field intensity at 20 dBm, the power of the coupling beam is changed from 80 mW to 380 mW to observe the splitting distance and linewidth variation. As shown in Figure 3b, the splitting distance and linewidth do not change with an increasing power of the couple beam. These phenomena support the conclusion that the splitting distance and linewidth cannot be influenced by the intensity of EIT and are just determined by factors in the expression equation of Δf.
From analyzing the expression equation of Δf, when the microwave field intensity is fixed, the Rabi frequency for determining the AT splitting distance Ω MW μ MW n 2 , which means that the splitting distance increases with an increasing n. Thus, finally, many primary quantum n Rydberg states are chosen to investigate the splitting distance variation regularity with n. Figure 4(a1) shows that the EIT signal intensity of different n Rydberg states vary with the power of the microwave field ranging from 16 dBm to 20 dBm. Each EIT peak becomes weak with an increasing power of the microwave field due to AT splitting. When primarily increasing the quantum number n, the EIT signal intensity also decreases due to the interaction between Rydberg atoms and ionization effects. When increasing the power of the coupling beam from 60 mW to 380 mW, as shown in Figure 4(b1), the EIT signal intensity increases due to increasing the atomic intensity of the excitation state. The EIT signal intensity variation with n is the same in Figure 4(a1). The reason for this is also interaction and ionization effects, as interaction and ionization will increase when increasing n. Splitting distance variation regularities are presented in Figure 4(a2,b2), from which one can clearly see that the splitting distance increases when increasing the microwave field intensity and remains unchanged when increasing the coupling field intensity. As for the variation regularity of n, the splitting distance theoretically increases when increasing n; however, from Figure 4(a2,b2), we can see that the splitting distance increases first and then decreases from n = 52. These phenomena appear because black body radiation becomes strong, so that the linewidth of the EIT spectrum becomes wider than the splitting distance, while the splitting distance does not increase. Thus, in fact, the splitting distance increases with n2 under some conditions, such as a low decay environment, the strongest microwave field intensity and a controlled atomic density. These regularities can support the conclusion that the measurement of EIT microwave fields with different principal quantum numbers n shows different advantages, with a low n (30–50) being applicable to real-time monitoring over a wide frequency band. With an n higher than 52, the splitting distance has decreased instead of increasing. Thus, a relationship between the sensitivity and decoherence rate is needed for balance when applied to specific application scenarios. In order to clearly illustrate the relation between the splitting distance and the principal quantum numbers of different Rydberg states in Figure 4, we extracted the values of the microwave field power at 19 dBm and coupling field power at 280 mW from Figure 4 to generate Figure 5.

4. Conclusions

In summary, we studied the evolution of different Rydberg states under microwave field control and found that their splitting distance is not related to the signal strength, but is mainly related to the intensity of the microwave field and the transition dipole moment. However, the microwave field control behavior of different Rydberg states is only effective within a limited range, with the best principal quantum number for the splitting distance being around 52. Thus, this provides a certain support for how to select a more appropriate principal quantum number for application in the specific field of microwave field measurement. This framework bridges fundamental quantum behavior with device optimization, offering actionable criteria beyond generic Rydberg-atom advantages. These findings advance the field by resolving a key practical trade-off—sensitivity vs. decoherence—specific to thermal vapor systems.

Author Contributions

Methodology, Y.D. and X.L.; validation, Y.C.; resources, H.H.; writing—original draft, Y.D.; formal analysis, X.L.; visualization, F.Z.; writing—review & editing, Z.L. and S.Y.; project administration, S.Y. All authors have read and agreed to the published version of the manuscript.

Funding

Project supported by Science and Technology Project of SGCC (5700-202355839A-4-3-WL).

Institutional Review Board Statement

Not applicable.

Informed Consent Statement

Not applicable.

Data Availability Statement

The data that support the findings of this study are available from the corresponding author upon reasonable request.

Acknowledgments

The authors thank Zhaoyang Zhang (Xi’an Jiaotong University) for providing critical experimental datasets on Rydberg-state microwave responses, which significantly enhanced the robustness of our spectral analysis.

Conflicts of Interest

Author Yanbin Chen is employed by Wuhan Yunheng Technology Co., Ltd., a contractor of China Electric Power Research Institute Wuhan Branch. The remaining authors declare that the research was conducted in the absence of any commercial or financial relationships that could be construed as a potential conflict of interest.

References

  1. Gallagher, T. Rydberg atoms. In Springer Handbook of Atomic, Molecular, and Optical Physics; Springer: New York, NY, USA, 2006. [Google Scholar]
  2. Zhang, H.; Ma, Y.; Liao, K.Y.; Yang, W.; Liu, Z.; Ding, D.; Yan, H.; Li, W.; Zhang, L. Rydberg atom electric field sensing for metrology, communication and hybrid quantum systems. Sci. Bull. 2024, 69, 1515–1535. [Google Scholar] [CrossRef] [PubMed]
  3. Affolderbach, C.; Du, G.X.; Bandi, T.; Horsley, A.; Treutlein, P.; Mileti, G. Imaging microwave and DC magnetic fields in a vapor-cell Rb atomic clock. IEEE Trans. Instrum. Meas. 2015, 64, 3629–3637. [Google Scholar] [CrossRef]
  4. Yuan, J.P.; Yang, W.G.; Jing, M.Y.; Zhang, H.; Jiao, Y.; Li, W.; Zhang, L.; Xiao, L.; Jia, S. Quantum sensing of microwave electric fields based on Rydberg atoms. Rep. Prog. Phys. 2023, 86, 106001. [Google Scholar] [CrossRef] [PubMed]
  5. Anderson, D.A.; Sapiro, R.E.; Raithel, G. Rydberg atoms for radio-frequency communications and sensing: Atomic receivers for pulsed RF field and phase detection. IEEE Aerosp. Electron. Syst. Mag. 2020, 35, 48–56. [Google Scholar] [CrossRef]
  6. Boller, K.J.; Imamoğlu; Harris, S.E. Observation of electromagnetically induced transparency. Phys. Rev. Lett. 1991, 66, 2593. [Google Scholar] [CrossRef] [PubMed]
  7. Xue, Y.M.; Hao, L.P.; Jiao, Y.C.; Han, X.X.; Bai, S.Y.; Zhao, J.M.; Jia, S.T. Autler-Townes splitting of ultracold cesium Rydberg atoms. Acta Phys. Sin. 2017, 66, 213201. [Google Scholar] [CrossRef]
  8. Holloway, C.L.; Simons, M.T.; Gordon, J.A.; Dienstfrey, A.; Anderson, D.A.; Raithel, G. Electric field metrology for SI traceability: Systematic measurement uncertainties in electromagnetically induced transparency in atomic vapor. J. Appl. Phys. 2017, 121, 233106. [Google Scholar] [CrossRef]
  9. Prajapati, N.; Berweger, S.; Rotunno, A.P.; Artusio-Glimpse, A.B.; Schlossberger, N.; Shylla, D.; Watterson, W.J.; Simons, M.T.; LaMantia, D.; Norrgard, E.B.; et al. Investigation of fluorescence versus transmission readout for three-photon Rydberg excitation used in electrometry. arXiv 2024, arXiv:2402.00718. [Google Scholar] [CrossRef]
  10. Song, R.; Bai, J.; Li, Z.; Jiao, Y.; Zhao, J.; Jia, S. Measurements of cesium PJ-series quantum defect with the microwave spectroscopy. Opt. Express 2024, 32, 25717. [Google Scholar] [CrossRef] [PubMed]
  11. Jing, M.; Hu, Y.; Ma, J.; Zhang, H.; Zhang, L.; Xiao, L.; Jia, S. Atomic superheterodyne receiver based on microwave-dressed Rydberg spectroscopy. Nat. Phys. 2020, 16, 911–915. [Google Scholar] [CrossRef]
  12. Li, C.K.; Yao, X.P.; Chen, G. Writing and deleting skyrmions with electric fields in a multiferroic heterostructure. Phys. Rev. Res. 2021, 3, L012026. [Google Scholar] [CrossRef]
  13. Han, M.; Hao, H.; Song, X.; Yin, Z.; Parniak, M.; Jia, Z.; Peng, Y. Microwave electrometry with bichromatic electromagnetically induced transparency in Rydberg atoms. EPJ Quantum Technol. 2023, 10, 28. [Google Scholar] [CrossRef]
  14. Liu, B.; Zhang, L.H.; Liu, Z.K.; Zhang, Z.Y.; Zhu, Z.H.; Gao, W.; Guo, G.-C.; Ding, D.-S.; Shi, B.-S. Highly sensitive measurement of a megahertz rf electric field with a Rydberg-atom sensor. Phys. Rev. Appl. 2022, 18, 014045. [Google Scholar] [CrossRef]
Figure 1. Energy level excitation process and experimental setup. (a) A ladder-type four-level atomic system in the 85Rb atom for experimental processes, in which the ground state 5S1/2, a first excited state 5P3/2 (∣1〉), a highly excited Rydberg state nD5/2 (∣2〉), and a microwave field excitation are involved. (b) Simulated optical path of the experiment. HR: high-reflection mirror, PBS: polarized beam splitter, MW: microwave, APD: avalanche photodiode.
Photonics 12 00715 g001
Figure 2. (a) 52D of Rydberg EIT spectrum under 20 dBm microwave field excitation. (b) Corresponding theoretical simulation results. Atomic density is 1.0 × 1010 cm−3.
Photonics 12 00715 g002
Figure 3. (a) Measured 45D Rydberg EIT signals for different microwave field power values when scanning the Δ2. (b) Measured 45D Rydberg EIT signals for different coupling field power values when scanning the Δ2. Atomic density is 1.0 × 1010 cm−3.
Photonics 12 00715 g003
Figure 4. EIT signal intensity dependence curves and splitting distance dependence curves versus scanning Δ2. (a) The measured signal intensity and splitting distance of EIT when the microwave field power increases from 16 dBm to 20 dBm. (b) The measured signal intensity and splitting distance of EIT when the coupling field power increases from 60 mW to 380 mW.
Photonics 12 00715 g004
Figure 5. EIT splitting distance dependence curves versus principal quantum number n when the microwave field power is 19 dBm and coupling field power is 280 mW.
Photonics 12 00715 g005
Disclaimer/Publisher’s Note: The statements, opinions and data contained in all publications are solely those of the individual author(s) and contributor(s) and not of MDPI and/or the editor(s). MDPI and/or the editor(s) disclaim responsibility for any injury to people or property resulting from any ideas, methods, instructions or products referred to in the content.

