2.2. Theory of Joint Intensity
k-space intensity (
KI) is the ratio of efficient photons in the object area (
SFSeff) to all photons in the upper interface of the waveguide from the LED. As shown in
Figure 2a, the divergence angle of LED is
θ. When the oblique incident angle is smaller than the critical angle, the propagation wave is used to illuminate the object area, which is regarded as
SFSkp. The
KI is defined as
SFSeff/
SFSkp. When the oblique incident angle is larger than the critical angle, the highly localized evanescent wave is used to illuminate the object area, which is regarded as
SFSkeva. The
KI is defined as
SFSeff/
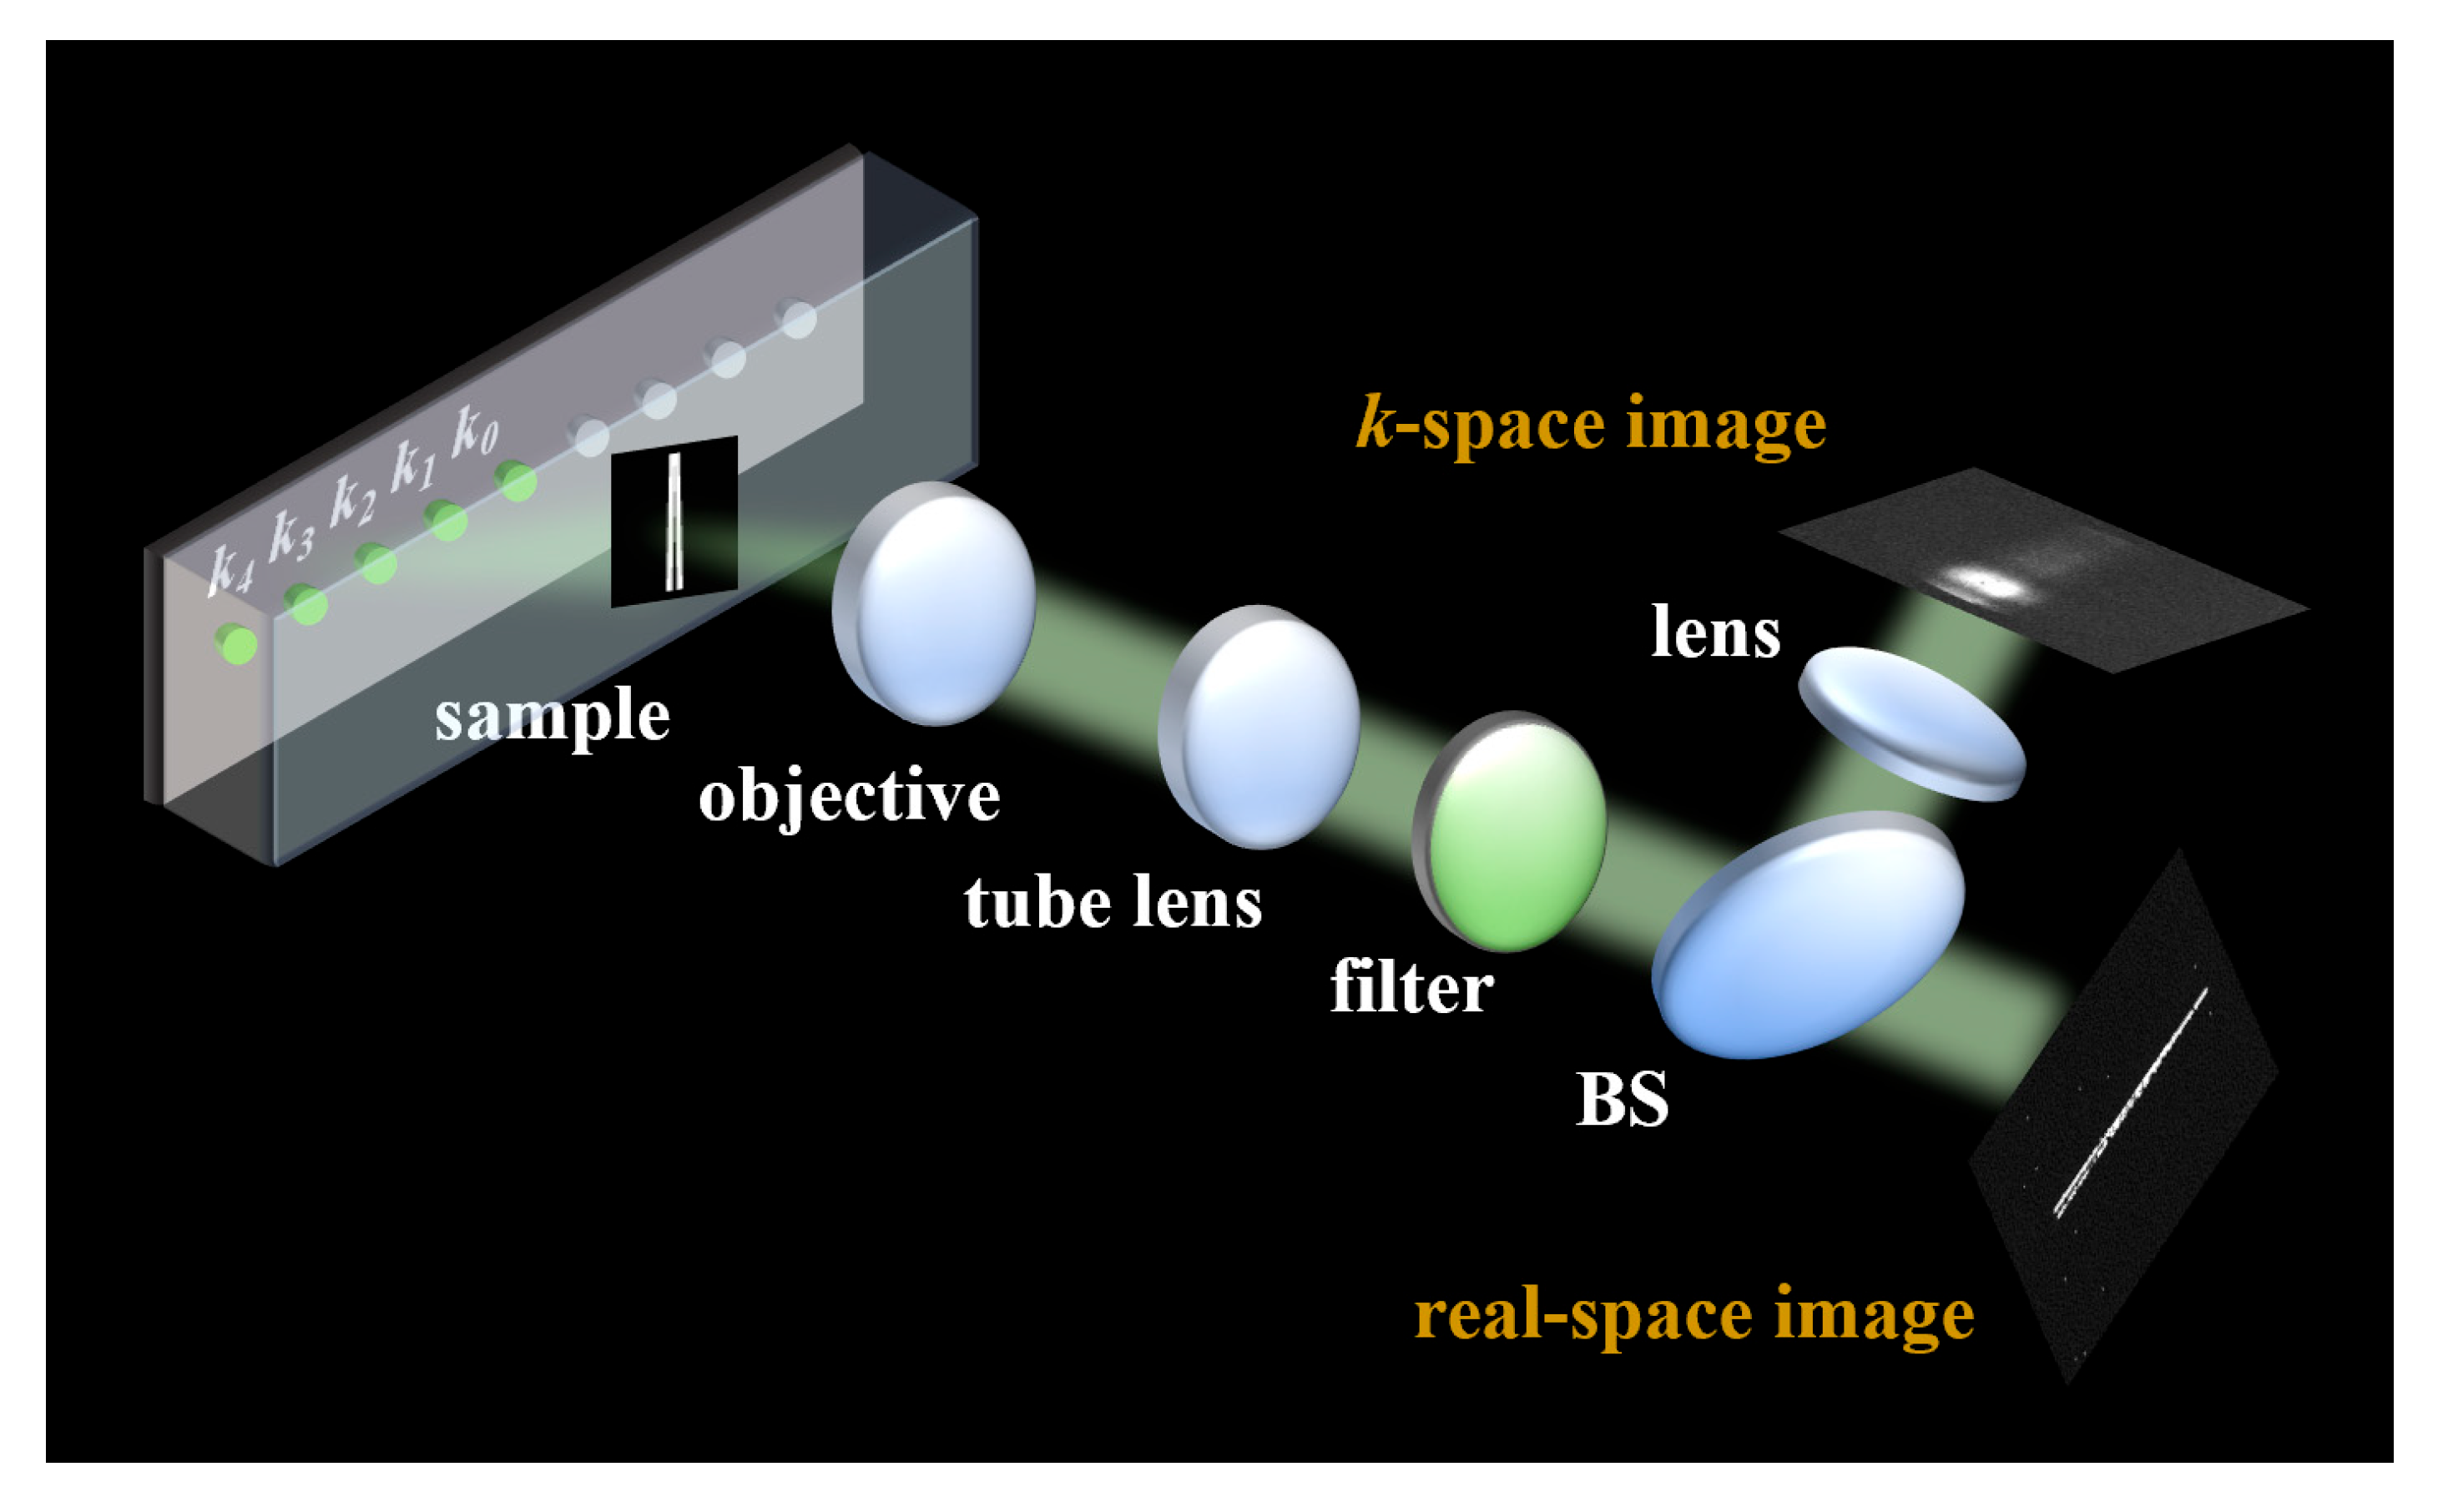
SFSkeva. In our experimental setup, five LEDs are used as the light source. The first LED is centrally positioned beneath the sample area, providing vertical illumination with a transverse wave vector of
k0, which is the traditional illumination method. The other four LEDs are lined up in a row beginning with the first LED, providing oblique illumination. Therefore, the four LEDs induce different incident angles in the sample area. Total internal reflection occurs on the surface of the sample area when the incident angle exceeds the critical angle. The waveguide material is K9 glass with a refractive index of 1.52 at a wavelength of 530 nm (the influence of waveguide imperfections on SFS super-resolution imaging is detailed in
Supplementary Materials S2). Then, the critical angle is 41°. To uniformly increase the incident angle from 0° to over 41°, the four incident angles
φ are designated as 8°, 17°, 30°, 49°, providing transverse wave vectors of
k1,
k2,
k3,
k4. Notably, depending on whether the incident angle is larger than the critical angle,
k1–
k3 are the transverse wave vectors of propagation illuminations, while
k4 is the transverse wave vector of evanescent illumination. As plotted in
Figure 2b, as the SFS becomes deeper, the
KI drops steeply, especially at the point from propagation wave illumination to evanescent wave illumination. The real-space intensity (
RI) was detected in the object area by an optical power meter (S130C, Thorlabs, Newton, MA, United States), as plotted in
Figure 2b. Notably, although the different LEDs have slightly different intensities, all data were averaged over 10 independent measurements to enhance the generalizability of the results. In the range of propagation illumination, as the SFS goes deeper, the
RI decreases slightly. From propagation illumination to evanescent illumination, the
RI drops extremely steeply. Once the LED is switched on and then illuminates the sample, the image sensor in the real-space path can collect the real-space image, and another image sensor in the
k-space path can obtain the
k-space image. The illumination from LEDs has the properties of both
KI and
RI. Although
KI and
RI are independent, the obtained image is influenced by illumination intensity, which is the combined effect of
KI and
RI. To analyze it, joint intensity (
JI) is proposed, defined as
JI =
RI ×
KI. As shown in
Figure 2c, the
JI decreases as the SFS goes deeper. Specifically, the
JI of the fourth SFS (the deepest SFS, provided by evanescent illumination in the
x-axis) is 100-fold weaker than that of the first SFS (provided by propagation illumination).
In our experiment, a series of parallel slots were used as objects to analyze the influence of illumination with multiplex SF modulation. The schematic of parallel slot distribution is illustrated in
Figure 3j, where the periods of the slots are 860 nm, 815 nm, 659 nm, 491 nm, 351 nm, 304 nm, 243 nm and 237 nm. The origin of the coordinate system is set at the midpoint between the two slots. The object function of the slots can be expressed as
where
p is the period of the slots, and
lw is the line width of the slots. In the Fourier domain, this can be expressed as (a detailed derivation process is provided in the
Supplementary Material S1)
where
C is a constant. Notably, only the term of
includes
p, indicating that only this
term determines the SF of the slots, further demonstrating that the expected resolution of SFS super-resolution imaging required for the slots to be distinguished can be analyzed based on the
term, especially the
p parameter.
Based on the periodicity of the cosine function, in the frequency domain, slots with high SF can cover some slots with low SF because high SF denotes a large period of cosine function in the frequency domain and a small spatial period of the slot structure in the spatial domain. In other words, in the spatial domain, if slots with small spatial periods can be resolved under the corresponding kx, some slots with large spatial periods may also be resolved simultaneously.
Imaging resolution refers to the smallest distinguishable detail that an optical microscope system can resolve. The LEDs are used as the light sources; thus, this is the partial coherence imaging. The resolution falls in a lager range between coherent imaging and incoherent imaging. The coherent imaging resolution is calculated by
The incoherent imaging resolution is calculated by
λ is the center wavelength of the illumination light.
NA is the numerical aperture of the objective lens.
NAillu =
n cos(
φ) is the expanded numerical aperture from the illumination modulation.
n is the refractive index of the waveguide material, and
φ is the incident angle.
k0 = 2π/
λ is the transverse wave vector provided by vertical illumination.
kxi = 2π
NAillu/
λ is the transverse wave vector provided by oblique illumination. The expected resolutions are illustrated in
Table 1. The LEDs can be modulated to generate single illumination and mixed illumination with various combinations. When a single LED illuminates the objects, the light field interacts with the sample; the scattering field of the illuminated object is calculated as
where the complex amplitude of the object is
, and the electric field of the illumination field is
.
The light field, which encompasses the complex information of the object after being collected by the microscope, travels to the plane of the image sensor, which can be represented as
where the transfer function of the linear time-invariant imaging system is
, and
denotes the convolution calculation.
Then, the image sensor obtains the intensity of the above light field, which is denoted as
The Fourier transform of the intensity is calculated as
When multiple LEDs illuminate the object (multiplex SFS mode), which is a process of incoherent imaging with mixed SF, the image sensor records the superposition of intensities, which is expressed as
The corresponding Fourier form is calculated as
Based on Equation (9), when mixed illumination is executed, the real-space intensity recording by the image sensor depends on the sum of intensities of different SFS modes. Based on
Figure 2c, the
JI of the illumination with a highly localized field is greatly weaker than that of the illumination with a propagation field. Therefore, when mixed illumination with both a highly localized field and a propagation field is employed, its real-space images mostly show photon information in the spatial domain from the illumination provided by the propagation field. Moreover, based on Equation (10), the
k-space images modulated by the illumination from multiplex LEDs also depend on the sum of
JI, obviously dominantly influenced by the most intense
JI. 2.3. Experimental Results and Discussion
As shown in
Figure 3a, parallel slots cannot be resolved under vertical illumination. As shown in
Figure 3b–e, parallel slots with corresponding periods matching the set SFS modes can be resolved under single oblique illumination with SFS1, SFS2, SFS3, SFS4, respectively, which are within the expected resolution ranges. Furthermore, based on the above analysis of the object function of slots, SF information of the SFS3 mode contains partial SF information of the SFS1 mode. And SF information of the SFS4 mode contains partial SF information of the SFS2 mode. Thus, under modulation by SFS3, as shown in
Figure 3d, parallel slots with periods of 304 nm, 351 nm, 860 nm can be distinguished, covering the partial expected resolution under the SFS1 mode. Under modulation by SFS4, as shown in
Figure 3e, slots with periods of 237 nm, 243 nm, 659 nm can be distinguished, covering the partial expected resolution under the SFS2 mode. Moreover,
Figure 3k–n plot the intensity profiles of parallel slots through dot lines. The colors of the intensity profiles correspond to the colors of the dot lines in
Figure 3b–e. For the same parallel slots, the photon intensity in the image plane drops with the SFS going deeper. The intensity profiles clearly illustrate that the slots with the expected periods are all distinguishable under the corresponding SFS modes. The intensity of real-space image analysis reveals significant variations across different SFS modes: SFS1 exhibits 1.71×, 6.86× and 40× stronger intensity compared to SFS2, SFS3 and SFS4 modes, respectively, in their resolved slots.
Interestingly, super-resolution imaging with multiplex SFS modes produces different properties compared to using the single SFS mode, including image intensity and resolution. As shown in
Figure 3f, only parallel slots with the 659 nm period (they are the expected resolution of the SFS2 mode, and they can also be resolved under the SFS4 mode) are resolved under the mixed illumination of SFS2 and SFS4. This is because the
JI of the illumination with SFS2 is 85-fold stronger than that of SFS4. The SFS4 mode is depressed, and the information of slots with the expected resolution of the SFS2 mode and the SFS4 mode is dominant. As shown in
Figure 3g, under the mixed illumination of SFS3 and SFS4, parallel slots with the 860 nm period (they can be resolved under the SFS3 mode) are vaguely distinguished, while parallel slots within the expected SFS3 and SFS4 resolution cannot be distinguished. Because the
JI of the illumination with SFS3 is 60-fold stronger than that of SFS4, the SFS3 mode and the SFS4 mode are mutually inhibitory to some extent, though the SFS3 mode is slightly dominant. As shown in
Figure 3h, none of the parallel slots are distinguished under the mixed illumination of SFS2, SFS3 and SFS4. The
JI of the illumination with SFS2 is 1.42-fold stronger than that of SFS3; thus, the SFS4 mode is inundated by the SFS2 mode and the SFS3 mode. And the SFS2 mode and the SFS3 mode are mutually constrained. As shown in
Figure 3i, only parallel slots with the 860 nm period (they are the expected resolution of the SFS1 mode, and they can also be resolved under the SFS3 mode) can be slightly distinguished under the mixed illumination of SFS1, SFS2, SFS3 and SFS4. The
JI of the illumination with SFS1 is 1.16-fold stronger than that of SFS2. Therefore, the SFS1 mode, the SFS2 mode and the SFS3 mode are mutually constrained to some extent, and the SFS4 mode is inundated by the SFS1 mode, the SFS2 mode and the SFS3 mode, though the SFS1 mode is slightly dominant.
The above parallel slots sample with different definite periods has a discrete SF distribution. Therefore, the experiment of the parallel slots sample can clearly calibrate the resolution of the imaging system. However, it fails to fully reflect the imaging resolution range of each SFS mode. Moreover, it cannot intuitively demonstrate the image magnification issue in the SFS super-resolution imaging process. Thus, V-shape slots with continuously changing periods were selected as the sample for our SFS super-resolution imaging. As shown in
Figure 4b, the V-shape slots in the yellow box cannot be distinguished at all under wide-field vertical illumination. The image of V-shape slots obtained via field emission scanning electron microscopy (FESEM, Zeiss Ultra 55, Oberkochen, Germany) is shown in
Figure 4a, whose resolution is within the range from 200 nm to 1200 nm. The following super-resolution images of V-shape slots obtained via modulated illuminations all illustrate the yellow box parts. In SFS super-resolution imaging, the modulated scattering photons carrying high SF information of the objects are collected by a microscope and then coupled into the image sensor. Hence, the high SF is shifted into the passband of the objective lens and reflected in the digital images provided by the image sensor. Objects with high SF information have sub-diffraction-limit structures in the spatial domain, and these fine structures are distorted the real size because of the optical magnification provided by the SFS method. In other words, SFS modulation provides extra magnification to the traditional microscope. Therefore, the magnification factor of SFS super-resolution imaging can be defined as
kc is the transverse wave vector of the cut-off SF of the objective lens, and
kxi is the transverse wave vector of modulated illumination. The relationship between the pixel number (
px_num) of SFS images and the real size of the objects
lr is
where
px_num denotes the center-to-center pixels of a pair of slots;
px_size is the pixel size of the image sensor; and
Mobj is the magnification of the objective lens.
As shown in
Figure 4c, under the illumination with SFS1, the continuous area of V-shape slots around the orange arrow is resolved. The normalized intensity profile pointed by the orange arrow is plotted in the inset, indicating there are 11 pixels between two peeks (the distance between the middle of a pair of slots). Based on Equation (12), the period of the slots is 841 nm, which is within the expected resolution range. As shown in
Figure 4d, under the illumination with SFS2, the continuous range of V-shape slots around the yellow arrow is resolved. The normalized intensity profile pointed by the yellow arrow shows 10 pixels, demonstrating that the period of the slots is 638 nm, which is also within the expected resolution range. Notably, it can be observed that there is a significant magnification in the distinguishable areas. As shown in
Figure 4e, under the illumination with SFS3, two continuous areas are distinguished, where the resolutions are within the range of the SFS1 mode and the SFS3 mode. Compared with the orange area under the SFS1 mode, the orange area under the SFS3 mode has a more obvious magnified distortion. In other words, as the SFS becomes deeper, the magnification increases, which is consistent with Equation (11). The normalized intensity profile pointed by the green arrow is plotted in the inset, showing there are nine pixels between the peaks. After calculation, the resolution at the green point is 473 nm. The reason for the calculated resolution (473 nm) being slightly distant from the resolution range of SFS3 (274–459 nm) is imprecise computations due to the larger pixel size of the image sensor. As shown in
Figure 4f, under the illumination with SFS4, similar phenomena are observed as with SFS3, but the intensity is smaller. And two continuous areas around the yellow and pink arrows are resolvable. The normalized intensity profile illustrates that there are eight pixels between the peaks at the pink point, indicating that the corresponding resolution is 344 nm, which is in line with expectations.
Furthermore, the multiplex SFS modes for V-shape slots are also studied. As shown in
Figure 4g, under the mixed illumination of SFS2 and SFS4, the yellow area is magnified and distinguished. As shown in
Figure 4h, under the mixed illumination of SFS3 and SFS4, the orange area is magnified and distinguished. As shown in
Figure 4i, under the mixed illumination of SFS2, SFS3 and SFS4, the orange area is subtly magnified and slightly distinguished. As shown in
Figure 4j, under the mixed illumination of SFS1, SFS2, SFS3 and SFS4, the orange area is subtly magnified and clearly distinguished. These results validate the conclusion from the parallel slots experiment, and furthermore, they demonstrate the situations encountered in objects with continuous SF.
While obtaining the real-space images of the object, its
k-space images are also obtained. The parallel slots and V-shape slots are in the same substrate of the sample. Therefore, for the parallel slots and V-shape slots, the same
k-space images are studied.
Figure 5a shows the SF spectrum image of the object, which is obtained via Fourier transform from the SEM image of the object. The parallel slots and V-shape slots only contain SF information in the horizontal and vertical directions, as expected. The SEM image has a high resolution, resolving slots with both small and large periods. Thus, the SF spectrum image of the object contains low SF information and high SF information. The
k-space image under wide-field vertical illumination is shown in
Figure 5b, containing only cut-off SF information with four mutually perpendicular directions. The
k-space images under single illumination with SFS1, SFS2, SFS3 and SFS4 are shown in
Figure 5c–f. As the SFS goes deeper, the higher SF information shifts into the cut-off SF passband of the objective lens to the image sensor. The SF information in each SFS step corresponds to each part of the SF spectrum of the object in
Figure 5a. Additionally, as the SFS goes deeper, the intensity of the
k-space drops according to the
JI. Furthermore,
k-space images under multiplex SFS modes are studied, as shown in
Figure 5g–j. The dominant role of SFS with a high
JI can be observed, along with the mutual constraints and superposition effects of different SFS modes. These results in the
k-space images are consistent with findings from the real-space images.


