Review

Photonics-Enabled High-Sensitivity and Wide-Bandwidth Microwave Phase Noise Analyzers

Ministry of Education Key Laboratory of NSLSCS, School of Computer and Electronic Information, Nanjing Normal University, Nanjing 210016, China
*
Author to whom correspondence should be addressed.
Photonics 2025, 12(7), 691; https://doi.org/10.3390/photonics12070691
Submission received: 13 June 2025 / Revised: 5 July 2025 / Accepted: 7 July 2025 / Published: 8 July 2025
(This article belongs to the Special Issue Recent Advancement in Microwave Photonics)

Abstract

Phase noise constitutes a pivotal performance parameter in microwave systems, and the evolution of microwave signal sources presents new demands on phase noise analyzers (PNAs) regarding sensitivity and bandwidth. Traditional electronics-based PNAs encounter significant limitations in meeting these advanced requirements. This paper provides an overview of recent progress in photonics-based microwave PNA research. Microwave photonic (MWP) PNAs are categorized into two main types: phase-detection-based and frequency-discrimination-based architectures. MWP phase-detection-based PNAs utilize ultra-short-pulse lasers or optical–electrical oscillators as reference sources to achieve superior sensitivity. On the other hand, MWP frequency-discrimination-based PNAs are further subdivided into photonic-substitution-type PNA and MWP quadrature-frequency-discrimination-based PNA. These systems leverage innovative MWP technologies to enhance overall performance, offering broader bandwidth and higher sensitivity compared to conventional approaches. Finally, the paper addresses the current challenges faced in phase noise measurement technologies and suggests potential future research directions aimed at improving measurement capabilities.

1. Introduction

Phase noise serves as a quantitative measure of short-term frequency stability in microwave signals [1,2]. Specifically, it is mathematically defined as half of the single-sided power spectral density (PSD) associated with random phase fluctuations in a microwave signal, expressed as [3]:
L f m S φ f m 2
where fm represents the frequency offset from the carrier, and Sφ(fm) denotes the single-sided PSD of the phase fluctuations φ(t).
Phase noise constitutes a pivotal performance parameter in microwave engineering systems such as radar systems [4], timing devices [5], and communication equipment [6]. The precise measurement of this parameter not only provides theoretical foundations for system development but also serves as a critical technical basis for fault diagnosis and performance enhancement, thereby emerging as a fundamental challenge in contemporary microwave engineering research.
To meet the increasingly stringent requirements of various application systems for microwave signal sources, researchers worldwide have dedicated significant efforts to reducing phase noise and expanding frequency ranges. As the phase noise performance of microwave signal sources continues to improve, the generated phase noise intensity becomes increasingly weaker, necessitating phase noise analyzers (PNAs) with enhanced sensitivity to accurately detect these extremely weak noise signals. During the development and testing of low-noise signal sources, insufficient measurement system sensitivity may lead to an inability to distinguish between the inherent low phase noise of the signal source and the noise introduced by the measurement system itself, resulting in measurement deviations. For instance, the X-band optoelectronic oscillator (OEO) produced by the OEwaves Company exhibits remarkable phase noise performance of −163 dBc/Hz @ 6 kHz [7], presenting significant challenges to the measurement sensitivity of PNA. Furthermore, as microwave signal sources evolve towards broadband and high-frequency applications, PNAs must possess sufficient measurement bandwidth to cover all operational frequency bands. With the emergence of new technologies such as 5G communications, millimeter-wave radar, and satellite communications, the operational frequencies of microwave signal sources continue to extend into higher bands. In the millimeter-wave frequency range of 5G communications (e.g., 24.25 GHz to 52.6 GHz), signal sources must provide stable high-frequency signals to support high-speed data transmission. Meanwhile, millimeter-wave radars tend to adopt 77 GHz, 79 GHz, or even higher frequencies to achieve enhanced resolution and precision. This implies that signal sources must maintain excellent phase noise characteristics at high frequencies, as high-frequency signals exhibit greater sensitivity to phase noise variations, where even minor phase fluctuations can significantly impact signal quality. For microwave signal sources with rapid switching capabilities, corresponding phase noise measurement systems must execute measurements swiftly to enable real-time monitoring of phase noise variations during frequency transitions. Particularly in testing frequency-hopping communication signal sources, where frequent frequency changes occur, inadequate measurement speed may result in missed detection of phase noise conditions during each frequency transition, thereby hindering timely problem identification. In summary, the developmental trends of microwave signal sources towards improved stability, broader bandwidths, and faster switching speeds present new challenges for PNAs regarding sensitivity, bandwidth, and speed. These emerging demands will conversely drive advancements in microwave signal source technology, enabling better adaptation to the growing high-performance requirements of modern communication, radar, and electronic measurement industries.
However, due to the inherent limitations of electronic components in terms of speed and sensitivity, conventional electronics-based PNAs are increasingly challenged in meeting the growing demands for ultra-wideband and high-sensitivity measurement capabilities. This electronic bottleneck not only constrains the performance enhancement of such instruments but also impedes their broad applications in high-frequency bands and complex signal environments. Consequently, the development of novel phase noise measurement technologies and instrumentation has emerged as one of the key research priorities in contemporary metrology. Fortunately, the rapid development of microwave photonics (MWP) in recent years has brought novel approaches to high-performance phase noise measurement [8,9]. By leveraging the inherent advantages of photonic technologies such as broadband capability, low loss, low jitter, and electromagnetic interference immunity, high-sensitivity and wide-bandwidth microwave phase noise measurement can be effectively achieved [10,11].
This paper reviews recent advancements in photonics-based microwave PNA research, with an overall summary diagram presented in Figure 1. The paper is organized as follows. Section 2 elucidates the fundamental principles, advantages, and limitations of typical phase noise measurement methodologies. Section 3 provides a comprehensive analysis of MWP phase-detection-based PNA implementations. Section 4 examines recent developments in MWP frequency-discrimination-based PNA systems. Finally, Section 5 discusses current challenges in phase noise measurement technologies and proposes potential research directions for performance enhancement.

2. Basic Phase Noise Measurement Methods

There are mainly four kinds of basic phase noise measurement methods [12,13], including the direct spectrum method, the phase detection method, the frequency discrimination method, and the dual-channel cross-correlation method.

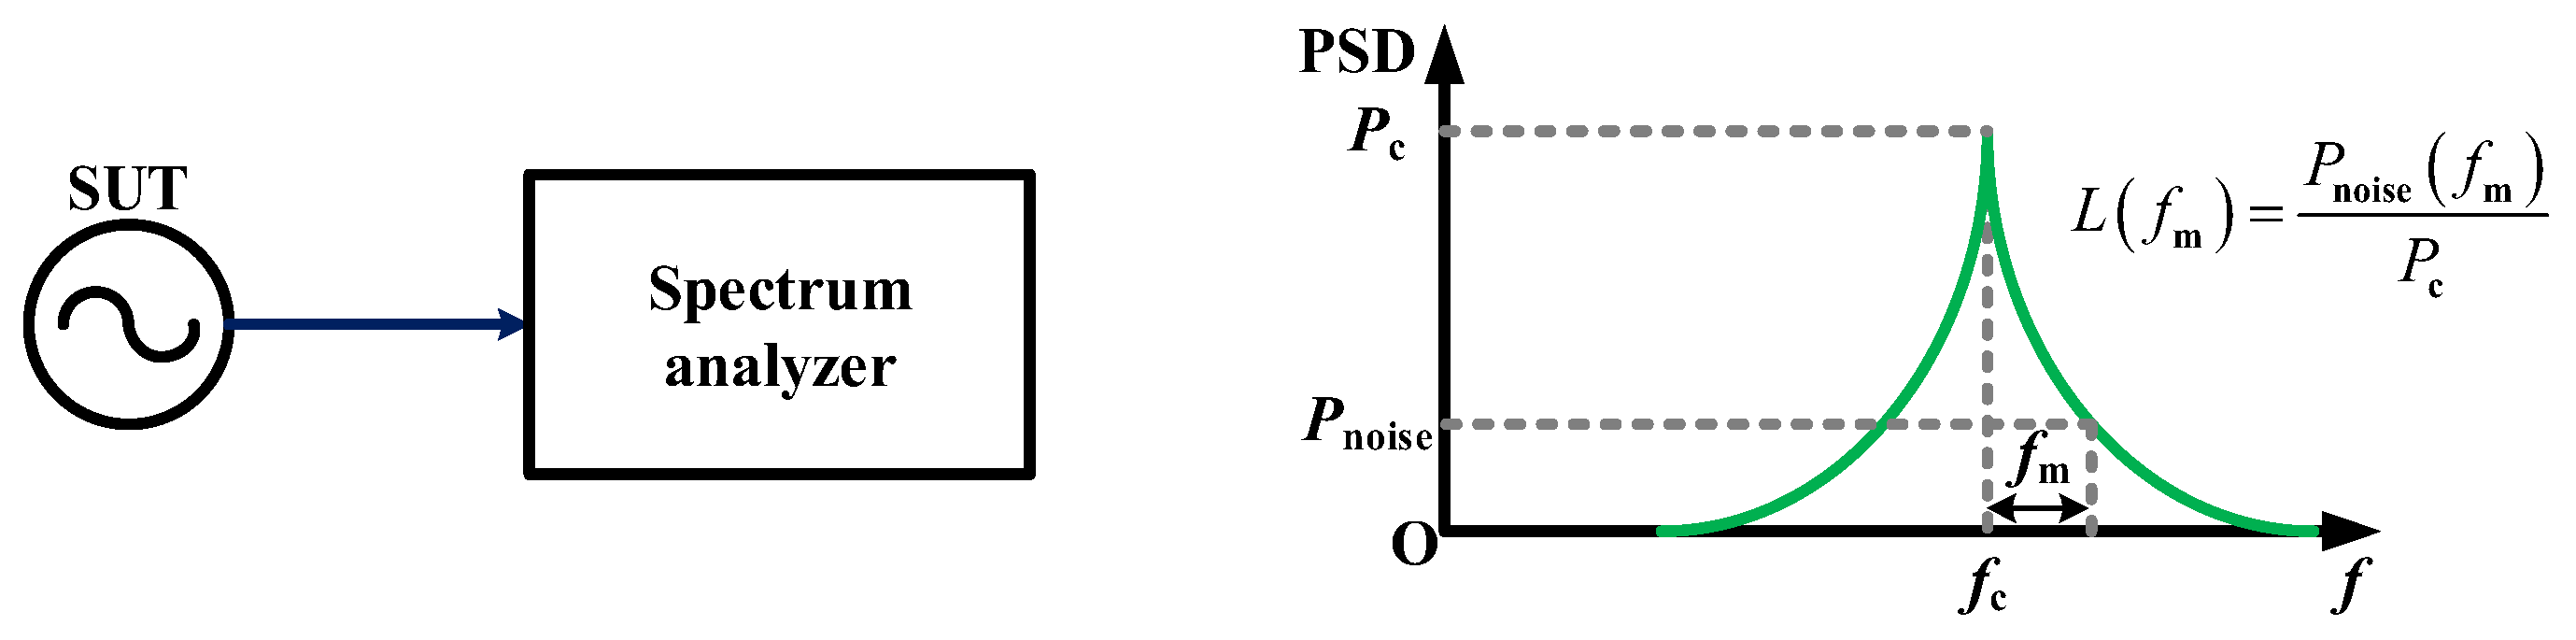
2.1. Direct Spectrum Method

The direct spectrum method represents the most straightforward technique for phase noise measurement, with its fundamental principle depicted in Figure 2. In this approach, the signal under test (SUT) is directly fed into a spectrum analyzer to characterize its spectral properties. The phase noise of the signal source is subsequently determined through the following equation:
L f m = P SSB f m P c
where PSSB(fm) = Sv(fc + fm) denotes the single-sided PSD of the SUT at an frequency offset fm from the carrier frequency fc, while Pc represents the carrier power. The phase noise calculated using Equation (2) approximates the theoretical definition in Equation (1) when two critical conditions are satisfied [3]:
(1)
Negligible amplitude noise in the SUT;
(2)
Compliance with the small-angle approximation, requiring: root mean square value of the phase fluctuations φ(t) is less than 0.01 rad, and peak magnitude of φ(t) do not exceed 0.2 rad.
This direct spectrum method features a simple structure and easy implementation. However, it has several limitations. Firstly, the method relies on approximate calculations based on Equation (2), making it only suitable for signals with relatively low phase noise and inadequate for microwave signals exhibiting poor phase noise performance. Secondly, the technique cannot differentiate between phase noise and amplitude noise in the measured signal. Consequently, the measurement results encompass both types of noise, leading to inaccuracies in the final phase noise assessment. Thirdly, both the measurement bandwidth and sensitivity of this method are constrained by the operational bandwidth and dynamic range limitations of the spectrum analyzer.
The current mainstream commercial PNAs using direct spectrum method in the market primarily include Keysight’s N9030A PXA series signal analyzers, sourced from Keysight Technologies in Santa Clara, CA, USA, and Rohde & Schwarz’s FSV series signal analyzers, sourced from Rohde & Schwarz in Munich, Germany. Among these, the N9030A-550 model with the largest measurement bandwidth in the N9030A PXA series features a wideband measurement capability of 3 Hz to 50 GHz. Under 1 GHz carrier frequency conditions, its typical sensitivity reaches −129 dBc/Hz @ 10 kHz. Meanwhile, the flagship model FSV-K40 of the FSV series extends its operational bandwidth to 10 MHz–40 GHz, achieving a sensitivity specification of −110 dBc/Hz @ 10 kHz @ 1 GHz. Notably, although both instruments demonstrate excellent phase noise measurement sensitivity at 1 GHz carrier frequency, their performance exhibits significant degradation as carrier frequency increases. Experimental data reveal that when the test signal carrier frequency is elevated to 38 GHz, the sensitivity of FSV-K40 at 10 kHz offset deteriorates to −92 dBc/Hz, showing an 18 dB performance degradation compared to the measurement at 1 GHz.

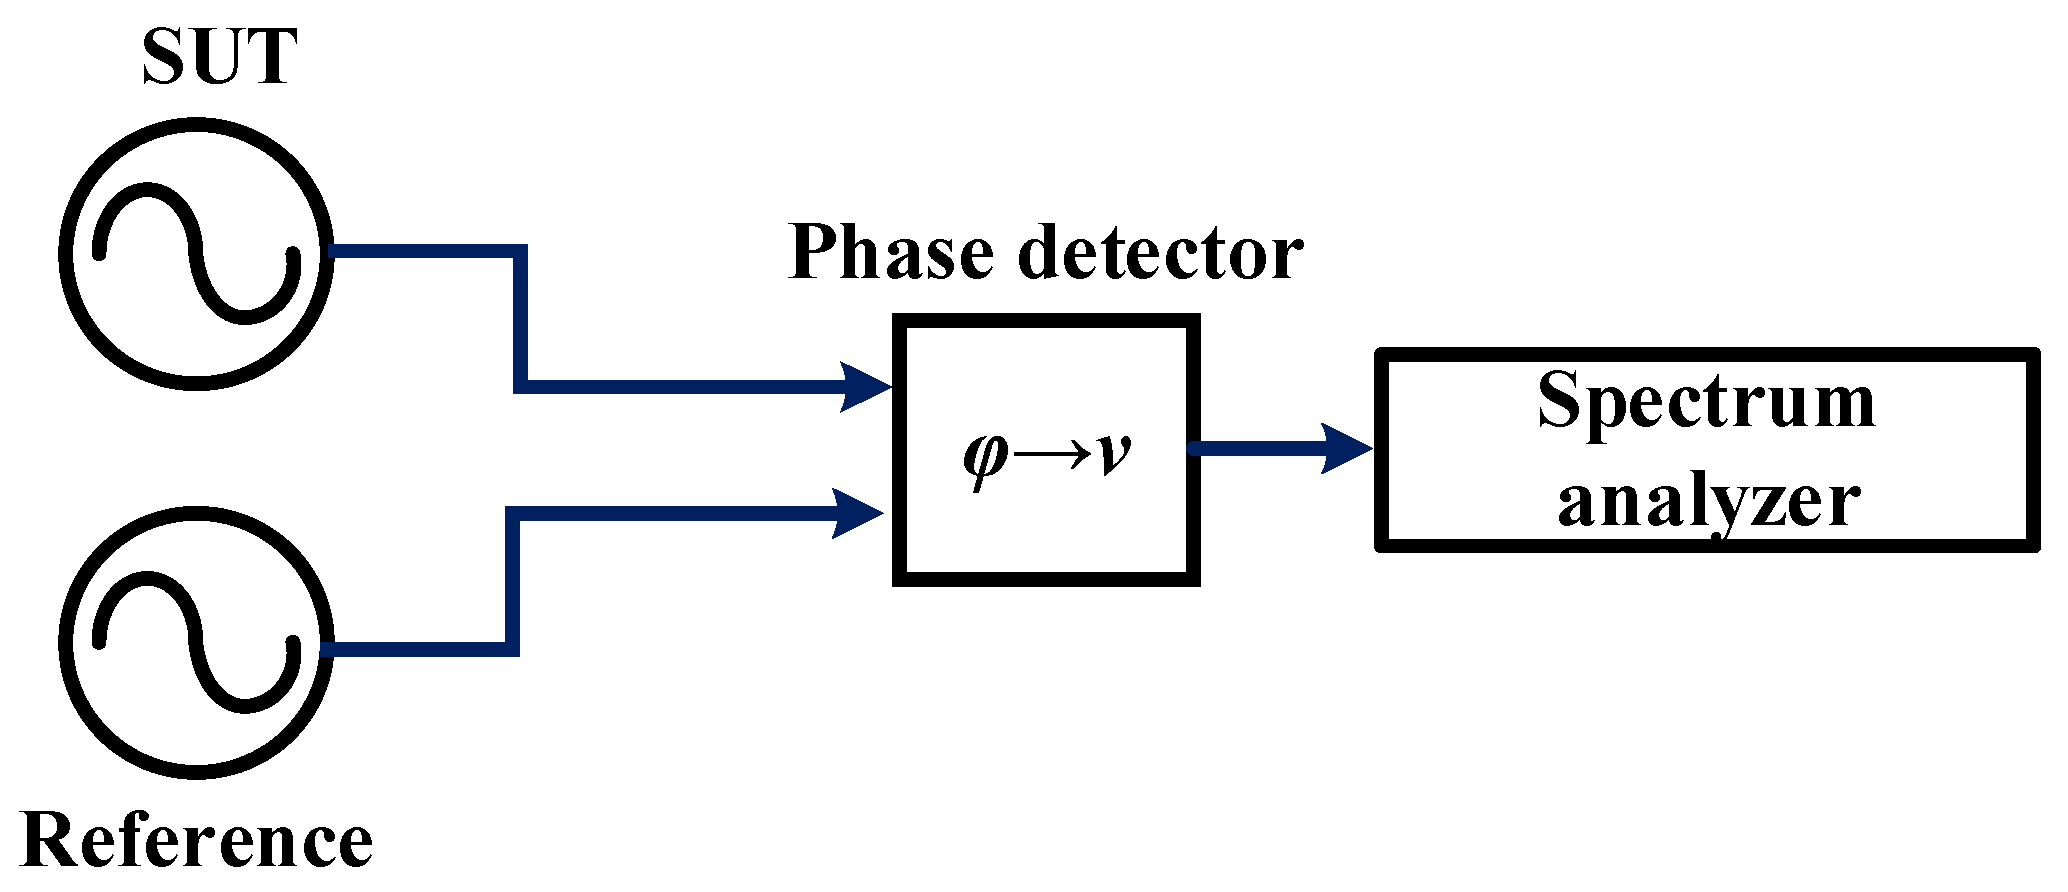
2.2. Phase Detection Method

A schematic diagram of the phase detection method principle is shown in Figure 3. This method requires the reference source and the microwave SUT to share identical frequencies while maintaining a 90° phase difference. Both signals are input into a phase detector for phase-to-voltage conversion. After obtaining the PSD of the voltage signal through a spectrum analyzer, calibration is required to eliminate the influence of the phase detector’s conversion coefficient, ultimately yielding the PSD of the phase difference between the two signals. Since the phase noise of the reference signal is typically significantly lower than that of the SUT, this PSD directly characterizes the phase fluctuations characteristics of the SUT, which can be converted to phase noise using Equation (1).
Although the phase detection method offers high measurement accuracy, it presents notable implementation constraints: Firstly, obtaining a reference source with identical frequency and superior phase noise performance to the SUT proves challenging in practical measurements, resulting in system measurement bandwidth and sensitivity being limited by the reference source’s tunable frequency range and phase noise characteristics, respectively. Secondly, this method is unsuitable for free-running oscillators or sources with poor frequency stability due to difficulties in maintaining the required equal frequency and quadrature phase.
Current mainstream PNAs predominantly adopt phase detection architectures, with representative models including the Keysight E5500 series, sourced from Keysight Technologies in Santa Clara, CA, USA, and NoiseXT PN9000 series (featuring dual phase/frequency detection capabilities), sourced from Voisins-le-Bretonneux, France. Limited by reference source constraints, the E5500 series operates within 50 kHz–26.5 GHz. At lower frequencies (<3 GHz), its typical noise floor reaches −135 dBc/Hz @ 10 kHz, where sensitivity is primarily constrained by reference source phase noise. For high-frequency measurements (18–26.5 GHz), down-conversion via mixers introduces additional noise from local oscillators and mixer components, degrading the noise floor to −118 dBc/Hz @ 10 kHz. In contrast, the PN9000 series extends its measurement range to 2 MHz–50 GHz through multi-stage down-conversion, but similarly exhibits high-frequency sensitivity degradation: achieving −136 dBc/Hz @ 10 kHz at 1 GHz carrier versus −104 dBc/Hz @ 10 kHz at 40 GHz carrier.

2.3. Frequency Discrimination Method

The working principle of the frequency discrimination method is illustrated in Figure 4. The microwave SUT is divided into two paths by a power splitter: one path passes through a phase shifter to the phase detector, while the other is fed to the phase detector via a delay line (time delay τ). The phase shifter is adjusted to maintain a 90° phase difference between the two input signals, enabling the phase detector to output a voltage signal proportional to the phase difference. After obtaining the PSD of this voltage signal through a spectrum analyzer, calibration is required to eliminate the influence of the phase-to-voltage conversion coefficient of the phase detector, ultimately yielding the PSD of the phase difference φ(t) − φ(tτ). The relationship between phase noise L (f) and the single-sideband PSD of phase difference SΔφ(fm) can be expressed as:
S Δ φ f m = 1 e j 2 π f m τ S φ f m = 8 sin 2 π f m τ L f m
This indicates that phase noise can be obtained by dividing the PSD of the phase difference by 8 sin2(πfτ).
Compared with phase detection methods, the frequency discrimination approach eliminates the requirement for a reference source, thereby resolving three inherent limitations of phase detection techniques: restricted measurement bandwidth, compromised sensitivity due to reference source dependency, and lack of applicability to free-running oscillators. However, this method demonstrates diminished measurement accuracy in low-frequency offset regimes. The performance constraints primarily stem from two key delay line parameters:
Sensitivity Trade-off: While delay length exhibits positive correlation with sensitivity, extended electrical delay lines introduce increased attenuation. This attenuation reduces phase detector conversion efficiency, ultimately counteracting the sensitivity enhancement.
Bandwidth Limitations: The operational bandwidth of delay lines fundamentally restricts measurement range, while the finite bandwidth characteristics of electrical phase shifters and phase detectors impose additional performance constraints.
The NoiseXT PN9000 series PNA, a representative dual-mode system integrating both frequency discrimination and phase detection, exemplifies these characteristics. Specifically designed for free-running oscillators or sources with marginal frequency stability, its performance metrics reveal the following: at 1 GHz carrier frequency, the instrument achieves a noise floor of −133 dBc/Hz @ 10 kHz with 100 ns delay, degrading to −124 dBc/Hz @ 10 kHz with 20 ns delay. In high-frequency implementations (e.g., 40 GHz carriers), despite employing low-noise amplifiers and down-conversion modules to compensate for cable attenuation, the noise floor rises to −104 dBc/Hz @ 10 kHz (100 ns delay) and −103 dBc/Hz @ 10 kHz (20 ns delay). This performance degradation underscores the sensitivity compromise introduced by auxiliary circuitry in practical implementations.

2.4. Dual-Channel Cross-Correlation Method

Based on the technical framework of phase detection and frequency discrimination methods, the introduction of dual-channel cross-correlation technology can significantly enhance the sensitivity of PNAs. Figure 5 illustrates the core principle of the dual-channel cross-correlation method: the microwave SUT is equally divided into two paths through a power divider, which are then fed into two structurally identical phase noise measurement channels. Assuming the intrinsic noise of the two channels as a(t) and b(t), respectively, and the phase noise of the measured signal as c(t), the output signals of both channels can be expressed as the superposition of the measured signal’s phase noise and their respective system intrinsic noise. By performing cross-power spectral analysis on the two output signals, the mathematical expression is derived as:
S xy = 1 T E C + A × C + B * = 1 T E C C * + E C B * + E A C * + E A B *
where A(f), B(f), and C(f) represent the Fourier transforms of the corresponding time-domain signals. Based on the statistical independence assumption among noise sources, the expectation values of the last three terms in Equation (4) approach zero, thereby effectively suppressing system intrinsic noise. This technology has been successfully implemented in commercial instruments such as the Rohde & Schwarz FSWP series and NoiseXT’s DCNTS/NXA series, significantly improving phase noise measurement sensitivity. Experimental data demonstrate that under 1 GHz carrier frequency and 10 kHz offset conditions, after 1000 cross-correlation processing iterations, the noise floors of FSWP, DCNTS, and NXA systems reach −181 dBc/Hz, −183 dBc/Hz, and −187 dBc/Hz, respectively, showing remarkable improvement compared to traditional single-channel systems (e.g., E5500 and PN9000 series).
It should be noted that system sensitivity exhibits positive correlation with cross-correlation processing iterations, while measurement time increases with processing count. Furthermore, this technology introduces significant system architecture complexity while enhancing performance.

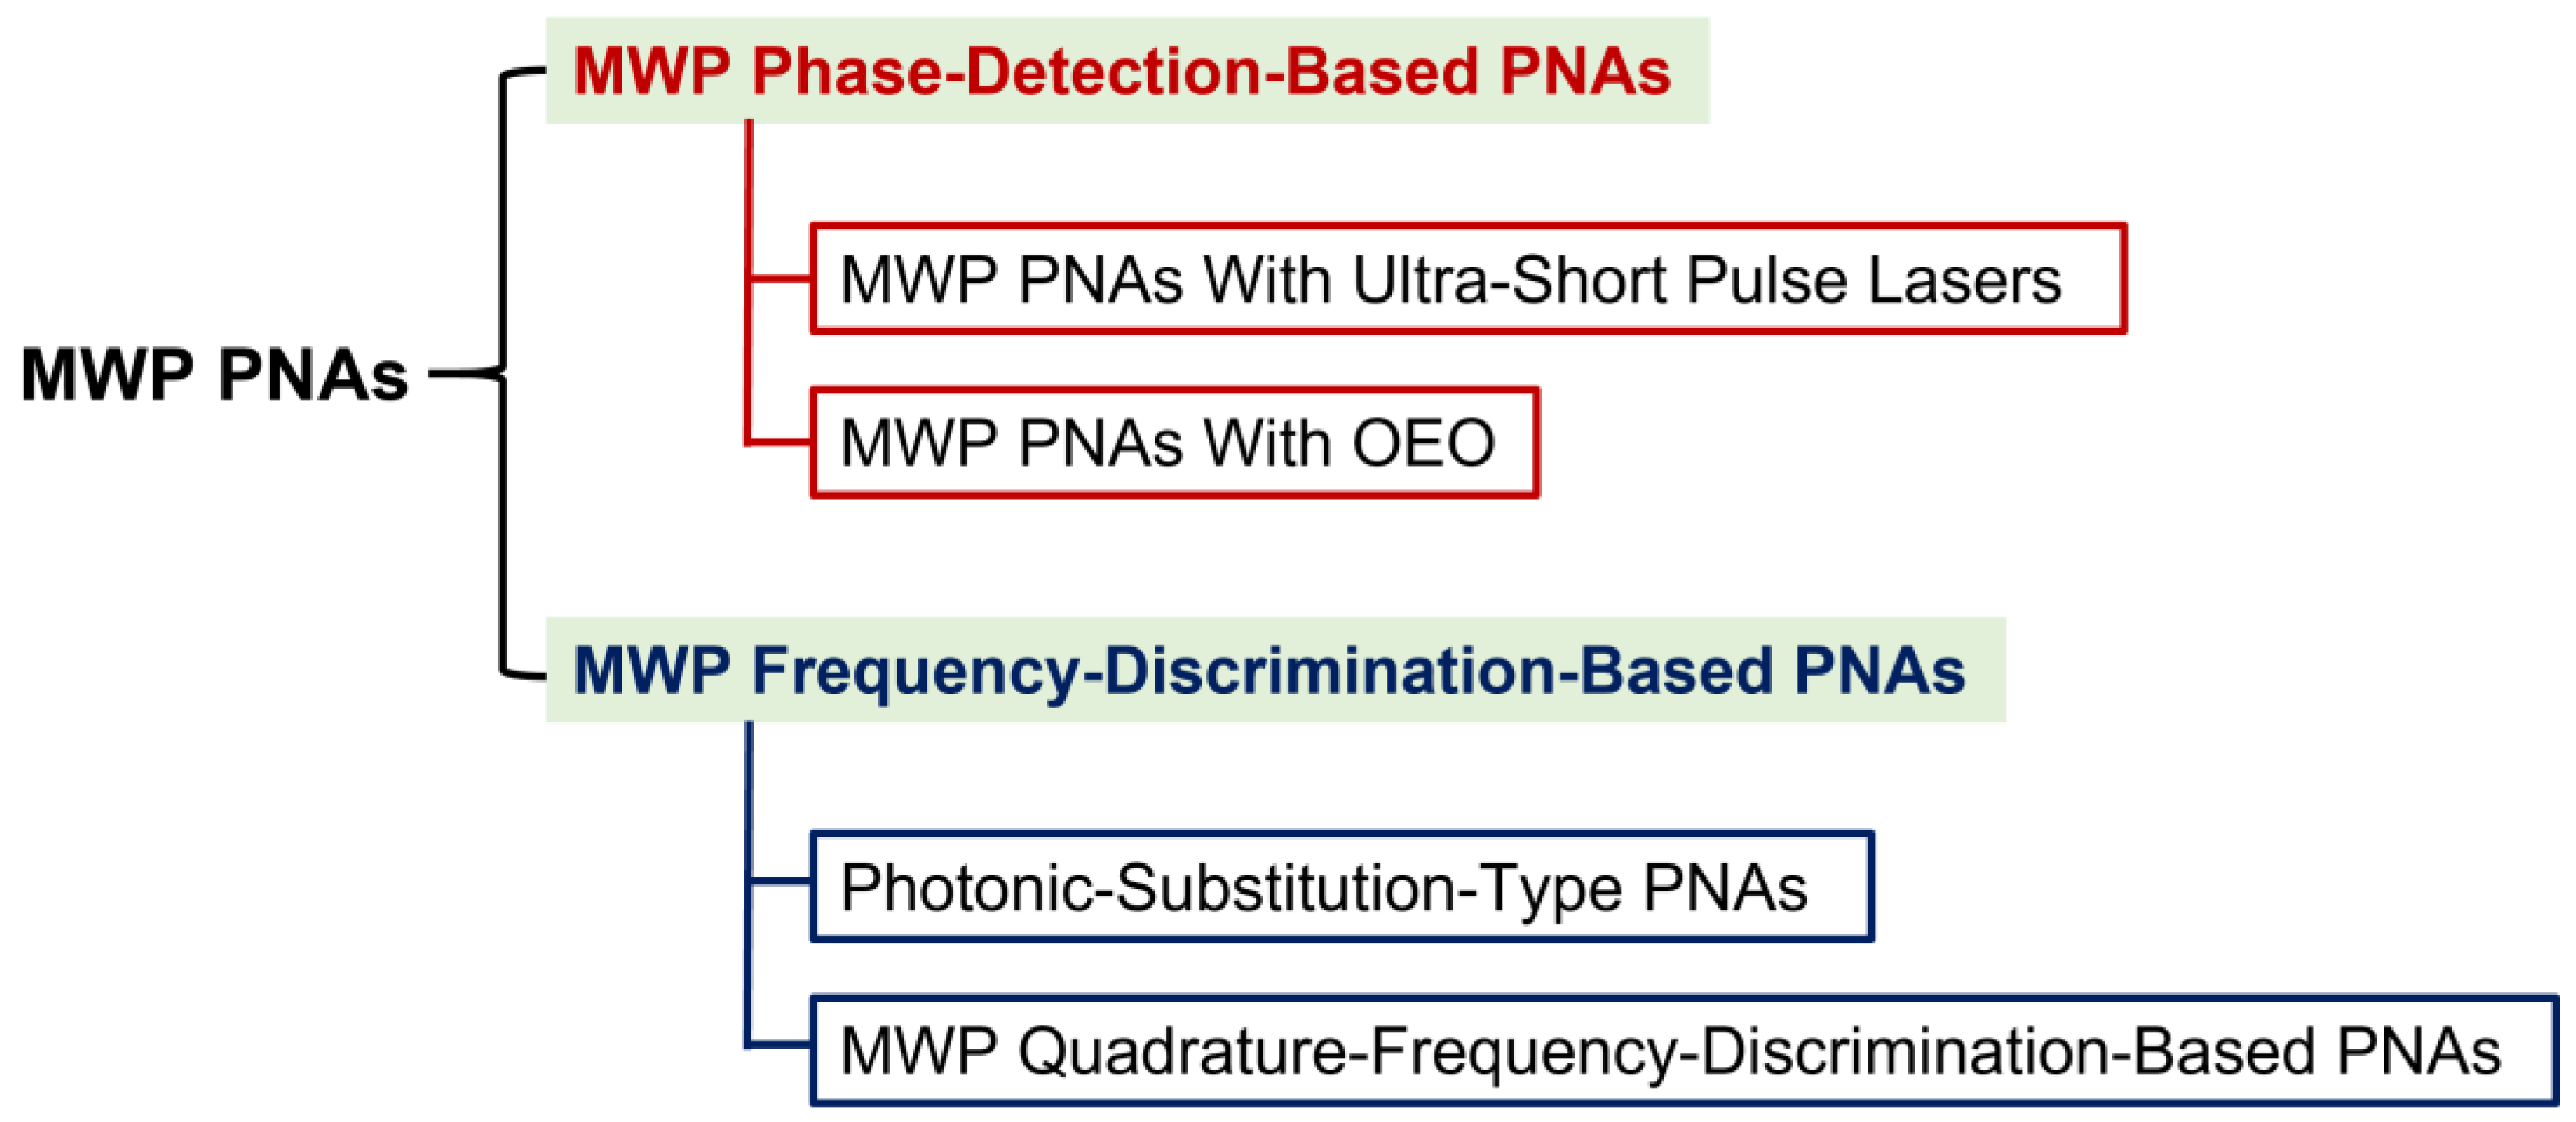
3. MWP Phase-Detection-Based PNAs

The analysis of the phase detection method in Section 2.2 indicates that the phase noise of the reference signal source is the primary bottleneck limiting the sensitivity of phase detection. To overcome the limitations imposed by traditional microwave signal sources’ phase noise, MWP phase-detection-based PNAs employ ultra-short pulse lasers or OEOs as reference sources, which have superior phase noise characteristics.

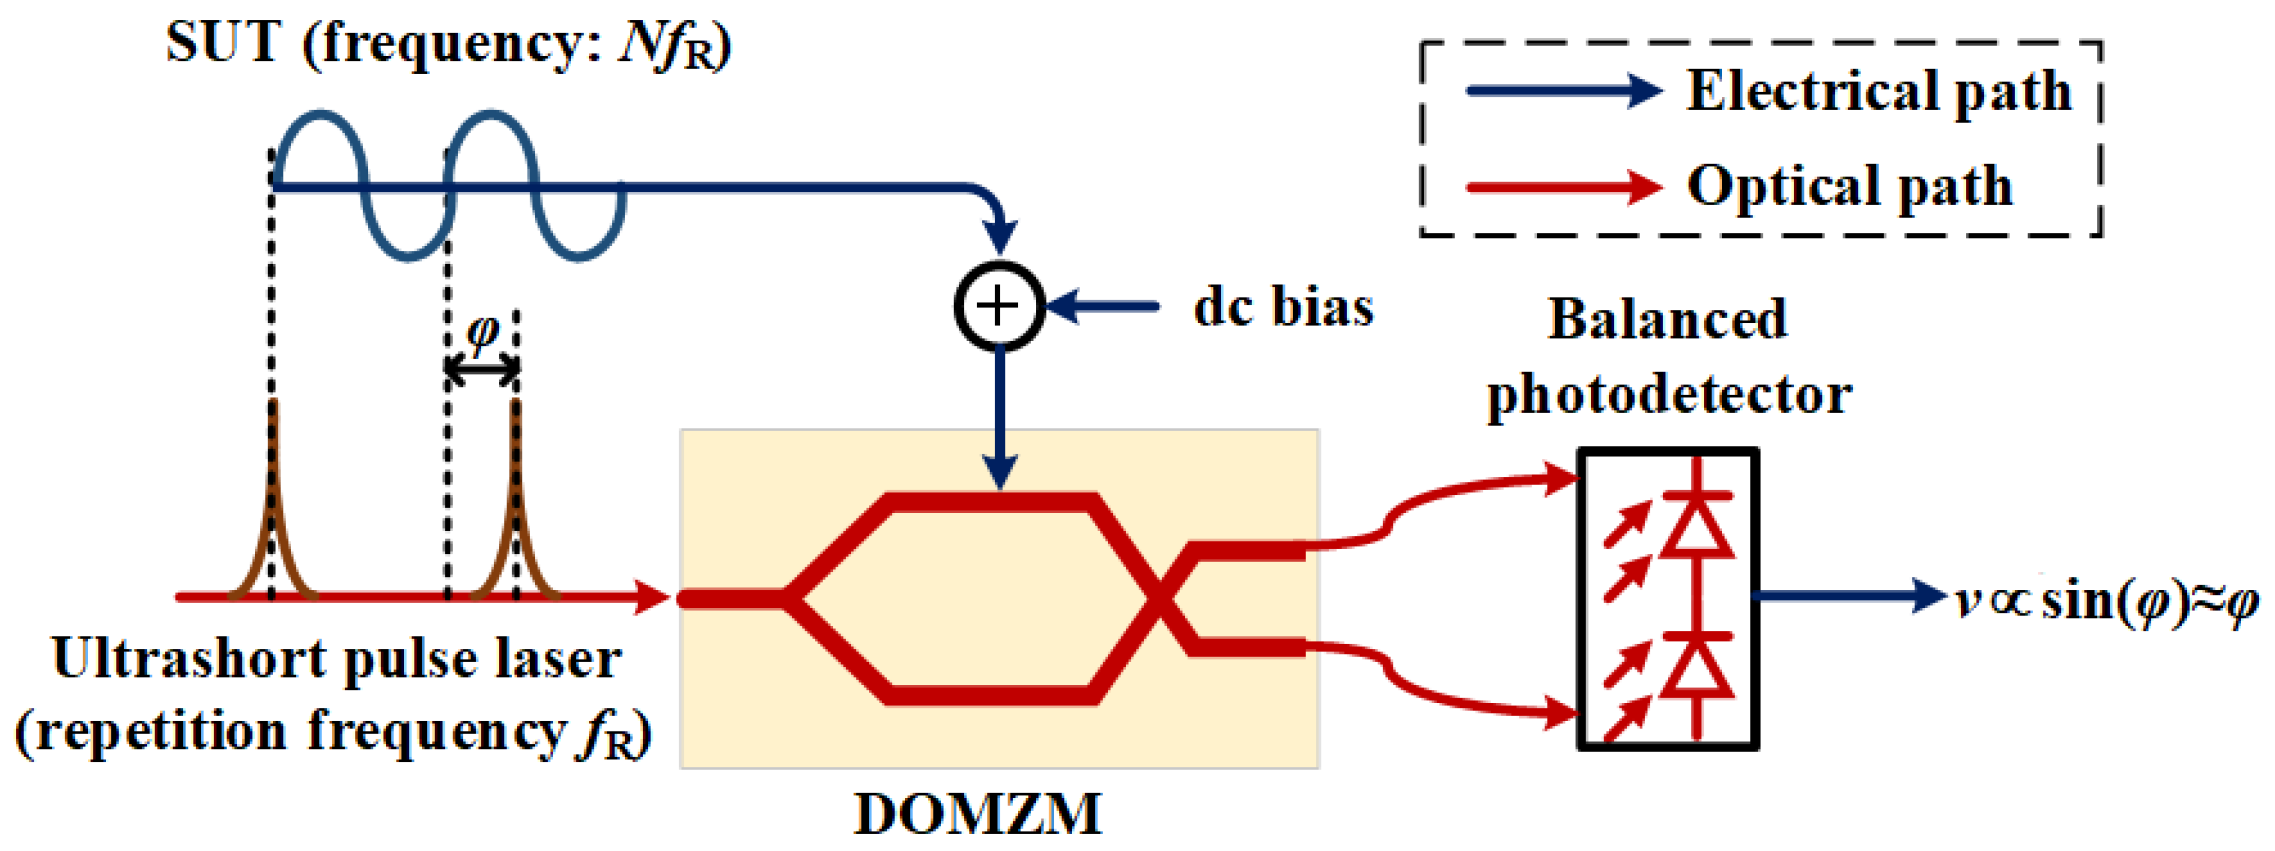
3.1. MWP PNA with Ultra-Short-Pulse Lasers

Ultra-short-pulse lasers consist of a sequence of optical pulses with extremely short durations in the time domain, and their unique low time jitter characteristics make them particularly advantageous for high-sensitivity phase noise detection [14,15,16]. MWP phase detection methods based on this light source measure the phase difference between optical pulses and microwave signals using MWP phase detectors. According to structural features, MWP phase detectors are primarily categorized into Sagnac loop type and dual-output Mach-Zehnder modulator (DO-MZM) type.
Figure 6 illustrates the typical structure of a Sagnac loop MWP phase detector [17,18,19,20,21,22]. The system uses an ultra-short pulse laser with a repetition frequency fR as the light source, and the frequency of the microwave SUT is set to NfR (where N is an integer), with its phase fluctuations denoted as φ(t). This phase detector consists of a circulator, a 50:50 coupler, a Sagnac loop, and a balanced photodetector (as shown in the shaded area of Figure 6). After entering the coupler via the circulator, the optical pulses split into two paths and enter the Sagnac loop. This loop is composed of a phase modulator and a π/2 phase shifter. Two optical pulses propagate within the Sagnac loop in opposite directions: clockwise and counterclockwise. A π/2 phase shifter introduces a π/2 phase shift to one of the optical paths. Additionally, due to the traveling-wave characteristics of the phase modulator, only the forward-propagating optical pulse is modulated by the drive signal, while the backward-propagating pulse remains unmodulated. When applying the SUT as the drive signal to the phase modulator, a phase difference proportional to the microwave signal is introduced between the forward and backward propagating pulses. Specifically, when the zero-crossing point of the microwave signal aligns with the optical pulses, this phase difference becomes approximately proportional to the phase fluctuations φ(t), expressed as (t) (where k is a constant). The cooperative action of the phase modulator and the phase shifter causes the two paths to generate a composite phase difference of Ψ(t) = (t) + π/2. After circulating through the loop, the two optical beams interfere at the coupler, and their optical powers satisfy:
P 1 t cos 2 Ψ t 2 , P 2 t sin 2 Ψ t 2
The balanced photodetector measures the power difference ΔP(t) ∝ cosΨ(t). Under small phase jitter conditions, ΔP(t) ≈ (t), indicating a linear relationship between the output signal and phase fluctuations. By calibrating the system to obtain the phase-to-voltage conversion coefficient, the phase noise of the tested source can be calculated using Equation (1).
As early as 2004, Jungwon Kim et alproposed a MWP phase detector based on an optical fiber Sagnac loop. Experimental results demonstrated that, compared to the phase detector based on a spatial light Sagnac loop, the one based on an optical fiber Sagnac loop achieved a lower noise floor. In 2013, to mitigate the impact of optical pulse amplitude noise on phase detection, the National Physical Laboratory in the UK introduced two adjustable optical attenuators before the balanced photodetector to regulate the power of the two optical pulse signals entering the balanced photodetector, ensuring balanced optical power [20]. However, all these configurations required a π/2 phase shifter to introduce a π/2 phase difference between the forward and reverse propagating optical pulses in the Sagnac loop, thus biasing the phase detector at the linear point. The π/2 phase shifter is temperature-sensitive, leading to reduced stability of the phase detector. To address this issue, Jungwon Kim et al. proposed a balanced MWP phase detector based on the Sagnac loop, which eliminates the need for a π/2 phase shifter by using a low-frequency signal of fR/2 extracted from ultra-short pulse lasers to regulate the operating point [21,22].
Although the balanced Sagnac-loop-based detector offers improved stability, it requires precise positioning of the phase modulator within the loop. The modulator’s position and loop length are dependent on the optical pulse repetition rate, increasing system complexity and tuning difficulty. To overcome these limitations, T. R. Schibli et al. developed a MWP phase detector using DO-MZM [23], as shown in Figure 7. The DO-MZM operates at quadrature bias, where its dual output powers exhibit complementary linear relationships with applied microwave signal amplitude. Through balanced detection, this configuration produces a quasi-linear phase detection characteristic: zero output voltage occurs when microwave signal zero-crossings align perfectly with optical pulses, while phase fluctuations generate proportional voltage outputs. By calibrating the characteristic curve’s slope, phase noise can be quantified. To further enhance sensitivity, Schibli’s team implemented dual-channel cross-correlation, achieving −167 dBc/Hz @ 10 kHz phase noise measurement sensitivity. Compared to Sagnac-loop-based detectors, the DO-MZM configuration offers structural simplicity and eliminates complex tuning requirements, though its stability remains susceptible to DO-MZM bias point drift.
The MWP phase noise measurement methods utilizing ultra-short optical pulse references exhibits exceptionally high sensitivity. However, this approach still faces two primary technical challenges: first, the measurable signal frequency must strictly maintain an integer–multiple relationship with the optical pulse repetition rate; second, the system requires a complex synchronization calibration mechanism to achieve precise matching between optical pulses and the zero-crossing points of the measured signal. To address these limitations, Jingzhan Shi et al. propose an under-sampling phase detection-based PNA [24], shown as Figure 8. This system employs low-jitter, low-repetition-rate pulse sequences as sampling clocks to under-sample the microwave SUT, then applies a phase detection algorithm to extract time-varying phase information from the sampled data. The core concept of the under-sampling phase detection algorithm involves transforming the complex microwave signal phase estimation problem into in-phase and quadrature (I/Q) component estimation. The least squares method is subsequently applied to estimate these components from the sampled data. This under-sampling approach eliminates the requirement for the measured signal frequency to be an integer multiple of the sampling pulse repetition rate, while also removing the need for precise alignment between sampling pulses and signal zero-crossing points. These advancements expand the measurement bandwidth and simplify system architecture. Furthermore, Jingzhan Shi et al. implement a MWP under-sampling phase detection system using ultra-short optical pulses. By leveraging their ultra-low timing jitter characteristics, the system achieves enhanced sampling precision to improve phase noise measurement sensitivity. Simultaneously, the inherent broadband capabilities of MWP sampling systems enable significant expansion of phase noise measurement bandwidth.

3.2. MWP PNA with OEO

The OEO is a microwave oscillator that utilizes optical fiber as its energy storage component. Generally, the longer the optical fiber, the lower the phase noise of the generated microwave signal [25]. OEOs with ultra-low phase noise characteristics can serve as reference signal sources in phase detection methods, thereby enhancing the sensitivity of phase noise measurements. Zhangyuan Chen et al. proposed a high-sensitivity PNA based on an OEO and a direct digital synthesizer (DDS) [26], with a schematic diagram shown in Figure 9. In this system, the 10 GHz microwave signal generated by the OEO exhibits a phase noise of −140 dBc/Hz @ 10 kHz. By adjusting the DDS output frequency and mixing it with the OEO’s 10 GHz signal, the reference source frequency becomes tunable between 9–11 GHz. Consequently, this PNA achieves a measurement bandwidth of 9–11 GHz with a sensitivity of −140 dBc/Hz @ 10 kHz. While the OEO-based MWP phase detection method enables high measurement sensitivity, the limited tunability of the OEO’s resonant frequency restricts the phase noise measurement bandwidth.

4. MWP Frequency-Discrimination-Based PNAs

MWP frequency-discrimination-based PNAs can be categorized into two distinct classes based on their implementation methodologies. The first class involves photonic-substitution-type PNA, where conventional microwave components in the frequency discriminator are systematically replaced with functionally equivalent MWP modules. This architectural substitution primarily aims to enhance both measurement sensitivity and operational bandwidth [8]. The second class constitutes the MWP quadrature-frequency-discrimination-based PNA, which innovatively integrates digital signal processing (DSP) techniques with MWP components. This hybrid approach provides dual advantages: (1) the inherent flexibility of DSP significantly simplifies calibration procedure; (2) photonic-assisted signal conditioning enables simultaneous enhancement of measurement sensitivity and bandwidth.

4.1. Photonic-Substitution-Type PNAs

In the frequency discrimination methodology, the delay line length critically determines the system’s sensitivity. However, it is noteworthy that sensitivity at different frequency offsets follow distinct patterns in relation to the delay length. Let H(fm, τ) = 10 lg[sin2(πfmτ)]. According to Equation (3), the larger H(fm, τ) is, the better the sensitivity is. Obviously, the magnitude of H(fm, τ) is jointly affected by the delay τ and the frequency offset fm. In order to analyze the influence of the delay τ on the measurement sensitivity at different frequency offsets, the contour plot of H(fm, τ) as shown in Figure 10a is drawn. The abscissa of the contour plot is the frequency offset fm, ranging from 100 Hz to 100 kHz, and the ordinate is the delay τ, ranging from 1 μs to 100 μs. It can be seen that the influence law of the phase noise measurement sensitivity by the delay τ is different at different frequency offsets:
Indicated by Figure 10b, with fixed delay τ, when frequency offset fm ≤ 1/2τ, measurement sensitivity improves as fm increases. Within the fm ≤ 1/2τ range, phase noise measurement sensitivity enhances with longer τ. As shown in Figure 10c, for a specific fm, when τ ≤ 1/2 fm, larger τ yields higher sensitivity at that fm. Notably, measurement sensitivity degrades near fm = k/τ (k = 0,1,2,...), particularly in low-frequency regions (e.g., near 0 Hz). Optimal τ selection depends on target frequency range: for upper frequency bound fmu, one must ensure τ ≤ 1/fmu. For specific fm0, optimal τ = 1/2 fm0 makes sensitivity at fm0 best.
The analytical results demonstrate that enhancing the low-frequency-offset sensitivity in frequency-discrimination-based PNA systems necessitates extended delay lines. For instance, achieving optimal phase noise measurement sensitivity at 10 kHz frequency offset requires a delay duration of 50 μs. However, the implementation of extended microwave transmission lines is inherently constrained by their limited bandwidth, where increased length inevitably induces greater signal attenuation. To address these dual challenges of bandwidth limitation and excessive attenuation in conventional microwave delay systems, E. Rubiola et al. proposed an innovative substitution of coaxial cables with optical fibers for delay generation [27]. Compared with traditional metallic transmission lines, fiber-optic solutions exhibit threefold advantages: broader operational bandwidth (>100 GHz), lower transmission loss (<0.2 dB/km), and significantly reduced mass density. Figure 11 illustrates the microwave PNA architecture employing fiber-optic delay lines. Experimental characterization reveals that with a 2 km fiber delay line configuration, the system achieves remarkable sensitivity of −135 dBc/Hz @ 10 kHz for a 10-GHz carrier, surpassing conventional coaxial implementations by larger than 20 dB.
Using optical fiber delay instead of electrical delay can significantly improve the sensitivity of the frequency discrimination method in phase noise measurement. However, since the phase noise measurement sensitivity of the frequency discrimination method drops sharply at frequency offset fm = 1/τ, the measurable frequency offset range will decrease as the delay τ increases. To solve this problem, B. Onillon et al. proposed a frequency-discrimination-based PNA based on variable delay. The core idea of this method is as follows: when measuring the phase noise at high frequency offsets, a shorter delay is used; when measuring the phase noise at low-frequency offsets, it is switched to a longer delay. This method effectively balances the requirements of measurement sensitivity and the measurable frequency offset range [28].
The introduction of optical fiber delay lines has successfully broken through the limitations of electrical delay lines in terms of sensitivity, while also broadening the phase noise measurement bandwidth to a certain extent. However, the PNAs based on optical fiber delay lines are still limited by other electrical components such as phase shifters and phase detectors. Shilong Pan et al. proposed a PNA based on MWP phase shifter [29,30], aiming to break through the limitations of electrical phase shifter on the phase noise measurement bandwidth. However, the above-mentioned system has limitations when measuring signal sources with a carrier frequency lower than 5 GHz. This is because when the frequency of the SUT is low, the limited roll-off factor of the optical bandpass filter makes it impossible to effectively filter out one of the first-order sidebands while selecting the optical carrier. To address this issue, Ninghua Zhu et al. proposed using up-conversion technology to transform low-frequency signals to higher frequencies [31]. The up-conversion scheme employs a MWP phase shifter based on a Dual-drive Mach-Zehnder modulator (DMZM). By adjusting the DC bias voltage of the DMZM, continuous phase adjustment can be achieved.
A phase detector is generally composed of a mixer and a low-pass filter, where the electrical mixer is the main limiting factor for the working bandwidth of the phase detector. To break through the limitation of electrical mixers on the phase noise measurement bandwidth, Shilong Pan et al. proposed a PNA based on MWP mixing [32]. In this system, the mixer is realized based on a cascaded phase modulator and MZM, enabling the system to achieve a measurement bandwidth of 5–40 GHz. To simultaneously address the limitations of electrical phase shifters and electrical mixers on the measurement bandwidth of the frequency discrimination method, Fangzheng Zhang et al. also proposed a PNA based on all-optical technology [33]. Pei Zhou et al. proposed a microwave PNA based on photonic delay-matched frequency translation [34]. By using a MWP mixer and a local oscillator signal, the SUT is down-converted to a lower intermediate frequency signal, which effectively breaks through the limitation of electrical devices on the working bandwidth and expands the PNA’s operating bandwidth. Additionally, by matching the time delays of the two down-conversion branches, the residual phase noise introduced by the local oscillator signal can be effectively suppressed, allowing high measurement sensitivity to be obtained without the need for a high-performance reference source.
To further enhance the sensitivity of microwave phase noise measurement, P. Salzenstein et al. constructed a dual-channel cross-correlation PNA based on the fiber-delay-based frequency discriminator [35,36,37,38]. The sensitivity achievable by the dual-channel cross-correlation PNA is related to the number of cross-correlation times. The more cross-correlation times, the higher the sensitivity, but the measurement time also increases accordingly. When the fiber length is 2 km, the carrier frequency is 10 GHz, and 200 cross-correlations are performed, the noise floor of the system at a frequency offset of 10 kHz is −160 dBc/Hz, and the measurement time is 20 min. When 500 cross-correlations are performed, the noise floor at a 10 kHz frequency offset is −165 dBc/Hz, with a measurement time of 45 min.
To improve the phase noise measurement sensitivity without increasing the measurement time, N. Kuse et al. from IMRA America proposed a phase noise measurement method based on an optical frequency comb [39], of which the principle schematic is shown in Figure 12. When the microwave SUT modulates the optical carrier to generate an optical frequency comb, the phase jitter of the nth-order comb is the phase jitter of the optical carrier plus n times the phase jitter of the microwave SUT. The frequency discrimination method is used for the nth-order comb and the -nth-order comb, respectively, to detect the phase difference before and after delay. Then, the phase difference of the nth-order comb before and after delay is subtracted by that of the -nth-order comb before and after delay, so as to remove the phase jitter of the optical carrier and amplify the phase jitter of the microwave SUT by 2n times. Correspondingly, the phase noise measurement sensitivity of the system is improved by (2n)2 times.

4.2. MWP Quadrature-Frequency-Discrimination-Based PNAs

In a frequency-discriminator-based PNA, the phase detector is typically comprised of a mixer, a phase shifter, and a low-pass filter. This configuration introduces several challenges:
Complexity in calibrating the phase-to-voltage conversion coefficient: The phase-to-voltage conversion coefficient kpd of the phase detector is a critical parameter for phase noise measurement. However, its value is directly influenced by the amplitude of the microwave SUT and the conversion coefficient of the mixer. Given that the mixer’s conversion coefficient varies dynamically with the input signal frequency, kpd is affected by both the signal power and frequency. In practical measurements, the power and frequency of the SUT are often unknown and vary each time, necessitating recalibration of kpd before each phase noise measurement. This calibration process is cumbersome and significantly impacts measurement efficiency.
Interference from amplitude noise on measurement accuracy: The phase-to-voltage conversion coefficient kpd of the phase detector is not a constant but a time-varying random quantity that depends on the amplitude jitter of the SUT. However, in current measurement procedures, the calibrated kpd is generally treated as a constant. Consequently, fluctuations in kpd caused by amplitude noise directly introduce measurement errors.
Increased system complexity and error in low-frequency phase noise measurement: To ensure the phase detector operates within its linear region, a phase shifter and feedback loop must be employed to achieve orthogonal bias, thereby increasing the complexity of the system hardware. It is evident that phase jitter is one of the factors affecting the orthogonality of the two signals. When the feedback loop bandwidth covers a specific frequency range, phase jitter at lower frequencies is suppressed by the feedback mechanism, leading to an inability to accurately capture phase noise in this frequency band.
To address the issues caused by the phase detectors, Jingzhan Shi et al. proposed a novel phase noise measurement method—the quadrature frequency discrimination method [40,41]. This method realizes the phase detection function by introducing I/Q mixing and digital signal processing technology, which can effectively avoid the many defects caused by the phase detector in the traditional frequency discrimination method.
The principle of the quadrature frequency discrimination method is shown in Figure 13. Specifically, the microwave SUT is divided into two paths by a power divider: one path is delayed by τ, and then jointly input into the I/Q mixer with the output of the other path of the power divider. After low-pass filtering processing of the output of the I/Q mixer, two orthogonal zero-intermediate frequency signals can be obtained, which are denoted as vI(t) and vQ(t), respectively. Subsequently, an analog-to-digital converter (ADC) is used to collect vI(t) and vQ(t) and convert them into digital signals for subsequent digital signal processing. The phase of the zero-intermediate frequency signals φ(t) − φ(tτ) + 2πfcτ (set as ψ(t)) can be obtained through
ψ t = arctan v Q t v I t
Considering that ψ(t) is composed of two terms, φ(t) − φ(tτ) and 2πfcτ, and both fc and τ are constants, the PSD of ψ(t) at non-zero frequencies is identical to that of φ(t) − φ(tτ). According to Equation (3), the phase noise of the microwave SUT can be obtained through the following digital processing:
L f m = φ t φ t τ PSD 8   sin 2 π f m τ = S ψ f m 8   sin 2 π f m τ ,    f m 0
where Sψ(fm) represents the PSD of ψ(t).
In summary, the quadrature frequency discrimination method does not require consideration of the phase-voltage conversion coefficient kpd of the phase detector, thus eliminating the disadvantages of complex calibration and susceptibility to amplitude noise in the traditional frequency discrimination method. Additionally, the quadrature frequency discrimination method does not need a phase shifter or feedback loop to adjust the operating point of the phase detector, thereby overcoming the drawbacks of complex structure caused by the phase shifter and feedback loop in the frequency discrimination method, as well as the impact on phase noise measurement at low-frequency offsets.
It should be noted that for the quadrature frequency discrimination method, I/Q mixing imbalance will affect the accuracy of phase noise measurement. Therefore, it is necessary to compensate for the I/Q mixing imbalance, and the compensation formula can be expressed as
ψ t = arcsin v Q t k A v I t sin Δ ψ k A cos Δ ψ
It can be seen from Equation (8) that the compensation for I/Q mixing imbalance depends on a precondition: the I/Q mixing amplitude imbalance (kA) and phase imbalance (Δψ) are known. Therefore, in order to accurately compensate for the I/Q mixing imbalance, it is necessary to accurately measure the imbalance of I/Q mixing. Jingzhan Shi et al. proposed an I/Q mixing imbalance measurement method based on adjustable delay. If the delay is changed at a uniform speed vτ, that is, the delay τ = τ0 + vτt, where τ0 is the fixed delay provided by the delay line and satisfies τ0vτt, the trajectory curves of vI(t) and vQ(t) shown in Figure 14 can be obtained. Both curves of vI(t) and vQ(t) are trigonometric functions with the same period T = 1/2πfcvτ, and their amplitudes are A and kAA, respectively. The phase difference between the two curves is π/2 − Δψ. Then, the I/Q mixing amplitude imbalance kA and phase imbalance Δψ can be derived through the following equation:
k A = k A A A = Amp v Q t Amp v I t = Max T v Q t Max T v I t Δ ψ = π 2 2 π Δ t T
where Amp(y(t)) represents the amplitude of the function y(t), and MaxT(y(t)) represents the maximum value of the function y(t) within one period T. For the trigonometric function y(t), Amp(y(t)) = MaxT(y(t)). Δt is the minimum interval between the moments when vI(t) and vQ(t) reach their maximum values, as shown in Figure 14.
As the core component of the quadrature-frequency-discrimination-based PNA, the I/Q mixer is a key factor restricting the measurement bandwidth. In view of this, Zhang Fangzheng et al. proposed a PNA based on optical polarization multiplexing I/Q mixing [42], of which the system structure is shown in Figure 15. This system was experimentally demonstrated with a phase noise measurement bandwidth of 5–35 GHz. To eliminate the dc (direct-current) interference introduced in the MWP I/Q mixing process, they proposed a 180° bridge replacement method to measure dc interference and achieved the removal of dc interference in the digital domain.
To break through the limitation of the 90° coupler on the phase noise measurement bandwidth in the quadrature-frequency-discrimination-based PNA based on optical polarization multiplexing I/Q mixing, Shi Jingzhan et al. proposed a PNA based on all-optical I/Q mixing as shown in Figure 16 [43]. This system extends the phase noise measurement bandwidth to 5–50 GHz. Meanwhile, to solve the problems of dc interference and I/Q mixing imbalance simultaneously, they proposed a synchronous measurement method for dc interference and I/Q mixing imbalance based on adjustable delay, and removed dc interference and I/Q mixing imbalance in the digital domain. Compared with the 180° bridge replacement method, the significant advantage of this method is that it does not require reconstructing the phase noise measurement system and can realize the measurement of dc interference and I/Q mixing imbalance simultaneously.
To increase the phase noise measurement bandwidth while improving the phase noise measurement sensitivity, Fangzheng Zhang et al. further proposed a PNA based on optoelectronic balanced detection I/Q mixing [44], as shown in Figure 17. The system is based on the multiplication mechanism of the optical frequency comb for microwave phase noise, which improves the phase noise measurement sensitivity to −146.1 dBc/Hz at a frequency offset of 10 kHz. At the same time, to solve the problem of slow measurement speed caused by the above two dc interference removal methods, they proposed the optoelectronic balanced detection method. Different from the previous two methods that require measuring dc interference first and then removing it in the digital domain, this method directly removes dc interference through optoelectronic balanced detection in the analog domain, which greatly improves the measurement speed.

5. Conclusions

In summary, we have systematically reviewed the latest research advancements in microwave photonic phase noise analyzers (MWP PNAs). Two typical MWP phase noise measurement approaches were highlighted: MWP phase detection and MWP frequency discrimination. Table 1 provides a summary of the advantages and limitations of each MWP PNA type, as well as the sensitivity and bandwidth reported in representative studies. Studies have shown that these two approaches can significantly enhance the core performance of microwave signal PNA—not only greatly improving measurement sensitivity but also effectively expanding the measurement bandwidth, providing innovative solutions for high-precision microwave signal analysis.
The current phase noise measurement technology still has several key issues that urgently need to carry out exploration in follow-up research:
(1)
Phase noise measurement for complex microwave signals
With the iterative upgrading of electronic information technology, the signal forms adopted by microwave systems such as radar, communication, and electronic warfare show a diversified development trend, typically including linear frequency modulation signals, pulse modulation signals, frequency hopping sequence signals, etc. At the same time, the signal generation capability of modern microwave signal sources has broken through the limitation of single-frequency continuous waves, and can generate more complex waveform combinations. In order to adapt to the development trend of diversified signal forms in microwave source testing, it is urgent to expand the adaptability of phase noise measurement technology to complex signals and achieve precise characterization of phase noise for multiple types of signals [45,46,47].
(2)
Instantaneous phase noise measurement
As a core characteristic parameter of electromagnetic signals, high-precision measurement of phase noise has key application value in fields such as electromagnetic equipment identification and spectrum monitoring [48,49]. However, in complex electromagnetic environments, signals often exhibit burst transient characteristics with extremely short durations (such as nanosecond-level pulse signals), and traditional measurement methods are difficult to capture their instantaneous phase fluctuation characteristics. Therefore, the research on instantaneous phase noise measurement technology is of great practical significance for feature extraction of transient electromagnetic signals and equipment traceability, and related technologies have broad application prospects in scenarios such as radar countermeasures and communication reconnaissance.

Author Contributions

Writing—original draft preparation, J.S.; writing—review and editing, Y.W.; visualization, B.T.; All authors have read and agreed to the published version of the manuscript.

Funding

This research was funded by the National Natural Science Foundation of China, grant number 62101269; the Young Elite Scientists Sponsorship Program by CAST, grant number 2022QNRC001; and the Key Laboratory of Radar Imaging and Microwave Photonics (Nanjing University of Aeronautics and Astronautics), Ministry of Education, grant number NJ20210007.

Conflicts of Interest

The authors declare no conflicts of interest.

Abbreviations

The following abbreviations are used in this manuscript.
PNAPhase noise analyzer
MWPMicrowave photonic
PSDPower spectral density
SUTSignal under test
MZMMach-Zehnder modulator
DOMZMDual-output Mach-Zehnder modulator
OEOOptoelectronic oscillator
ADCAnalog-to-digital converter
I/QIn-phase and quadrature
DDSDirect digital synthesizer
DSPDigital signal processing
DMZMDual-drive Mach-Zehnder modulator

References

  1. Rubiola, E.; Vernotte, F. The companion of Enrico’s chart for phase noise and two-sample variances. IEEE Trans. Microw. Theory Tech. 2023, 71, 2996–3025. [Google Scholar] [CrossRef]
  2. Leeson, D.B. Oscillator phase noise: A 50-year review. IEEE Trans. Ultrason. Ferroelectr. Freq. Control 2016, 63, 1208–1225. [Google Scholar] [CrossRef] [PubMed]
  3. IEEE Std 2414™-2020; IEEE Standard for Jitter and Phase Noise. IEEE Instrumentation & Measurement Society: New York, NY, USA, 2020; pp. 1–42.
  4. Ayhan, S.; Scherr, S.; Bhutani, A.; Fischbach, B.; Pauli, M.; Zwick, T. Impact of frequency ramp nonlinearity, phase noise, and SNR on FMCW radar accuracy. IEEE Trans. Microw. Theory Tech. 2016, 64, 3290–3301. [Google Scholar] [CrossRef]
  5. Rebeyrol, E.; Macabiau, C.; Ries, L.; Issler, J.-L.; Bousquet, M.; Boucheret, M.-L. Phase noise in GNSS transmission/reception system. In Proceedings of the 2006 National Technical Meeting of the Institute of Navigation, Monterey, CA, USA, 18–20 January 2006; pp. 698–708. [Google Scholar]
  6. Mathecken, P.; Riihonen, T.; Werner, S.; Wichman, R. Performance analysis of OFDM with Wiener phase noise and frequency selective fading channel. IEEE Trans. Commun. 2011, 59, 1321–1331. [Google Scholar] [CrossRef]
  7. Maleki, L. The optoelectronic oscillator. Nat. Photonics 2011, 5, 728–730. [Google Scholar] [CrossRef]
  8. Pan, S.; Yao, J. Photonics-based broadband microwave measurement. J. Light. Technol. 2016, 35, 3498–3513. [Google Scholar] [CrossRef]
  9. Zou, X.; Lu, B.; Pan, W.; Yan, L.; Stöhr, A.; Yao, J. Photonics for microwave measurements. Laser Photonics Rev. 2016, 10, 711–734. [Google Scholar] [CrossRef]
  10. Yao, J. Microwave photonics. J. Light. Technol. 2009, 27, 314–335. [Google Scholar] [CrossRef]
  11. Seeds, A.J.; Williams, K.J. Microwave photonics. J. Light. Technol. 2006, 24, 4628–4641. [Google Scholar] [CrossRef]
  12. Rohde, U.L.; Poddar, A.K.; Apte, A.M. Getting its measure: Oscillator phase noise measurement techniques and limitations. IEEE Microw. Mag. 2013, 14, 73–86. [Google Scholar] [CrossRef]
  13. Lance, A.L.; Seal, W.D.; Labaar, F. Phase noise and AM noise measurements in the frequency domain. Infrared Millim. Waves 1984, 11, 239–289. [Google Scholar]
  14. Kim, J.; Kaertner, F.X. Attosecond-precision ultrafast photonics. Laser Photonics Rev. 2010, 4, 432–456. [Google Scholar] [CrossRef]
  15. Kim, J.; Cox, J.A.; Chen, J.; Kärtner, F.X. Drift-free femtosecond timing synchronization of remote optical and microwave sources. Nat. Photonics 2008, 2, 733–736. [Google Scholar] [CrossRef]
  16. Kim, J.; Song, Y. Ultralow-noise mode-locked fiber lasers and frequency combs: Principles, status, and applications. Adv. Opt. Photonics 2016, 8, 465–540. [Google Scholar] [CrossRef]
  17. Jung, K.; Kim, J. Subfemtosecond synchronization of microwave oscillators with mode-locked Er-fiber lasers. Opt. Lett. 2012, 37, 2958–2960. [Google Scholar] [CrossRef]
  18. Jung, K.; Shin, J.; Kim, J. Ultralow phase noise microwave generation from mode-locked Er-fiber lasers with subfemtosecond integrated timing jitter. IEEE Photonics J. 2013, 5, 5500906. [Google Scholar] [CrossRef]
  19. Kim, J.; Kärtner, F.X.; Perrott, M.H. Femtosecond synchronization of radio frequency signals with optical pulse trains. Opt. Lett. 2004, 29, 2076–2078. [Google Scholar] [CrossRef]
  20. Lessing, M.; Margolis, H.S.; Brown, C.T.A.; Gill, P.; Marra, G. Suppression of amplitude-to-phase noise conversion in balanced optical-microwave phase detectors. Opt. Express 2013, 21, 27057–27062. [Google Scholar] [CrossRef]
  21. Kim, J.; Kärtner, F.X.; Ludwig, F. Balanced optical–microwave phase detectors for optoelectronic phase-locked loops. Opt. Lett. 2006, 31, 3659–3661. [Google Scholar] [CrossRef]
  22. Peng, M.Y.; Kalaydzhyan, A.; Kärtner, F.X. Balanced optical-microwave phase detector for sub-femtosecond optical-RF synchronization. Opt. Express 2014, 22, 27102–27111. [Google Scholar] [CrossRef]
  23. Endo, M.; Shoji, T.D.; Schibli, T.R. High-sensitivity optical to microwave comparison with dual-output Mach-Zehnder modulators. Sci. Rep. 2018, 8, 4388. [Google Scholar] [CrossRef] [PubMed]
  24. Shi, J.; Hua, S.; Ge, J.; Zhu, D.; Zhang, F.; Wang, Y. RF Phase Noise Analyzer Based on Phase Estimation Algorithm With Undersampling Samples. IEEE Trans. Microw. Theory Tech. 2023, 72, 1118–1125. [Google Scholar] [CrossRef]
  25. Maleki, L. The opto-electronic oscillator (OEO): Review and recent progress. In Proceedings of the 2012 European Frequency and Time Forum, Gothenburg, Sweden, 23–27 April 2012; pp. 497–500. [Google Scholar]
  26. Peng, H.; Xu, Y.; Guo, R.; Du, H.; Chen, J.; Chen, Z. High sensitivity microwave phase noise analyzer based on a phase locked optoelectronic oscillator. Opt. Express 2019, 27, 18910–18927. [Google Scholar] [CrossRef]
  27. Rubiola, E.; Salik, E.; Huang, S.; Yu, N.; Maleki, L. Photonic-delay technique for phase-noise measurement of microwave oscillators. J. Opt. Soc. Am. B 2005, 22, 987–997. [Google Scholar] [CrossRef]
  28. Onillon, B.; Constant, S.; Liopis, O. Optical links for ultra low phase noise microwave oscillators measurement. In Proceedings of the 2005 IEEE International Frequency Control Symposium and Exposition, Vancouver, BC, Canada, 29–31 August 2005; 6p. [Google Scholar]
  29. Zhu, D.; Zhang, F.; Zhou, P.; Zhu, D.; Pan, S. Wideband phase noise measurement using a multifunctional microwave photonic processor. IEEE Photonics Technol. Lett. 2014, 26, 2434–2437. [Google Scholar] [CrossRef]
  30. Pan, S.; Zhang, Y. Tunable and wideband microwave photonic phase shifter based on a single-sideband polarization modulator and a polarizer. Opt. Lett. 2012, 37, 4483–4485. [Google Scholar] [CrossRef]
  31. Wang, W.; Liu, J.G.; Mei, H.; Sun, W.; Zhu, N. Photonic-assisted wideband phase noise analyzer based on optoelectronic hybrid units. J. Light. Technol. 2016, 34, 3425–3431. [Google Scholar] [CrossRef]
  32. Zhu, D.; Zhang, F.; Zhou, P.; Pan, S. Phase noise measurement of wideband microwave sources based on a microwave photonic frequency down-converter. Opt. Lett. 2015, 40, 1326–1329. [Google Scholar] [CrossRef]
  33. Zhang, F.; Zhu, D.; Pan, S. Photonic-assisted wideband phase noise measurement of microwave signal sources. Electron. Lett. 2015, 51, 1272–1274. [Google Scholar] [CrossRef]
  34. Zhou, P.; Jiang, Z.; Tang, Z.; Li, N.; Pan, S. Microwave phase noise analyzer based on photonic delay-matched frequency translation. IEEE Trans. Microw. Theory Tech. 2024, 72, 5498–5506. [Google Scholar] [CrossRef]
  35. Salik, E.; Yu, N.; Maleki, L.; Rubiola, E. Dual photonic-delay line cross correlation method for phase noise measurement. In Proceedings of the 2004 IEEE International Frequency Control Symposium and Exposition, Montreal, QC, Canada, 23–27 August 2004; pp. 303–306. [Google Scholar]
  36. Eliyahu, D.; Seidel, D.; Maleki, L. Phase noise of a high performance OEO and an ultra low noise floor cross-correlation microwave photonic homodyne system. In Proceedings of the 2008 IEEE International Frequency Control Symposium, Honolulu, HI, USA, 19–21 May 2008; pp. 811–814. [Google Scholar]
  37. Fan, Z.; Qiu, Q.; Su, J.; Zhang, T.; Yang, N. Photonic-delay line cross correlation method based on DWDM for phase noise measurement. IEEE Photonics J. 2018, 10, 1–9. [Google Scholar] [CrossRef]
  38. Fan, Z.; Qiu, Q.; Su, J.; Zhang, T.; Lin, Y. Phase noise measurement of an optoelectronic oscillator based on the photonic-delay line cross-correlation method. Opt. Lett. 2019, 44, 1992–1995. [Google Scholar] [CrossRef]
  39. Kuse, N.; Fermann, M. Electro-optic comb based real time ultra-high sensitivity phase noise measurement system for high frequency microwaves. Sci. Rep. 2017, 7, 2847. [Google Scholar] [CrossRef]
  40. Shi, J.; Zhang, F.; Pan, S. High-sensitivity phase noise measurement of RF sources by photonic-delay line and digital phase demodulation. In Proceedings of the 2017 16th International Conference on Optical Communications and Networks (ICOCN), Wuzhen, China, 7–10 August 2017; pp. 1–3. [Google Scholar]
  41. Shi, J.; Zhang, F.; Pan, S. Phase noise measurement of RF signals by photonic time delay and digital phase demodulation. IEEE Trans. Microw. Theory Tech. 2018, 66, 4306–4315. [Google Scholar] [CrossRef]
  42. Zhang, F.; Shi, J.; Pan, S. Wideband microwave phase noise measurement based on photonic-assisted I/Q mixing and digital phase demodulation. Opt. Express 2017, 25, 22760–22768. [Google Scholar] [CrossRef] [PubMed]
  43. Shi, J.; Zhang, F.; Ben, D.; Pan, S. Wideband microwave phase noise analyzer based on an all-optical microwave I/Q mixer. J. Light. Technol. 2018, 36, 4319–4325. [Google Scholar] [CrossRef]
  44. Zhang, F.; Shi, J.; Zhang, Y.; Ben, D.; Sun, L.; Pan, S. Self-calibrating and high-sensitivity microwave phase noise analyzer applying an optical frequency comb generator and an optical-hybrid-based I/Q detector. Opt. Lett. 2018, 43, 5029–5032. [Google Scholar] [CrossRef]
  45. Samarasekera, A.C.J.; Feger, R.; Bechter, J.; Stelzer, A. Phase noise measurements in chirped FMCW radar signals. In Proceedings of the 2020 IEEE MTT-S International Conference on Microwaves for Intelligent Mobility (ICMIM), Linz, Austria, 23 November 2020; pp. 1–4. [Google Scholar]
  46. Gerstmair, M.; Melzer, A.; Wagner, M.; Lang, O.; Huemer, M. Phase noise monitoring in cascaded systems for high-resolution automotive radar sensors. IEEE Trans. Microw. Theory Tech. 2021, 69, 5072–5085. [Google Scholar] [CrossRef]
  47. Birkenhauer, C.; Tschapek, P.; Vossiek, M. Over-the-Air Phase Noise Spectral Density Measurement for FMCW Radar Sensors. IEEE J. Microw. 2024, 4, 733–741. [Google Scholar] [CrossRef]
  48. Nouri, M.; Mivehchy, M.; Sabahi, M. Target recognition based on phase noise of received signal. Electron. Lett. 2017, 53, 808–810. [Google Scholar] [CrossRef]
  49. Shi, J.; Zhang, F.; Ben, D.; Pan, S. Photonic-assisted single system for microwave frequency and phase noise measurement. Chin. Opt. Lett. 2020, 18, 092501. [Google Scholar] [CrossRef]
Figure 1. Overall summary diagram of photonics-based microwave PNAs.
Photonics 12 00691 g001
Figure 2. Principle of direct spectrum method. SUT: Signal under test.
Photonics 12 00691 g002
Figure 3. Schematic diagram of phase detection method.
Photonics 12 00691 g003
Figure 4. Schematic diagram of frequency discrimination method.
Photonics 12 00691 g004
Figure 5. Schematic diagram of dual-channel cross-correlation method.
Photonics 12 00691 g005
Figure 6. MWP phase detector based on Sagnac loop.
Photonics 12 00691 g006
Figure 7. MWP phase detector based on DO-MZM. DO-MZM: Dual-output Mach–Zehnder modulator.
Photonics 12 00691 g007
Figure 8. PNA based on phase estimation algorithm with under-sampling samples. ADC: Analog-to-digital converter.
Photonics 12 00691 g008
Figure 9. MWP phase-detection-based PNA using OEO as reference. OEO: Optoelectronic oscillator, DDS: Direct digital synthesizer.
Photonics 12 00691 g009
Figure 10. Influence of delay length on the phase noise measurement sensitivity at different frequency offsets for frequency-discrimination-based PNA. (a) H(fm, τ); (b) H(fm, 2 μs), H(fm, 10 μs), H(fm, 50 μs); (c) H(1 kHz, τ), H(10 kHz, τ), H(50 kHz, τ).
Photonics 12 00691 g010
Figure 11. MWP frequency-discrimination-based PNA with photonic delay line. MZM: Mach-Zehnder modulator.
Photonics 12 00691 g011
Figure 12. MWP frequency-discrimination-based PNA based on optical frequency comb.
Photonics 12 00691 g012
Figure 13. Schematic diagram of quadrature frequency discrimination method. ADC: analog-to-digital converter, DSP: digital signal processing.
Photonics 12 00691 g013
Figure 14. Principle of I/Q mixing imbalance measurement with variable time delay.
Photonics 12 00691 g014
Figure 15. Structural diagram of the quadrature frequency discrimination PNA based on optical polarization multiplexing I/Q mixing. PM: Phase modulator, Dpol-MZM: Dual-polarization MZM.
Photonics 12 00691 g015
Figure 16. Structural diagram of quadrature frequency discrimination PNA based on all-optical I/Q mixing. PolM: Polarization modulator.
Photonics 12 00691 g016
Figure 17. Structural diagram of quadrature frequency discrimination PNA based on photoelectric balanced detection I/Q mixing.
Photonics 12 00691 g017
Table 1. Key performance summary of MWP PNAs: advantages, limitations, sensitivity, and bandwidth.
TypesAdvantagesLimitationsSensitivityBandwidth
MWP Phase-Detection-Based PNAsMWP PNA With Ultra-Short Pulse LasersUltra-high sensitivityMeasurement frequency limitation imposed by laser repetition rate−167 dBc/Hz @ 10 kHz @ 1 GHz [23] (with dual-channel cross-correlation)Integer multiples of 1 GHz [23]
MWP PNA With OEOHigh sensitivityBandwidth Limitation Caused by Poor Tunability of the OEO−140 dBc/Hz @ 10 kHz @ 10 GHz [26]9–11 GHz [26]
MWP Frequency-Discrimination-Based PNAsPhotonic-Substitution-Type PNAsWide bandwidthComplicated calibration;
Poor sensitivity at low-frequency offsets
−137 dBc/Hz @ 10 kHz @ 10 GHz [32]5–40 GHz [32]
MWP Quadrature-Frequency-Discrimination-Based PNAsSimplified calibration;
Wide bandwidth
Poor sensitivity at low-frequency offsets−136 dBc/Hz @ 10 kHz @ 10 GHz [43]5–50 GHz [43]
Disclaimer/Publisher’s Note: The statements, opinions and data contained in all publications are solely those of the individual author(s) and contributor(s) and not of MDPI and/or the editor(s). MDPI and/or the editor(s) disclaim responsibility for any injury to people or property resulting from any ideas, methods, instructions or products referred to in the content.

