Abstract
A vanadium dioxide (VO2)-based layered metastructure is proposed that enables dynamic optical encoding in the range of 15.5 GHz to 16 GHz through synergistic temperature and magnetic field modulation. By utilizing sequential temperature control, an optical date flip-flop (DFF) functionality can be achieved. The VO2 component of the metastructure exhibits an insulator-to-metal phase transition under thermal regulation, accompanied by significant changes in its optical properties. Furthermore, by optimizing the sequential temperature-control strategy, an optical DFF is successfully implemented whose output state can be dynamically controlled by the data input (D), timing control port (T), and state control port (B). A novel technical approach is provided for programmable photonic devices, dynamic optical information storage, and optical computing systems.
1. Introduction
Metastructures, as artificially designed periodic dielectric structures, can control light propagation through photonic band gap (PBG) [1] regulation, holding significant application value in integrated photonics and optical information processing [2]. One-dimensional layered metastructures have become an ideal platform for optical filtering, sensing, and modulation due to their simple structure and tunable optical properties [3]. The core characteristic of one-dimensional metastructures lies in their high reflectivity within the PBG, making them ideal optical coating materials [4]. By introducing defect layers or by adjusting the periodic configuration, localized states can be created within the PBG to achieve narrowband filtering or resonance enhancement [5]. Additionally, their optical response can be dynamically tuned by changing the material composition, layer thickness, or external stimuli, showing broad prospects for tunable optical devices [6]. However, the optical response of conventional one-dimensional metastructures is typically regulated only through static structures or single external fields; thus, there are still challenges in their dynamic reconfigurability and multifunctional integration [7].
In recent years, the synergistic regulation of plasmonic effects [8] and phase-change materials [9] has provided new approaches for expanding the dynamic functionalities of metastructures. Plasmons represent the collective oscillations of free electrons in metal nanostructures under optical excitation and exhibit remarkable localized field enhancement effects and unique electromagnetic response characteristics [10]. Particularly noteworthy is that the frequency of plasmon resonance can be precisely tuned through geometric parameters of the nanostructures and through external magnetic fields, offering possibilities for achieving rapid and efficient optical modulation [11,12].
Meanwhile, the introduction of phase-change materials has provided new approaches for the dynamic modulation of metastructures [13,14]. Vanadium dioxide (VO2) [15], as a typical strongly correlated electron material, undergoes an insulator-to-metal transition at approximately 68 °C [16], accompanied by significant changes in its optical properties [17]. This characteristic makes it promising for constructing actively tunable photonic devices. However, most existing studies focus on a single physical field modulation, making it difficult to achieve optical functional encoding through multi-degree-of-freedom coordination, thereby limiting its potential applications in programmable photonic devices and optical computing [17,18]. The combination of the plasmonic fast-response characteristics and the phase transition properties of VO2 may overcome current limitations in the response speed, modulation dimensionality, and functional integration of photonic devices [19,20].
Optical coding uses optical signals for information modulation and transmission and has developed rapidly in the fields of high-speed communication and optical computing [21]. The advancement of silicon photonics has promoted the realization of highly integrated optical coding devices [22,23,24]. For instance, schemes based on microring resonators and Mach–Zehnder modulators have been applied to optical interconnects in data centers [25]. However, this technology still faces challenges such as low opto-electrical conversion efficiency, multi-channel crosstalk, and complementary metal oxide semiconductor process compatibility, which restrict its large-scale application.
As the core timing unit of digital systems, the electronic date flip-flop (DFF) is continuously being optimized under advanced process nodes, with a focus on reducing power consumption and increasing the clock frequency [26]. Near-threshold voltage designs, adiabatic flip-flops, and other technologies have significantly reduced energy consumption, but problems such as clock deviation, high dynamic power consumption, and process sizes approaching the physical limit still exist [20]. These limitations have prompted researchers to explore new low-power architectures, such as asynchronous designs or in-memory computing integration solutions. Photonic DFF utilizes optical signals to achieve timing control and shows potential in ultra-high-speed optical computing [27]. Currently, it is mainly based on structures such as optical storage rings and microcavity resonators. Although femtosecond-level optical signal latching has been achieved in the laboratory, this technology still faces challenges such as high integration difficulty, high static power consumption, and insufficient accuracy of the optical clock synchronization [27]. Future research needs to break through key issues such as the efficiency of photoelectric interfaces, low-power optical storage technology and intelligent timing management to promote its practical application [28].
This study presents a composite modulation system based on the VO2 phase-change material and plasmonic metastructures, which achieves multifunctional optical encoding through synergistic temperature and magnetic field control. Specifically, (1) a VO2/plasmonic-hybrid layered metastructure unit was designed that enables dual-channel optical modulation by controlling the phase transition VO2 through thermal fields while altering plasmonic resonance characteristics via magnetic fields. (2) Furthermore, by introducing a timing temperature-control strategy and simulating the synergistic effect of the clock signal (CLK) and the data terminal (D), an optical DFF could be constructed, whose output state can be dynamically switched along with the input signal. This work not only expands the dynamic modulation dimensions of one-dimensional metastructures but also provides new technical solutions for programmable photonic devices, dynamic optical information storage, and optical computing systems.
2. Configuration and Methods
The arrangement of the hypersteric DFF (HDS) is shown in Figure 1. The medium a is SiO2 (na = 1.46 [23]), the medium p is plasma, and the medium v is VO2. Their thicknesses are da = 15 mm, dv = 1.5 mm, and dp = 6.5 μm, respectively. It can be seen that layer a of medium v is inserted into the arrangement structure of the periodic medium A and medium p to form a defect. The plasma concentration is ωp2 = 0.85 × 10¹⁸ m−3, the magnetic field magnitude is B, and the magnetic field direction is the +y direction. B will affect the performance of the plasma. The medium v is VO2, and the incident light is a TM wave (transverse magnetic waves are electromagnetic wave patterns in which the magnetic field is completely transverse and the electric field has a longitudinal component). The incident angle θ = 70°, and the temperature is T. Complex dielectric functions of VO2 thin films based on Lorentz–Drude dispersion can be extended to multiple oscillators [29]:
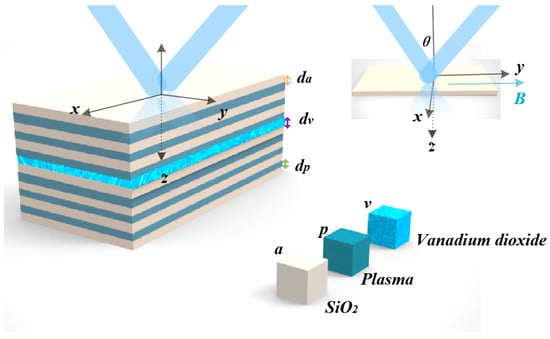
Figure 1.
The structure diagram of the HDS.
Among these parameters, εs is the static dielectric function at zero frequency, ε∞ is the high-frequency dielectric constant, Γ0 is the damping coefficient, ωt is the resonant frequency of the oscillator whose energy corresponds to the absorption peak, fj is the oscillator strength existing in multiple Lorentz oscillator expressions, and ωoj is the resonant (peak) energy of one oscillator in several sets of Lorentz oscillators. γj is the broadening parameter of the peak energy of each oscillator. The last term in Formula (1) uses the Drude model [30] because VO2 becomes a metal after phase transformation. ωp1 is the carrier density parameter and Γd is the collision frequency. The parameters of the complex dielectric function of VO2 films in the insulating state (T = 85 °C) and the metallic state (T = 30 °C) are shown in Table 1.

Table 1.
Lorentzian oscillators and Drude parameters of VO2 when T = 85 °C and T = 30 °C [29].
The relative plasma dielectric function is characterized by the following tensor form [31]:
The cyclotron frequency is , where the electron charge is C and the electron mass is kg. The plasma frequency is , where the plasma density is m−3, and F/m is the vacuum dielectric constant. The plasma collision frequency is [31].
Since TE waves are not regulated by the magnetic field, the relative dielectric constant of TM waves can be derived as follows [31,32]:
When the TM wave is incident in the +z direction, the single-layer transport matrices of media SiO2 and VO2 are [31,33]
where .
When the TM wave is incident in the +z direction, the transmission matrix for the plasma medium is [31]
Among these parameters, the component of the wave vector is and . Meanwhile, c represents the speed of light.
The total transport matrix of HDS is [33]
The reflection coefficient r and the reflectance R are expressed as [33]
3. Results
Using the aforementioned transfer matrix method with parameters B = 0.43 Tesla and T = 30 °C, Figure 2 was obtained, which shows the reflection rate variation in the HDS under a TM wave incidence at different VO2 states. At T = 30 °C, a reflection dip appears at 15.8 GHz, with a reflection rate of 0.12. At T = 85 °C, a reflection dip occurs at 15.8 GHz, with a reflection rate of 0.85. Different VO2 phases significantly affect the reflection rate. This property enables VO2 phase encoding: T = 30 °C is encoded as ‘0’, and T = 85 °C is encoded as ‘1’. Thus, the magnetic field can be adjusted at different temperatures to achieve the required performance for subsequent DFF operations.
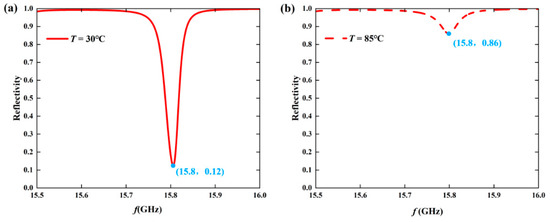
Figure 2.
(a) The reflectance spectrum in the insulating state (T = 30 °C) and (b) the reflectance spectrum in the metallic state (T = 85 °C) when the TM wave is incident at 70° on the HDS and B = 0.39 Tesla.
Figure 3a describes the reflectance, magnetic field, and frequency spectra at T = 30 °C. We find that three reflection valleys will gradually move toward the high-frequency point as the magnetic field increases, showing the periodic appearance of the reflection valleys. In the frequency band of 15.5–16.0 GHz, the reflectivity of the reflection valley closest to 0.3 Tesla is the lowest, and the change is not obvious. The reflection valley in the middle will undergo periodic changes, with small reflection valleys appearing in specific frequency bands and maintaining high reflectivity in other frequency bands. The reflection valley closest to 0.5 Tesla has the same variation pattern as the middle reflection valley, but the small reflection valleys that appear are larger.
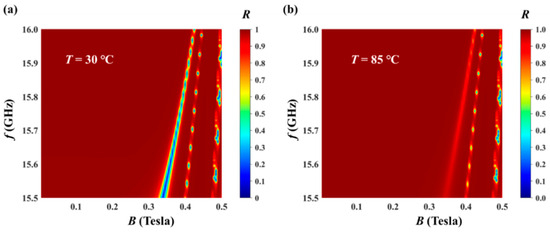
Figure 3.
The reflectance, magnetic field, and frequency spectra (a) in the insulating state (T = 30 °C) and (b) in the metallic state (T = 85 °C) when TM waves are incident on the HDS.
Figure 3b describes the reflectivity, magnetic field, and frequency spectra at T = 85 °C. We find that three reflection valleys will appear, but one of the reflection valleys is not obvious. The other two reflection valleys gradually move toward the high-frequency point as the magnetic field increases, showing the periodic appearance of the reflection valleys. Whether in the metallic state or the insulating state, within a certain magnetic field range in the frequency direction, as the frequency increases, the reflectivity changes significantly within certain frequency intervals. In the region of 15.5–15.6 GHz, the reflectivity is relatively low, and the change is relatively gentle. As the frequency increases to a certain extent, the reflectivity undergoes a sharp change, forming some high-reflectivity bands or regions. With regard to the direction of the magnetic field, when the frequency is fixed, the reflectivity will also change as the magnetic field increases. At some frequencies (such as 15.9 GHz, 15.6 GHz, etc.), the reflectance is relatively low when the magnetic field is small. As the magnetic field increases from 0.3 Tesla to 0.5 Tesla, the reflectance gradually increases, and peaks of reflectance appear at certain magnetic field values. However, at some other frequencies (such as 15.75 GHz, 15.5 GHz, etc.), the changing trend in the reflectance during the process of the magnetic field increase may be different. Some may first decrease and then increase.
To summarize the rules, within magnetic field values of 0.3 Tesla to 0.5 Tesla, as the frequency increases, the reflectance changes gently in the low-frequency part and undergoes a sharp change in the high-frequency part to form a high-reflectance band. When the frequency is fixed, the reflectance will change as the magnetic field increases, and the changing trend varies at different frequencies. Under different temperature states (insulating state and metallic state), the relationship among the reflectance, magnetic field, and frequency varies, and characteristics such as the position and width of the high reflectance area are different.
Figure 4 describes the influence of dv on the reflection valley in the frequency band from 15.5 GHz to 16.0 GHz at T = 30 °C and T = 85 °C; we find that dv has basically no effect on the performance of the final reflection valley.
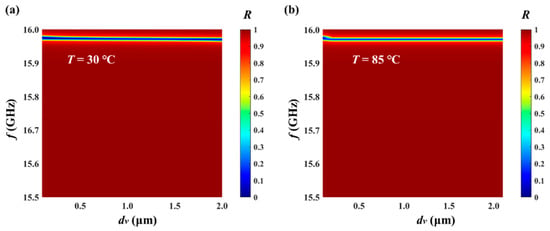
Figure 4.
The reflectance, dv, and frequency spectra (a) in the insulating state (T = 30 °C) and (b) in the metallic state (T = 85 °C) when TM waves are incident on the HDS.
Figure 5 describes the influence of di on the reflection valley in the frequency band from 15.5 GHz to 16.0 GHz at T = 30 °C and T = 85 °C. We find that as di continuously increases, the reflection valley continuously moves toward higher frequencies. Compared with T = 30 °C, the reflection valley at T = 85 °C will become more and more obvious as di continuously increases (the reflectivity of the reflection valley becomes lower and lower).
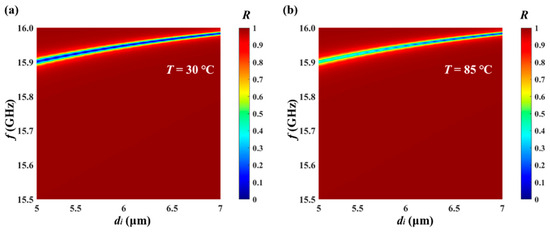
Figure 5.
The reflectance, di, and frequency spectra (a) in the insulating state (T = 30 °C) and(b) in the metallic state (T = 85 °C) when TM waves are incident on the HDS.
Figure 6a describes the influence of da on the reflectance in the frequency band from 15.5 GHz to 16.0 GHz at T = 30 °C. We find that there is no reflection valley in the frequency band before 15 μm, and there is only one reflection valley from 15 μm to 15.25 μm, which intermittently moves toward a lower flat rate with a continuous increase in thickness. When the thickness is greater than 15.25 μm, two reflection valleys occur, which simultaneously move intermittently toward a lower flatness with a continuous increase in the thickness. Figure 6b describes the influence of da on the reflectance in the frequency band from 15.5 GHz to 16.0 GHz at T = 85 °C, which is basically consistent with the phenomenon law at T = 30 °C. It is worth noting that since only one reflection valley can occur within our frequency band, the preferred value of da is between 15 μm and 15.25 μm.
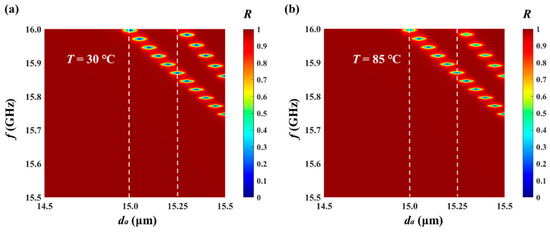
Figure 6.
The reflectance, da, and frequency spectra (a) in the insulating state (T = 30 °C) and (b) in the metallic state (T = 85 °C) when TM waves are incident on the HDS.
Figure 7a describes the spectra of TM waves incident on the HDS in the VO2 insulation state, with B = 0.43 Tesla and B = 0.2 Tesla, respectively. In Figure 7b, when B = 0.43 Tesla, it can be clearly seen that a reflection valley appears at 15.9 GHz. When the reflectance is 0.05 and B = 0.2 T, no reflection valley occurs, and the reflectance is basically close to 1. Figure 7c,d describe the spectra of TM waves incident on the HDS in the VO2 insulation state at B = 0.439 Tesla and B = 0.3 Tesla. When B = 0.439 Tesla, it can be clearly seen from Figure 7c,d that a reflection valley appears at 16.0 GHz, with a reflectance of 0.08. When B = 0.2 Tesla, from 15.5 GHz to 16.0 GHz, no reflection valley appears, and the reflectance basically approaches 1. Taking advantage of this phenomenon, in the temperature-coded state, secondary coding can be carried out. The encoding rule is that when a reflection valley appears, the code is ‘0’; when no reflection valley appears, the code is ‘1’. With this approach, by detecting whether there are obvious reflection valleys at different temperatures, the two-digit binary coding shown in Table 2 can be achieved. It is worth noting that the trigger logic of the device strictly follows the binary definition, with thresholds set at B ≤ 0.3 Tesla and B ≥ 0.43 Tesla. The state between 0.3 and 0.43 is undefined, ensuring trigger determinism. The multiple B values presented in the text (such as the specific values at high and low levels) do not indicate that B itself is polymorphic, but rather, they represent the specific operating points corresponding to when the device performance (output reflection valley) reaches the optimum under different input magnetic field intensities (i.e., different B input values).
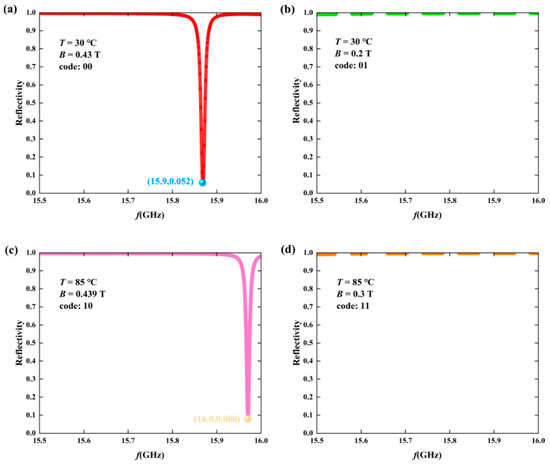
Figure 7.
Two-digit binary code graph For a TM wave incident on the HDS. (a) The reflectance spectrum at B = 0.43 Tesla in the insulating state (T = 30 °C). (b) The reflectance spectrum at B = 0.2 Tesla in the insulating state (T = 30 °C). (c) The reflectance spectrum at B = 0.439 Tesla in the metallic state (T = 85 °C). (d) The reflectance spectrum at B = 0.3 Tesla in the metallic state (T = 85 °C).

Table 2.
Two-digit binary code table.
Table 3 is the function table of the traditional electronic DFF trigger [34]. Traditional electronic triggers have five functions: ‘Synchronization set 0’, ‘Synchronization set 1’, ‘Asynchronous set 1’, ‘Asynchronous set 0’, and ‘Keep’. ‘Synchronization set 0’ will force the output to 0 when the clock is triggered. For ‘Synchronization set 1’, when the clock is triggered, the output is forcibly set to 1. ‘Asynchronous set 1’ is not controlled by the clock and immediately forces the output to be 1. ‘Asynchronous set 0’ is not controlled by the clock and immediately forces the output to be 0. ‘Keep’ maintains the current state and does not change the output value. On the rising clock edge with asynchronous signals disabled (PRESET = 0, CLEAR = 0): = 1, = 1 is the synchronous setting function (synchronous set/reset conflict), = 0, = 1 is the asynchronous set 1 function (output = 1), = 1, and = 0 is an asynchronous zeroing function (output = 0). In the above article, two-digit binary coding has been implemented. Now, by periodically changing the temperature over time in a regular manner to achieve timing, dynamic coding can be realized. The optical DFF is achieved by setting certain rules for dynamic coding. The specific rules are shown in Table 4. The optical DFF triggered by the rising edge is realized by dynamically regulating B and T. The traditional DFF achieves a synchronous setting of ‘0’, a synchronous setting of 1, an asynchronous setting of 0, and an asynchronous setting of ‘1’, maintaining five functions.

Table 3.
Optical DFF trigger function menu [34,35,36].

Table 4.
Optical DFF trigger function menu.
Table 4 describes the function table model of the designed optical DFF and the functions of the traditional DFF. When the time sequence is at the rising edge from 0 to 1, let T = 85 °C and B = 0.439 Tesla, which is ‘Synchronization set 0’. When the synchronization is at the rising edge from 0 to 1, let T = 85 °C and B = 0.3 Tesla, which is ‘Synchronization set 0’. To achieve ‘Asynchronous set 1’, when the time sequence is 1, let T = 85 °C and B = 0.3 Tesla; when the time sequence is 0, let T = 30 °C and B = 0.2 Tesla. To achieve ‘Asynchronous set 0’, when the time sequence is 1, let T = 85 °C and B = 0.439 Tesla; when the time sequence is 0, let T = 30 °C and B = 0.43 Tesla. To achieve ‘Keep’, when the time sequence is ‘1’, let T = 85 °C and B = 0.43 Tesla; when the time sequence is ‘0’, let T = 30 °C and B = 0.2 Tesla. Φ usually represents an irrelevant term, that is, the value of this signal has no influence on the state transition of the flip-flop.
Figure 8a describes the timing simulation pattern of the common DFF. Figure 8b shows that the timing pattern of the optical DFF designed in the article generates the same sequence Q as the common DFF. It can be clearly seen from Figure 8b that T is a sequence that varies with time. The optical DFF flip-flop triggered by the rising edge is dynamically regulated at different T values. Different T values dynamically adjust the flip trigger of the optical D flip-flop. Under the trigger of the rising edge of the CP, the optical DFF dynamically changes the state of the output Q according to the state of the T signal. Using Table 4, in order to achieve the same waveform in Figure 8a for T in the range from 30 °C to 85 °C over the time cycle of change, adjusting the magnetic field changes over time for a B0B2B0B4B2B4B2B3B0B2B4B2B3B0B4B2 magnetic field can realize the function of DFF.
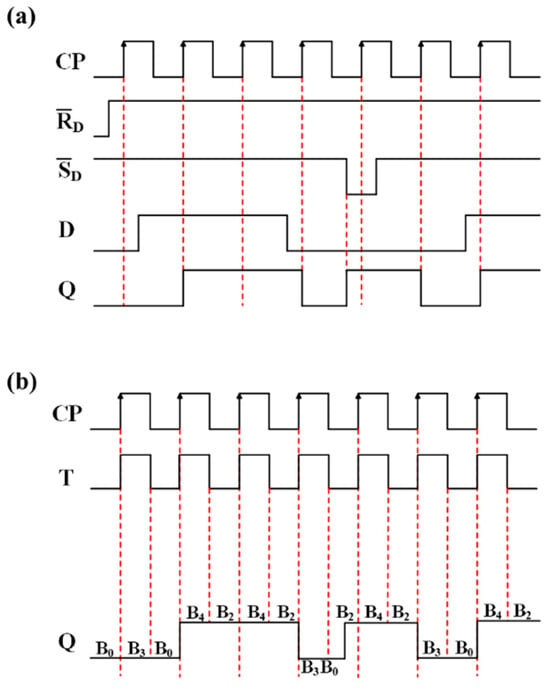
Figure 8.
(a) DFF timing logic diagram. (b) Optical DFF timing logic diagram of TM waves incident on the HDS.
The schematic diagram of the designed optical DFF flip-flop is described in Figure 9. For the DFF, the input port D is used to receive data signals, CLK is used to receive clock signals to control the storage and transmission time of data, and CLR and SET are used to clear and reset the state of the flip-flop. The output ports Q and provide the corresponding output signals. For an optical DFF, the input port D is used to receive data signals, T is used to receive temperature signals that vary with time, T is used to receive magnetic field signals to control the storage and transmission time of data, and the output ports Q and provide the corresponding output signals. The two have similarities in their structure and function, but they differ in their specific applications and signal processing methods. D is the data input port, B is the magnetic field input port, T is the temperature input port, and Q is the output port. is the inverting output port. When the input data D = 0, B = 0.439 Tesla, and T = 85 °C, the output ports Q = “0” and = “1”. Use Table 4 by dynamically adjusting the data input to ports T and B, the function of the DFF flip-flop triggered by the rising edge can be achieved, generating the required sequence code.
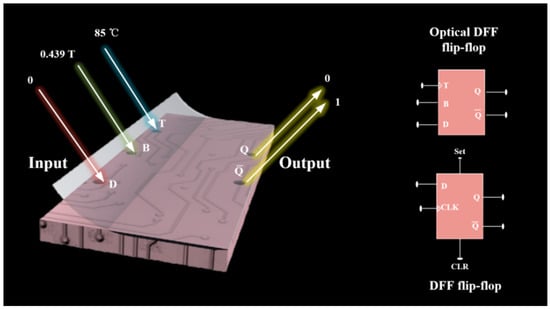
Figure 9.
Schematic diagram of the optical DFF.
4. Conclusions
In this paper, a layered metastructure based on the phase-changed material VO2 is designed and investigated. Through cooperative regulation of the temperature and the magnetic field, dynamic optical coding and optical D trigger functions are achieved in the frequency band of 15.5–16 GHz. The insulator–metal phase-transition property of VO2 causes its optical reflectance to change significantly with temperature, providing a physical basis for dynamic regulation. Binary optical coding was successfully achieved by optimizing the metastructure and combining the regulation of the local temperature field and the external magnetic field. Furthermore, a sequential temperature–magnetic field co-control strategy was developed to simulate date flip-flop functionality in digital circuits, with output states dynamically controlled by the data input (D), timing control port (T), and state control port (B).
This research not only expands the application of VO2 metastructures in dynamic optical regulation but also provides new design ideas for programmable photonic devices, optical information storage, and optical logic computing systems. In the future, the practicality and scalability of the system can be further enhanced by optimizing the material response speed, expanding the multiband regulation, or integrating more logical functions, thereby promoting the development of optical computing and intelligent photonic devices.
Author Contributions
Conceptualization, N.P.; methodology, N.P.; software, N.P. and Z.-C.X.; validation, H.-F.Z.; formal analysis, J.-Y.Z.; investigation, H.-F.Z.; resources, H.-J.L.; data curation, N.P.; writing—original draft preparation, N.P.; writing—review and editing, H.-F.Z.; visualization, Z.-C.X.; supervision, H.-F.Z.; project administration, H.-F.Z.; funding acquisition, H.-F.Z. All authors have read and agreed to the published version of the manuscript.
Funding
This research received no external funding.
Institutional Review Board Statement
Not applicable.
Informed Consent Statement
Informed consent was obtained from all subjects involved in the study.
Data Availability Statement
Samples of the compounds are available from the authors. Informed consent was obtained from all subjects involved in the study.
Acknowledgments
This manuscript has not previously been published yet and is not under consideration for publication elsewhere. The authors are grateful to those who participated in this research work.
Conflicts of Interest
The authors declare no conflicts of interest.
References
- Russell, P.S.J. Photonic band gaps. Phys. World 1992, 5, 37. [Google Scholar] [CrossRef]
- Joannopoulos, J.D.; Pierre, R.; Villeneuve, S.F. Photonic crystals. Solid. State Commun. 1997, 102, 165–173. [Google Scholar] [CrossRef]
- Shen, H.; Wang, Z.; Wu, Y.; Yang, B. One-dimensional photonic crystals: Fabrication, responsiveness and emerging applications in 3D construction. RSC Adv. 2016, 6, 4505–4520. [Google Scholar] [CrossRef]
- Winn, J.N.; Fink, Y.; Fan, S.; Joannopoulos, J.D. Omnidirectional reflection from a one-dimensional photonic crystal. Opt. Lett. 1998, 23, 1573–1575. [Google Scholar] [CrossRef]
- Aly, A.H.; Hussien, A.E. Defect mode properties in a one-dimensional photonic crystal. Phys. B Condens. Matter 2012, 407, 120–125. [Google Scholar] [CrossRef]
- Yue, Y.; Jian, P.G. Tunable one-dimensional photonic crystals from soft materials. J. Photochem. Photobiol. C Photochem. Rev. 2015, 23, 45–67. [Google Scholar] [CrossRef]
- Zaghdoudi, J.; Ibrahim, H.G.; Mounir, K. Next-Generation 1D Photonic Crystal Sensor: Revolutionizing Fat Concentration Measurement in Commercial Milk. Phys. B Condens. Matter 2025, 714, 417428. [Google Scholar] [CrossRef]
- Shaban, M. Tunability and sensing properties of plasmonic/1D photonic crystal. Sci. Rep. 2017, 7, 41983. [Google Scholar] [CrossRef]
- Kassem, M.; Benmore, C.J.; Tverjanovich, A.; Bokova, M.; Khomenko, M.; Usuki, T.; Sokolov, A.; Fontanari, D.; Bereznev, S.; Ohara, K.; et al. Atomic Structure, Dynamics, Changes in Chemical Bonding and Semiconductor-Metal Transition in Sb2Se3: A Remarkable Material for Quantum Networks and Energy Applications. ACS Appl. Mater. Interfaces 2025, 17, 17075–17095. [Google Scholar] [CrossRef]
- Hou, W.; Stephen, B.C. A review of surface plasmon resonance-enhanced photocatalysis. Adv. Funct. Mater. 2013, 23, 1612–1619. [Google Scholar] [CrossRef]
- Rothenhäusler, B.; Wolfgang, K. Surface–plasmon microscopy. Nature 1988, 332, 615–617. [Google Scholar] [CrossRef]
- Ebbesen, T.W.; Cyriaque, G.; Sergey, I.B. Surface-plasmon circuitry. Phys. Today 2008, 61, 44–50. [Google Scholar] [CrossRef]
- Raoux, S. Phase change materials. Annu. Rev. Mater. Res. 2009, 39, 25–48. [Google Scholar] [CrossRef]
- Liu, K. Recent progresses on physics and applications of vanadium dioxide. Mater. Today 2018, 21, 875–896. [Google Scholar] [CrossRef]
- Voti, R.L. Optothermal characterization of vanadium dioxide films by Infrared Thermography. Int. J. Therm. Sci. 2024, 197, 108832. [Google Scholar] [CrossRef]
- Azmat, M.; Yang, J.; Li, Q.; Zhang, J.; Jin, H.; Kashif, N.M.; Li, J. Role of 4f electrons and 3d-4f hybridization in metal-insulator transition in RE (La, Nd, Sm, Eu, Dy and Er)-doped vanadium dioxide for thermochromic applications. Ceram. Int. 2024, 50, 11119–11128. [Google Scholar] [CrossRef]
- Joshi, N.; Ignatius Xavier, A.P.; Gopinath, S.; Tiwari, V.; Anand, V. Spatial Ensemble Mapping for Coded Aperture Imaging—A Tutorial. Photonics 2024, 11, 1174. [Google Scholar] [CrossRef]
- Singh, M.; Elsayed, E.E.; Alayedi, M. Performance analysis in spectral-amplitude-coding-optical-code-division-multiple-access using identity column shift matrix code in free space optical transmission systems. Opt. Quantum Electron. 2024, 56, 795. [Google Scholar] [CrossRef]
- Cheng, J.; Ouyang, X.; Tang, X.; Qin, B.; Liu, S.; Chen, H.; Song, B.; Zheng, Y. 2D Reconfigurable Memory for Integrated Optical Sensing and Multifunctional Image Processing. ACS Appl. Mater. Interfaces 2025, 17, 25467–25477. [Google Scholar] [CrossRef]
- Shabanpour, J.; Sina, B.; Ahmad, C. Ultrafast reprogrammable multifunctional vanadium-dioxide-assisted metasurface for dynamic THz wavefront engineering. Sci. Rep. 2020, 10, 8950. [Google Scholar] [CrossRef]
- Kazanskiy, N.L.; Butt, M.A.; Khonina, S.N. Optical computing: Status and perspectives. Nanomaterials 2022, 12, 2171. [Google Scholar] [CrossRef]
- Agrell, E.; Karlsson, M.; Poletti, F.; Namiki, S.; Chen, X.V.; Rusch, L.A.; Puttnam, B.; Bayvel, P.; Schmalen, L.; Tao, Z.; et al. Roadmap on optical communications. J. Opt. 2024, 26, 093001. [Google Scholar] [CrossRef]
- Ahmed, A.H.; Sharkia, A.; Casper, B.; Mirabbasi, S.; Shekhar, S. Silicon-photonics microring links for datacenters—Challenges and opportunities. IEEE J. Sel. Top. Quantum Electron. 2016, 22, 194–203. [Google Scholar] [CrossRef]
- Ko, U.; Balsara, P.T. High-performance energy-efficient D-flip-flop circuits. IEEE Trans. Very Large Scale Integr. (VLSI) Syst. 2000, 8, 94–98. [Google Scholar]
- Sanadhya, M.; Sharma, D.K. D flip-flop design by adiabatic technique for low power applications. Indonesian J. Electr. Eng. Comput. Sci. 2023, 29, 141–146. [Google Scholar] [CrossRef]
- Pugachov, Y.; Gulitski, M.; Malka, D. Design of All-Optical D Flip Flop Memory Unit Based on Photonic Crystal. Nanomaterials 2024, 14, 1321. [Google Scholar] [CrossRef]
- Rao, D.G.S.; Palacharla, V.; Swarnakar, S.; Kumar, S. Design of all-optical D flip-flop using photonic crystal waveguides for optical computing and networking. Appl. Opt. 2020, 59, 7139–7143. [Google Scholar] [CrossRef]
- Adams, A.C.; Smith, T.E.; Chang, C.C. The growth and characterization of very thin silicon dioxide films. J. Electrochem. Soc. 1980, 127, 1787. [Google Scholar] [CrossRef]
- Kana, J.B.K.; Vignaud, G.; Gibaud, A.; Maaza, M. Thermally driven sign switch of static dielectric constant of VO2 thin film. Opt. Mater. 2016, 54, 165–169. [Google Scholar] [CrossRef]
- Dicken, M.J.; Aydin, K.; Pryce, I.M.; Sweatlock, L.A.; Boyd, E.M.; Walavalkar, S.; Ma, J.; Atwater, H.A. Frequency tunable near-infrared metamaterials based on VO2 phase transition. Opt. Express 2009, 17, 18330–18339. [Google Scholar] [CrossRef]
- Qi, L.; Yang, Z.; Lan, F.; Gao, X.; Shi, Z. Properties of obliquely incident electromagnetic wave in one-dimensional magnetized plasma photonic crystals. Phys. Plasmas 2010, 17, 042501. [Google Scholar] [CrossRef]
- Sydorenko, D.; Kaganovich, I.D.; Ventzek, P.L.G.; Chen, L. Effect of collisions on the two-stream instability in a finite length plasma. Phys. Plasmas 2016, 23, 122119. [Google Scholar] [CrossRef]
- Wang, H.; Li, Y.-P. An eigen matrix method for obtaining the band structure of photonic crystals. Acta Phys. Sin. 2001, 50, 2172–2178. [Google Scholar] [CrossRef]
- Palnitkar, S. Verilog HDL: A Guide to Digital Design and Synthesis; Prentice Hall Professional: Hoboken, NJ, USA, 2003; Volume 1. [Google Scholar]
- Huang, Y.; Li, S.; Yang, Y.; Chen, C. Progress on Memristor-Based Analog Logic Operation. Electronics 2023, 12, 2486. [Google Scholar] [CrossRef]
- Wang, Z.; Wang, L.; Duan, S. Memristor ratioed logic crossbar-based delay and jump-key flip-flops design. Int. J. Circuit Theory Appl. 2022, 50, 1353–1364. [Google Scholar] [CrossRef]
Disclaimer/Publisher’s Note: The statements, opinions and data contained in all publications are solely those of the individual author(s) and contributor(s) and not of MDPI and/or the editor(s). MDPI and/or the editor(s) disclaim responsibility for any injury to people or property resulting from any ideas, methods, instructions or products referred to in the content. |
© 2025 by the authors. Licensee MDPI, Basel, Switzerland. This article is an open access article distributed under the terms and conditions of the Creative Commons Attribution (CC BY) license (https://creativecommons.org/licenses/by/4.0/).