High Precision Range Extracting Method for FMCW LiDAR Using Semiconductor Laser Based on EO-PLL and NUDFT


Abstract
1. Introduction
2. Theory
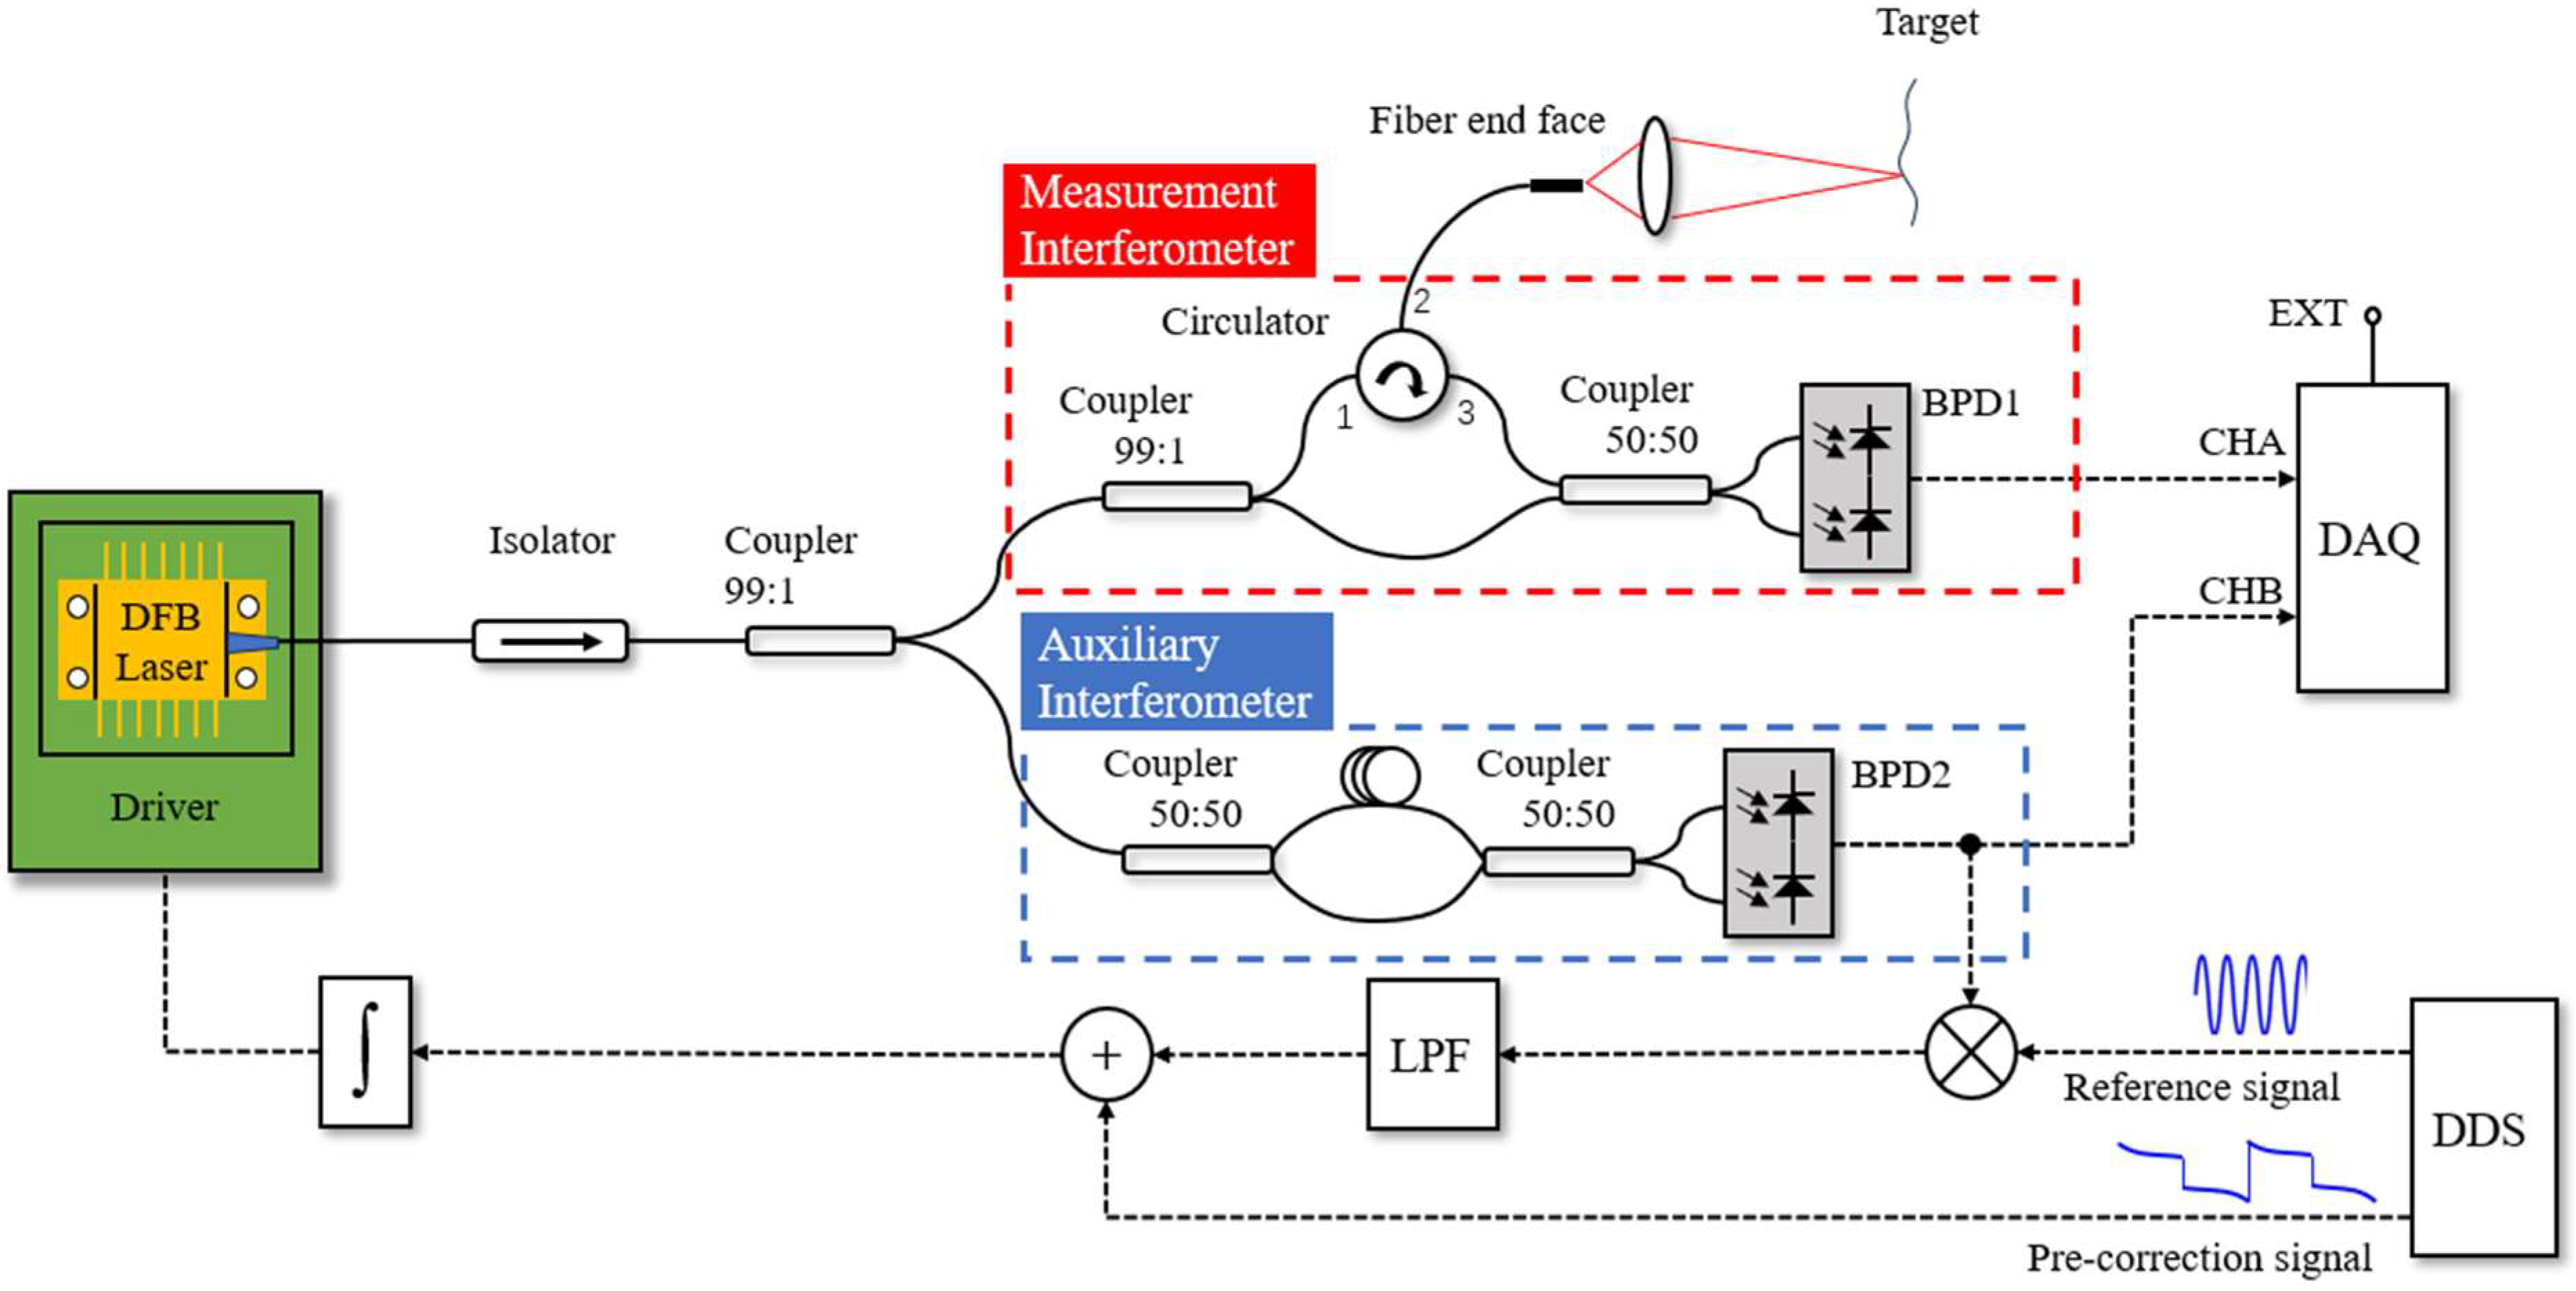
3. Approach
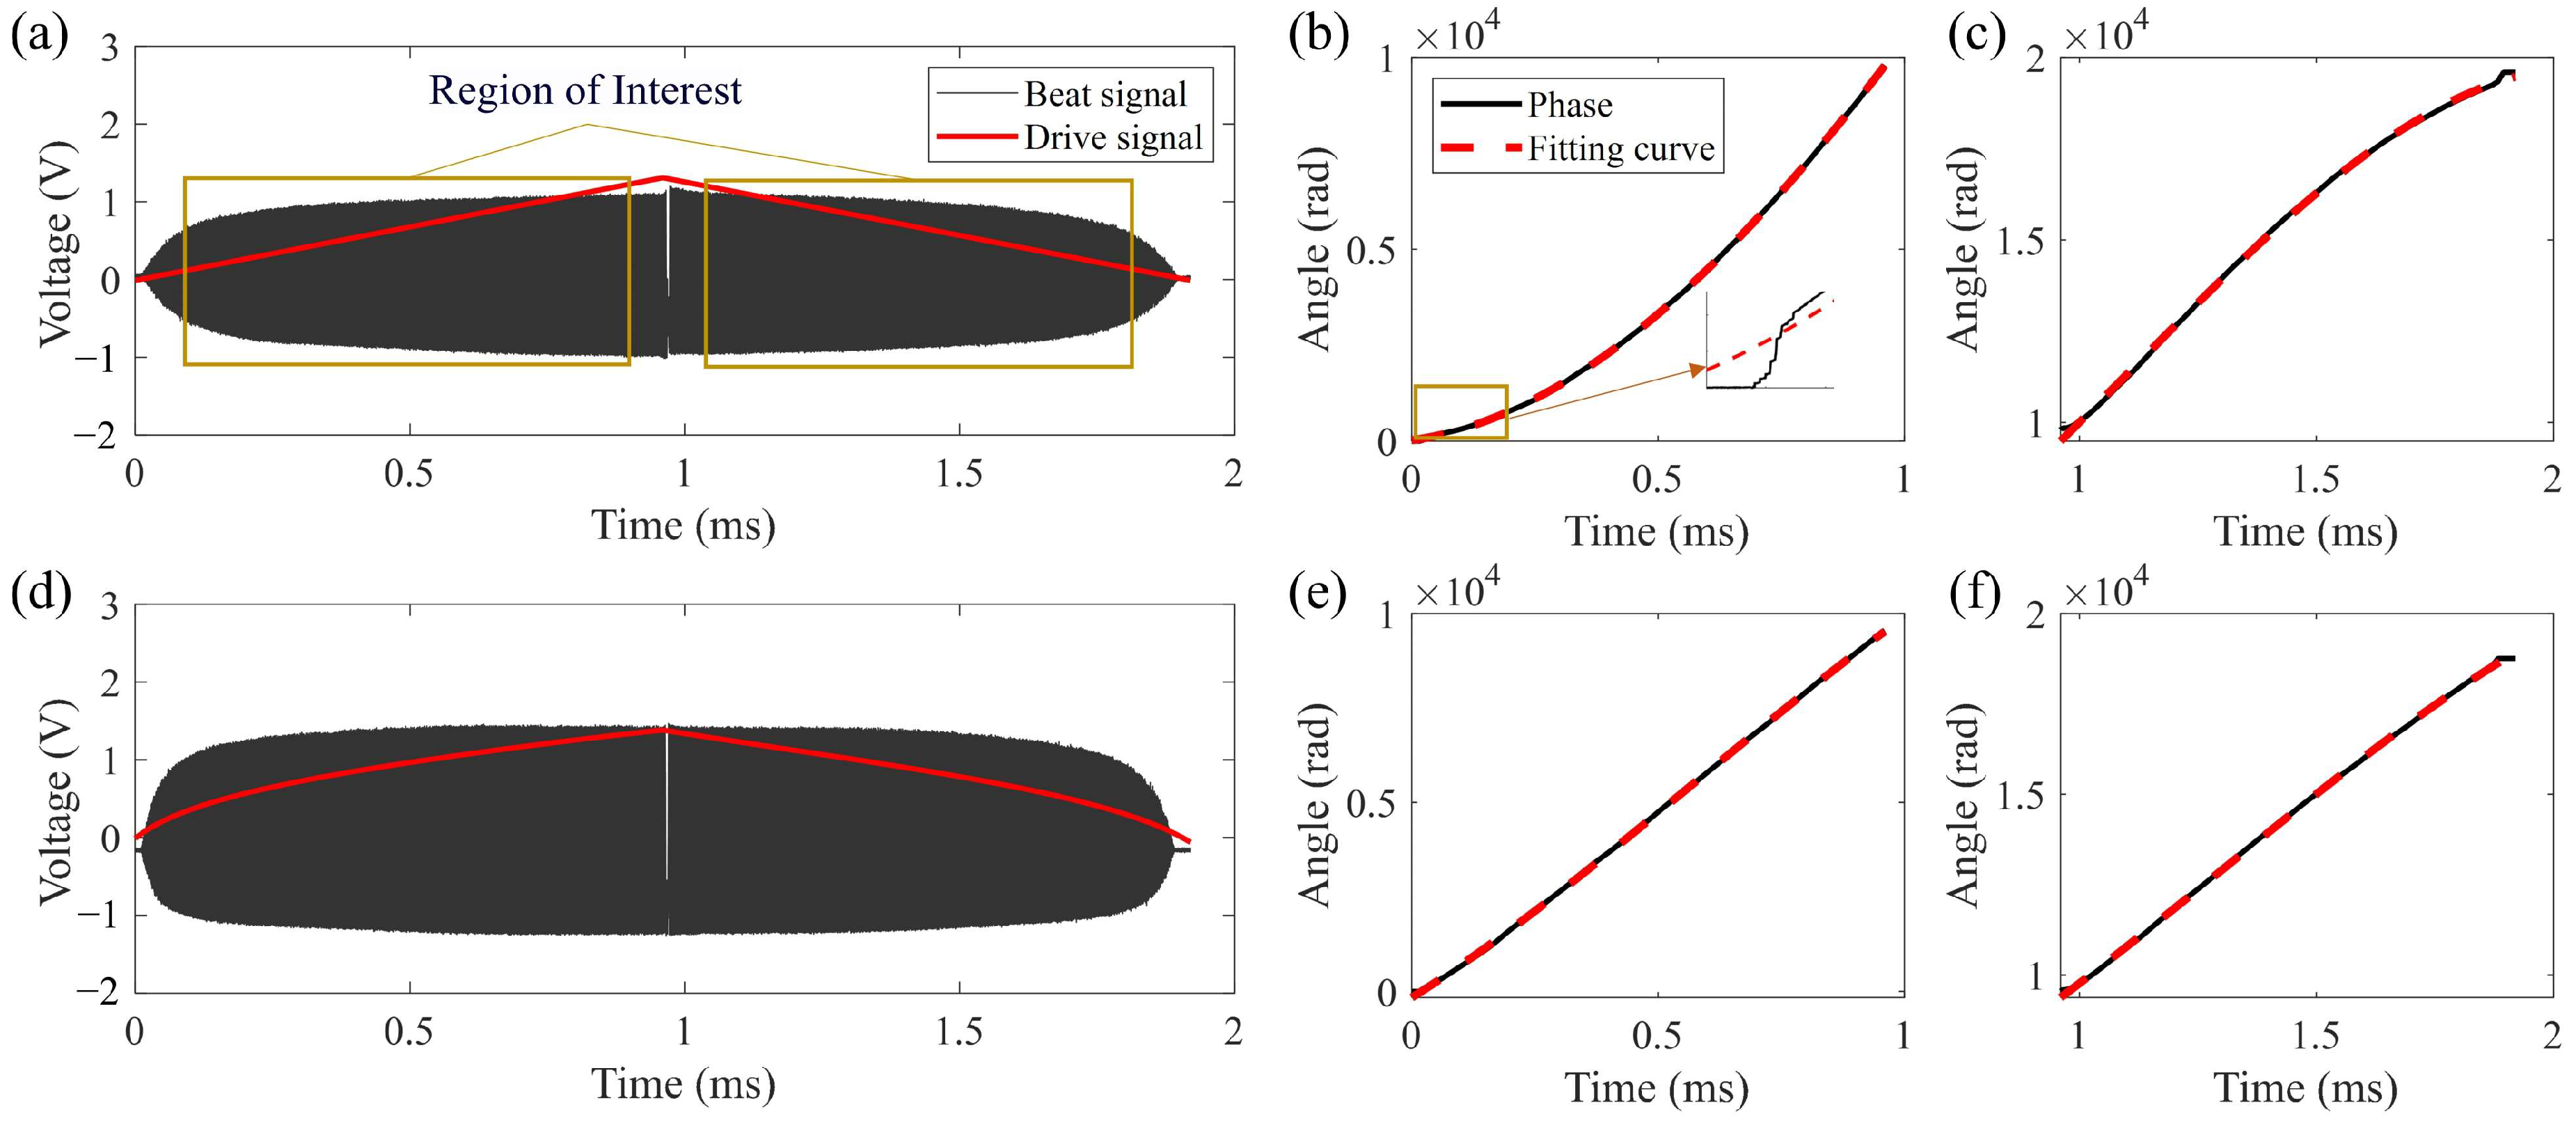
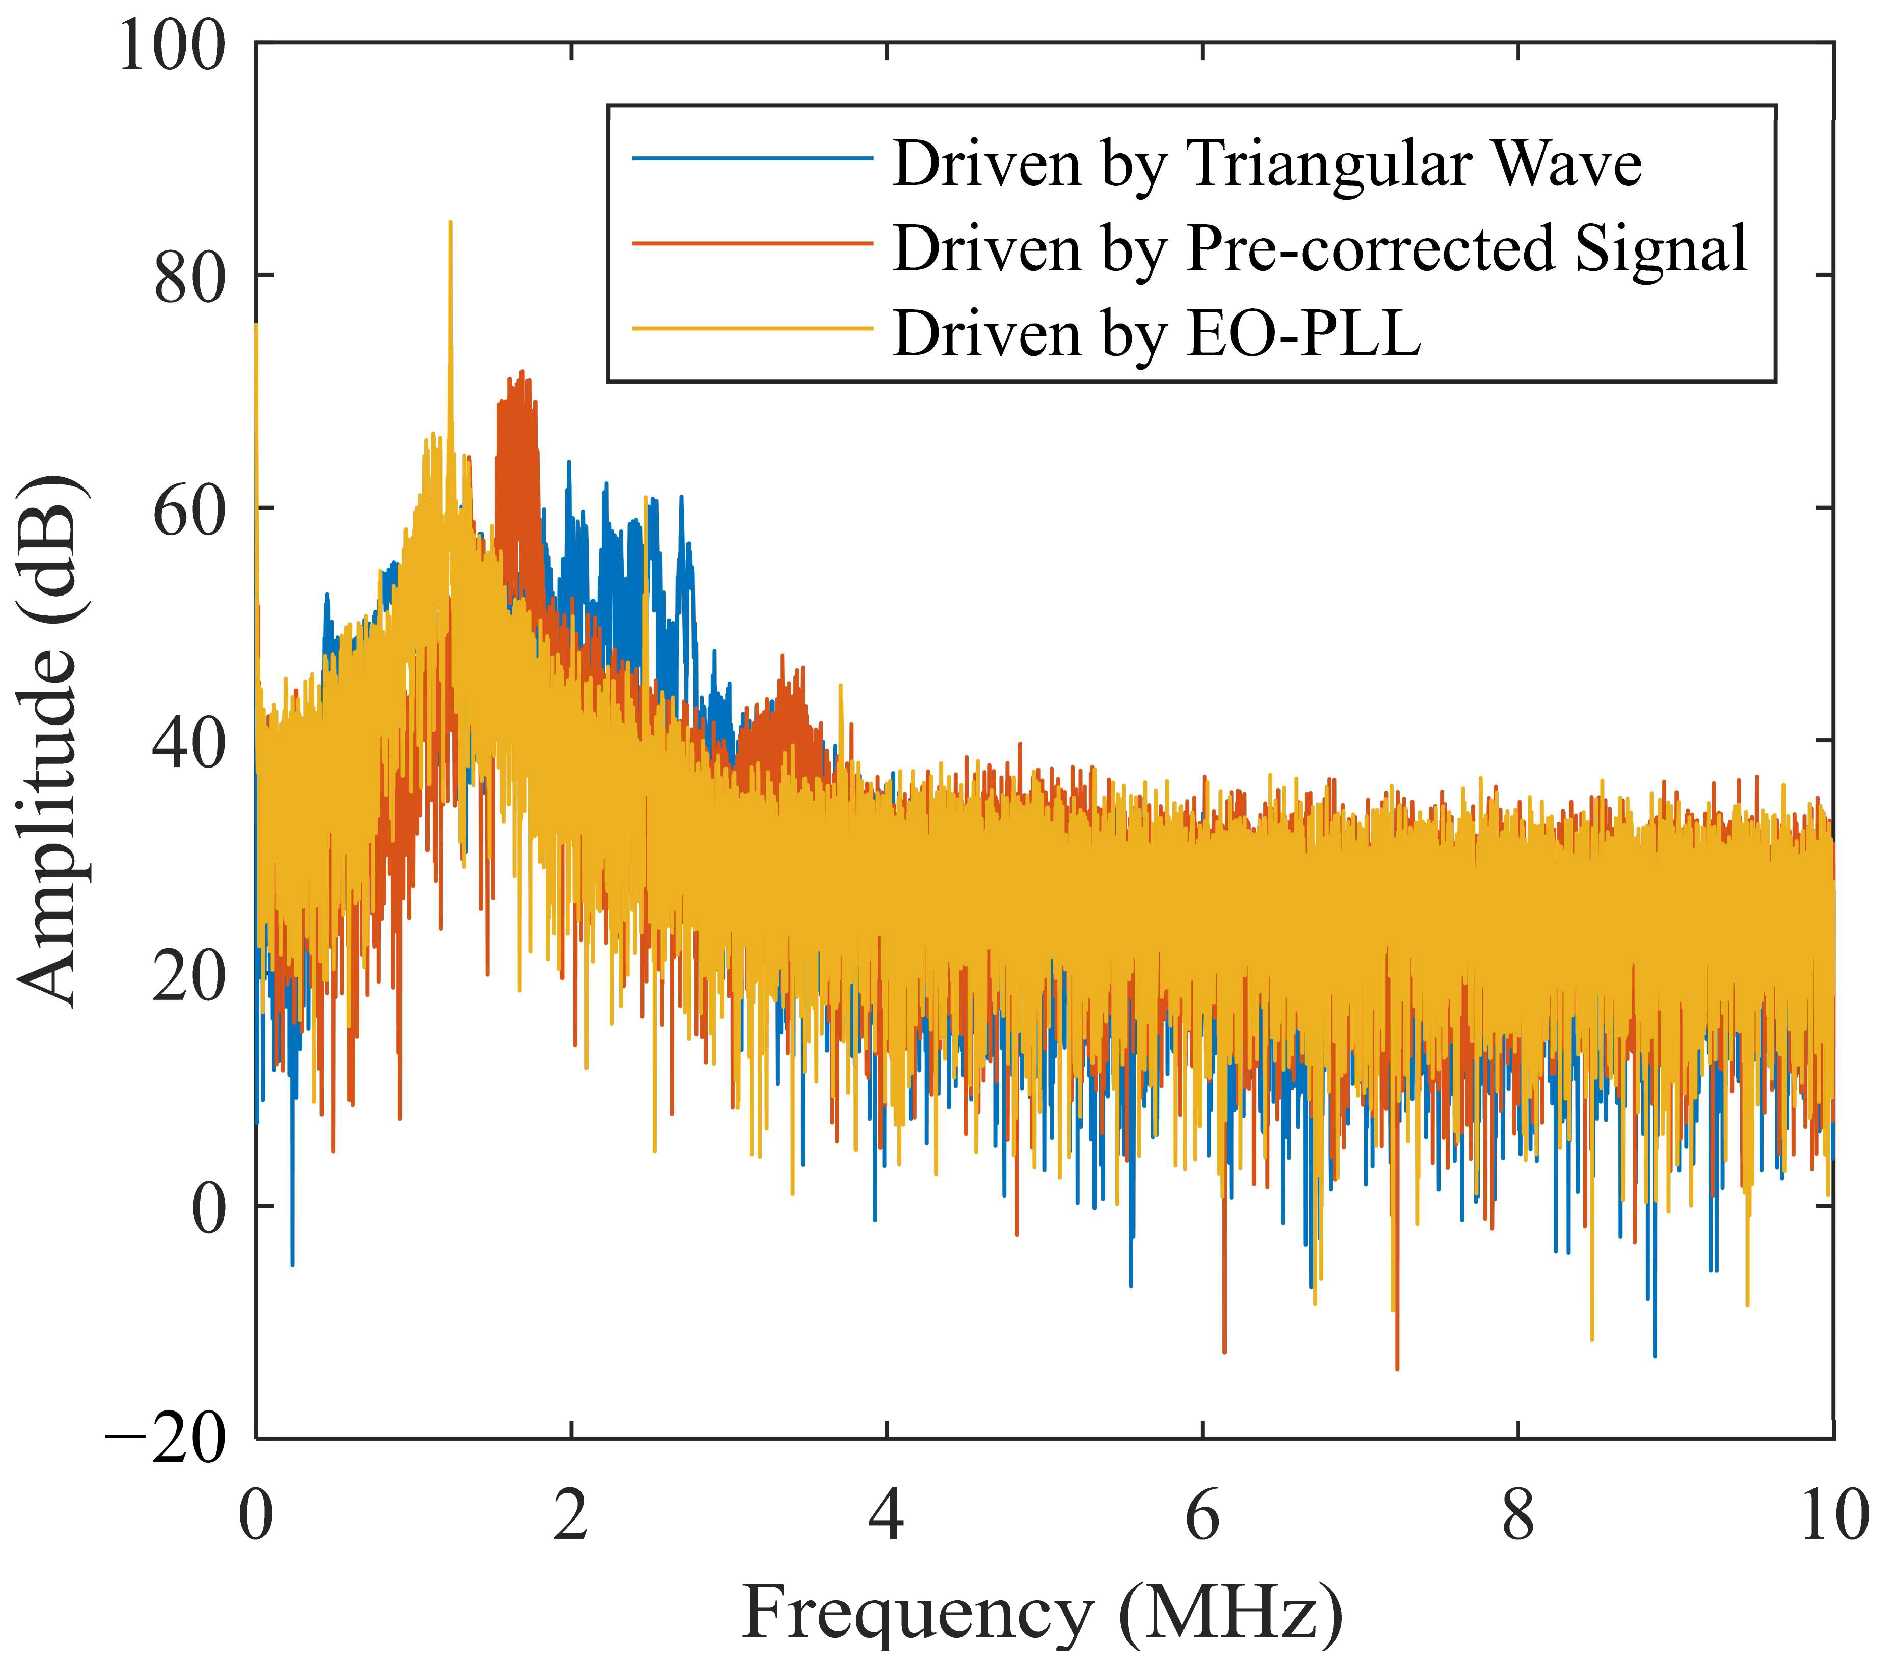
3.1. Pre-Correction
3.2. Nonlinear Correction Based on EO-PLL and NUDFT
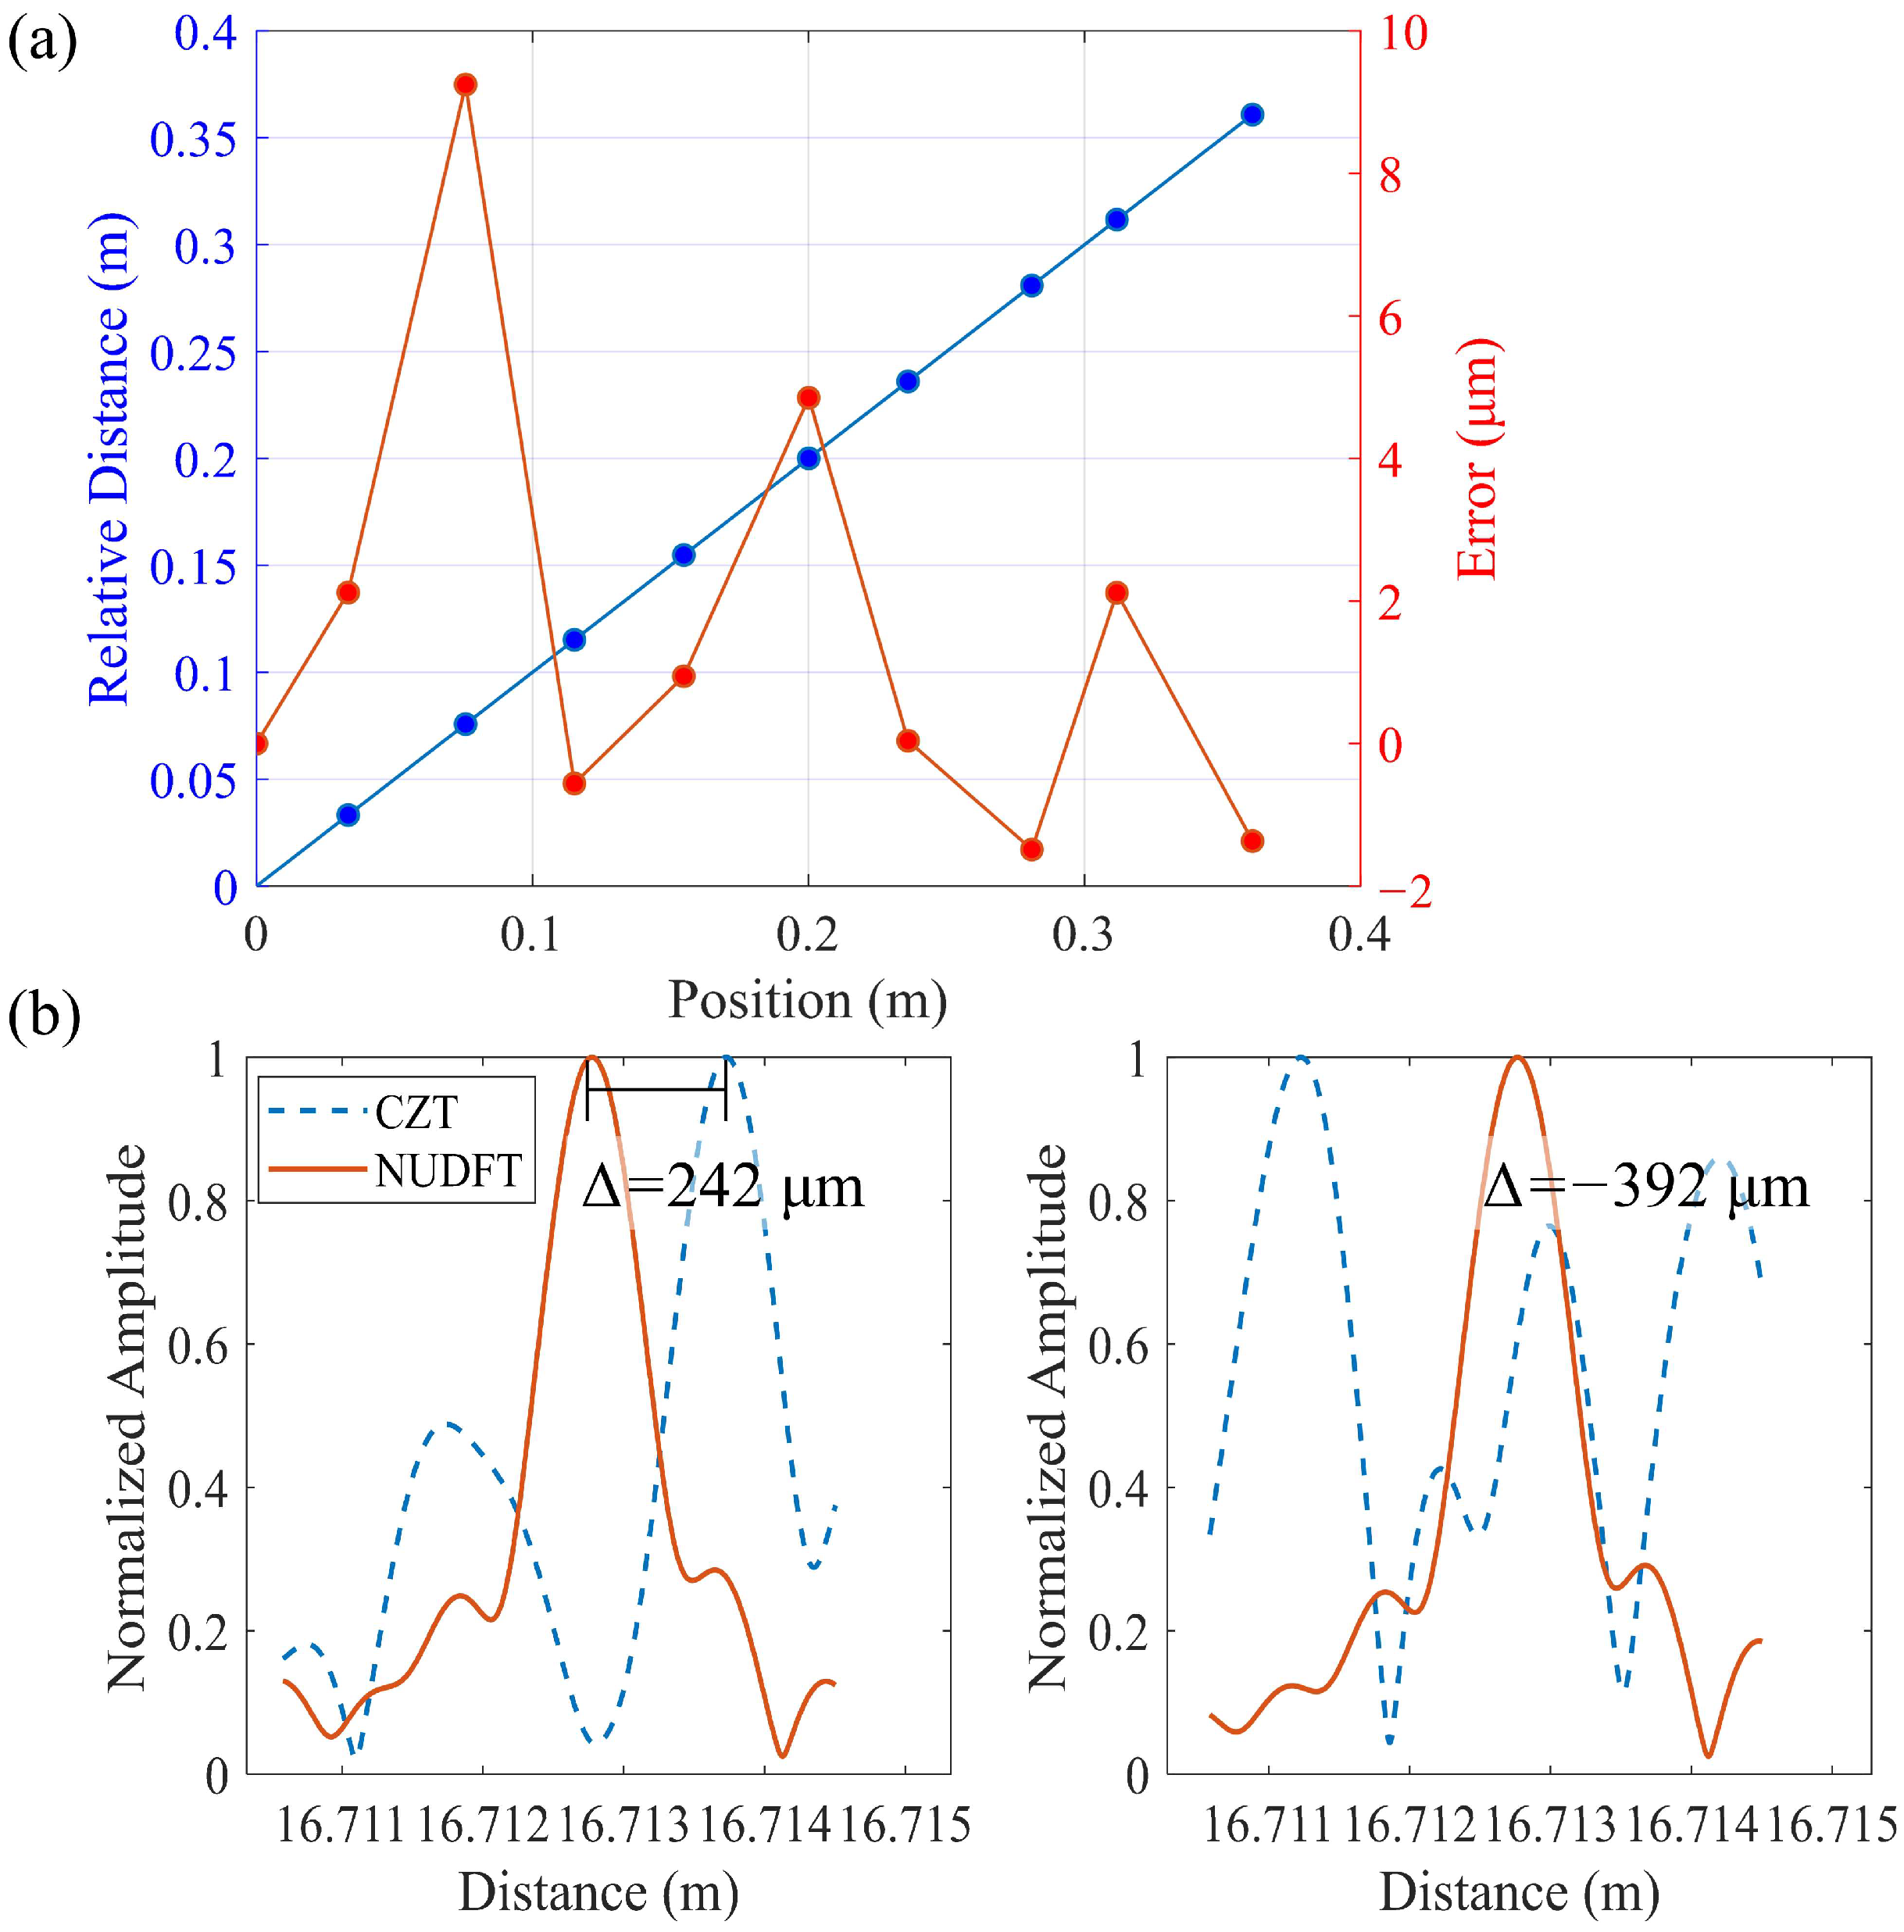
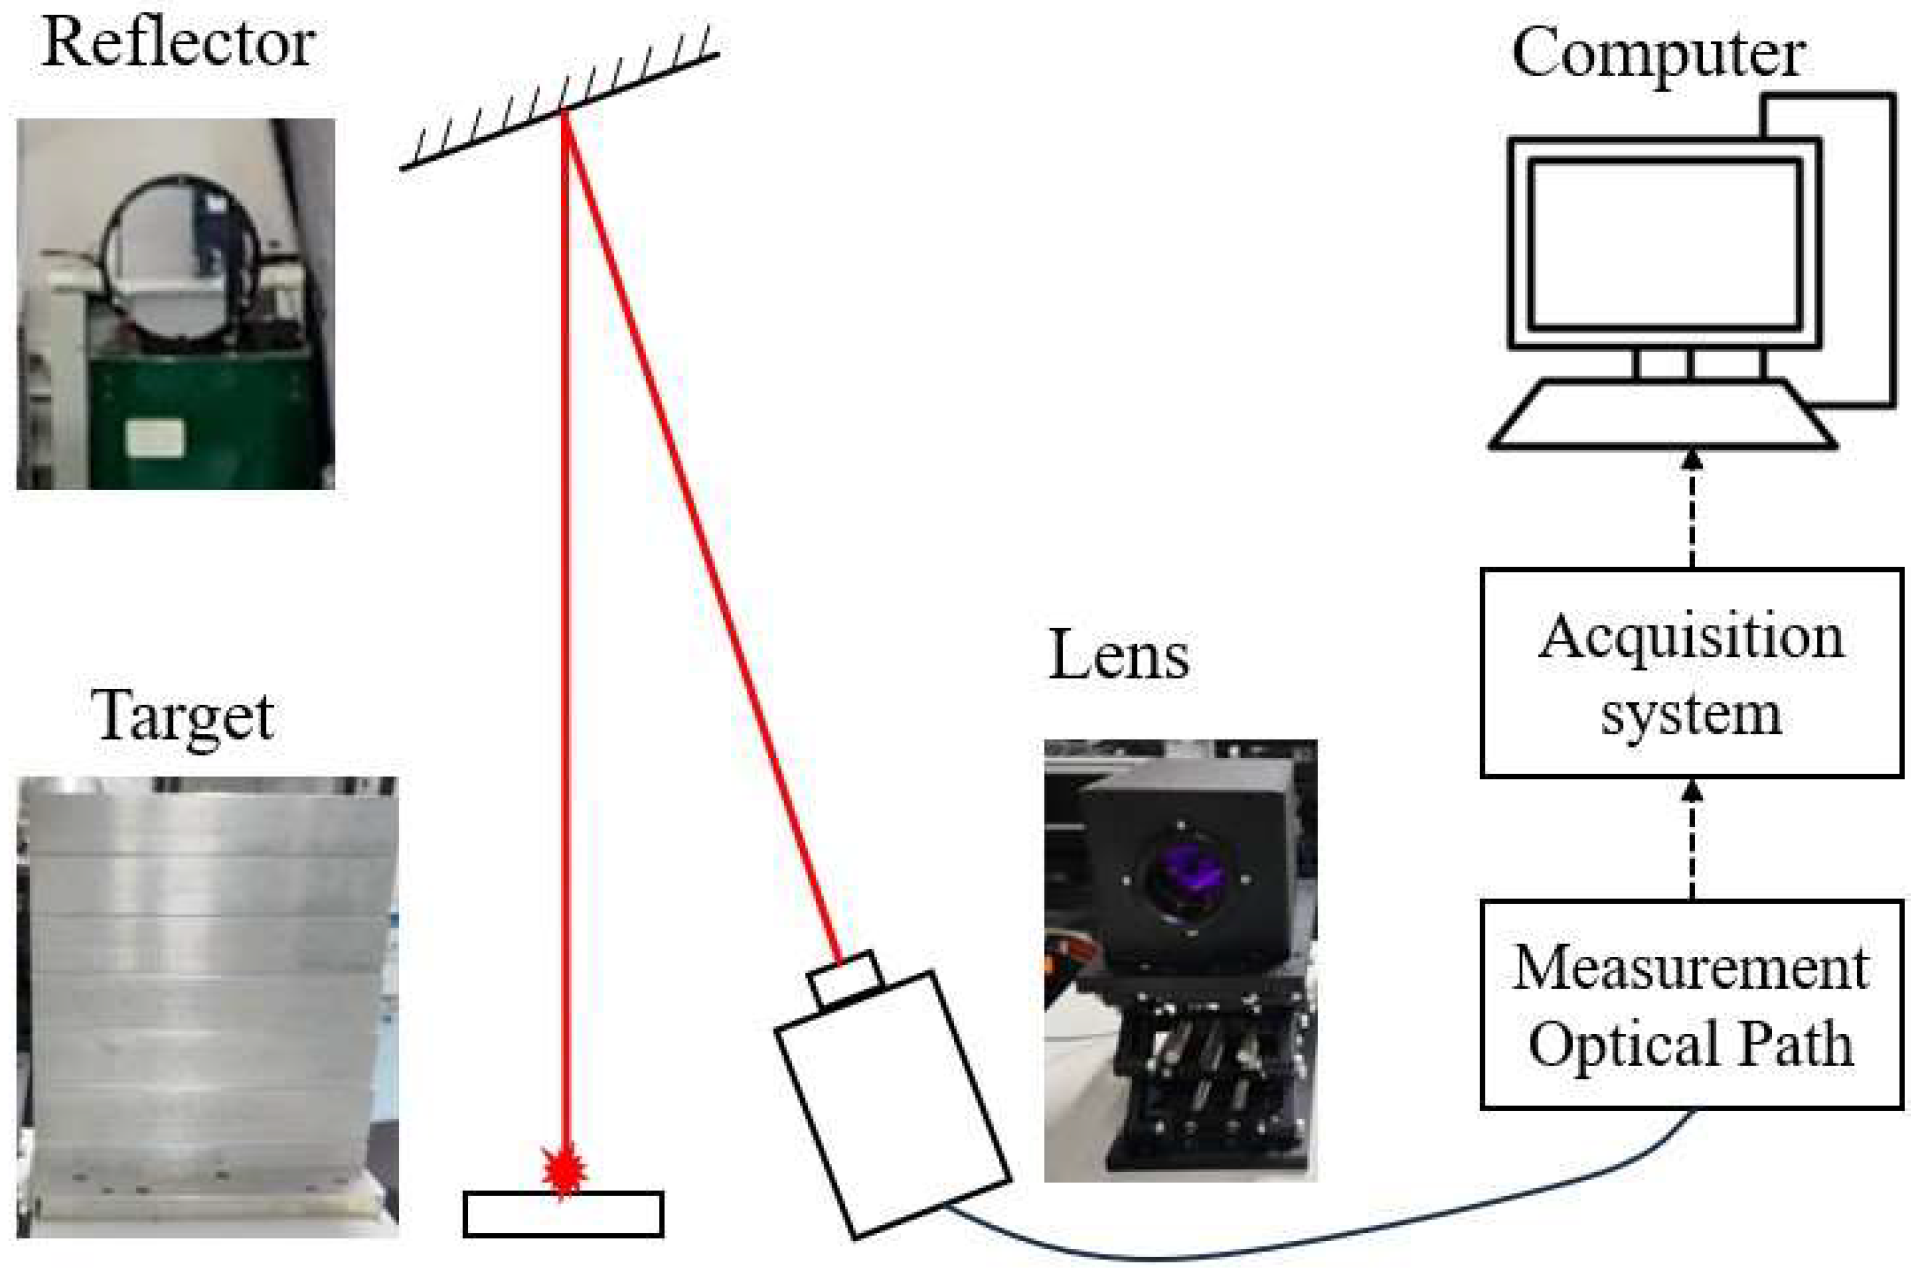
4. Experiments and Results
5. Conclusions
Author Contributions
Funding
Institutional Review Board Statement
Informed Consent Statement
Data Availability Statement
Conflicts of Interest
References
- Feneyrou, P.; Leviandier, L.; Minet, J.; Pillet, G.; Martin, A.; Dolfi, D.; Schlotterbeck, J.P.; Rondeau, P.; Lacondemine, X.; Rieu, A.; et al. Frequency-modulated multifunction lidar for anemometry, range finding, and velocimetry—2 experimental results. Appl. Opt. 2017, 56, 9676–9685. [Google Scholar] [CrossRef] [PubMed]
- Wang, Y.F.; Hua, Z.Y.; Shi, J.C.; Dai, Z.R.; Wang, J.G.; Shao, L.Y.; Tan, Y.D. Laser feedback frequency-modulated continuous-wave lidar and 3-d imaging. IEEE Trans. Instrum. Meas. 2023, 72, 1–9. [Google Scholar] [CrossRef]
- Huang, T.X.; Zhang, C.Y.; Lu, D.; Zeng, Q.Y.; Fu, W.J.; Yan, Y. Improving FMCW GPR precision through the CZT algorithm for pavement thickness measurements. Electronics 2022, 11, 3524. [Google Scholar] [CrossRef]
- Kim, D.; Choi, J.; Yoon, J.; Cheon, S.; Kim, B. HeartBeatNet: Enhancing fast and accurate heart rate estimation with FMCW radar and lightweight deep learning. IEEE Sens. Lett. 2024, 8, 1–4. [Google Scholar] [CrossRef]
- Gao, S.; Luo, M.; Jing, Z.G.; Chen, H.Y. A tunable dual-wavelength fiber ring-cavity laser based on a FBG and DFB laser injection. Optik 2020, 203, 163961. [Google Scholar] [CrossRef]
- Moore, E.D.; Mcleod, R.R. Correction of sampling errors due to laser tuning rate fluctuations in swept-wavelength interferometry. Opt. Express 2008, 16, 13139–13149. [Google Scholar] [CrossRef] [PubMed]
- Zheng, R.Y.; Wang, C.; He, X.K.; Li, X.W. A correction method for the nonlinearity of FMCW radar sensors based on multisynchrosqueezing transform. IEEE Sens. J. 2023, 23, 609–619. [Google Scholar] [CrossRef]
- He, B.B.; Zhang, C.B.; Yang, J.C.; Chen, N.; He, X.J.; Tao, J.M.; Zhang, Z.K.; Chu, T.; Chen, Z.Y.; Xie, X.P. Massively parallel FMCW lidar with cm range resolution using an electro-optic frequency comb. Opt. Lett. 2023, 48, 3621–3624. [Google Scholar] [CrossRef] [PubMed]
- Liu, M.X.; Liu, J.C.; Gu, W.H.; Qu, X.H.; Zhang, F.M. Synchronous measurement of velocity and distance with high resolution based on comb reference common-path interferometric FMCW lidar. Opt. Lasers Eng. 2024, 176, 108076. [Google Scholar] [CrossRef]
- Silvestri, C.; Qi, X.; Taimre, T.; Rakić, A.D. Frequency combs induced by optical feedback and harmonic order tunability in quantum cascade lasers. APL Photonics 2023, 8, 116102. [Google Scholar] [CrossRef]
- Hauser, M.; Hofbauer, M. FPGA-based EO-PLL with repetitive control for highly linear laser frequency tuning in FMCW lidar applications. IEEE Photonics J. 2022, 14, 1–8. [Google Scholar] [CrossRef]
- Li, P.; Zhang, Y.T.; Yao, J.Q. Linear frequency swept laser source with high swept slope based on digital optical phase-locked loop. Opt. Commun. 2022, 525, 128860. [Google Scholar] [CrossRef]
- Zhang, J.T.; Liu, C.; Su, L.W.; Fu, X.H.; Jin, W.; Bi, W.H.; Fu, G.W. Wide range linearization calibration method for DFB laser in FMCW lidar. Opt. Lasers Eng. 2024, 174, 107961. [Google Scholar] [CrossRef]
- Zhang, X.S.; Pouls, J.; Wu, M.C. Laser frequency sweep linearization by iterative learning pre-distortion for FMCW lidar. Opt. Express 2019, 27, 9965–9974. [Google Scholar] [CrossRef] [PubMed]
- Yang, J.W.; Meng, Y.; Hu, X.L.; Yang, T.X.; Wang, Z.Y.; Jia, D.F.; Ge, C.F. High-ranging-precision FMCW lidar with adaptive pre-distortion of current injection to a semiconductor laser. J. Light. Technol. 2024, 42, 1870–1876. [Google Scholar] [CrossRef]
- Lu, C.; Yu, Z.H.; Liu, G.D. FMCW LiDAR with an FM nonlinear kernel function for dynamic-distance measurement. Opt. Express 2022, 30, 19582–19596. [Google Scholar]

| Position (mm) | (ns) | (mm) | |
|---|---|---|---|
| 0.0000 | 0.1759 | - | - |
| 198.5563 | 0.4060 | 5.7572 | 1725.9536 |
| 398.9355 | 0.6381 | 5.7574 | 1726.0380 |
| 606.7893 | 0.8790 | 5.7570 | 1725.9160 |
| 805.2120 | 1.1089 | 5.7573 | 1725.9851 |
| 1004.0833 | 1.3394 | 5.7571 | 1725.9463 |
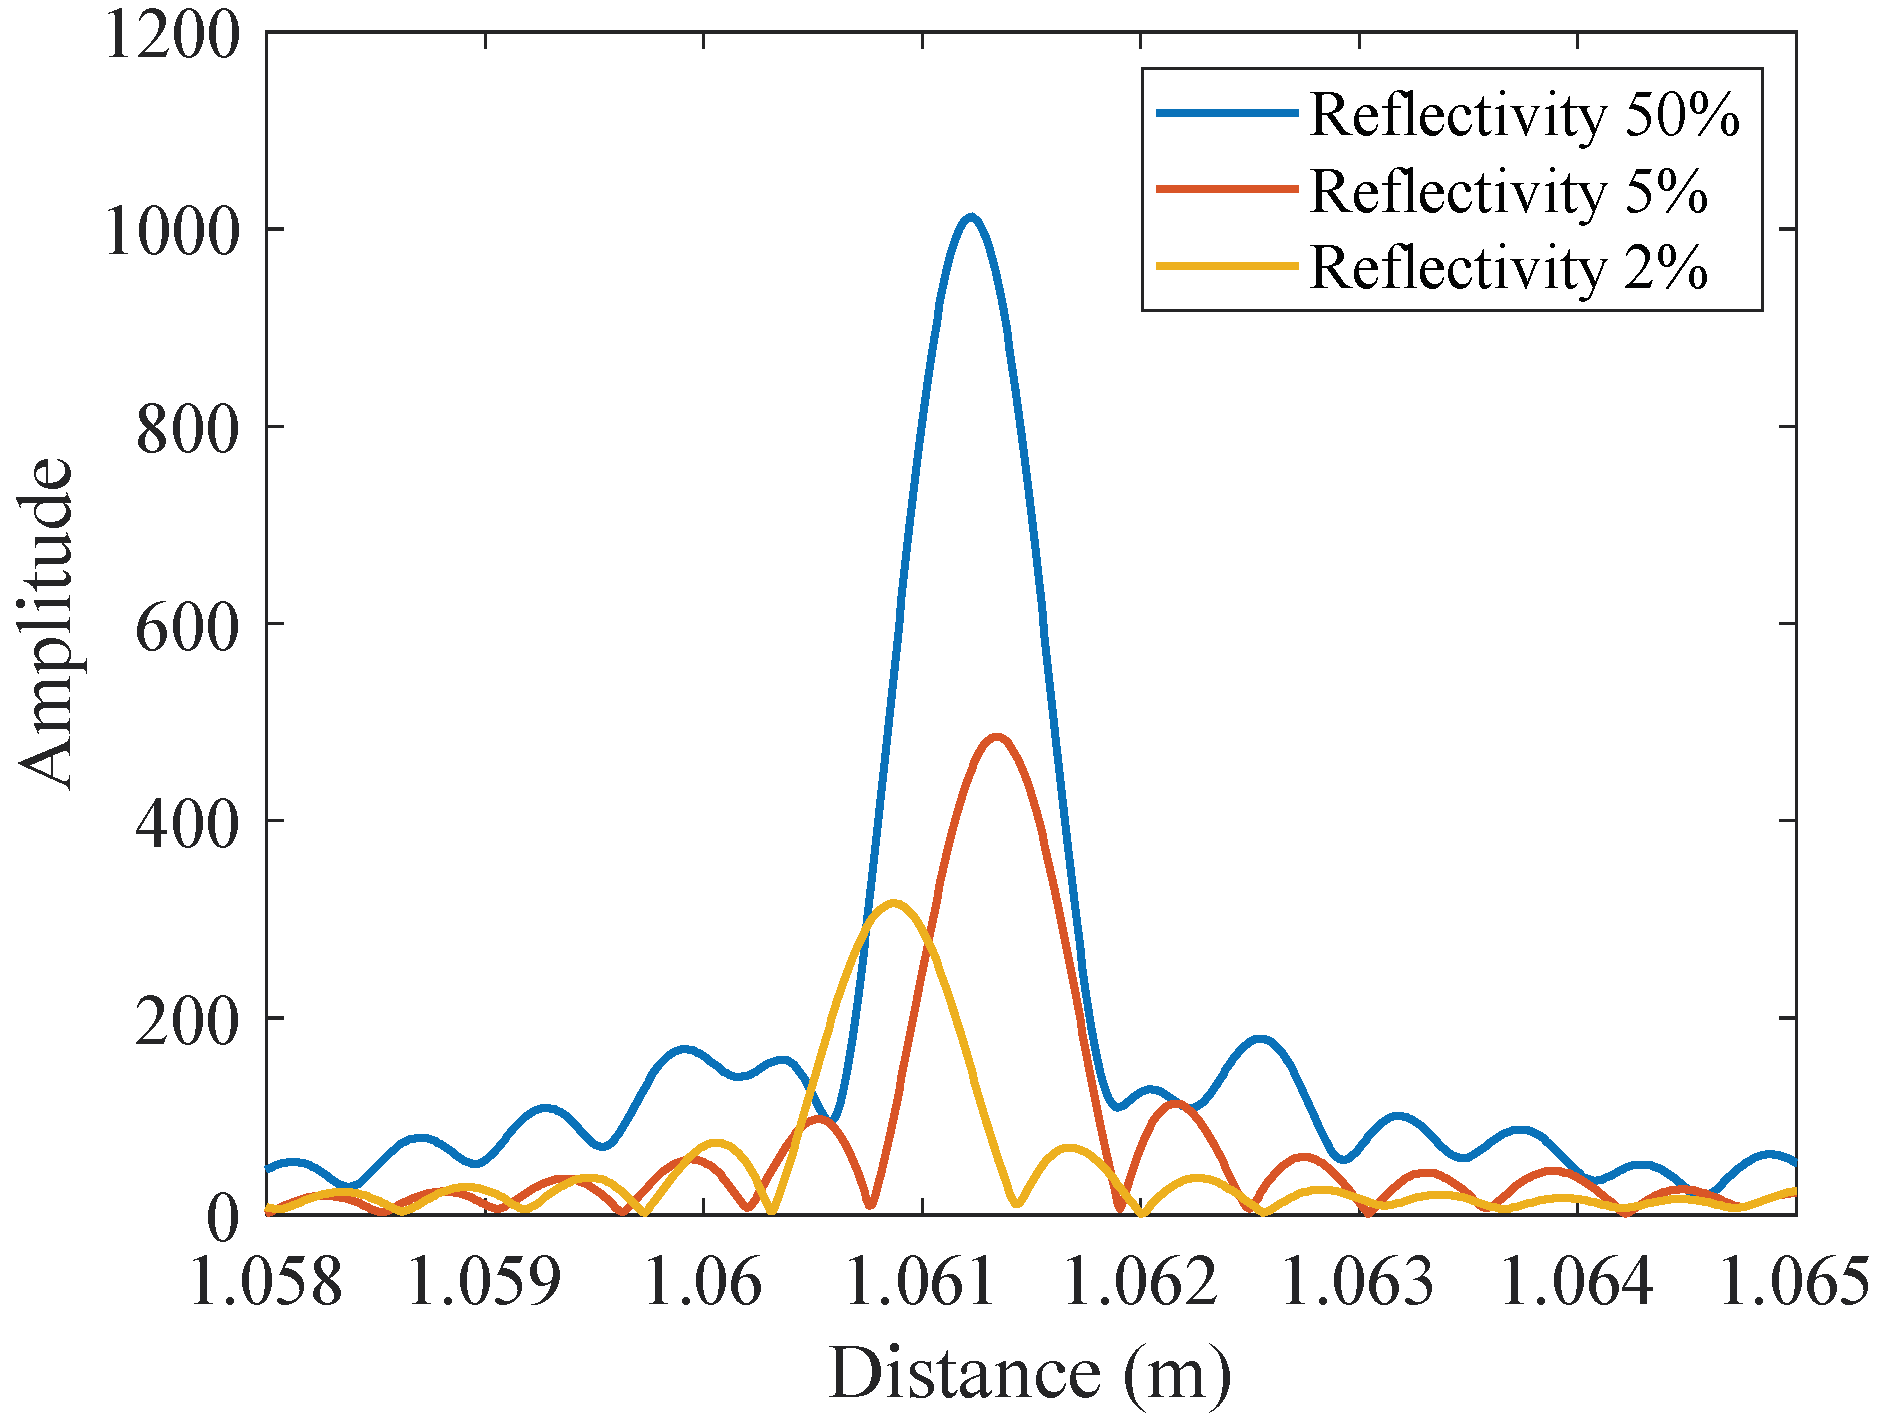
| Reflectivity | Standard Deviation (μm) |
|---|---|
| 50% | 1.710 |
| 5% | 2.999 |
| 2% | 4.228 |
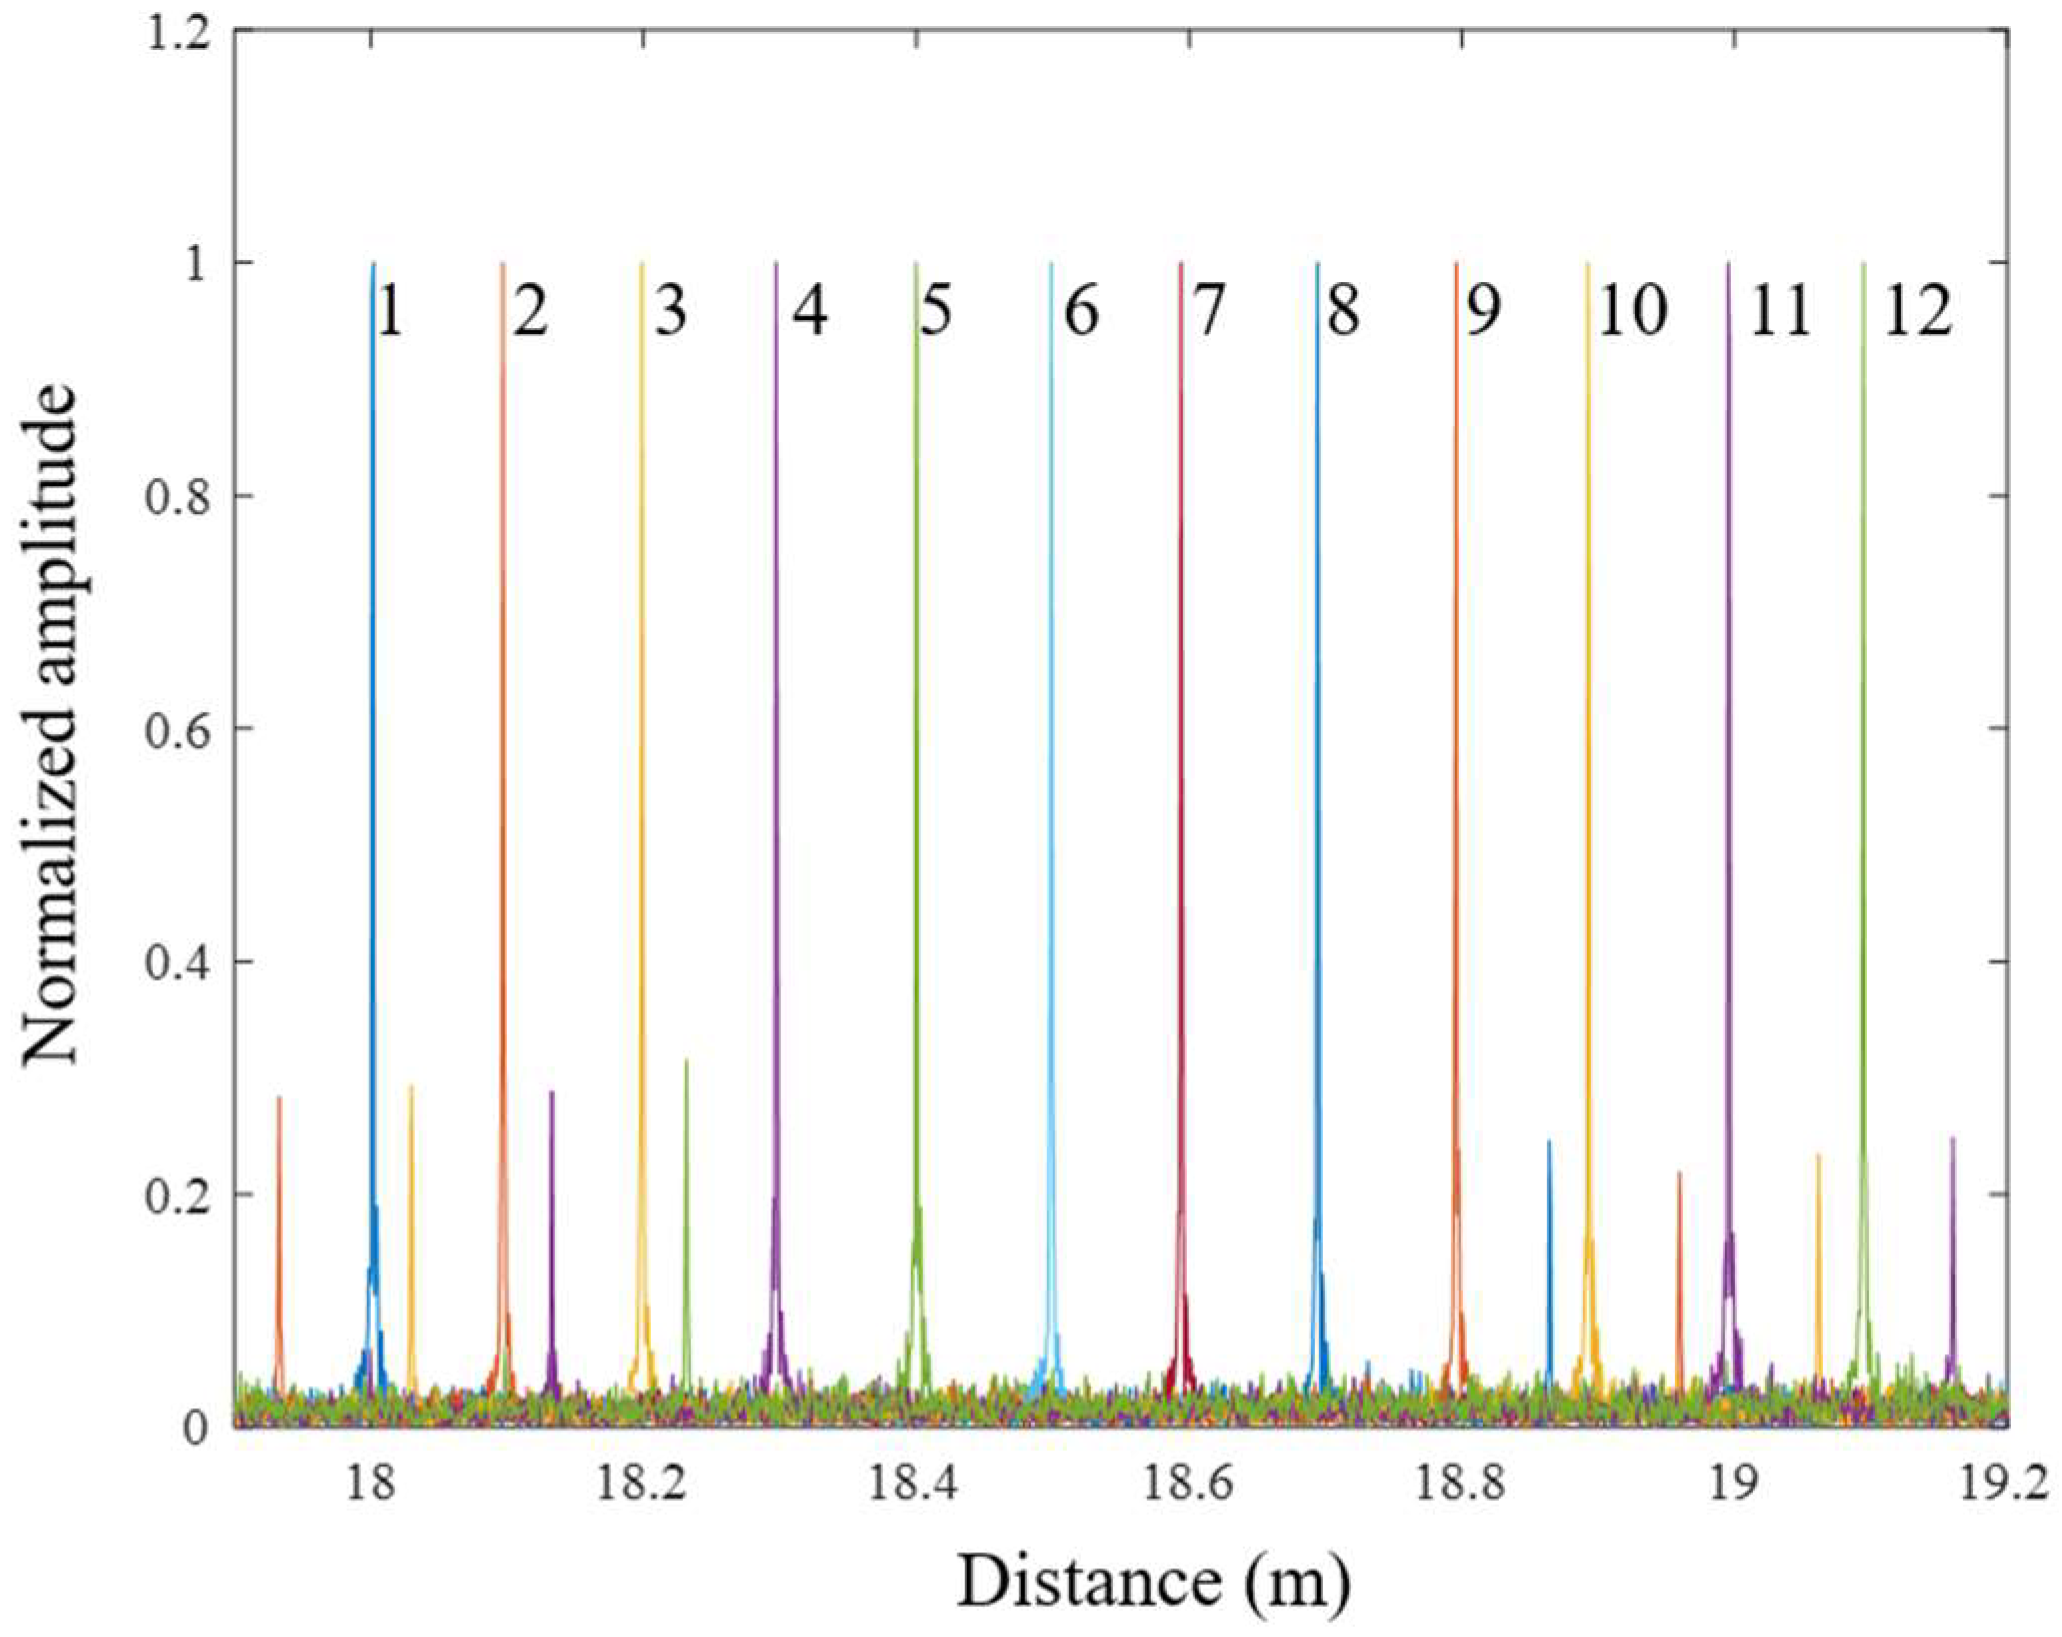
| Ordinal | Measurement Value (m) | Standard Deviation (μm) |
|---|---|---|
| 1 | 18.001 | 14.837 |
| 2 | 18.096 | 11.692 |
| 3 | 18.198 | 13.583 |
| 4 | 18.297 | 17.562 |
| 5 | 18.400 | 9.856 |
| 6 | 18.498 | 15.365 |
| 7 | 18.594 | 11.771 |
| 8 | 18.694 | 16.883 |
| 9 | 18.795 | 10.275 |
| 10 | 18.892 | 16.794 |
| 11 | 18.995 | 15.985 |
| 12 | 19.094 | 17.453 |
Disclaimer/Publisher’s Note: The statements, opinions and data contained in all publications are solely those of the individual author(s) and contributor(s) and not of MDPI and/or the editor(s). MDPI and/or the editor(s) disclaim responsibility for any injury to people or property resulting from any ideas, methods, instructions or products referred to in the content. |
© 2025 by the authors. Licensee MDPI, Basel, Switzerland. This article is an open access article distributed under the terms and conditions of the Creative Commons Attribution (CC BY) license (https://creativecommons.org/licenses/by/4.0/).
Share and Cite
Xue, T.; Liu, J.; Lu, C.; Liu, G. High Precision Range Extracting Method for FMCW LiDAR Using Semiconductor Laser Based on EO-PLL and NUDFT. Photonics 2025, 12, 466. https://doi.org/10.3390/photonics12050466
Xue T, Liu J, Lu C, Liu G. High Precision Range Extracting Method for FMCW LiDAR Using Semiconductor Laser Based on EO-PLL and NUDFT. Photonics. 2025; 12(5):466. https://doi.org/10.3390/photonics12050466
Chicago/Turabian StyleXue, Tao, Jingyang Liu, Cheng Lu, and Guodong Liu. 2025. "High Precision Range Extracting Method for FMCW LiDAR Using Semiconductor Laser Based on EO-PLL and NUDFT" Photonics 12, no. 5: 466. https://doi.org/10.3390/photonics12050466
APA StyleXue, T., Liu, J., Lu, C., & Liu, G. (2025). High Precision Range Extracting Method for FMCW LiDAR Using Semiconductor Laser Based on EO-PLL and NUDFT. Photonics, 12(5), 466. https://doi.org/10.3390/photonics12050466