Abstract
This paper presents the results of processing and systematizing data from laboratory and numerical experiments to correct the distortions of laser radiation propagating through a randomly inhomogeneous medium. The information obtained allows for an accurate estimation of the effectiveness of compensating for turbulent fluctuations in the refractive index along the beam propagation path. Experimentally derived radiation parameters were compared with corresponding values calculated using an optical system model. Limitations of the numerical simulation, stemming from inherent model constraints, were identified, as were discrepancies between experimental and theoretical results, and a reason for these discrepancies was provided.
1. Introduction
The correction of atmospheric distortions of radiation is one of the important tasks in modern optics. When correcting it, considerable attention must be paid to the study of radiation propagation in a distorting medium, which is usually carried out on the basis of numerical [1,2,3,4,5,6,7,8,9,10] and experimental methods [11,12,13].
The simulation of radiation propagation in a randomly inhomogeneous medium is frequently realized on the basis of the numerical solution of the wave equation [1,2,3,4,5,6]. Despite the considerable time that has elapsed since the initial publications in this area [1,6], researchers continue to refine numerical algorithms and models to enhance both computational speed and reliability. One example of progress in this direction is the development of parallel computing [3,4,5]. Another approach involves the use of approximate calculations, where the integral characteristics of beams (specifically, the radius) can be estimated using theoretically derived equations [7]. These calculations are computationally efficient, often taking only seconds on modern personal computers, and the results demonstrate good agreement with numerical data [7].
A different direction of investigation is the modeling of an atmospheric path in a laboratory experiment [11,12]. The importance of these methods can be explained by the possibility of regulating the conditions of radiation propagation and reproducing them from one experiment to another. Alongside theoretical investigations, we have observed significant advancements in experimental techniques [13].
However, many research teams conduct numerical, theoretical, and experimental studies independently, often without comparing or referencing their respective findings. Another problem is that comparisons are made only for individual parameters or for a narrow range of propagation conditions. For example, the authors of [14] experimentally and numerically determine how the size of the spectrometer slit affects the image quality of an astronomical object. In [15], a comparison is made for the scintillation index, and in [16], the studies are carried out under conditions of significant distortions.
The objective of this work is to demonstrate that numerical methods can be used to obtain results close to experimental data. To demonstrate this, we verify the model of the optical system, compare the results of laboratory and numerical experiments for a wide range of integral parameters (beam wandering, beam radius change, power-in-the-bucket parameter), identify limitations that arise in computational methods, and show how these limitations can be overcome.
A concise description of the laboratory experiment (with the adaptive control switched off) is provided in Section 2. Section 3.1 presents the obtained experimental results and their comparison with calculations, while Section 3.2 demonstrates the effectiveness of adaptive correction in laboratory experiments. The experimental studies were carried out at the Institute of Geosphere Dynamics. The development of the numerical model and the comparison of results were performed at the V.E. Zuev Institute of Atmospheric Optics.
2. Layout of Laboratory Experiment and Corresponding Numerical Model
An experimental setup is shown in Figure 1a and a beam propagation path is shown in the experiment in Figure 1b; more detailed information about the optical system under consideration can be found in ref. [12].
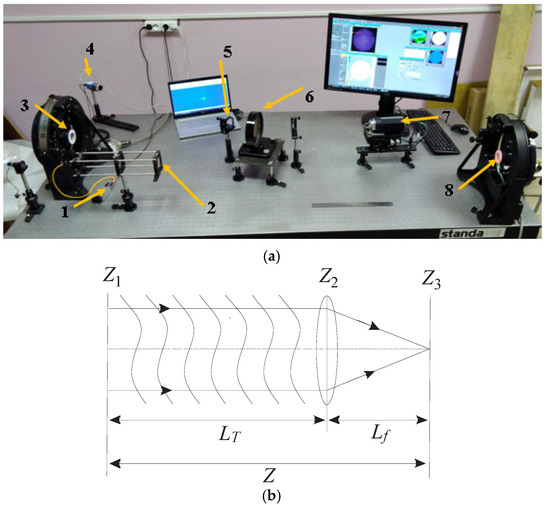
Figure 1.
Layout (a) of the laboratory experiment: a laser source (1), collimating lens (2), flexible mirror as a wavefront corrector (3), video camera (4), focusing lens (5), beam splitter (6), wavefront sensor (7), and turbulence generator (8). A schematic representation of the optical path (b).
The aperture of the laser source with a wavelength of 0.65 µm is located in plane Z1 (Figure 1b), and adaptive control of the wavefront is also implemented. A focusing lens with a focal distance of 1 m is placed in plane Z2, and radiation parameters are recorded in its focal plane Z3. The distance LT from Z1 to Z2 is about 4 m, and from Z2 to Z3 is about 1 m. At the emitting aperture Z1, the beam diameter is 5 cm.
When analyzing radiation focusing, it is advisable to indicate all distances as fractions of the diffraction length Zd = k·(a0)2, where k is the wave number and a0 is the initial radius of the beam. In the given problem, Zd = 6.04 × 10³ m, and the focal length of the lens, expressed in diffraction lengths, Lf = 1.7 × 10⁻⁴ Zd. At this distance, the lens focuses the beam into a spot with a radius of 4.1 µm, i.e., the beam radius decreases by approximately 1.6 × 10³ times. The propagation conditions described here correspond to free diffraction, whereas in the laboratory experiment, the flux of heated air was directed between planes Z1 and Z2.
In the numerical model, the optical scheme of the installation was slightly simplified (Figure 2). Since the changes in the beam size in the interval between planes Z1 and Z2 under conditions of free diffraction are practically impossible to register, these two planes were put together. Distortions were simulated by a single-phase screening position in plane Z2. The main problems of the simulation appeared in the realization of focusing. As stated above, in the experiment, the beam diameter decreased by 1.6 × 10³ times as a result of focusing. If we assume that a calculation grid with dimensions of 20 × 20 nodes is sufficient to reproduce the beam shape in the observation plane Z3, then it is necessary to use a grid in the plane of the lens with a number of nodes 3.2 × 104 × 3.2 × 104 which is quite difficult to realize on a personal computer. In this regard, in the constructed model, the distance between the lens and the observation plane and, accordingly, the focal length of the lens increased to 10 m, which made it possible to conduct the calculations on a grid with dimensions of 2048 × 2048 nodes.
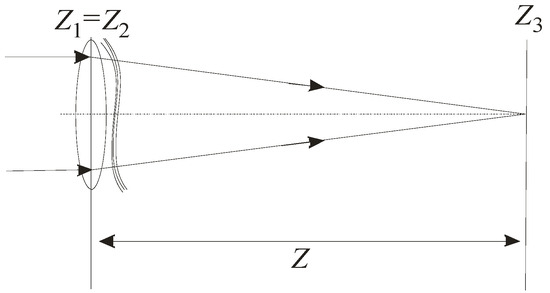
Figure 2.
Schematic of the numerical experiment.
In the model, the spectrum of fluctuations induced by the phase screen was determined by the von Karman formula as follows [17]:
Here and are spatial frequencies dependent on the inner l0 and outer L0 scales of turbulence; Cn is the structure constant of turbulence related to Fried’s coherence length by the well-known formula [18,19,20,21,22,23]. In the given geometry of the problem, the initial phase of the beam was defined by the screen and by the lens. The propagation of the beam was described by the wave equation [18,19] and solved numerically with the fast Fourier transformation [20].
As stated above, the grid available for calculations imposes restrictions on the transverse and longitudinal scales of the model. In the case under consideration, the maximum internal scale of turbulence could not be less than the distance between the nodes in the plane perpendicular to the direction of propagation, and the external scale could not be greater than the full grid size. In particular, in this problem, l0 = 0.6 mm and L0 = 1.25 m (in the laboratory experiment, inner and outer scales were not measured) while the diameter of the beam was the same as in the laboratory experiment, i.e., 2.5 cm. Also, the calculation grid did not allow for the focusing of the beam at a distance of less than 8–10 m. By changing the beam radius relative to the mesh size, the listed parameters could be improved, but not significantly. A radical method that allows one to change the parameters towards their improvement can increase the size of the grid.
In the constructed computer application, the turbulence intensity is determined by the input parameters of the model—Fried’s coherence length r0 or by the structure’s constant for turbulence . To increase the reliability of the numerical experiment, these parameters were not only specified at the input but also calculated according to the methods proposed in [17,18,21,22]. Taking into account the fact that the model completely lacked random oscillations characteristic of the optical system, a single-channel scheme was used to determine and r0, in which the structural constant was calculated as follows [18,22,23]:
and Fried’s length was also calculated as follows:
In Equations (2) and (3), is the variance of the image angular displacements, D is the beam diameter, L is the path length, and k is the wave number.
Using these formulae, we calculated the maximum possible structure constant and Fried’s coherence length in the numerical experiment as follows: m−2/3 and r0 = 15 mm; while processing the images obtained in the laboratory experiment, we obtained m−2/3 and r0 = 11 mm. Independent calculations according to the methods described in [12] gave r0 = 10 mm. All in all, the conditions of propagation in the laboratory and numerical experiment do not coincide completely but can be considered near enough to each other.
In the observation plane Z3, the amplitude distribution of the beam was characterized by the following set of parameters [24]:
Power-in-the-bucket (PIB) is calculated as follows:
This parameter is proportional to the beam power incident in an aperture of radius St. In Equation (3), P0 is the total power of the beam, I is the beam intensity, and ρ(x,y) is the aperture function: and
is an aperture function. In the laboratory experiment, the parameter St defined the size of the receiving aperture, which was equal to 0.05 mm and, in the model, was equal to 0.5 mm.
The shift in the beam gravity center (this parameter characterizes the beam wander) can be calculated as follows:
The effective radius of the beam is calculated as follows:
3. Obtained Results
3.1. Propagation of a Beam in an Open-Loop Adaptive System. Comparison of Results Obtained in Laboratory and Numerical Experiments
The analysis of the laboratory experiment results and their comparison with data from numerical calculations were performed through the computer processing of a digital video recording of the beam’s image in plane Z3. The image was captured before the adaptive correction was activated, and 100 frames were included in the analysis, although the recording was longer. Figure 3a shows an example of a frame from the recording (the exact image registered in the experiment), which had a size of 2.7 × 2.0 mm. The intensity distribution in this figure occupied a very small area, so the initial step in image processing was scaling the amplitude distribution (Figure 3b).
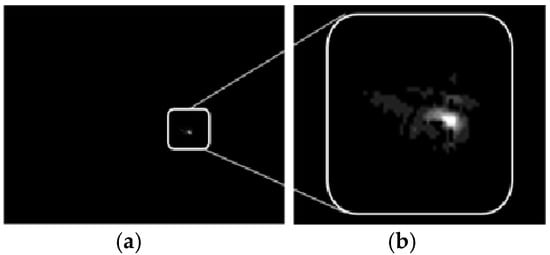
Figure 3.
Image of the beam registered by a video camera (a) and the zoomed area of the frame (b).
A visual comparison of the intensity distribution recorded by the video camera and calculated in the numerical experiment revealed a correspondence between the results (Figure 4). A similar comparison was also conducted by the authors of ref. [7] for a single realization of a random refractive index distribution along the propagation path. While the images are similar in both cases (in ref. [7] and in this paper), it is important to note that drawing conclusions about the nature of the random process based on a single realization is not possible. Therefore, further analysis should be carried out on a larger sample. Such an analysis is carried out in this study.
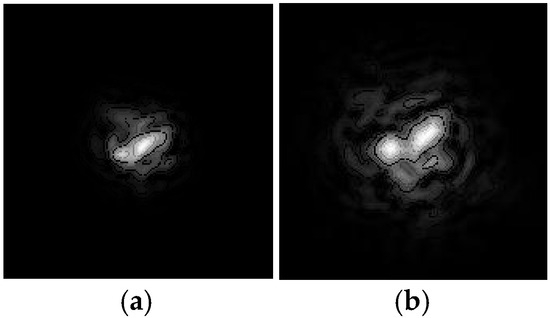
Figure 4.
Random amplitude distribution obtained in laboratory (a) and in numerical (b) experiments.
To calculate the parameters specified by Equations (4)–(6), it was necessary to introduce a coordinate system; at the initial stage of the calculations, its origin was placed in the center of the frame (Figure 5). With such a system, it became possible to determine the displacement of the beam gravity center (Equation (5)) and its effective radius (Equation (6)).
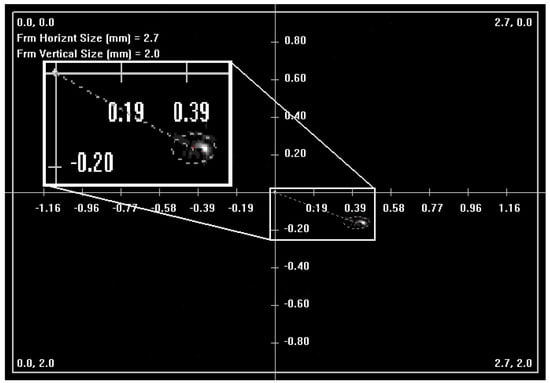
Figure 5.
The Cartesian coordinate system is introduced with the origin in the center of the frame. The area occupied by the beam is enlarged. The dotted line shows the shift in the beam’s gravity center in the given system.
Graphs characterizing variations in the value of the radius REff in numerical and laboratory experiments are shown in Figure 6. Despite the fact that the parameters of experiments in both cases were selected to be approximately the same, we observed significant differences in the results. The calculated beam radius (Figure 6a) was notably larger than that experimentally (Figure 6b), which can be explained by the increase in the distance from Z2 to Z3 in the model and, correspondingly, the increase in the focal length of the lens. As noted above, the implementation of sharper focusing was not possible due to the limitations of the calculation grid. Another difference, visible without additional calculations, is the higher frequency of REff oscillations recorded in the numerical experiment.
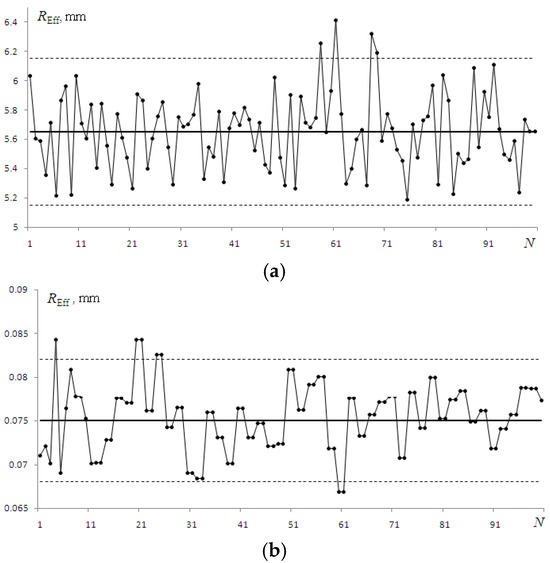
Figure 6.
The beam energy radius REff was determined numerically (a) and obtained in the laboratory experiment (b). N is a frame number. The solid straight line shows the mean value, and the dashed lines demonstrate the confidence interval.
When determining the power-in-the-bucket parameter (Equation (6)) in the coordinate system shown in Figure 5, all 100 realizations yielded values very close to zero. This feature is related to the fact that the parameter was calculated in the center of the frame, as can be seen in Figure 5, at a point from which the beam was shifted by a fairly large distance. To solve the problem, the average beam displacement rc was calculated in the given coordinate system; then, the origin of the system was shifted to the obtained point (Figure 7). Even a visual comparison of Figure 5 and Figure 7 shows that after this operation, the intensity distribution was located at a significantly smaller distance from the origin.
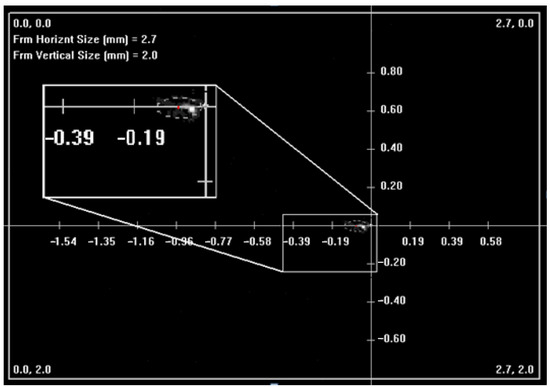
Figure 7.
The coordinate system introduced relatively to the point of average beam displacement.
Oscillations of the parameters rc and J calculated numerically and recorded in the experiment with the adaptive control switched off are shown in Figure 8 and Figure 9.
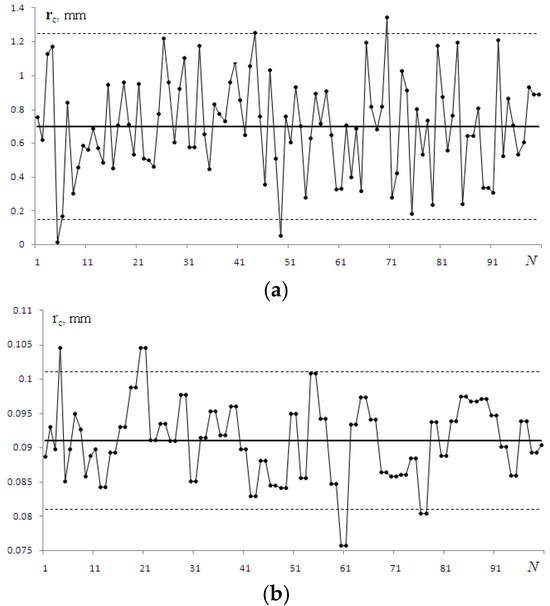
Figure 8.
Shift in the beam energy center rc registered in numerical (a) and laboratory (b) experiments.
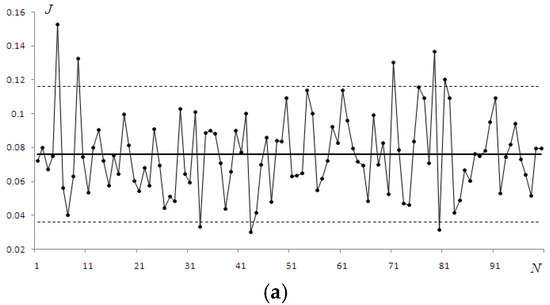
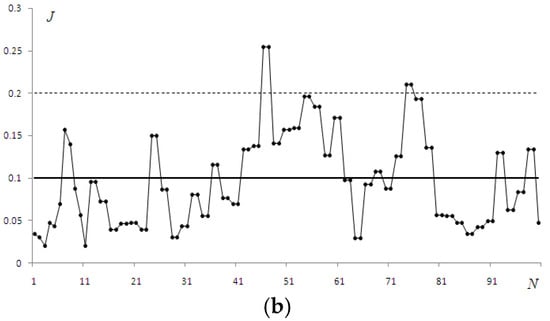
Figure 9.
PIB parameter J obtained numerically (a) and in the laboratory experiment (b).
Again, we observed significant differences in the average values of parameters, especially for rc. The explanations are the same: limitations were introduced by the dimensions of the computational grid and the corresponding increase in the focal length of the lens. A much smaller difference was observed between the values of the PIB (Equation (4)); here, the decrease was achieved by choosing the aperture diameter within which the parameter was calculated.
3.2. Assessment of Beam Control Effectiveness in the Laboratory Experiment
The quality of adaptive control obtained in the experiment is illustrated in Figure 10. As is seen, the brightness of the image before correction is weaker (Figure 10a), and the beam is shifted from the origin of the coordinate system. After correction, the beam is positioned exactly in the center of the system (Figure 10b).
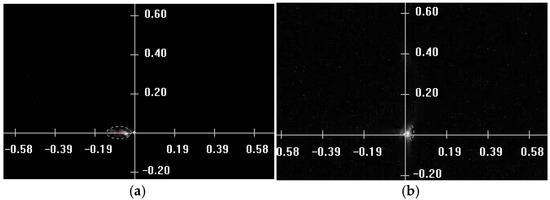
Figure 10.
Image of the beam before (a) and after (b) adaptive correction for distortion.
The quantitative results are given in Figure 11. The graphs demonstrate a decrease in the effective beam radius (Figure 11a), the smaller wandering of the beam’s energy center (Figure 11b) in the coordinate system introduced in Figure 7, and an increase in the power-in-the-bucket parameter (Figure 11c). To analyze in detail the effectiveness of adaptive control, we needed to compare Figure 6b and Figure 11a, Figure 8b and Figure 11b, and Figure 9b and Figure 11c. The results show that a significant increase in the quality of radiation in the observation plane Z3 was obtained as a result of the correction, although in some cases, the breakdowns in control occurred in the adaptive system. This feature is exceptionally noticeable in Figure 10a, where data characterizing changes in the effective radius are presented. At some stages of the control, the values of this parameter differed significantly from the average and even went beyond the confidence interval (when calculating Student’s distribution [25], the probability of falling within the interval was chosen to be 95%). At control failure, values of REff do not increase but decrease, i.e., the focusing of the beam increases.
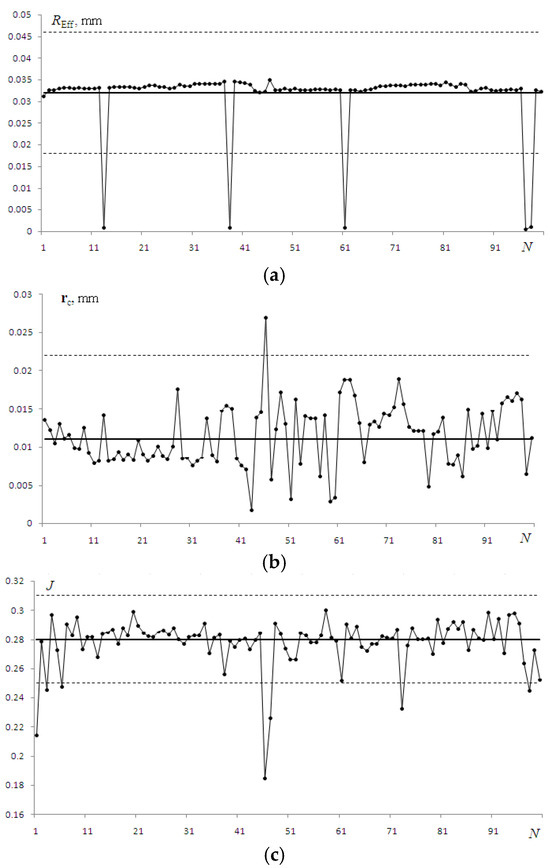
Figure 11.
Results of adaptive correction for turbulent distortions: effective beam radius (a), shift in energy center (b), and PIB (c).
The systematized data obtained in laboratory and numerical experiments are presented in the Table 1.

Table 1.
Rows 1, 2, and 4 contain the values recorded in the laboratory experiment; row 3 contains the results of the numerical simulation. The conditions of the experiment are as follows: the control is switched off, and the center of the coordinate system coincides with the frame center (row 1); the control is switched off, and the center of the coordinate system coincides with the average values of the displacements calculated in the first variant (row 2); the numerical calculation of parameters is performed, and the control is switched off (row 3); and the control is on, and the center of the coordinate system corresponds to variant 2 (row 4).
Rows 1 and 2 show that due to the change in the coordinate system’s origin, the shift in the beam energy center rc significantly decreased, but at the same time, the confidence interval and, consequently, the variance of this parameter did not change. Naturally, the effective radius rc as an invariant to the position of the coordinate system remained unchanged. The data in the table also show that changes in the origin of the coordinate system make the calculation of PIB possible, which was equal to zero before this operation.
Lines 2 and 3 allow us to compare the data obtained in laboratory and numerical experiments when the adaptive control is not performed. The significant discrepancy between the results is obvious and is especially noticeable for rc and REff but less so for the parameter J. As was already noted, this is due to the fact that in the numerical experiment, we could not implement sufficiently sharp focusing of the beam or ensure a small distance between the lens plane and the observation plane.
As a result of wavefront control, the average shift in the beam energy center was reduced by 9 times, the energy radius by 2.5 times, and the power-in-the-bucket parameter increased by 3 times.
4. Conclusions
The data presented in this paper demonstrate that a detailed analysis of the laboratory experiment is possible as a result of the mathematical processing of the beam image. As was shown, the experiment demonstrates the high efficiency of beam control in the adaptive system. The discrepancy between the experimental and theoretical results was also noted. The indicated discrepancy can be explained by the insufficient resolution of the grid introduced into the numerical model, i.e., limitations caused by the finite volume of a computer’s random-access memory. Nonetheless, numerical experiments provide general information about beam distortions along the propagation path and allow us to evaluate typical changes in its radius, the displacements of the centroid, and reductions in energy characteristics (PIB).
Author Contributions
Conceptualization, software development, and original draft preparation were performed by F.K. Laboratory experiments were performed by A.R. and I.G. Calculations and analysis of the results were performed by J.S. and I.V. All authors have read and agreed to the published version of the manuscript.
Funding
This research was funded by the Russian Science Foundation (project No. 20-19-00597).
Institutional Review Board Statement
Not applicable.
Informed Consent Statement
Not applicable.
Data Availability Statement
Data is contained within the article.
Conflicts of Interest
The authors declare no conflicts of interest.
References
- Fleck, J.; Morris, J.; Feit, M. Time-dependent propagation of high energy laser beams through the atmosphere. Appl. Phys. A 1976, 10, 129–141. [Google Scholar]
- Marchuk, G.I. Methods of Numerical Mathematics, 2nd ed.; Springer: Berlin, Germany; New York Inc.: New York, NY, USA, 1982; 510p. [Google Scholar]
- Konyaev, P.A.; Tartakovskii, V.E.; Filimonov, G.A. Computer simulation of optical wave propagation with the use of parallel programming. Atmos. Ocean. Opt. 2011, 24, 425–431. [Google Scholar] [CrossRef]
- Konyaev, P.A.; Lukin, V.P. Computational algorithms for simulations in atmospheric optics. Appl. Opt. 2016, 55, B107–B112. [Google Scholar] [CrossRef] [PubMed]
- Konyaev, P.A. Computer simulation of adaptive optics for laser systems in atmospheric applications. Avtometriya 2012, 2, 12–19. [Google Scholar] [CrossRef]
- Martin, J.; Flatte, S.M. Intensity images and statistics from numerical simulation of wave propagation in 3-D random Media. Appl. Opt. 1988, 27, 2111–2126. [Google Scholar] [CrossRef] [PubMed]
- Konyaev, P.; Kanev, F. Comparison of analytical and numerical estimations of laser beam spreading in turbulent atmosphere. In Proceedings of the XXV International Symposium Atmospheric and Ocean Optics (AOO19), Novosibirsk, Russia, 1–5 July 2019; Volume 11208. [Google Scholar]
- Yan, H.X.; Li, S.S.; Zhang, D.L.; Chen, S. Numerical simulation of an adaptive optics system with laser propagation in the atmosphere. Appl. Opt. 2000, 39, 3023–3031. [Google Scholar] [CrossRef] [PubMed]
- Britton, M.C. Numerical simulations of single conjugate adaptive optics systems. In Proceedings of the SPIE Astronomical Telescopes + Instrumentation, Glasgow, UK, 21–25 June 2004; Volume 5490, pp. 609–616. [Google Scholar] [CrossRef]
- Jasim, S.U.; Hassan, R.N. Investigation of numerical simulation for adaptive optics system. Iraqi J. Phys. 2023, 21, 9–23. [Google Scholar] [CrossRef]
- Kiselev, V.; Berchenko, E.; Filatov, A.; Konyaev, P.; Lavrinova, L.; Lukin, V. Simulator of wave front phase distortions. Photonics 2014, 46, 34–49. [Google Scholar]
- Rukosuev, A.L.; Belousov, V.N.; Nikitin, A.N.; Sheldakova, Y.V.; Kudryashov, A.V.; Bogachev, V.A.; Volkov, M.V.; Garanin, S.G.; Starikov, F.A. Smart adaptive optical system for correcting the laser wavefront distorted by atmospheric turbulence. Quantum Electron. 2020, 50, 707–709. [Google Scholar] [CrossRef]
- Weyrauch, T.; Vorontsov, M.A.; Carhart, G.W.; Beresnev, L.A.; Rostov, A.P.; Polnau, E.E.; Liu, J.J. Experimental demonstration of coherent beam combining over a 7 km propagation path. Opt. Lett. 2011, 36, 4455–4457. [Google Scholar] [CrossRef] [PubMed]
- Zheng, L.; Rao, C.; Gu, N.; Qiu, Q. The influence of filter slit on the imaging performance of the solar grating spectrometer based on adaptive optics. Opt. Photonics J. 2015, 5, 303–311. [Google Scholar] [CrossRef]
- Mudge, K.A.; Silva, D.; Clare, B.A.; Grant, K.J.; Nener, B.D. Scintillation index of the free space optical channel: Phase screen modelling and experimental results. In Proceedings of the 2011 International Conference on Space Optical Systems and Applications (ICSOS), Santa Monica, CA, USA, 11–13 May 2011. [Google Scholar]
- Vorontsov, M.A.; Polnau, E. A framework for iterative phase retrieval technique integration into atmospheric adaptive optics—Part I: Wavefront sensing in strong scintillations. Photonics 2024, 11, 786. [Google Scholar] [CrossRef]
- Rytov, S.M.; Kravtsov, Y.A.; Tatarskii, V.I. Principles of Statistical Radiophysics 4: Wave Propagation Through Random Media; Springer: Berlin, Germany, 1989; 198p. [Google Scholar]
- Polynkin, P.; Peleg, A.; Klein, L.; Rhoadarmer, T.; Moloney, J. Optimized multiemitter beams for free-space optical communications through turbulent atmosphere. Opt. Lett. 2007, 32, 885–887. [Google Scholar] [CrossRef] [PubMed]
- Tyson, R.K.; Frazier, B.W. Principles of Adaptive Optics, 5th ed.; CRC Press: Boca Raton, FL, USA, 2022; 356p. [Google Scholar] [CrossRef]
- Hillerkuss, D.M.; Winter, M.; Teschke, M.; Marculescu, A.; Li, J.; Sigurdsson, G.K.; Worms, S.; Ezra, B.; Narkiss, N.; Freud, W.; et al. Simple all-optical FFT scheme enabling Tbit/s real-time signal processing. Opt. Expr. 2010, 18, 9324–9340. [Google Scholar] [CrossRef] [PubMed]
- Antoshkin, L.V.; Botygina, N.N.; Emaleev, O.N.; Lavrinova, L.N.; Lukin, V.P. Differential optical meter of the parameters of atmospheric turbulence. Atmos. Ocean. Opt. 1998, 11, 1046–1050. [Google Scholar]
- Borzilov, A.G.; Gritsuta, A.N.; Konyaev, P.A.; Lukin, V.P.; Nosov, V.V.; Soin, E.L.; Torgaev, A.V. Image jitter meter for low intensity radiation. In Proceedings of the 28th International Symposium on Atmospheric and Ocean Optics: Atmospheric Physics, Tomsk, Russia, 4–8 July 2022; p. 12341. [Google Scholar]
- Sarazin, M.; Roddier, F. The ESO differential image motion monitor. Astron. Astrophys. 1990, 227, 294–300. [Google Scholar]
- Kanev, F.Y.; Makenova, N.A.; Veretekhin, I.D. Development of singular points in a beam passed phase screen simulating atmospheric turbulence and precision of such a screen approximation by Zernike polynomials. Photonics 2022, 9, 285. [Google Scholar] [CrossRef]
- Rouaud, M. Probability, Statistics and Estimation; Creative Commons Attribution-NonCommercial; Boudiguen, France, 2013; 181p, Available online: https://www.google.com/url?sa=t&source=web&rct=j&opi=89978449&url=https://www.incertitudes.fr/book.pdf&ved=2ahUKEwjXp_Dq2eOLAxWUgv0HHb1TMTwQFnoECBcQAQ&usg=AOvVaw0g5ovM8jJBYB5bbugNBOej (accessed on 16 February 2025).
Disclaimer/Publisher’s Note: The statements, opinions and data contained in all publications are solely those of the individual author(s) and contributor(s) and not of MDPI and/or the editor(s). MDPI and/or the editor(s) disclaim responsibility for any injury to people or property resulting from any ideas, methods, instructions or products referred to in the content. |
© 2025 by the authors. Licensee MDPI, Basel, Switzerland. This article is an open access article distributed under the terms and conditions of the Creative Commons Attribution (CC BY) license (https://creativecommons.org/licenses/by/4.0/).