Article

Design of an Aperiodic Optical Phased Array Based on the Multi-Strategy Enhanced Particle Swarm Optimization Algorithm

1
Wuhan National Laboratory for Optoelectronics and School of Optoelectronic Science and Engineering, Huazhong University of Science and Technology, Wuhan 430074, China
2
Wuhan Research Institute of Posts and Telecommunications, Wuhan 430074, China
3
Optics Valley Laboratory, Wuhan 430074, China
*
Author to whom correspondence should be addressed.
Photonics 2025, 12(3), 210; https://doi.org/10.3390/photonics12030210
Submission received: 19 January 2025 / Revised: 20 February 2025 / Accepted: 26 February 2025 / Published: 27 February 2025
(This article belongs to the Section Lasers, Light Sources and Sensors)

Abstract

:
We have proposed a multi-strategy enhanced particle swarm optimization (PSO) algorithm to optimize the antenna spacing distribution of an optical phased array (OPA). The global search capability is improved by incorporating circle chaotic mapping initialization and an updated strategy based on adaptive inertia weights and dynamic learning factors. We used the peak side-lobe level (PSLL) at different steering angles as the fitness function, which effectively suppresses the rapid degradation of PSLL during scanning. Based on this approach, 32- and 64-channel aperiodic OPAs were designed with a scanning range of ±60°, with improvements of the PSLL of 1.94 and 2.05 dB at 60°, respectively. In addition, the analytical and numerical simulation results are in good agreement. We also analyzed the influence of spacing deviations on PSLL and found that the obtained OPAs exhibit sufficient robustness.

1. Introduction

Solid-state light detection and ranging (LiDAR) is a laser radar solution that does not require mechanical beam steering systems. Among various approaches, optical phased arrays (OPAs) are considered a promising solid-state laser scanning method due to their high precision, fast response, and strong reliability [1]. With the continuous advancement of semiconductor integration processes, waveguide-integrated OPAs have gained significant attention for their advantages of miniaturization and low cost [2,3].
Achieving a large field of view and low side-lobe level in OPAs has always been challenging. Due to fabrication limitations and waveguide coupling effects, achieving antenna spacing below half a wavelength in the OPA emission region is difficult. This results in grating lobes with high intensity in the far field, which not only disperse radiation power at target steering angles but also severely limit the OPA’s scanning range. Aperiodic antenna arrays provide another solution to avoid grating lobes [4,5,6,7,8,9]. Search algorithms such as the genetic algorithm (GA) [8,10,11,12] and particle swarm optimization (PSO) [4,13,14,15,16,17] have been used to design aperiodic antenna arrays. Additionally, most studies use the peak side-lobe level (PSLL) at the steering angle of 0° as the fitness function, leading to a rapid increase in side-lobe level and background noise during scanning. In [18], an aperiodic OPA was reported, with a PSLL of 20.05 dB at 0°, rapidly decreasing to 15.41 dB at 60°. In [19], the PSLL of the aperiodic OPA decreases from 8.9 dB to 2 dB over a 150° scanning range. It is evident that suppressing the PSLL degradation during large-angle scanning is essential.
In this work, we have proposed a multi-strategy enhanced particle swarm optimization algorithm by introducing a circle chaotic mapping initialization strategy and an update strategy based on adaptive inertia weights and dynamic learning factors to improve the algorithm’s global search capability. We used the enhanced PSO algorithm and the PSLL at different steering angles as the fitness function to search for the optimal antenna spacing distributions of aperiodic OPAs with 32 and 64 channels. Numerical simulations show that the results are in good agreement with the analytical simulations. As a result, a high-performance 64-channel aperiodic OPA was designed. Additionally, we analyzed the impact of spacing deviations on PSLL. The simulation results show that the aperiodic OPAs exhibit high robustness to spacing deviations. This study provides valuable insights into the practical applications of OPAs in LiDAR and free-space optical communication.

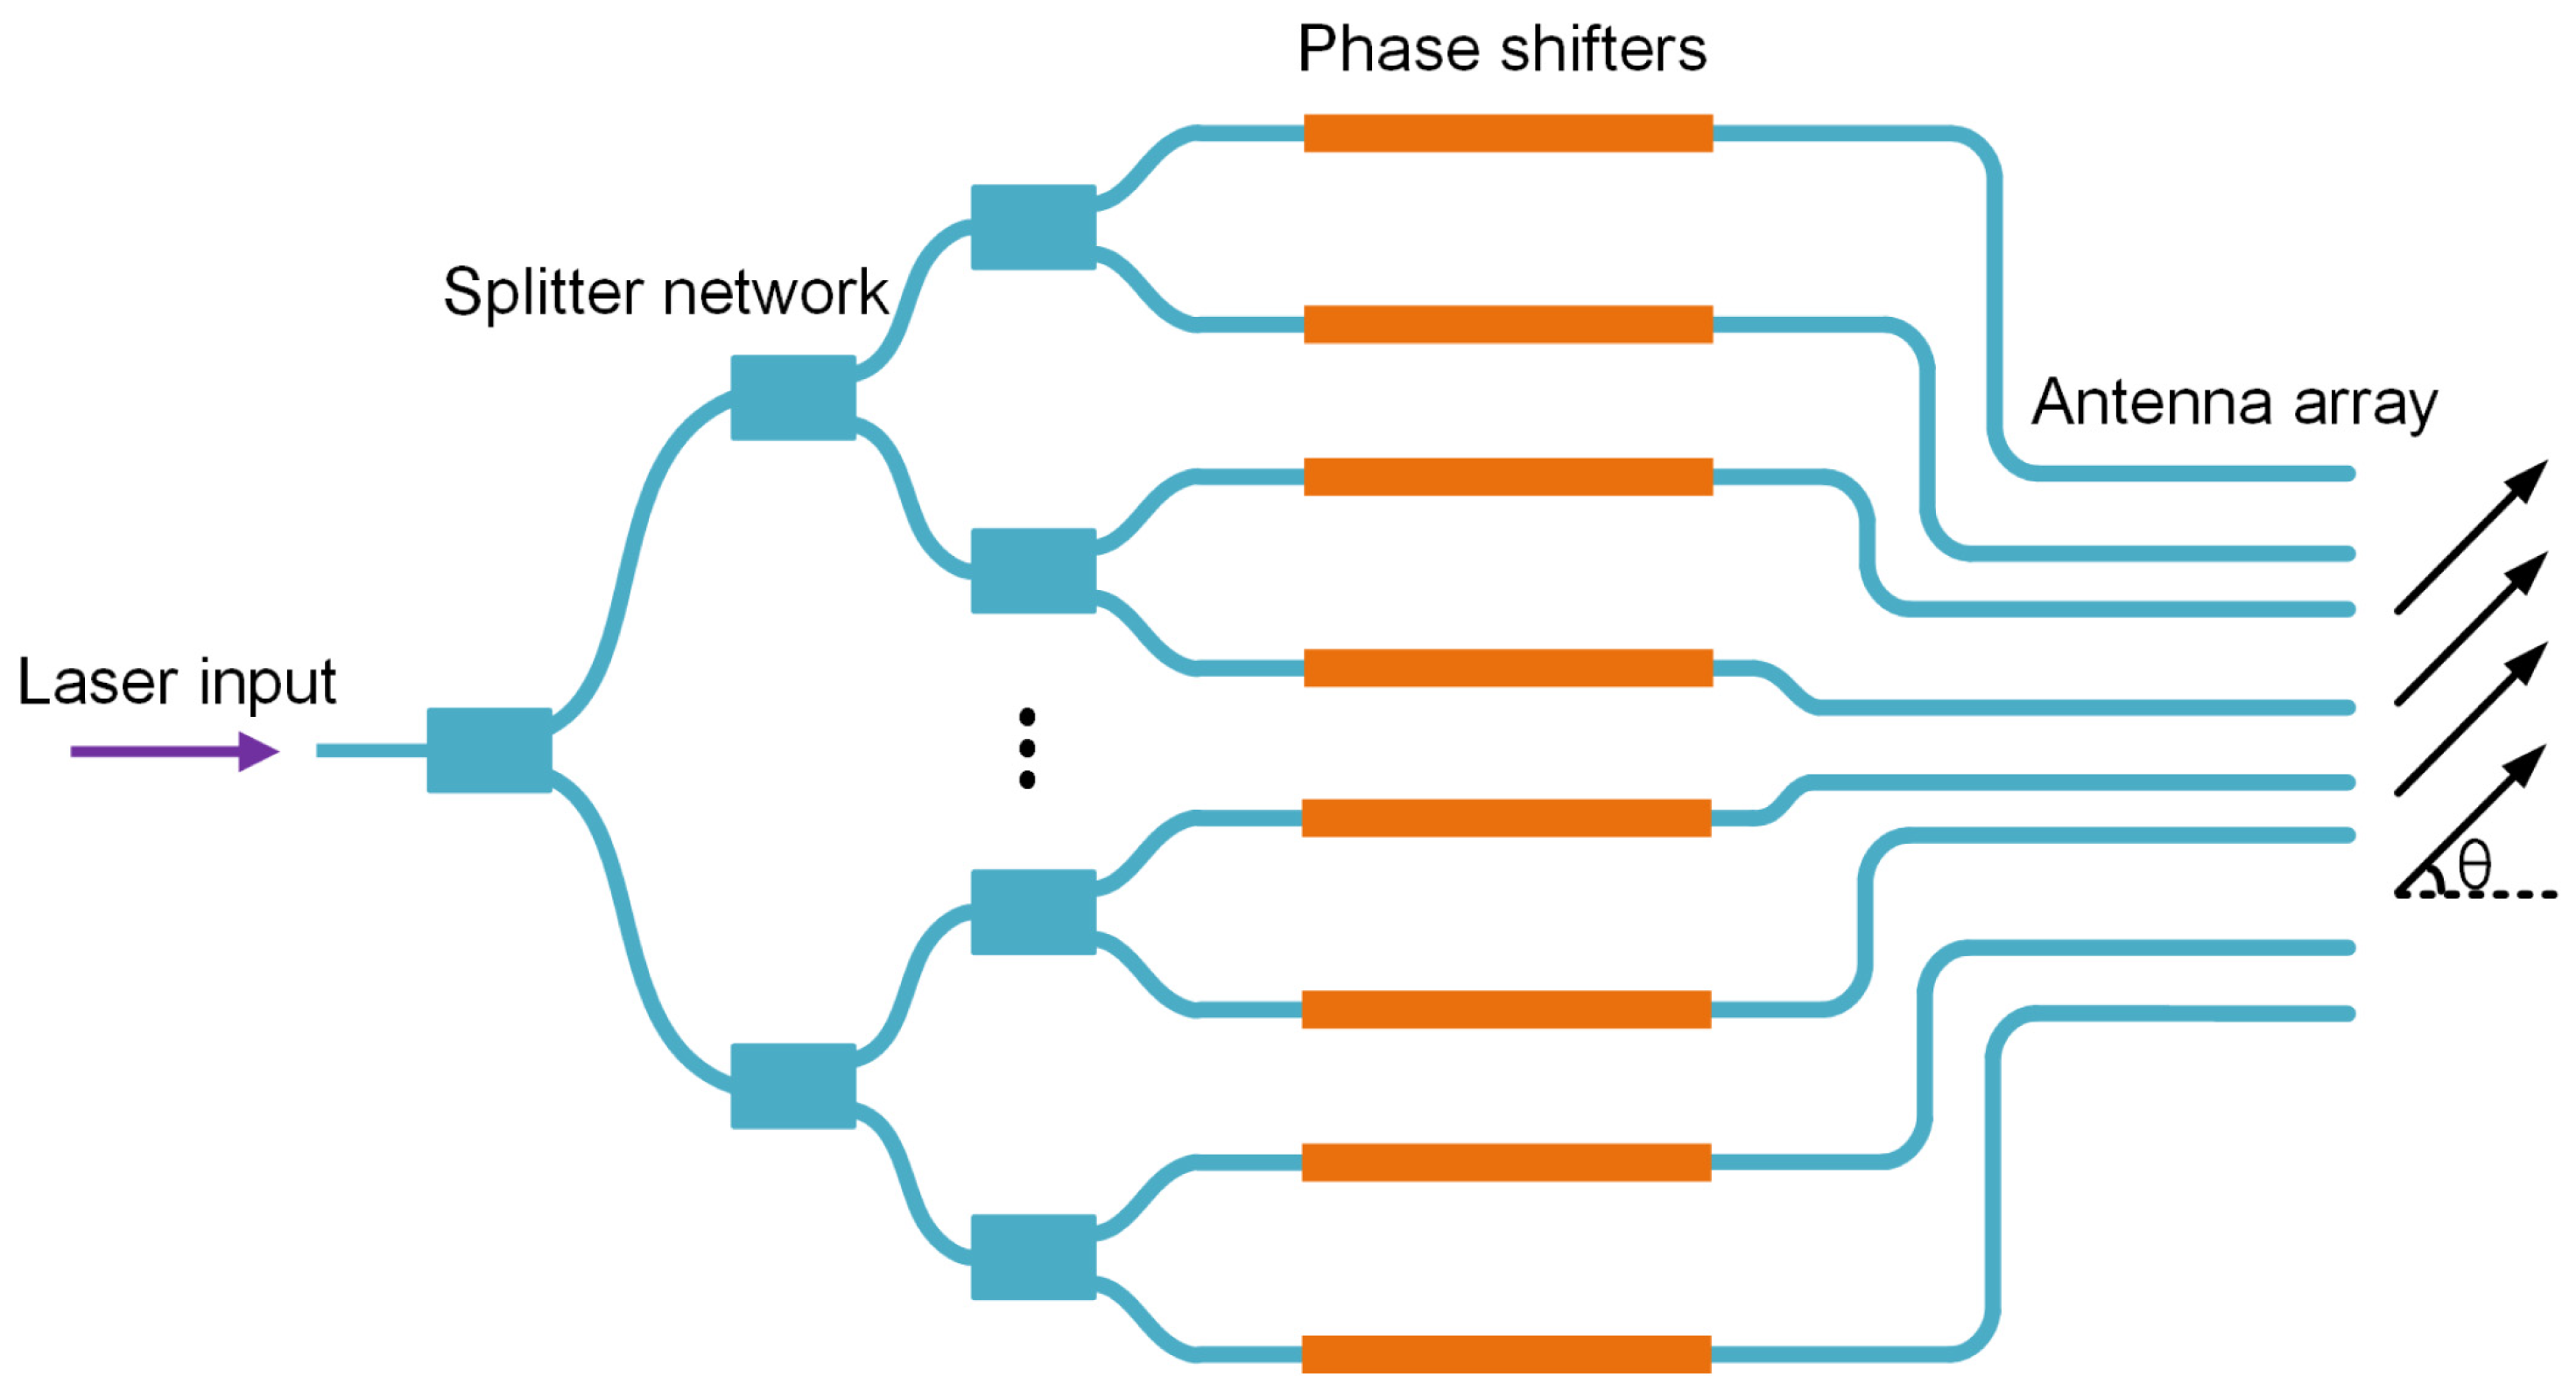
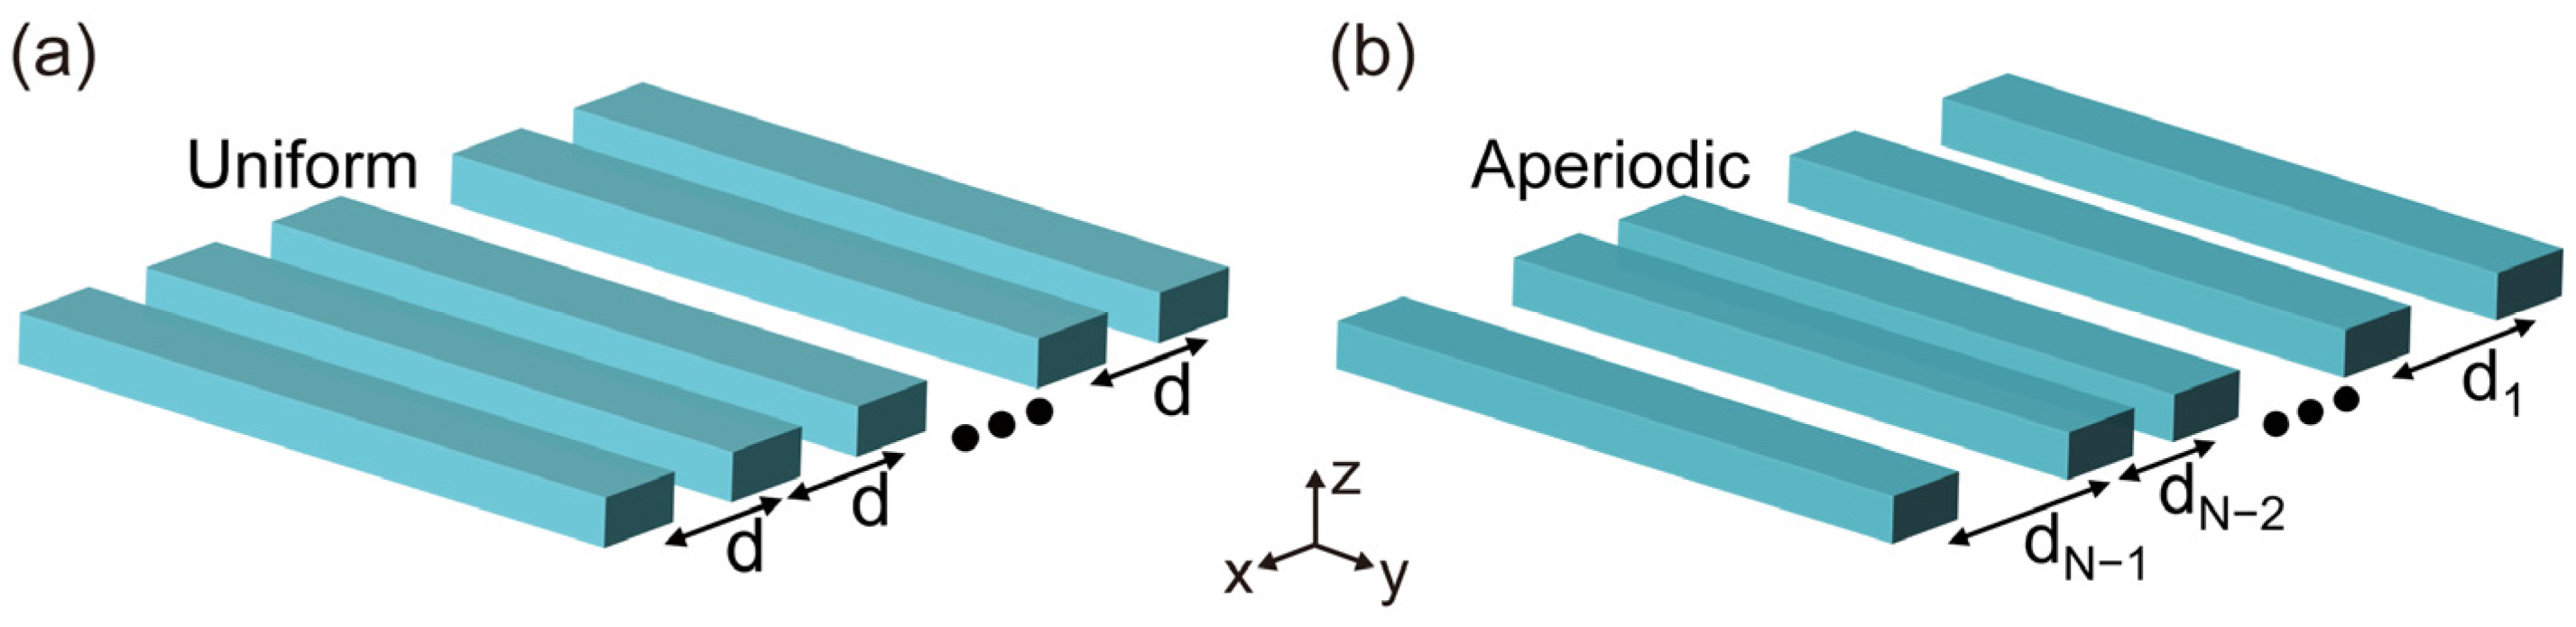
2. Principle of the Aperiodic OPA

A schematic diagram of a one-dimensional (1D) OPA with an aperiodically spaced antenna array is shown in Figure 1. The input laser is divided into N independent paths by a splitter network. Each optical signal is modulated by a phase shifter and transmitted to an antenna array with a fixed spacing of d. Finally, the waveguide antennas radiate the signals into free space, where they interfere at the target steering angle, forming a resolvable pattern in the far field.
The scanning range of a uniform OPA is determined by the position of the grating lobes. The intensity of the grating lobes becomes equal to that of the main lobe at a certain position during scanning. As the steering angle continues to increase, the grating lobe intensity surpasses the main lobe, causing the main lobe to become unrecognizable. A feasible and effective approach is to design aperiodic OPAs by disrupting the uniform antenna arrangement. As shown in Figure 2, the transition from a uniform to an irregular configuration prevents grating lobes from satisfying the conditions for coherent constructive interference, thereby suppressing unwanted grating lobes and enhancing beam scanning performance. The waveguide of each antenna is based on the silicon-on-insulator platform in this work, with a width of 0.5 µm and a thickness of 0.22 µm. Considering the array aperture size and waveguide coupling, we set the minimum spacing dmin of the aperiodic OPA to 2 μm (1.29λ) and the maximum spacing dmax to 5 μm (3.23λ).
The total electric field intensity of an aperiodic OPA is expressed as
E ( θ ) = f ( θ ) n = 1 N A n exp j k i = 1 n 1 d i ( sin θ sin θ s )
f ( θ ) = sin α α
α = π a sin θ λ
where f(θ) is the element factor of a single antenna, N is the number of channels, An is the amplitude of n-th antenna, assumed to be 1, j is the imaginary unit, k = 2π/λ is the wave vector, di represents the spacing between the i-th antenna and the (i+1)-th antenna, θ and θs represent the observation angle and the steering angle, respectively, a is the waveguide width of the antenna, and λ is the wavelength of the input laser. The intensity distribution is expressed as
I ( θ ) = E ( θ ) E ( θ ) = E ( θ ) 2
To illustrate the grating lobe suppression effect, we use 16-channel OPAs. The aperiodic OPA uses a set of random values between dmin and dmax for the spacing arrangement, while the uniform OPA uses the average of these random values as the spacing. Thus, both OPAs have the same aperture size. The spacing distributions are shown in Figure 3a,d; the normalized far-field patterns at 0° obtained from analytical simulations in MATLAB R2021b are shown in Figure 3b,e. Subsequently, three-dimensional finite-difference time-domain (3D-FDTD) simulations were performed to obtain the 2D far-field patterns. For the simulation setup, we used an auto non-uniform mesh accuracy of 3 to discretize the simulation region. Perfectly matched layer boundary conditions were applied in the x-, y-, and z-directions. The fundamental TE mode is launched into the waveguide with an air cladding at a wavelength of 1550 nm. The numerical results are shown in Figure 3c,f. By comparison, grating lobes are significantly suppressed, and the main lobe is clearly visible across the field of view. However, the dispersed intensity of the suppressed grating lobes increases side-lobe level and background noise, which is addressed in subsequent sections. For high-precision applications, such as LiDAR systems and free-space optical communication links [20], further design optimization is needed.

3. Aperiodic Antenna Array Optimization

To effectively suppress grating lobes and side-lobe level, we use a multi-strategy enhanced PSO algorithm in MATLAB to design for the aperiodic OPAs. PSO is a typical swarm intelligence algorithm where each solution is considered a “particle” in the search space. It has the advantages of being simple to compute and easy to implement, and requires few control parameters.

3.1. Principle of Spacing Distribution Optimization

In the process of optimizing antenna spacing distribution, PSLL is used for fitness evaluation to assess the quality of the spacing distribution, which is expressed as
PSLL = 10 log 10 I max - sidelobe I mainlobe
where Imax-sidelobe is the intensity of the maximum side lobe, and Imainlobe is the intensity of the main lobe. However, most reported aperiodic OPAs use the PSLL at 0° for fitness evaluation, which leads to a rapid rise in side-lobe level and an increase in background noise during scanning. In this study, we investigate the performance of spacing distributions obtained by using PSLL at different steering angles as the fitness function, which can be expressed as
Fitness = PSLL θ s
where θs is the steering angle. The target steering range in this work is ±60°, with θs set to 0°, 10°, 20°, 30°, 40°, 50°, and 60°, respectively. For an aperiodic antenna array with N channels, the mathematical model of the optimization problem can be expressed as
min PSLL s . t .     min ( d 1 , d 2 , , d N 1 ) d min ,   max ( d 1 , d 2 , , d N 1 ) d max
where dmin and dmax denote the minimum spacing and the maximum spacing, respectively.

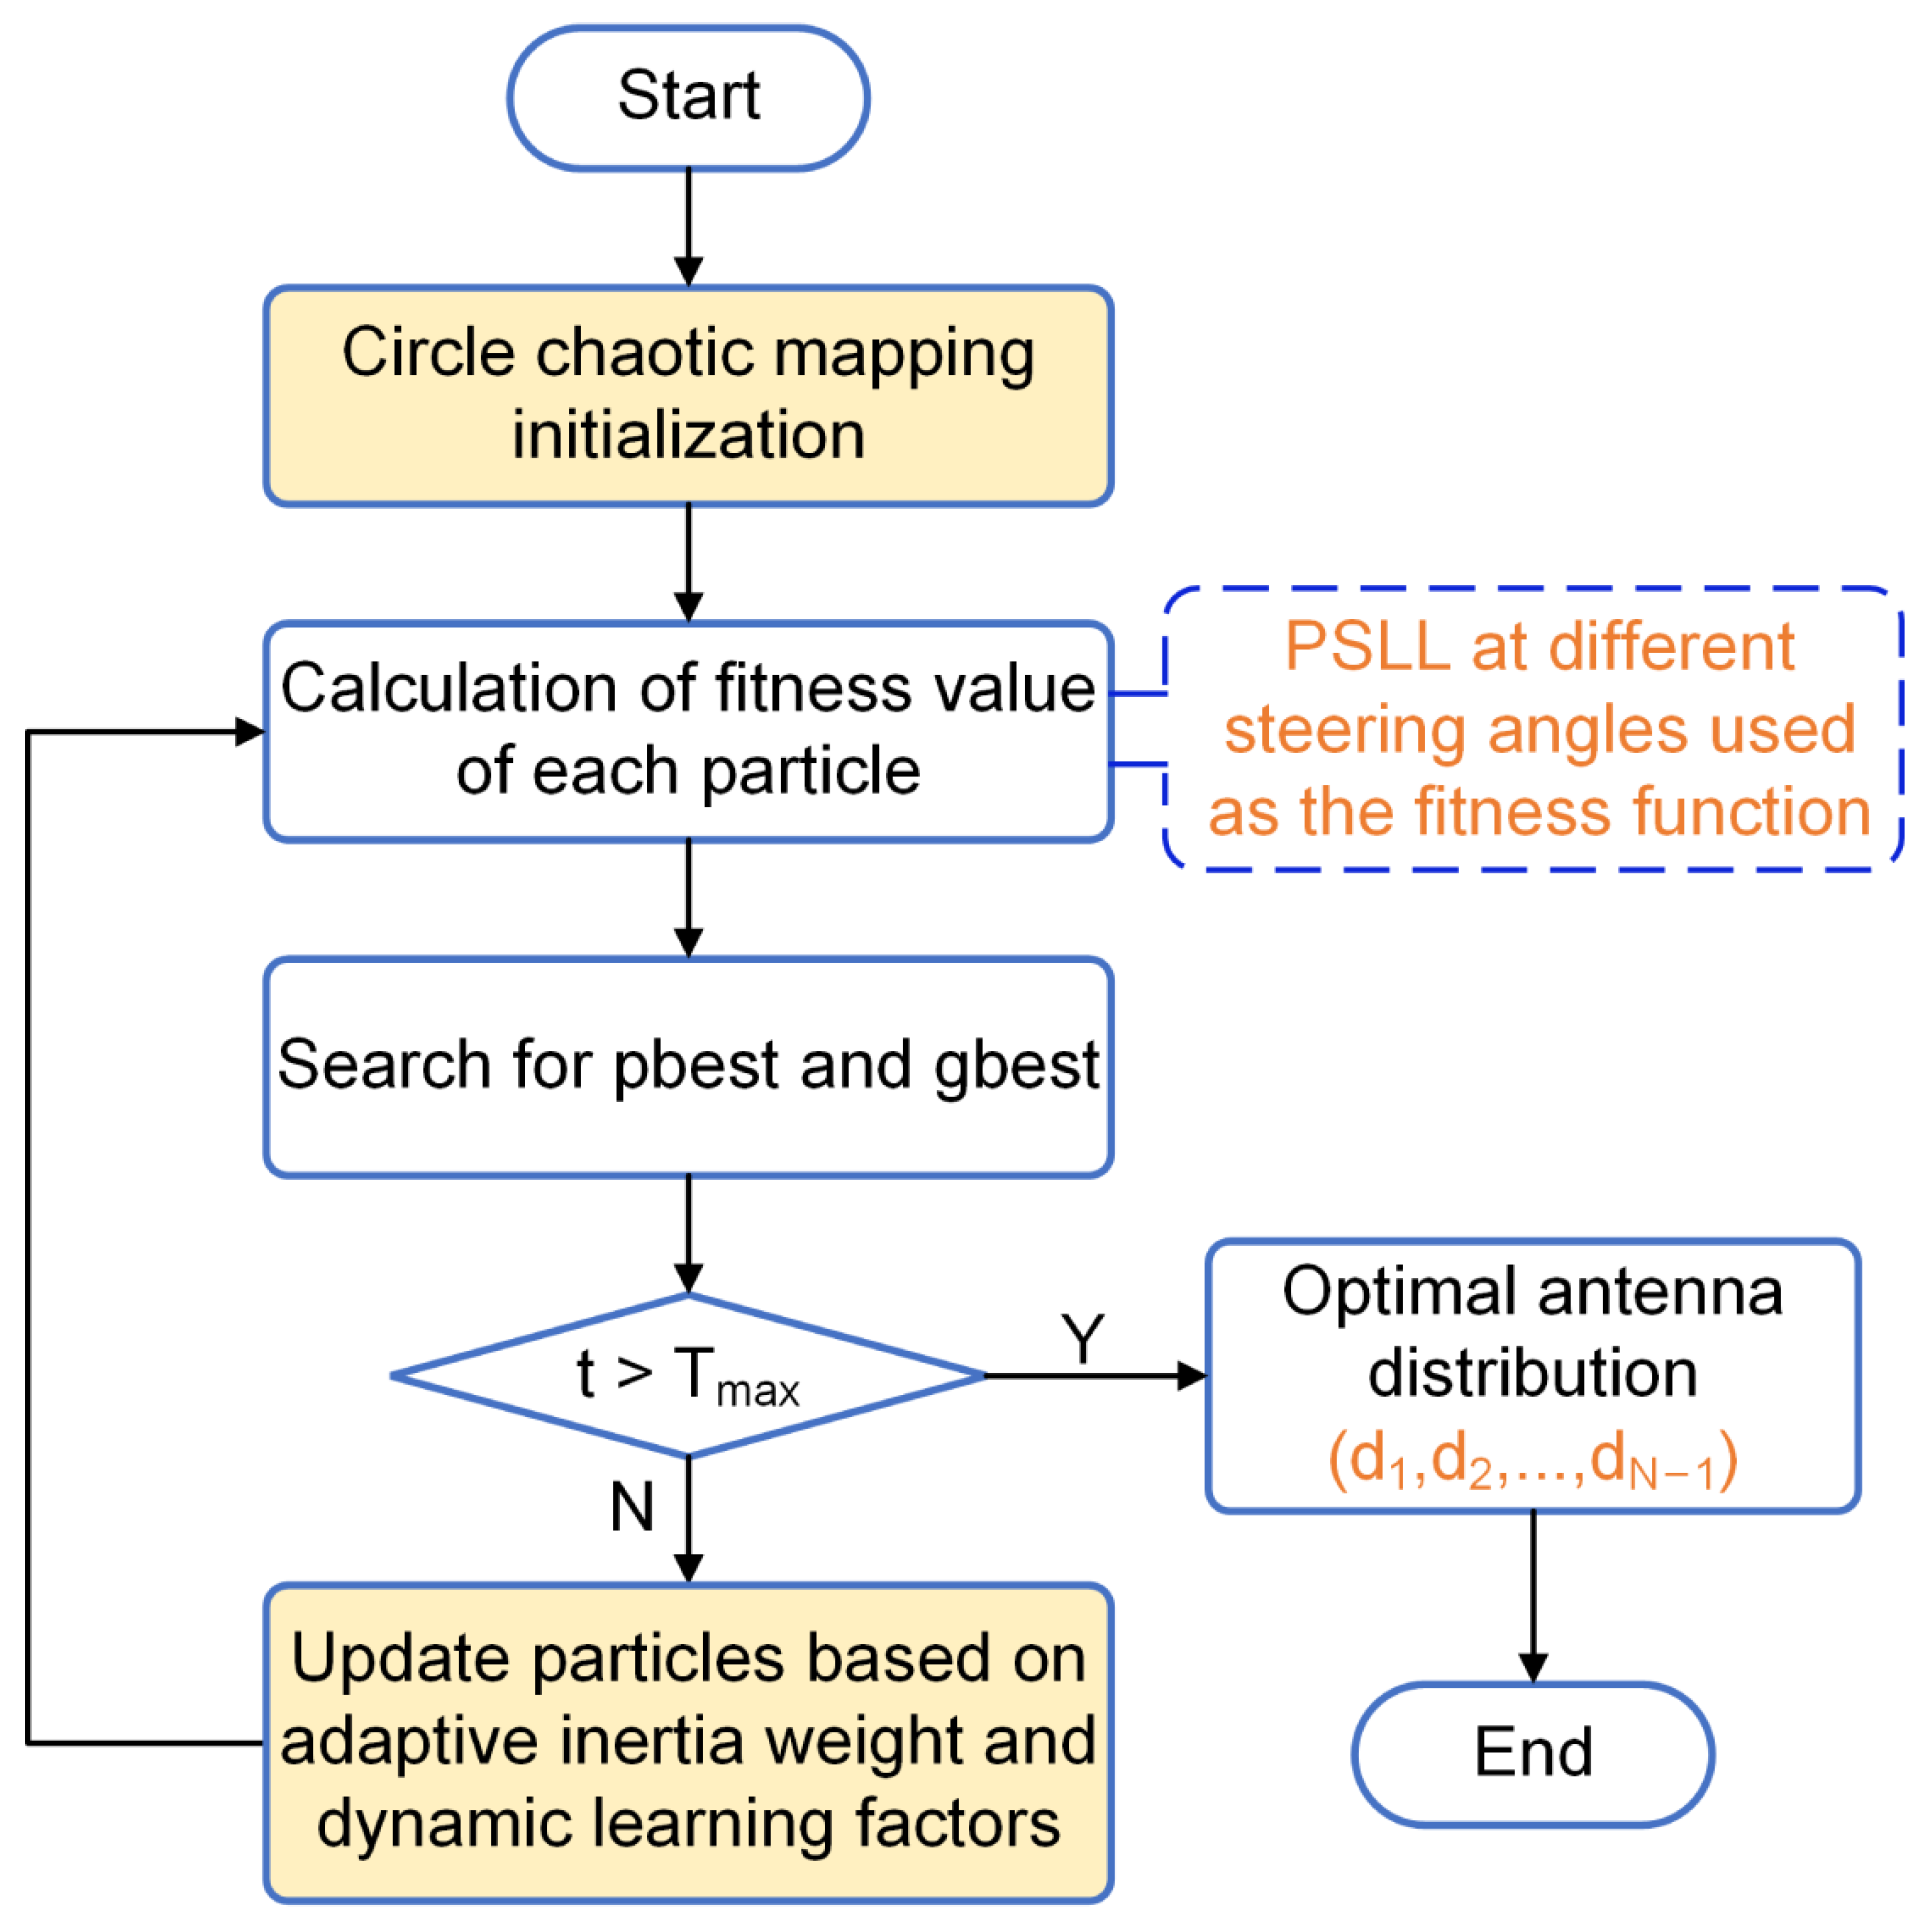
3.2. Algorithm Optimization Process

The original PSO algorithm only uses the rand function for population initialization, as shown in Figure 4a. This causes an uneven population distribution, directly affecting the convergence performance and search efficiency of the algorithm. Chaotic mapping possesses characteristics such as randomness, non-repetition, and chaotic traversal, which ensure a uniform population distribution [21]. Therefore, we adopt a circular chaotic mapping strategy for population initialization [22], as shown in Figure 4b. The comparison shows that using circular chaotic mapping produces a more evenly distributed spatial arrangement, thereby enhancing the PSO algorithm’s search capability.
All particles in PSO update their velocity and position based on their personal best position and the global best position identified in the population. In this step, we introduce an adaptive inertia weight ω and dynamic learning factors c1 and c2, which are defined as follows:
ω = ω min + ω max ω min sin π 2 1 t T max
c 1 = 2 sin 2 π 2 1 t T max
c 2 = 2 sin 2 π t 2 T max
where ωmax and ωmin represent the minimum and maximum values of ω, respectively, set to 0.9 and 0.3; Tmax denotes the maximum number of iterations, set to 1000; and t denotes the current iteration. Figure 5 presents the values of these three parameters as functions of the iteration numbers. In the early stages, ω and c1 are set to larger values, while c2 is initialized with a smaller value to encourage broader exploration of the solution space and increase the probability of finding the global optimum. In the later stages, ω and c1 are gradually reduced, while c2 is increased to prioritize the exploitation of promising regions, thereby enhancing convergence accuracy.
The update formation is expressed as
V i , j ( t + 1 ) = ω V i , j ( t ) + c 1 r 1 ( p b e s t i , j ( t ) X i , j ( t ) ) + c 2 r 2 ( g b e s t j ( t ) X i , j ( t ) )
X i , j ( t + 1 ) = X i , j ( t ) + V i , j ( t + 1 )
Here, i = 1, 2, …, K, j = 1, 2, …, D, where K is the population number, set to 80, and D is the dimensionality of the particles (i.e., the number of spacings). V and X represent the velocity and position of particles, respectively, r1 and r2 are random numbers between 0 and 1, and pbest and gbest represent the personal best position of each particle and the global best position among all particles, respectively.
The process of the enhanced PSO for antenna spacing distribution is illustrated in Figure 6, and the steps are described as follows:
Step 1: Set the population numbers K and the maximum number of iterations Tmax. Generate initial particles based on the minimum spacing dmin, maximum spacing dmax, and number of channels N. In this work, we study antenna arrays with N = 32 and N = 64.
Step 2: Calculate the fitness values of particles. In this study, the PSLL at different steering angles is used as the fitness function (Equation (7)) where particles with smaller fitness values are considered better.
Step 3: Determine pbest and gbest. The historical best solution found by each particle is considered its individual optimal solution, referred to as pbest. Then, the best solution among all individual optimal solutions is selected as the global optimal solution, referred to as gbest.
Step 4: Update particles based on Equations (11) and (12). At the final iteration, the optimal spacing distributions (d1, d2, …, dN−1) of the 32- and 64-channel aperiodic OPAs are determined.

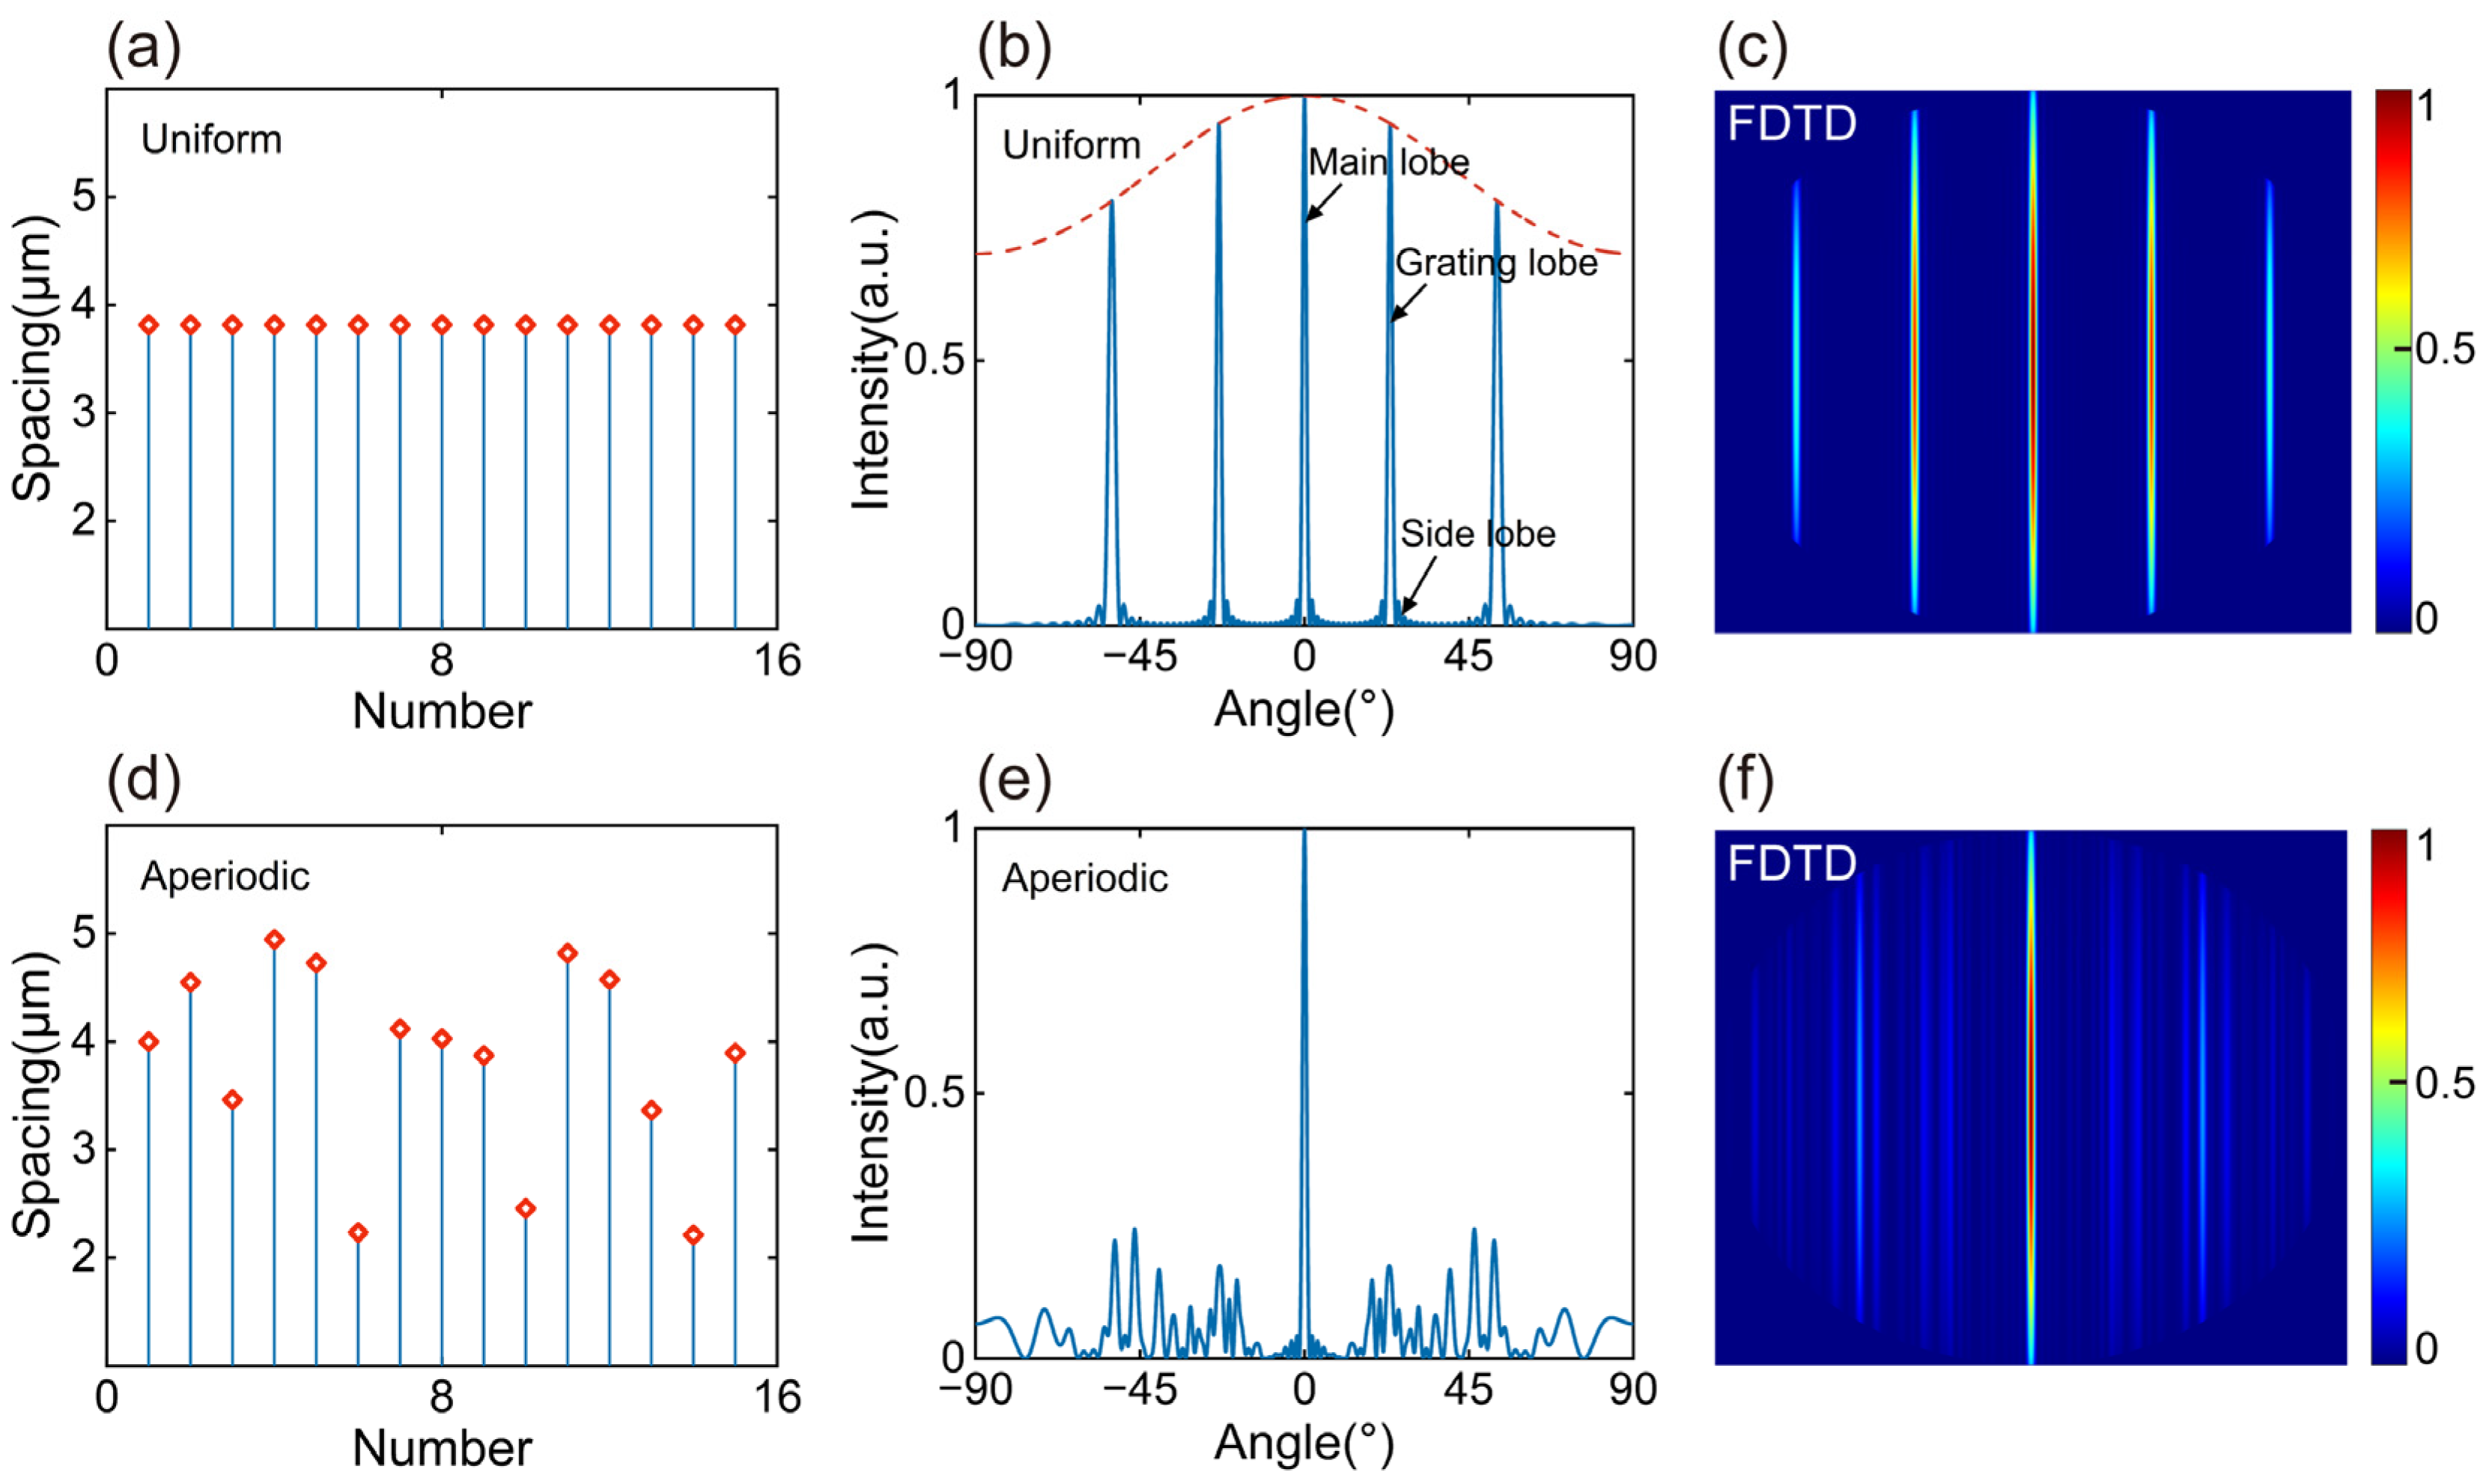
3.3. Optimization Results

According to Equation (7), we use the PSLL at seven different steering angles as the fitness function, resulting in seven distinct spacing distributions. For 32- and 64-channel aperiodic OPAs, the PSLL variations during scanning from 0° to 60° for these solutions are shown in Figure 7a,b, respectively. As shown in Figure 8, for all solutions, PSLL decreases as the steering angle increases. Notably, as the optimized steering angle increases, there is a degradation in PSLL at small steering angles but an improvement at large steering angles. For the 32- and 64-channel aperiodic OPAs, when the optimized steering angles are 20° and 40°, respectively, compared to 0°, the PSLL slightly decreases at small steering angles but shows significant improvement at larger angles.
For ease of expression, we define Fitness, Fitness20°, and Fitness40° as the fitness functions corresponding to optimized steering angles of 0°, 20°, and 40°, respectively. A comparison between the results for the 32-channel OPA using Fitness and Fitness20° shows that Fitness20° reduces the PSLL by only 0.03 dB near 0° but increases the PSLL by approximately 1.2 dB from 35° to 60°. Similarly, for the 64-channel OPA, Fitness40° decreases the PSLL by about 0.36 dB from 0° to 28°, but significantly increases the PSLL by more than 1 dB from 40° to 60°. These comparisons show the reduction in the side-lobe level and the improvement in PSLL achieved by the proposed design. The antenna spacing distributions of the 32- and 64-channel aperiodic OPAs are shown in Figure 7c,d, respectively. Both OPAs have an average spacing of 3.3 µm (2.13λ), with aperture sizes of 103 µm and 208 µm for the 32- and 64-channel OPAs, respectively.
We compared the optimization results of 32- and 64-channel aperiodic OPAs using the multi-strategy enhanced PSO algorithm, the traditional PSO algorithm [4,13,14,15,16,17,18], and the GA [8,10,11,12]. These algorithms were tested under the same conditions, with the maximum iteration number set to 1000. For the 32- and 64-channel OPAs, these algorithms used Fitness20° and Fitness40° as the fitness functions, respectively. The optimization results over 1000 iterations are shown in Figure 8. For the 32-channel OPA, the traditional PSO algorithm and GA converged at the 480th and 255th iterations, respectively, while the enhanced PSO algorithm converged at the 700th iteration, producing a significantly better solution. As shown in Figure 8c, the 32-channel OPA optimized by the enhanced PSO maintains a higher PSLL during scanning, with a 1.04 dB improvement at 60° compared to the traditional PSO algorithm. For the 64-channel OPA, the traditional PSO algorithm and GA converged at the 460th and 457th iterations, respectively, while the enhanced PSO algorithm converged at the 730th iteration. However, by the 150th iteration, the enhanced PSO had already outperformed the best solutions of the traditional PSO and GA. As shown in Figure 8d, the 64-channel OPA optimized by enhanced PSO shows a 1.3 dB improvement in PSLL at 60° compared to the traditional PSO algorithm. Therefore, the multi-strategy enhanced PSO algorithm shows superior search capabilities.
We simulated the 32- and 64-channel aperiodic OPAs using the traditional PSO and Fitness, with the results of the PSLL variations during scanning shown in Figure 8c,d, respectively. It can be observed that for the 32-channel OPAs, our method improves the PSLL by 1.94 dB at 60°, and with an improvement of 2.05 dB at 60° for the 64-channel OPA, indicating a significant increase in PSLL across the wide-angle steering range.
Taking the 64-channel aperiodic OPAs as an example, the far-field intensity distribution patterns obtained at 60° are shown in Figure 9. A comparison reveals that the FWHM remains nearly the same, while the prominent high-intensity side lobes are effectively suppressed, resulting in a reduction in the overall side-lobe level. This indicates that our method effectively suppresses the rapid deterioration of PSLL during scanning.
Figure 10 and Figure 11 present the far-field patterns from analytical and numerical simulations for the 32- and 64-channel aperiodic OPAs, respectively. It can be observed that the numerical simulation results at 0° outperform the analytical simulations, with the PSLL of both OPAs being about 0.3 dB higher. At the large steering angle of 60°, the PSLL decreases by 1.83 dB and 2.04 dB for the 32- and 64-channel OPAs, respectively. This discrepancy is due to the idealized handling of far-field interference in the analytical simulations. However, the analytical and numerical simulation results show good agreement with key metrics such as the main lobe position, full width at half maximum (FWHM), and far-field intensity distribution. For these two aperiodic OPAs, the FWHM ranges from 0.74° to 1.46° and from 0.39° to 0.76°, respectively, maintaining a high resolution and beam directivity during scanning. Moreover, increasing the number of channels can further reduce the FWHM, thereby achieving higher resolution.
Two-dimensional beam scanning includes horizontal beam scanning and vertical beam scanning. For 1D OPAs, horizontal beam scanning is achieved by changing the phase difference between adjacent antennas. In contrast, vertical beam scanning is achieved by changing the wavelength of the input laser, thereby adjusting the emission angle of the antennas. Therefore, the sensitivity of the scanning performance of 1D aperiodic OPAs to wavelength variations is also an important factor to consider. For the 32- and 64-channel aperiodic OPAs, the PSLL variations were tested at steering angles of 0°, 30°, and 60° with wavelength changes from 1500 nm to 1600 nm in 10 nm increments, as shown in Figure 12a,b, respectively. It can be observed that the PSLL of both the 32- and 64-channel OPAs remains almost unchanged at 0° and 30°, while at 60°, within a 100 nm bandwidth, the variations are approximately 0.25 dB and 0.19 dB, respectively. Therefore, the designed OPAs combined with wavelength tuning can maintain high stability.

4. Error Analysis

This paper assumes that the optimized and actual spacings are completely consistent. However, unavoidable manufacturing errors [2,9,23] always lead to antenna position deviations. Therefore, it is crucial to analyze the effects of spacing deviations on PSLL.
In practical fabrication, spacing deviations typically occur in one direction, resulting in either an increase or a decrease in all spacings. For the antenna spacing di (i = 1, 2, …, N − 1), we use Δdi as the spacing error of di, following a uniform distribution. Thus, the actual antenna spacing is di + Δdi. The antenna spacing deviation is defined as Δd. When Δd < 0, Δdi is uniformly and independently distributed in [Δd, 0], whereas when Δd > 0, Δdi is uniformly and independently distributed in [0, Δd].
To ensure reliability, we conducted 300 tests for each spacing deviation and averaged the results. The results are shown in Figure 13. As Δd decreases from 0 to −100 nm, for the 32-channel OPA, when Δd > −40 nm, the PSLL remains almost unchanged, and when Δd = −100 nm, the PSLL decreases by 0.54 dB. For the 64-channel OPA, when Δd > −20 nm, the PSLL remains almost unchanged, and when Δd = −100 nm, the PSLL decreases by 0.45 dB. As Δd increases from 0 to 100 nm, the PSLL generally exhibits a decreasing trend. For the 32-channel OPA, when Δd < 30 nm, the PSLL remains almost unchanged, and when Δd = 100 nm, the PSLL decreases by 0.72 dB. For the 64-channel OPA, when Δd = 100 nm, the PSLL decreases by 0.61 dB. Comparisons show that the impact of spacing increases is greater than that of spacing decreases. The above analysis shows that our design exhibits high robustness to spacing deviations.

5. Conclusions

To conclude, we have proposed a multi-strategy enhanced PSO algorithm, which exhibits stronger global search capability compared to the traditional PSO algorithm and the GA. We used the PSLL at different steering angles as the fitness function to optimize the antenna spacing distributions for 32- and 64-channel aperiodic OPAs. Through this design method, we effectively suppress grating lobes and mitigate the rapid degradation of the PSLL during beam steering. Within a scanning range of ±60°, for the 32-channel OPA, the PSLL ranges from 12.26 to 9.12 dB, with the FWHM varying from 0.74° to 1.46°; for the 64-channel OPA, the PSLL ranges from 13.27 to 11.75 dB, and the FWHM varies from 0.39° to 0.76°. In addition, the numerical simulation results obtained using 3D-FDTD are in good agreement with the analytical results. The variation in PSLL remains below 0.72 dB within a 100 nm spacing deviation range, indicating the robustness of the antenna arrays. Therefore, our OPAs meet the requirements for various applications such as LiDAR, free-space optical communication, and other fields.

Author Contributions

Conceptualization, Q.H. and Z.Z.; methodology, Z.Z.; software, Z.Z.; validation, Q.H. and Z.Z.; formal analysis, Q.H. and Z.Z.; investigation, Z.Z.; resources, Z.Z. and J.W.; data curation, Z.Z.; writing—original draft preparation, Z.Z.; writing—review and editing, Q.H.; visualization, Q.H.; supervision, Q.H.; project administration, Q.H.; funding acquisition, Q.H. All authors have read and agreed to the published version of the manuscript.

Funding

The National Natural Science Foundation of China (No. 62175078, No. 61775094); the National Key Research and Development Program of China (2019YFB2203101, 2021YFB2800102); the State Key Laboratory of Advanced Optical Communication Systems and Networks (2021GZKF006).

Institutional Review Board Statement

Not applicable.

Informed Consent Statement

Not applicable.

Data Availability Statement

Data underlying the results presented in this paper are not publicly available at this time but may be obtained from the authors upon reasonable request.

Conflicts of Interest

The authors declare no conflicts of interest.

References

  1. Xie, W.; Komljenovic, T.; Huang, J.; Tran, M.; Davenport, M.; Torres, A.; Pintus, P.; Bowers, J. Heterogeneous silicon photonics sensing for autonomous cars [Invited]. Opt. Express 2019, 27, 3642–3663. [Google Scholar] [CrossRef]
  2. Zhuang, D.; Zhang, L.; Han, X.; Li, Y.; Li, Y.; Liu, X.; Gao, F.; Song, J. Omnidirectional beam steering using aperiodic optical phased array with high error margin. Opt. Express 2018, 26, 19154–19170. [Google Scholar] [CrossRef] [PubMed]
  3. Yi, Y.; Wu, D.; Kakdarvishi, V.; Yu, B.; Zhuang, Y.; Khalilian, A. Photonic integrated circuits for an optical phased array. Opt. Express 2024, 11, 243. [Google Scholar] [CrossRef]
  4. Zhang, B.; Liu, Y.; Zhao, Z.; Yan, P. Multi-beam steering with low grating lobes using optimized unequally spaced phased array. Opt. Commun. 2018, 427, 48–53. [Google Scholar] [CrossRef]
  5. Wang, Z.; Ma, P.; Yang, Y.; Cui, L.; Yu, L.; Luo, G.; Wang, P.; Pan, J.; Su, Y.; Zhang, Y. Non-uniform optical phased array with a large steering angle and high side mode suppression ratio. Appl. Opt. 2022, 61, 10788–10793. [Google Scholar] [CrossRef]
  6. Raptakis, A.; Lymperakis, G.; Gounaridis, L.; Weigel, M.; Kleinert, M.; Tsokos, C.; Groumas, P.; Andrianopoulos, E.; Keil, N.; Avramopoulos, H.; et al. Sparse aperiodic optical phased arrays on polymer integration platform. IEEE Photonics Technol. Lett. 2024, 36, 469–472. [Google Scholar] [CrossRef]
  7. Elsheikh, O.E.; Swillam, M.A. Wide-angle non-uniform optical phased array using compact and efficient antenna design. Sci. Rep. 2024, 14, 3780. [Google Scholar] [CrossRef]
  8. Du, Y.; Qiu, Y.; Zheng, S.; Zhao, X.; Dong, Y.; Zhong, Q.; Hu, T. Non-uniform distributed silicon optical phased array for high directionality and a wide steering range. Appl. Opt. 2024, 63, 1522–1528. [Google Scholar] [CrossRef]
  9. Du, K.; Wang, R.; Guo, J.; Jiang, R.; Kan, D.; Zhang, Y. Design of a sparse array for a one-dimensional non-uniform optical phased array. J. Opt. Soc. Am. B 2022, 39, 1141–1146. [Google Scholar] [CrossRef]
  10. Ye, M.; Chen, Y.; Li, J.; Deng, Y.; Chen, J.; Zhang, W.; Li, Y.; Hu, K.; Xu, C.; Liu, L.; et al. Large steering range and low-loss integrated optical phased array with SiN-Si dual-layer non-uniform antenna. Opt. Express 2023, 31, 44564–44574. [Google Scholar] [CrossRef] [PubMed]
  11. Yang, B.; Chen, H.; Yang, S.; Chen, M. An improved aperiodic OPA design based on large antenna spacing. Opt. Commun. 2020, 475, 125852. [Google Scholar] [CrossRef]
  12. Wu, Y.; Shao, S.; Che, D. Fast and low grating lobe multi-beam steering with a subarray level unequally spaced optical phased array. J. Opt. Soc. Am. B 2021, 38, 3417–3424. [Google Scholar] [CrossRef]
  13. He, J.; Dong, T.; Xu, Y. Review of photonic integrated optical phased arrays for space optical communication. IEEE Access 2020, 8, 188284–188298. [Google Scholar] [CrossRef]
  14. Komljenovic, T.; Helkey, R.; Coldren, L.; Bowers, J.E. Sparse aperiodic arrays for optical beam forming and LIDAR. Opt. Express 2017, 25, 2511–2528. [Google Scholar] [CrossRef] [PubMed]
  15. He, X.; Dong, T.; He, J.; Xu, Y. A design approach of optical phased array with low side lobe level and wide angle steering range. Photonics 2021, 8, 63. [Google Scholar] [CrossRef]
  16. Wang, J.; Song, R.; Li, X.; Yue, W.; Cai, Y.; Wang, S.; Yu, M. Beam steering technology of optical phased array based on silicon photonic integrated chip. Micromachines 2024, 15, 322. [Google Scholar] [CrossRef] [PubMed]
  17. Tan, S.; Dai, X.; Lou, J.; Song, L.; Liu, C.; Gu, Y.; Chen, Q.; Jiang, C.; Yu, X.; Lu, Q.; et al. Low-power consumption InP-based optical phase arrays with non-uniformly spaced output waveguides. Opt. Express 2023, 31, 3199–3211. [Google Scholar] [CrossRef] [PubMed]
  18. Dong, T.; He, J.; He, X.; Xu, Y.; Zhou, J. Hybrid design approach of optical phased array with wide beam steering range and low side-lobe level. Opt. Lett. 2022, 47, 806–809. [Google Scholar] [CrossRef] [PubMed]
  19. Wang, Z.; Yu, L.; Yang, Y.; Ma, P.; Cui, L.; Luo, S.; Ji, Z.; Song, Z.; Su, Y.; Pan, J.; et al. Wide field of view optical phased array with a high-directionality antenna. Opt. Express 2023, 31, 21192–21199. [Google Scholar] [CrossRef]
  20. De Cea, M.; Ram, R.J. Critical evaluation of non-uniform optical phased arrays for real-world beam-steering applications. Opt. Express 2024, 32, 26561–26582. [Google Scholar] [CrossRef] [PubMed]
  21. Deng, W.; Zhao, H.; Zou, L.; Li, G.; Yang, X.; Wu, D. A novel collaborative optimization algorithm in solving complex optimization problems. Soft Comput. 2017, 21, 4387–4398. [Google Scholar] [CrossRef]
  22. Liu, T.; Meng, X. Hybrid strategy improved sparrow search algorithm in the field of intrusion detection. IEEE Access 2023, 11, 32134–32151. [Google Scholar] [CrossRef]
  23. Zhang, D.; Zhang, F.; Pan, S. Grating-lobe-suppressed optical phased array with optimized element distribution. Opt. Commun. 2018, 419, 47–52. [Google Scholar] [CrossRef]
Figure 1. Schematic diagram of a 1D OPA with an aperiodically spaced antenna array.
Photonics 12 00210 g001
Figure 2. Schematic diagrams of (a) a uniform antenna array and (b) an aperiodic antenna array.
Photonics 12 00210 g002
Figure 3. (a) The spacing distribution, (b) normalized far-field pattern, and (c) 2D far-field pattern of the 16-channel uniform OPA. (d) The spacing distribution, (e) normalized far-field pattern, and (f) 2D far-field pattern of the 16-channel aperiodic OPA.
Photonics 12 00210 g003
Figure 4. Initialization distribution of (a) random function and (b) circle chaotic mapping strategy.
Photonics 12 00210 g004
Figure 5. Adaptive inertia weight and dynamic learning factors as functions of the iteration numbers.
Photonics 12 00210 g005
Figure 6. Optimization process of antenna spacing distribution based on the enhanced PSO algorithm.
Photonics 12 00210 g006
Figure 7. PSLL versus steering angle for the (a) 32- and (b) 64-channel aperiodic OPAs optimized with different steering angles. (c) Spacing distribution for the 32-channel aperiodic OPA optimized at the steering angle of 20°. (d) Spacing distribution for the 64-channel aperiodic OPA optimized at the steering angle of 40°.
Photonics 12 00210 g007
Figure 8. Objective function values for (a) 32- and (b) 64-channel aperiodic OPAs. PSLL versus steering angle for the (c) 32- and (d) 64-channel aperiodic OPAs.
Photonics 12 00210 g008
Figure 9. The far-field patterns of 64-channel aperiodic OPAs: (a) with the traditional PSO algorithm and Fitness0° and (b) with the enhanced PSO algorithm and Fitness40°.
Photonics 12 00210 g009
Figure 10. The far-field patterns of the 32-channel aperiodic OPA at 0° for (a) the analytical results and (b) the numerical results. (c) The 2D far-field pattern of the 32-channel aperiodic OPA at 0°. The far-field patterns of the 32-channel aperiodic OPA at 60° for (d) the analytical results and (e) the numerical results. (f) The 2D far-field pattern of the 32-channel aperiodic OPA at 60°.
Photonics 12 00210 g010
Figure 11. The far-field patterns of the 64-channel aperiodic OPA at 0° for (a) the analytical results and (b) the numerical results. (c) The 2D far-field pattern of the 64-channel aperiodic OPA at 0°. The far-field patterns of the 64-channel aperiodic OPA at 60° for (d) the analytical results and (e) the numerical results. (f) The 2D far-field pattern of the 64-channel aperiodic OPA at 60°.
Photonics 12 00210 g011
Figure 12. PSLL versus the wavelength at steering angles of 0°, 30°, and 60° for the aperiodic OPAs with (a) 32 channels and (b) 64 channels.
Photonics 12 00210 g012
Figure 13. Influence of spacing deviations on PSLL.
Photonics 12 00210 g013
Disclaimer/Publisher’s Note: The statements, opinions and data contained in all publications are solely those of the individual author(s) and contributor(s) and not of MDPI and/or the editor(s). MDPI and/or the editor(s) disclaim responsibility for any injury to people or property resulting from any ideas, methods, instructions or products referred to in the content.

