Article

Thermal Stability and Optical Behavior of Porous Silicon and Porous Quartz Photonic Crystals for High-Temperature Applications

by
Ivan Alonso Lujan-Cabrera
1,2,†,
Ely Karina Anaya Rivera
1,
Jose Amilcar Rizzo Sierra
1,
Jonny Paul Zavala De Paz
1,
Cesar Isaza
1 and
Cristian Felipe Ramirez-Gutierrez
1,*,†
1
Cuerpo Académico de Tecnologías de la Información y Comunicación Aplicada, Universidad Politécnica de Querétaro, El Marqués, Querétaro 76240, Mexico
2
Posgrado en Ciencia e Ingeniería de Materiales, Centro de Física Aplicada y Tecnología Avanzada, Universidad Nacional Autónoma de México, Campus Juriquilla, Querétaro 76230, Mexico
*
Author to whom correspondence should be addressed.
These authors contributed equally to this work.
Photonics 2025, 12(2), 94; https://doi.org/10.3390/photonics12020094
Submission received: 23 November 2024 / Revised: 11 January 2025 / Accepted: 15 January 2025 / Published: 21 January 2025
(This article belongs to the Special Issue New Insights into Optical Materials)

Abstract

:
This work investigates the changes in the optical response of photonic crystals based on porous silicon (PSi) as a function of temperature. Using the transfer matrix method in combination with thermo-optical properties, we numerically calculate the optical response of two types of photonic crystals: Distributed Bragg Reflectors (DBRs) and Fabry–Perot microcavities (FPMs). The results reveal that the photonic bandgap shifts with increasing temperature and pressure, with the defect mode in the microcavity notably shifting to longer wavelengths as the temperature rises. Additionally, we explore the transformation of PSi into porous quartz (PQz) via thermal oxidation, which preserves the porosity and multilayer structure, while altering the chemical composition. This results in geometrically identical photonic systems with distinct chemical properties, offering enhanced stability. Our simulations show that PSi structures exhibit a redshift in the photonic bandgap due to thermal expansion, while PQz structures remain optically stable even at elevated temperatures. This work highlights the potential of PQz as a robust material for high-temperature photonic applications, with tunable optical properties and stable performance under extreme conditions. The findings emphasize the feasibility of using porous-silicon-based photonic crystals for advanced optical devices in harsh environments.

1. Introduction

A photonic crystal is a periodic spatial arrangement of materials that can manipulate or be sensitized to respond to specific wavelengths of light [1,2]. This structure features a periodic spatial variation in its refractive index or dielectric constant, enabling it to control the flow of light like a semiconductor crystal controls the flow of electrons. The periodicity of the photonic crystal gives rise to a photonic bandgap [3,4,5]. This unique feature leads to remarkable optical phenomena, such as strong reflection or transmission [6,7,8], selective filtering [9,10,11], or light localization [12,13,14,15]. These properties make photonic crystals versatile for applications in telecommunications [16], optical computing [17,18,19], sensing [20,21,22], and imaging [23]. They are also integral to devices such as lasers, waveguides, and optical switches [24,25,26]. Achieving specific optical responses and functionalities depends on precise materials engineering in the design of these structures.
The photonic bandgaps of a structure are highly dependent on the dielectric function and the spatial distribution of refractive indices of its component materials. When the geometry of the structure is fixed, any modification of the photonic bandgaps can only be achieved by altering the properties of the component materials. Several studies have focused on calculating photonic bandgaps using different components such as dielectrics [27], semiconductors [28,29,30], metals [31,32,33], superconductors [34,35,36], liquid crystals [37,38], and porous media [39,40,41]. However, materials’ mechanical, thermal, optical, and electrical properties are all thermodynamically dependent. As a result, the optical response of a photonic crystal can be significantly affected by extrinsic factors such as temperature and pressure. In that direction, operating photonic devices in extreme conditions poses several significant challenges [42]. First, high temperatures can degrade the performance and longevity of photonic materials and components. Excessive heat can cause thermal expansion, material fatigue, and even chemical reactions that alter the optical properties of the materials. Also, extreme temperatures can cause mechanical stress in the structure of the device, causing deformation or failure [43]. High levels of radiation [44] or corrosive atmospheres can further degrade the performance of photonic devices. Additionally, maintaining optical alignment and stability becomes increasingly difficult under extreme conditions, which can compromise device accuracy and reliability. Overall, ensuring the robustness and functionality of photonic devices under extreme conditions requires careful consideration of thermal management, material selection, and structural design [45].
Temperature changes can significantly affect a material’s refractive index and absorption coefficient, driven by volume expansion and the temperature dependence of polarizability [46,47]. On the other hand, hydrostatic pressure impacts a material’s refractive index by altering its electronic structure and lattice vibrations. Generally, the refractive index increases under higher hydrostatic pressure as the material’s volume decreases and its density rises [48]. These effects, combined with changes in the periodicity of the crystal due to thermal expansion, significantly alter the optical response of the photonic crystal.
For specific applications, photonic devices must operate at high temperatures. For instance, a critical component in thermophotovoltaic applications is a selective absorption element that enhances system efficiency, often requiring operation at temperatures around 1000 K [49]. Another application is radiation cooling [50,51], which demands precise spectral control of thermal radiation. However, the complexity of the designs and the materials used can hinder industrial scaling. Therefore, it is essential to develop materials with tunable optical properties, scalable fabrication processes, and the ability to withstand harsh operational conditions, including high temperatures and intense radiation. Refractory metals, for example, offer high thermal stability and ease of fabrication, but their optical properties limit their operating spectrum [52].
In this context, the primary challenge in thermal photonics lies in developing devices or systems that combine desired optical properties with stability under extreme thermal conditions. Material selection is pivotal in achieving this balance, with silicon and silicon oxide emerging as promising candidates for high-temperature photonics applications. Given their high melting points and small coefficients of thermal expansion, on the order of 10−6 K−1, as well as opto-thermal coefficients of refractive index variation on the order of 10−4 K−1, they stand out. However, the limitation is that their optical properties are predefined. To address this issue, nanometric pore formation in these materials could be a viable option for tuning their optical properties and manufacturing specific devices, such as porous silicon [39,53] or porous quartz photonic crystals [54,55,56].
This article aims to analyze the thermal stability of porous silicon photonic crystals using the opto-thermomechanical coefficient and the thermal expansion coefficient in conjunction with the effective medium theory. It also demonstrates how a porous silicon photonic crystal can be transformed into a porous quartz photonic crystal, exhibiting remarkable thermal stability at high temperatures. This transformation renders it a tunable system suitable for various high-temperature photonic applications, particularly within the visible range.

2. Optical Properties of Raw Materials

Materials must possess certain geometric configurations and optical properties to effectively manipulate light, such as refractive index and extinction coefficient [57]. However, the range of refractive index values available in materials is inherently limited. Nonetheless, employing diverse strategies in composite material fabrication makes it feasible to engineer materials or structures with tailored refractive indices. This practice is commonly known as refractive index engineering [58]. A common strategy used to tune the refractive index involves the formation of composite materials, where the mixture of constituents enables variations in the refractive index value through the concentration of these constituents [59]. Then, this section describes the materials and procedures that can support experimental verification. The simulation approach integrates well-established materials and methodologies to enhance its alignment with practical applications. By incorporating realistic parameters and procedures, this work ensures that the findings are grounded in experimental feasibility, providing a solid foundation for future experimental validation.
In this context, one effective approach to refractive index engineering involves the use of nanoporous materials. Porous silicon (Figure 1a) is an example, typically fabricated by electrochemical etching [39,53,60]. This process involves immersing a silicon wafer in a solution composed of hydrofluoric acid (HF) and ethanol. By applying an electric current, silicon atoms are selectively removed from the wafer’s surface, resulting in the formation of a network of tiny pores [60,61]. By adjusting the current density and the etching time, the porosity and thickness of the silicon layer can be precisely controlled, making it possible to tune the material’s optical properties [39,53]. On the other hand, once the porous silicon is formed, it can be transformed into porous quartz (silicon oxide) through a thermal oxidation process. The porous silicon samples are heated under a controlled atmosphere with precisely regulated temperatures. This heating causes the silicon in the porous structure to react with oxygen, forming silicon oxide (quartz). Importantly, the porosity and overall structure of the material remain intact during this process, provided it occurs within a specific range of temperatures and oxygen potentials. Particularly, at temperatures below 600 °C, only the porous skeleton undergoes oxidation, preserving the porous structure, while its chemical composition changes, resulting in a material with stable optical properties suitable for high-temperature applications [54,56,62].
As an example of these materials, Figure 1a shows the electron microscopy of porous silicon film cross-sections and Figure 1b shows a heterostructure of quartz and porous quartz. These samples were obtained by electrochemical etching [39,53] followed by thermal oxidation [54]. This nanoporosification strategy allows for the tuning of refractive index values and enables the creation of multilayer structures with different porosities and thicknesses (spatial variation). This means that the refractive index varies as a function of the z-coordinate or depth within the structure. These features are crucial for fabricating photonic devices based on heterostructures of thin films or one-dimensional photonic crystals.
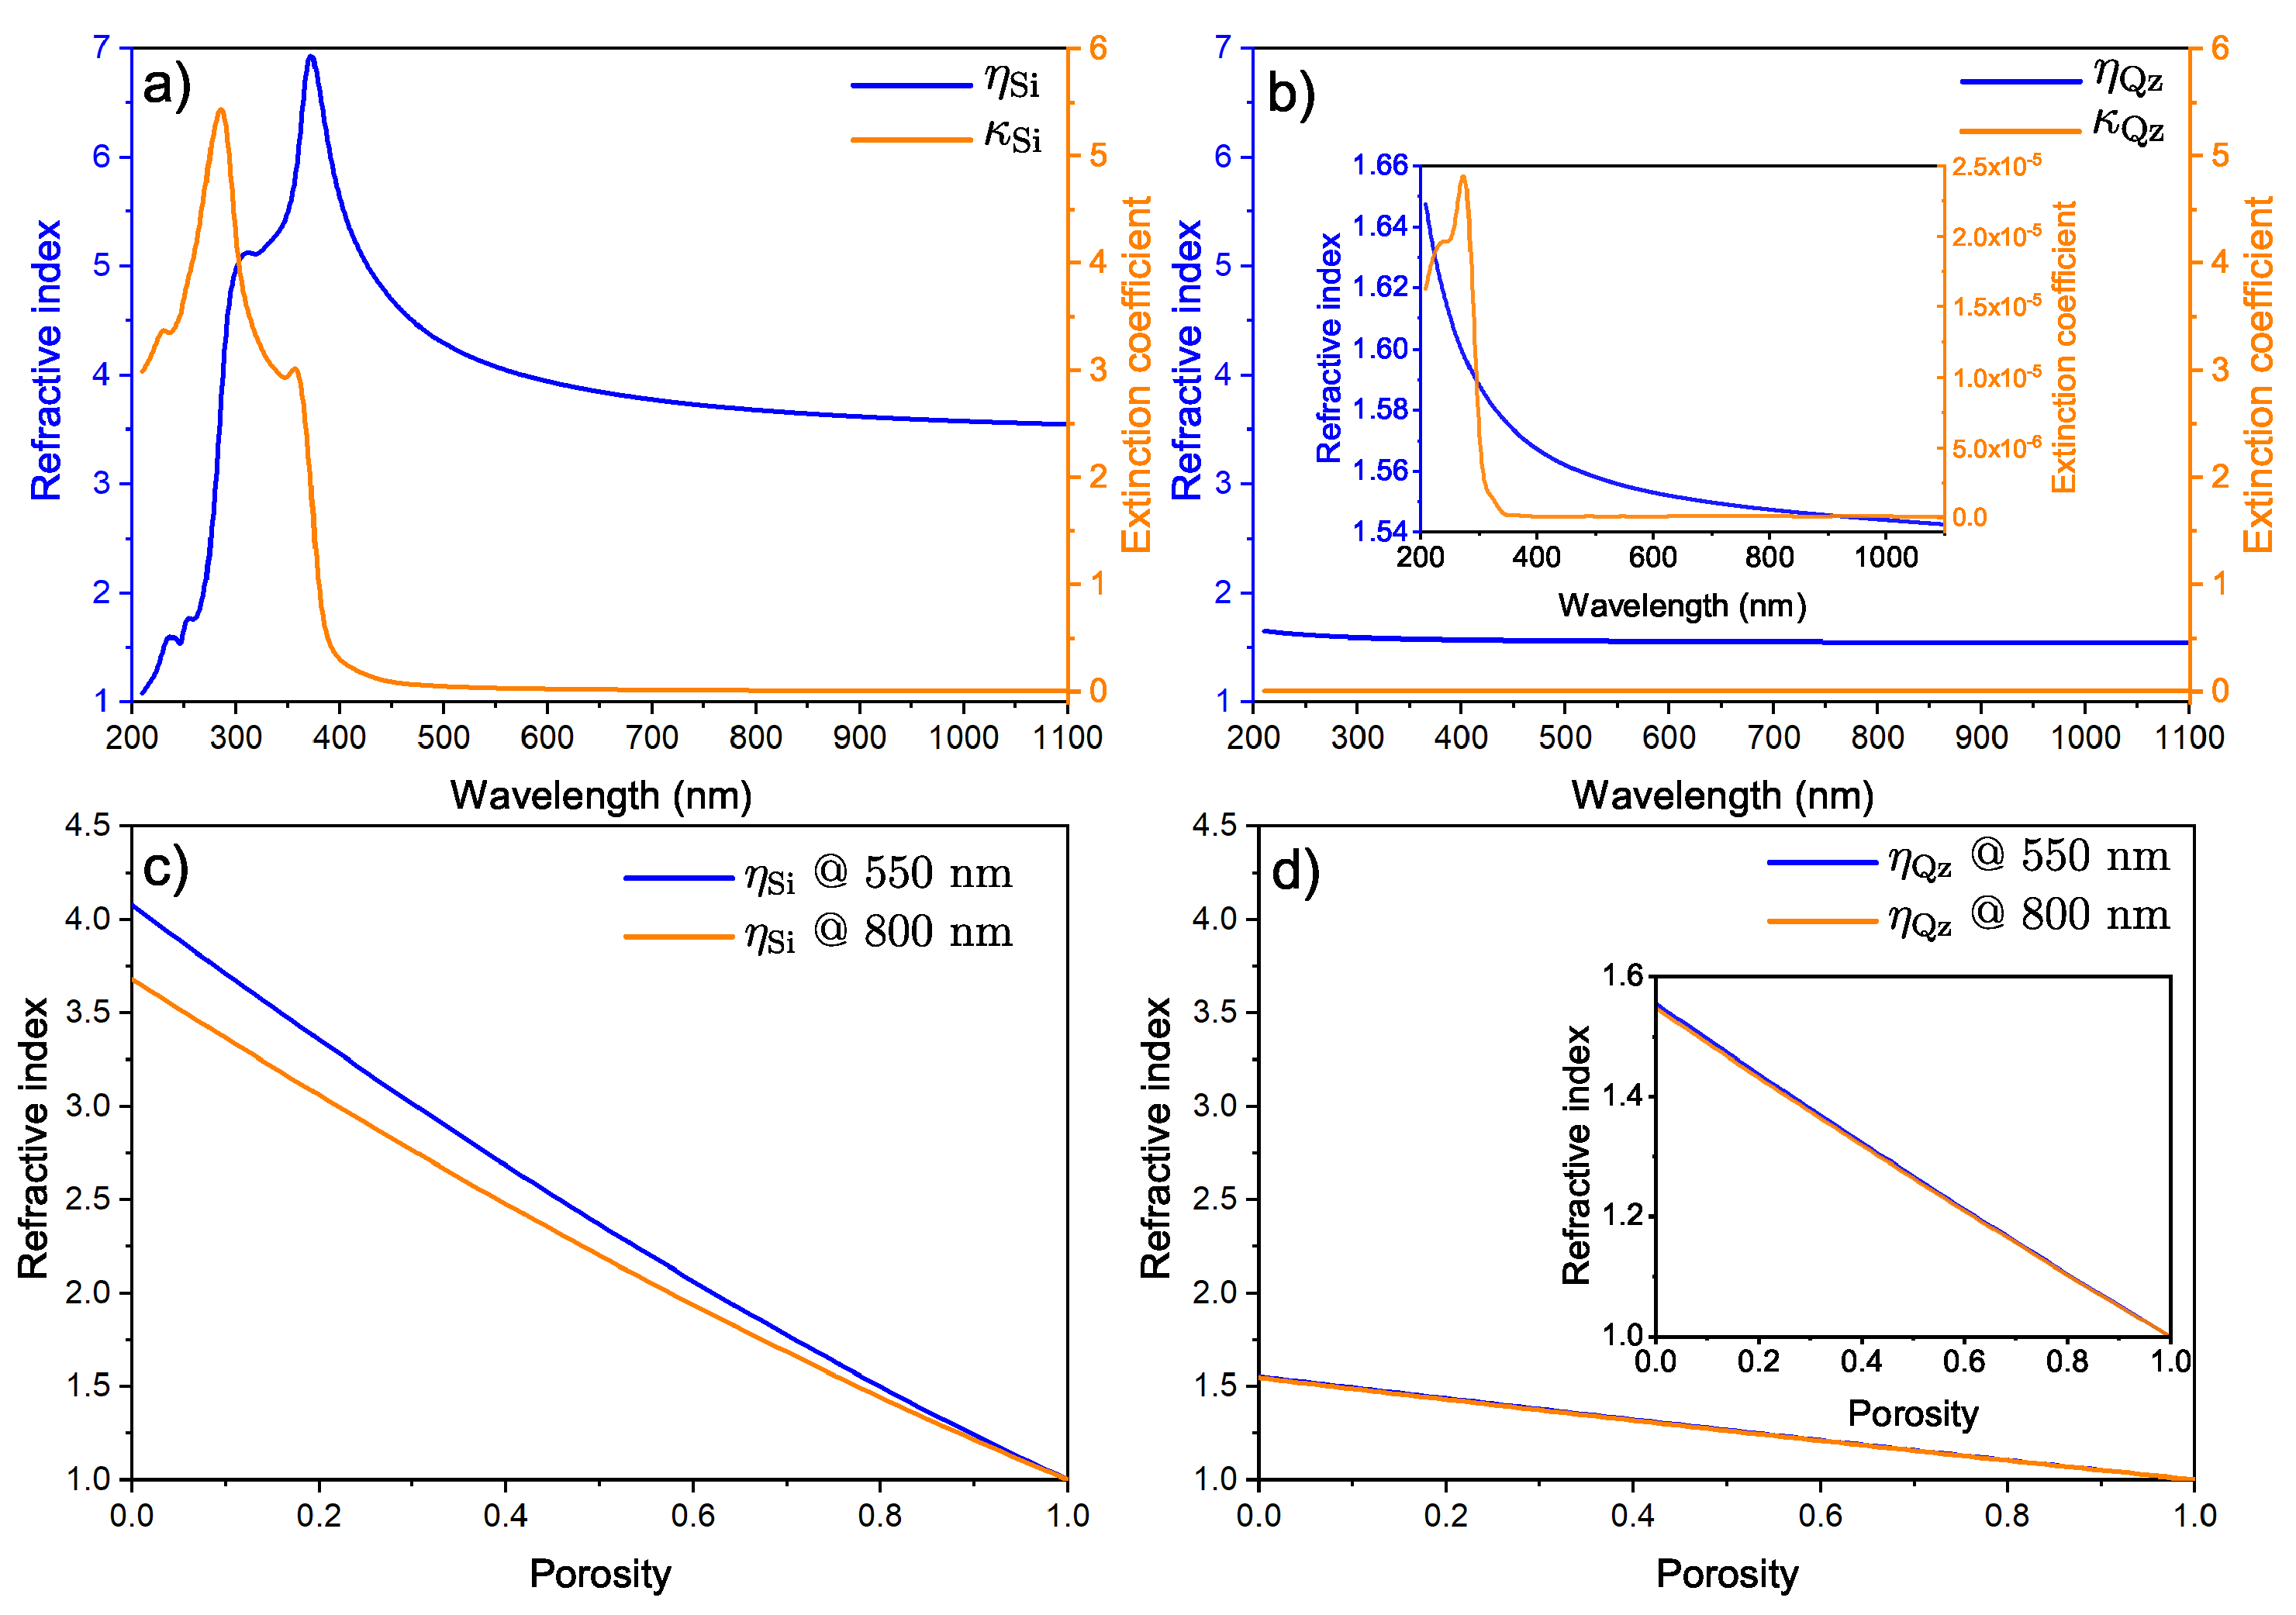
For instance, in the case of crystalline silicon (c-Si), which is a dispersive material in the visible range (Figure 2a), it can be porosified by electrochemical etching [39,53]. This allows the pores (voids) or any material filling them to tune the refractive index within the limits of the host material and the embedded material. On the other hand, quartz’s refractive index can also undergo tuning via porosification. However, achieving porous quartz requires initially starting with porous silicon and subsequently oxidizing it [54,56]. Then, thermal oxidation can be a route to also tune the material’s refractive index. In this case, the silicon oxide exhibits lower dispersion and absorption than silicon (Figure 2b). However, its refractive index is significantly lower than silicon’s, limiting the tuning range to a smaller extent than with c-Si.
Figure 2a,b depict the refractive index and extinction coefficient of crystalline silicon (c-Si) and quartz (SiO2) in bulk. Silicon exhibits high dispersion starting from approximately 500 nm and is highly absorptive in the ultraviolet range. Consequently, the design of photonic systems is optimal for wavelengths greater than 500 nm. In the case of quartz-phase silicon dioxide, the refractive index variation is small, less than 10% in the range of 1100 to 200 nm, making it less dispersive and absorptive across the entire visible range and a portion of the ultraviolet spectrum.
Figure 2c,d demonstrate how refractive index tuning is achieved through porosification. Here, the refractive index is calculated as a mixture of the matrix material (Si or SiO2) and air. Particularly for silicon, it is possible to modulate the refractive index from η = 4 (bulk silicon) to values close to η = 1 for high porosity levels. The range of variation for quartz is smaller; however, this can be advantageous for applications requiring ultra-low-refractive-index systems. The values reported in Figure 2 correspond to the optical properties of crystalline silicon and quartz under normal conditions (room temperature and atmospheric pressure). However, these values can change based on variations in pressure and temperature.

3. Theoretical Models

The transfer matrix method for one-dimensional photonic crystals allows for precisely calculating optical properties, such as reflectance, transmittance, and band structure. Considering the interaction of electromagnetic waves with the layered structure, this method provides a comprehensive understanding of how light propagates through the crystal. It enables the analysis of the effects of varying layer thicknesses and refractive indices, facilitating the design and optimization of photonic devices with tailored optical responses. This method describes a PhC as a discrete multilayer structure, where each layer is nonmagnetic and has a complex refractive index ( n = η + i κ ), where η is the real refractive index and κ is the extinction coefficient. The transfer matrix M relates the electric and magnetic fields at two arbitrary points as follows [27,66,67]:
E 0 H 0 = M E 1 H 1 .
The transfer matrix can be written as follows:
M = W j 1 , j U j W j , j + 1 U j + 1
where W j 1 , j represents the admittance matrix of the interface between the j 1 -th and the j-th layer and U j represents the phase matrix of the j-th layer.
The admittance matrix describes the optical properties of the interface between two layers, and the phase matrix represents each layer. The admittance matrix is
W j 1 , j = c j 1 , j t j R 1 r j R r j R 1 ,
where
c j 1 , j = cos θ j 1 cos θ j for p-polarization , 1 for s-polarization .
and the coefficients r j R and t R j are the Fresnel coefficients, which are expressed in terms of the optical admittances [67]. The subscript R indicates right-moving waves, considering scenarios where light is accounted for or assumed to be incident only from one side of the multilayer structure.
The phase matrix is
U j = e i ϕ j d j 0 0 e i ϕ j d j ,
where
ϕ j = 2 π n j λ cos θ j ,
where λ is the wavelength, θ j is the angle of incidence, and d j is the thickness of the j-th layer.
Finally, the Fresnel coefficients r and the reflectance ( R ) are given as a function of the elements of the transfer matrix.
r = M 21 M 11 , R = r r * ,
To achieve precise results, the Looyenga–Landau–Lifshitz (LLL) effective medium theory rule was employed to calculate the effective optical constants of PSi and PQz [65]. Moreover, it is essential to consider the material properties’ thermal dependence as a temperature function. The refractive index and expansion coefficient of materials change with temperature due to thermal expansion and thermo-optic effects. By incorporating these thermal dependencies into the transfer matrix calculations, variations in optical properties can be considered under different thermal conditions, ensuring photonic devices’ reliable design and performance in practical applications. Then, the optical response is temperature-dependent due to thermal expansion and the thermo-optic effects that modify the thickness and refractive index of the PhC layers, respectively. Thus, using the optical constants obtained from the LLL rule, the temperature dependence of the optical constants of PSi and PQz can be modeled as follows:
q ( T 0 + Δ T ) = q ( T 0 ) ( 1 + c q Δ T ) ,
where q is a property of interest ( η or k) and c q represents the temperature-dependent coefficient for the property q [63]. The reported thermo-optical coefficients for silicon and quartz are 1.86 × 10⁻⁴ 1/°C and 8.27 × 10⁻⁶ 1/°C, respectively [63,68].
However, experimental data can be used to model the change in the optical response due to thermal expansion. For silicon, the following equation can be used:
α Si / 10 6 C 1 = a exp b ( T + 273 ) + c
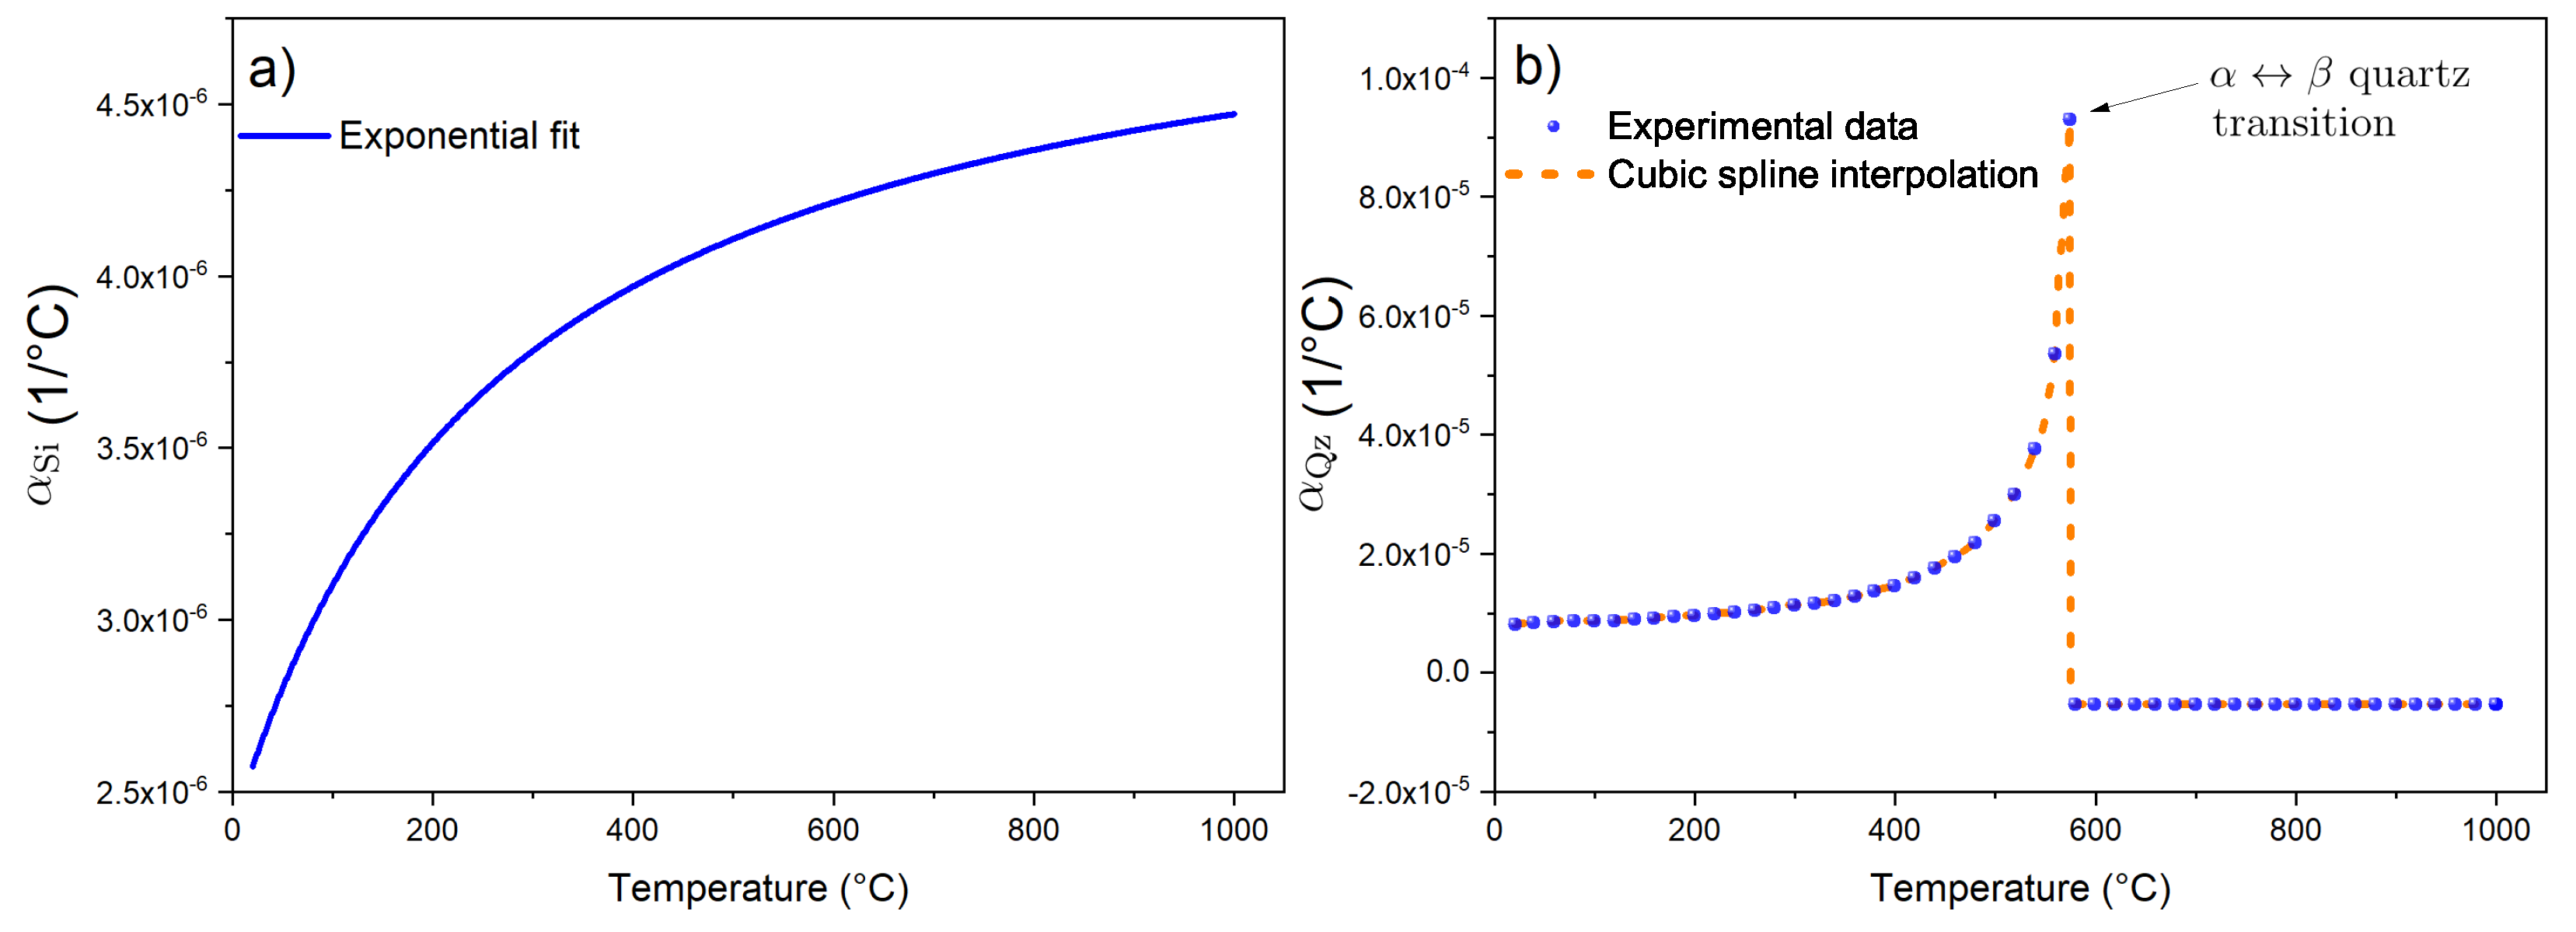
where T represents temperature, a = 5.021 , b = 137.8 , and c = 86.70 . Equation (9) is an exponential fit obtained from data by Ref. [69] which only modeled the thermal expansion coefficient up to 727 °C. This exponential fit allows for simulating temperatures up to 1000 °C and aligns well with previously reported data [70]. Figure 3a shows the thermal expansion coefficient of Si using Equation (9). In the case of α -quartz, experimental data for the linear thermal expansion coefficient along the c-axis were collected from Ref. [71]. The data are presented in Figure 3b. The cubic splines method was used for data interpolation. The abrupt change present near 574 °C is generated by an α β quartz transition. This transition is accompanied by relatively large changes in cell volume and elastic properties [72]. Due to these changes, the thermal properties are also modified, as can be seen in Figure 3b.

4. Simulation Design

To assess the potential of PSi- and PQz-based photonic crystals for high-temperature applications, the initial focus was to investigate how the optical response of a PSi photonic crystal varies with temperature. To achieve this, two photonic structures were designed: a Distributed Bragg Reflector (DBR) and a Fabry–Perot microcavity (FPM), both featuring a 20-period configuration for the DBR and the FPM submirror. The porosity values and structural configurations of these devices are provided in Table 1. A graphical representation of a DBR structure and PQz can be seen in Figure 4. It is important to note that an identical porous quartz structure can be obtained through the oxidation of porous silicon. Under appropriate thermal treatments in an oxidizing atmosphere, only the silicon skeleton is oxidized, meaning the porosity does not undergo significant changes. Therefore, the same porous multilayer structure is preserved, now consisting of silicon oxide in the quartz phase. Consequently, Figure 4 represents geometrically identical systems, but with different chemical compositions.
Two simulations were conducted to analyze the temperature dependence. In the first simulation, experimental refractive index data for crystalline silicon (c-Si) as a function of temperature were used [73]. In the second simulation, thermo-optical coefficients and thermal expansion data outlined in Section 3 were employed. The refractive index data encompassed a spectral range from 250 to 830 nm and a temperature range from 20 °C to 450 °C.
Subsequently, the evolution of the optical response in the DBR and FPM structures was studied as the silicon was oxidized into quartz. This simulation also utilized the thermo-optical coefficients and thermal expansion data. Lastly, a simulation was carried out to evaluate the performance of a PQz-based photonic crystal under high-temperature conditions.

5. Numerical Results and Discussion

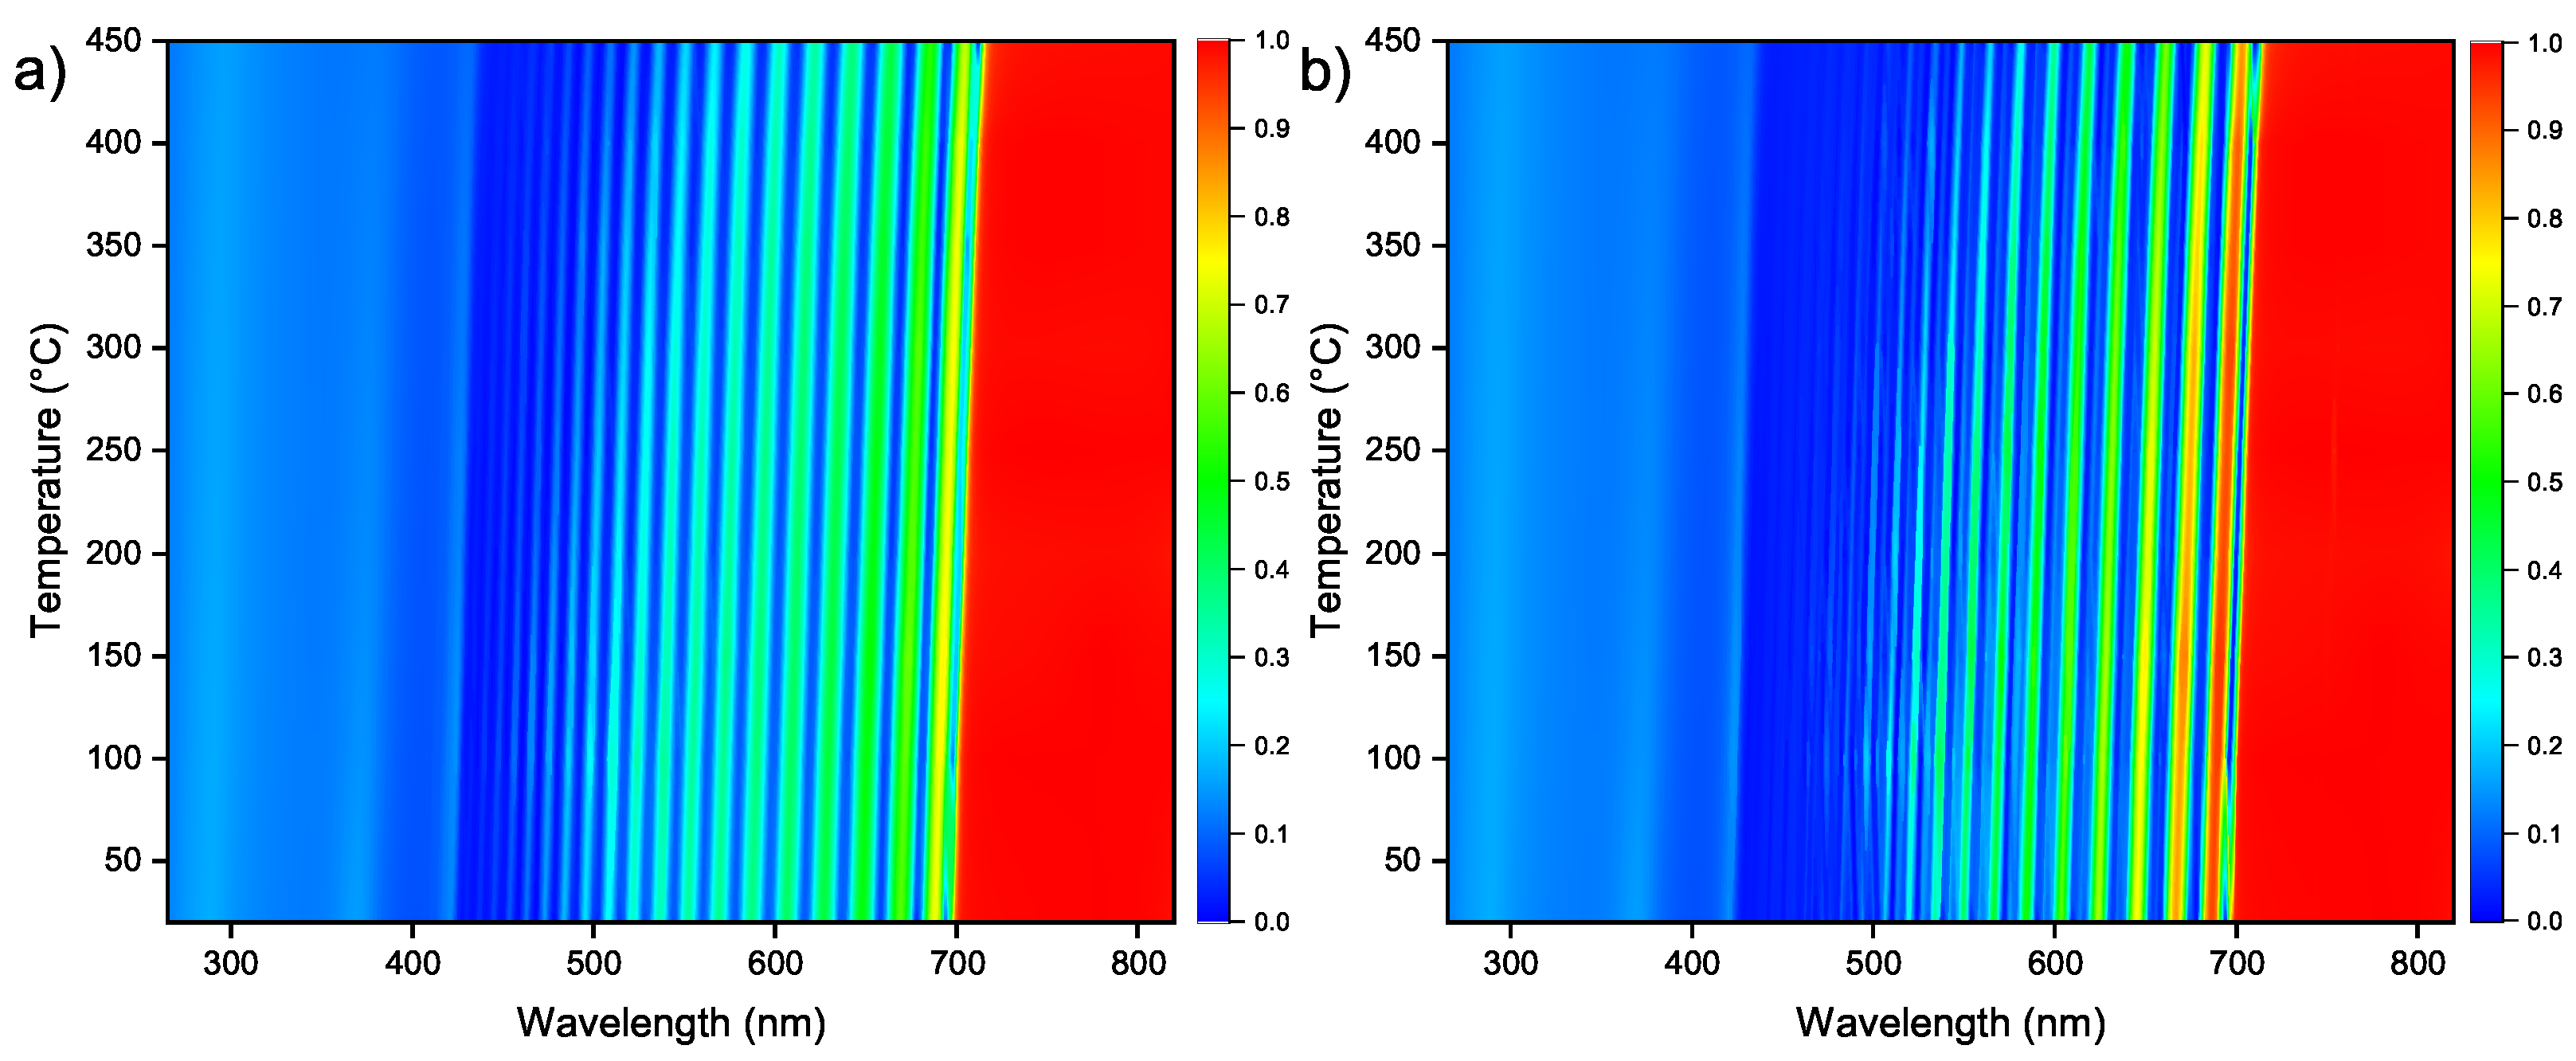
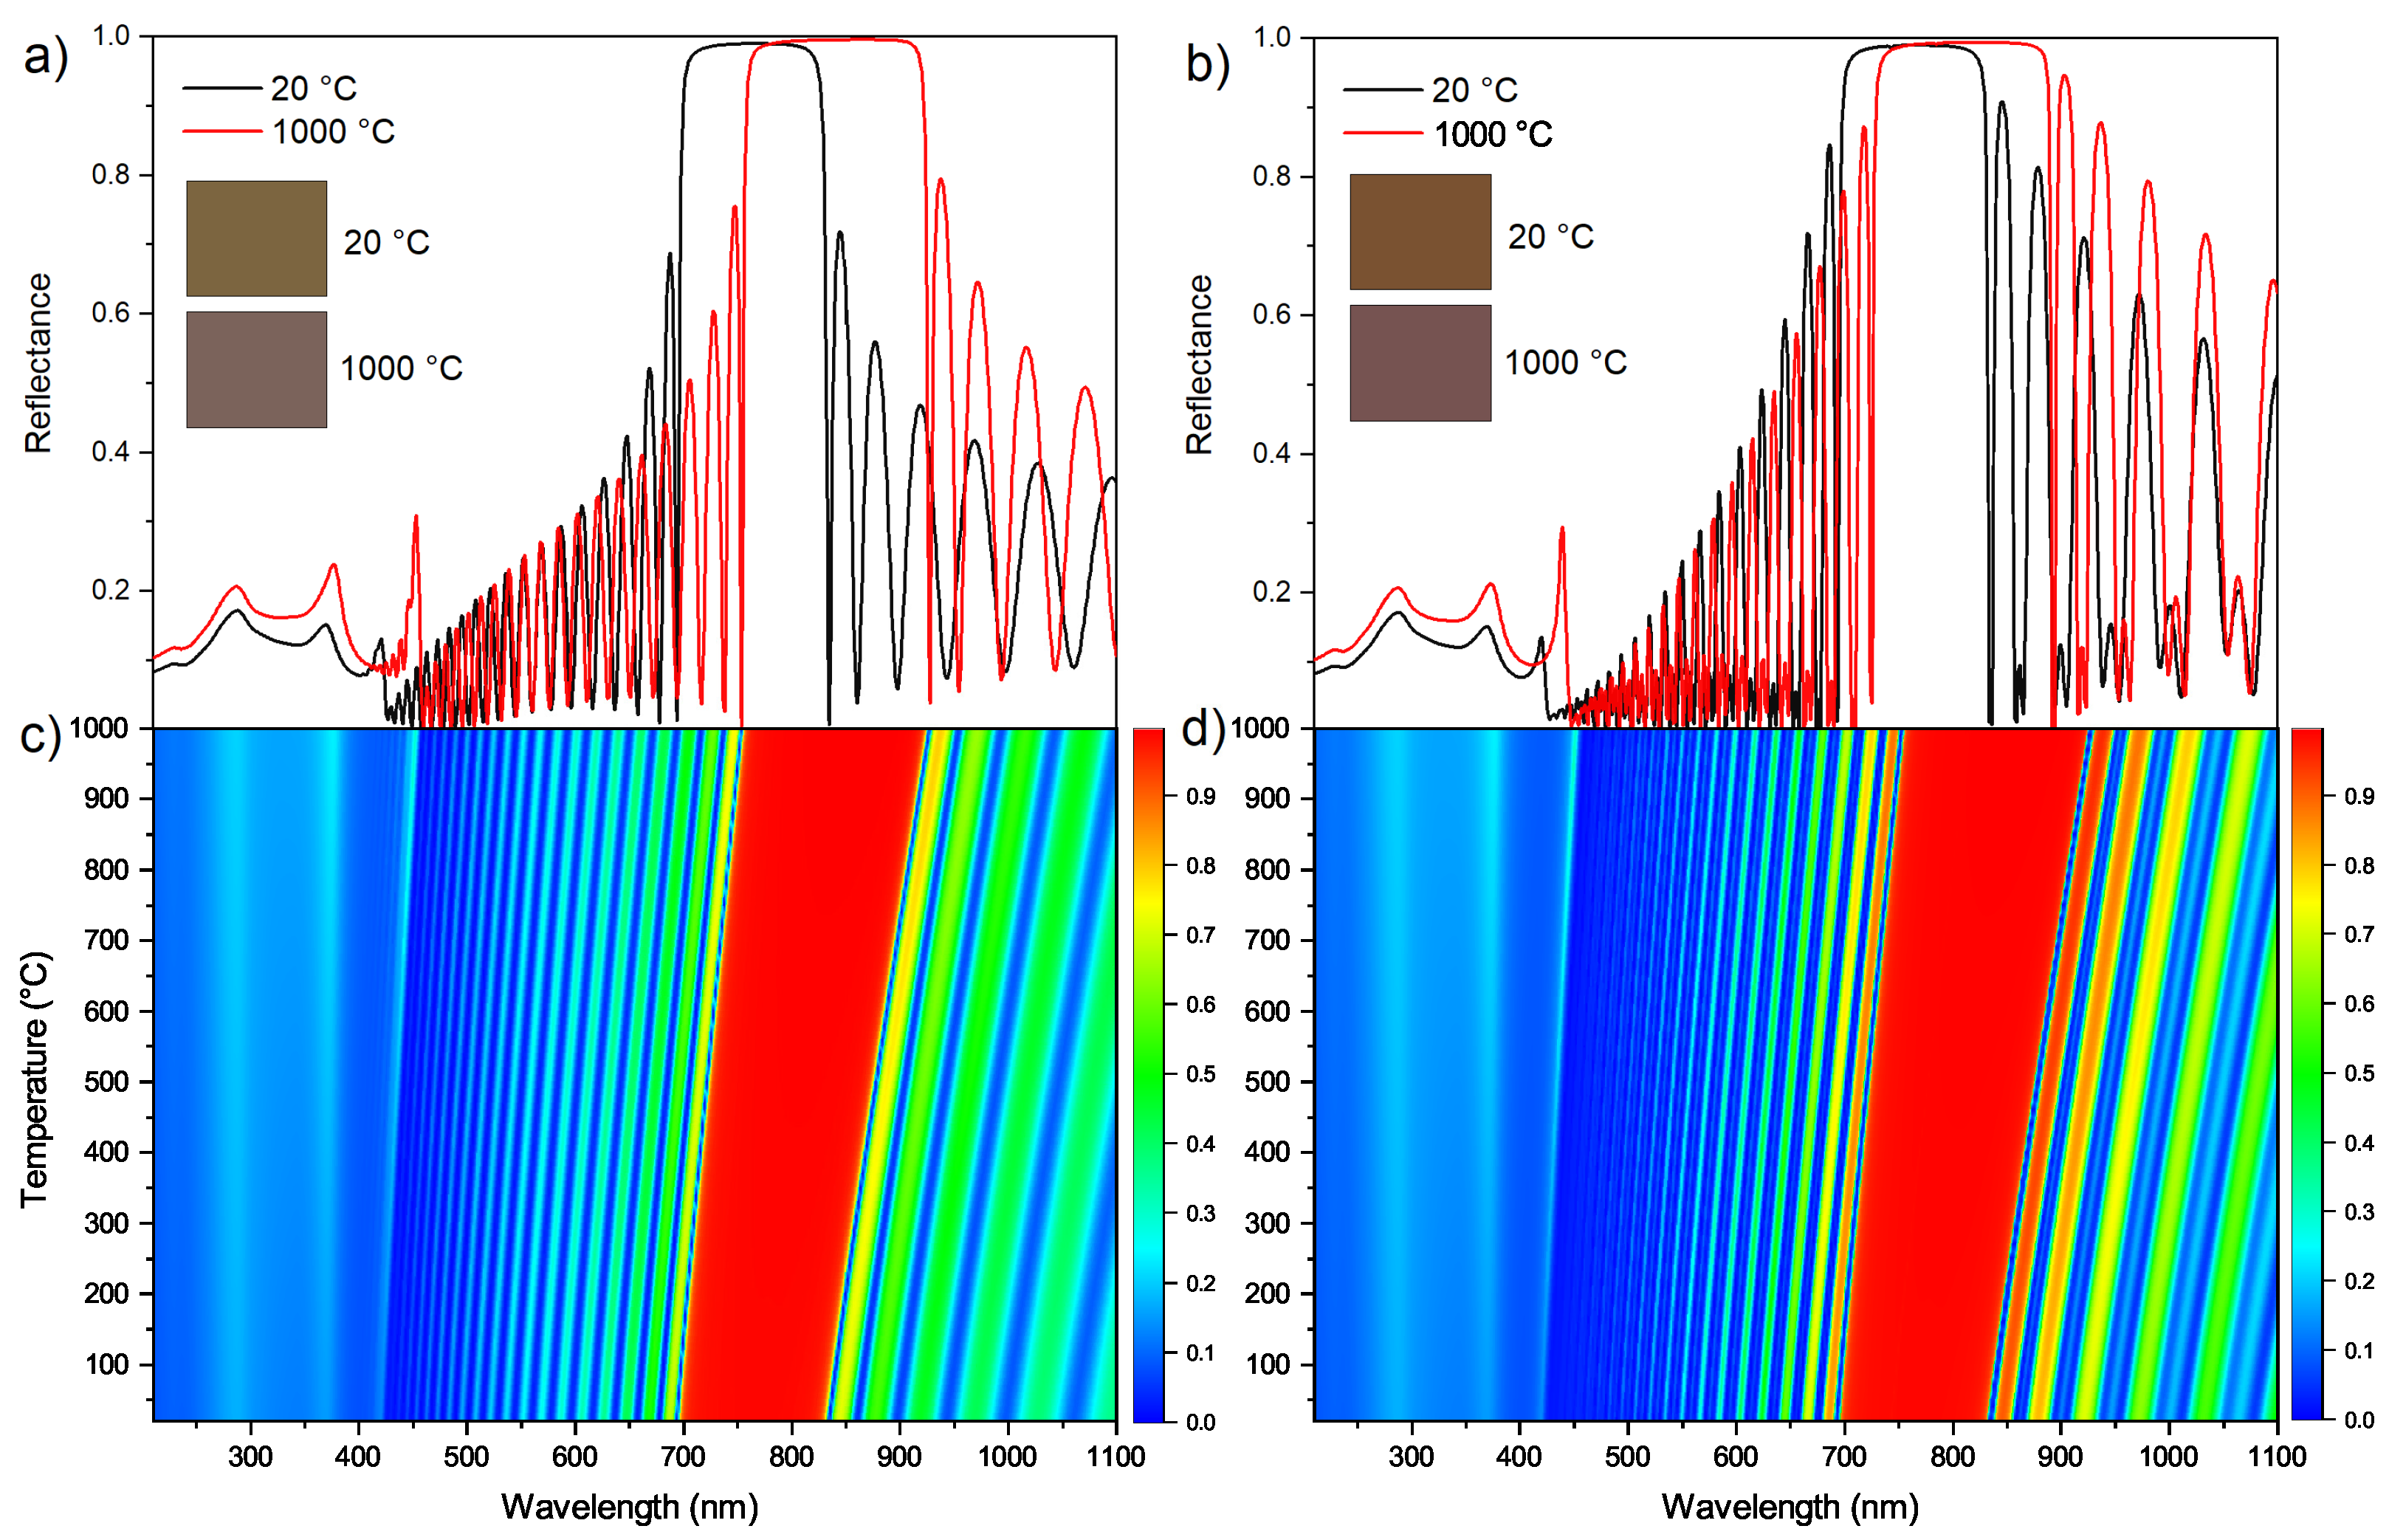
The results for the change in the optical response of a PSi photonic crystal are shown in Figure 5a,b, which are contour plots that illustrate the optical response as a function of wavelength and temperature for a PSi DBR and FPM, respectively. A redshift of about 10 nm in the photonic bandgap is noticeable, primarily due to the positive thermal expansion of the PSi layers. Nevertheless, the optical response remained almost the same. Although Figure 5b represents an FPM, the defective mode is not visible, because of the large number of layers (20 periods) above the defective layer. As can be seen, the experimental data are constricted up to 450 °C; thus, to explore the behavior at higher temperatures, the thermo-optical and thermal expansion coefficients were used. Figure 6 shows the results for the second simulation. Figure 6c,d display the contour plot of the optical response as a function of temperature from 20 °C up to 1000 °C. It is noticeable that the redshift is larger, in this case about 60 nm for both the DBR (Figure 6c) and FPM (Figure 6d). This is more evident in Figure 6a,b; herein, the optical response for 20 and 1000 °C is depicted. Besides the redshift, the photonic bandgap becomes wider, from 135 nm to 162 nm in both cases. This occurs mainly due to the aspect ratio change between the refractive indexes of the layers. These figures also show the color simulation of the corresponding photonic crystals. Even though there is a little color change, it is noticeable to the naked eye.
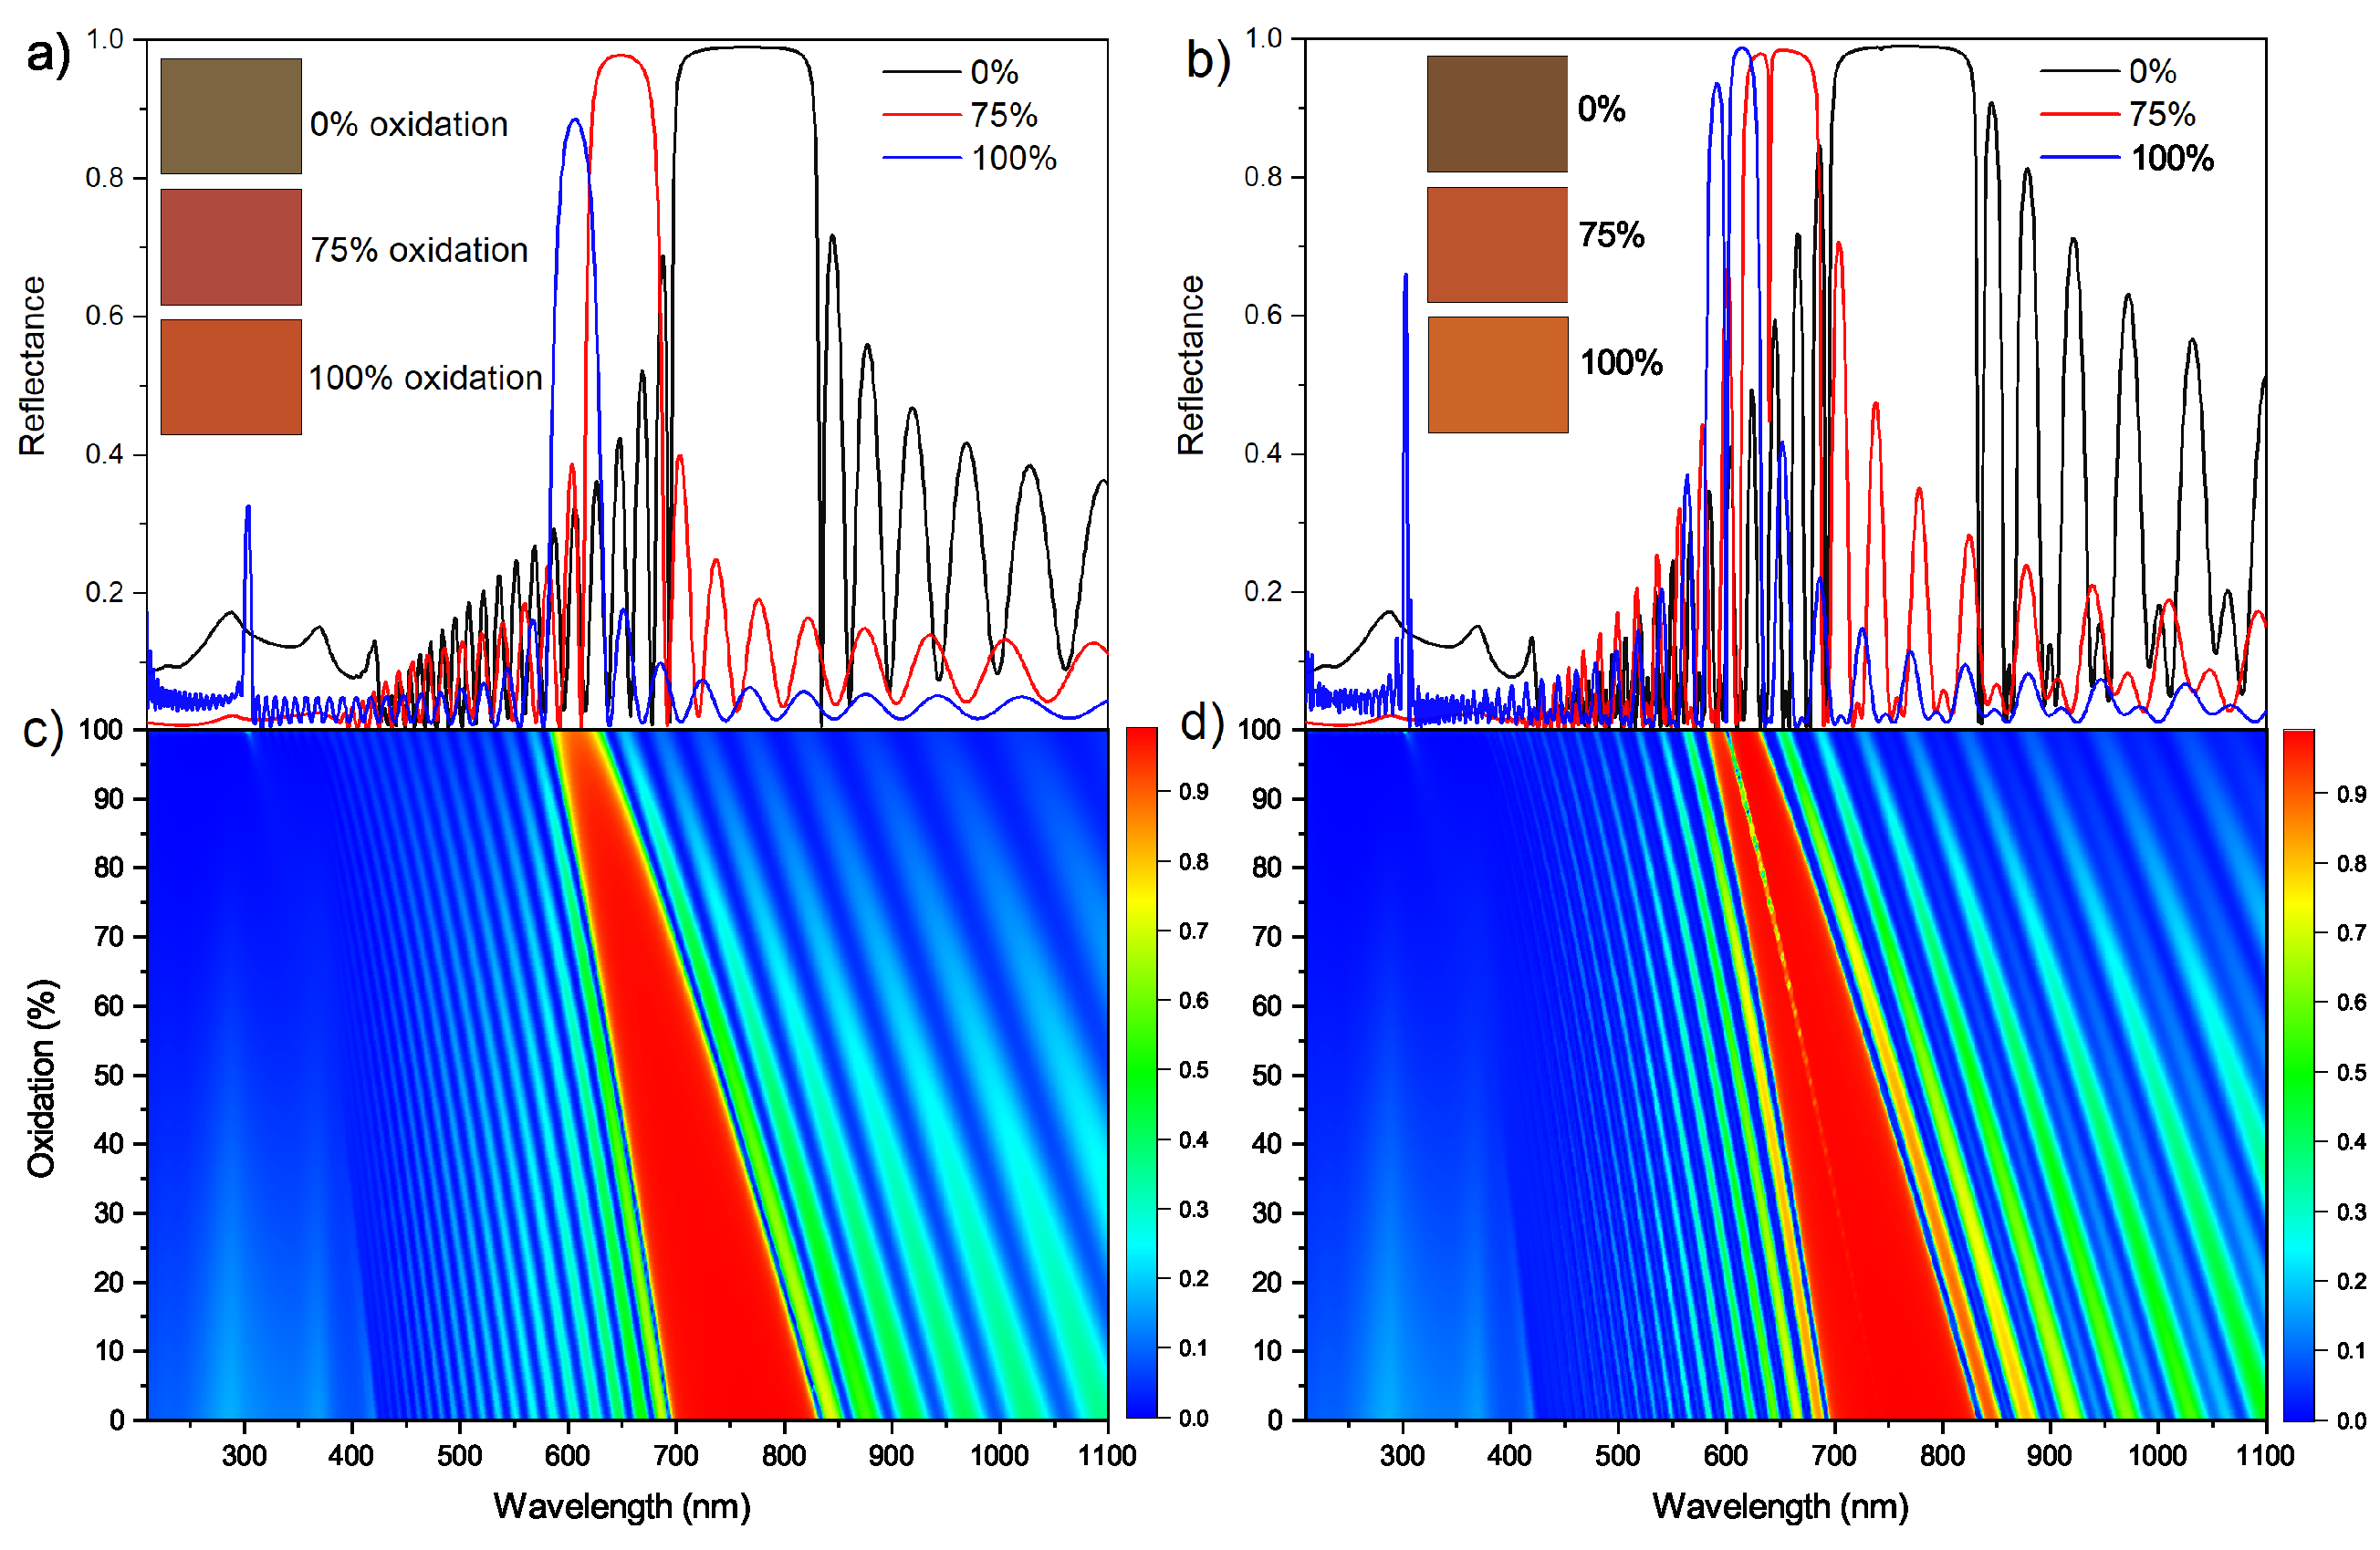
On the other hand, it is well known that the exposure of PSi to a temperature near 600 °C in an oxidizing atmosphere produces oxidation of the layers, generating a porous structure of silicon oxide. By this means, a simulation such as the one shown in Figure 6 will not be possible in an oxidizing atmosphere. A more realistic approach of what would happen to a PSi photonic crystal sensor under high temperatures in an air atmosphere is shown in Figure 7. The contour plots represent the optical response of a DBR and FPM photonic crystals as a function of the oxidation percentage. In other words, it shows how the optical response changes as Si (0% oxidation) is transformed into SiO2 (100% oxidation). This is a representation made using the thermo-optical and thermal expansion coefficients. Notably, if the temperature is kept under 600 °C, the porosity and thickness of the layers remain unchanged as only the skeleton of the layers is oxidized [54]. Since the refractive index of quartz is lower than that of silicon, the central wavelength of the photonic bandgap is blueshifted. This is graphically represented in Figure 4 and can be easily spotted in Figure 7, and for both the DBR and FPM, it was about 150 nm. The color simulation clearly shows the change in the optical properties as the photonic structures become oxidized. Finally, another one worth highlighting is that once oxidized, the defective mode in the FPM is present in the optical response, which is because quartz is less absorbent than Si, which allows the appearance of highly defined defective modes in the photonic bandgap.
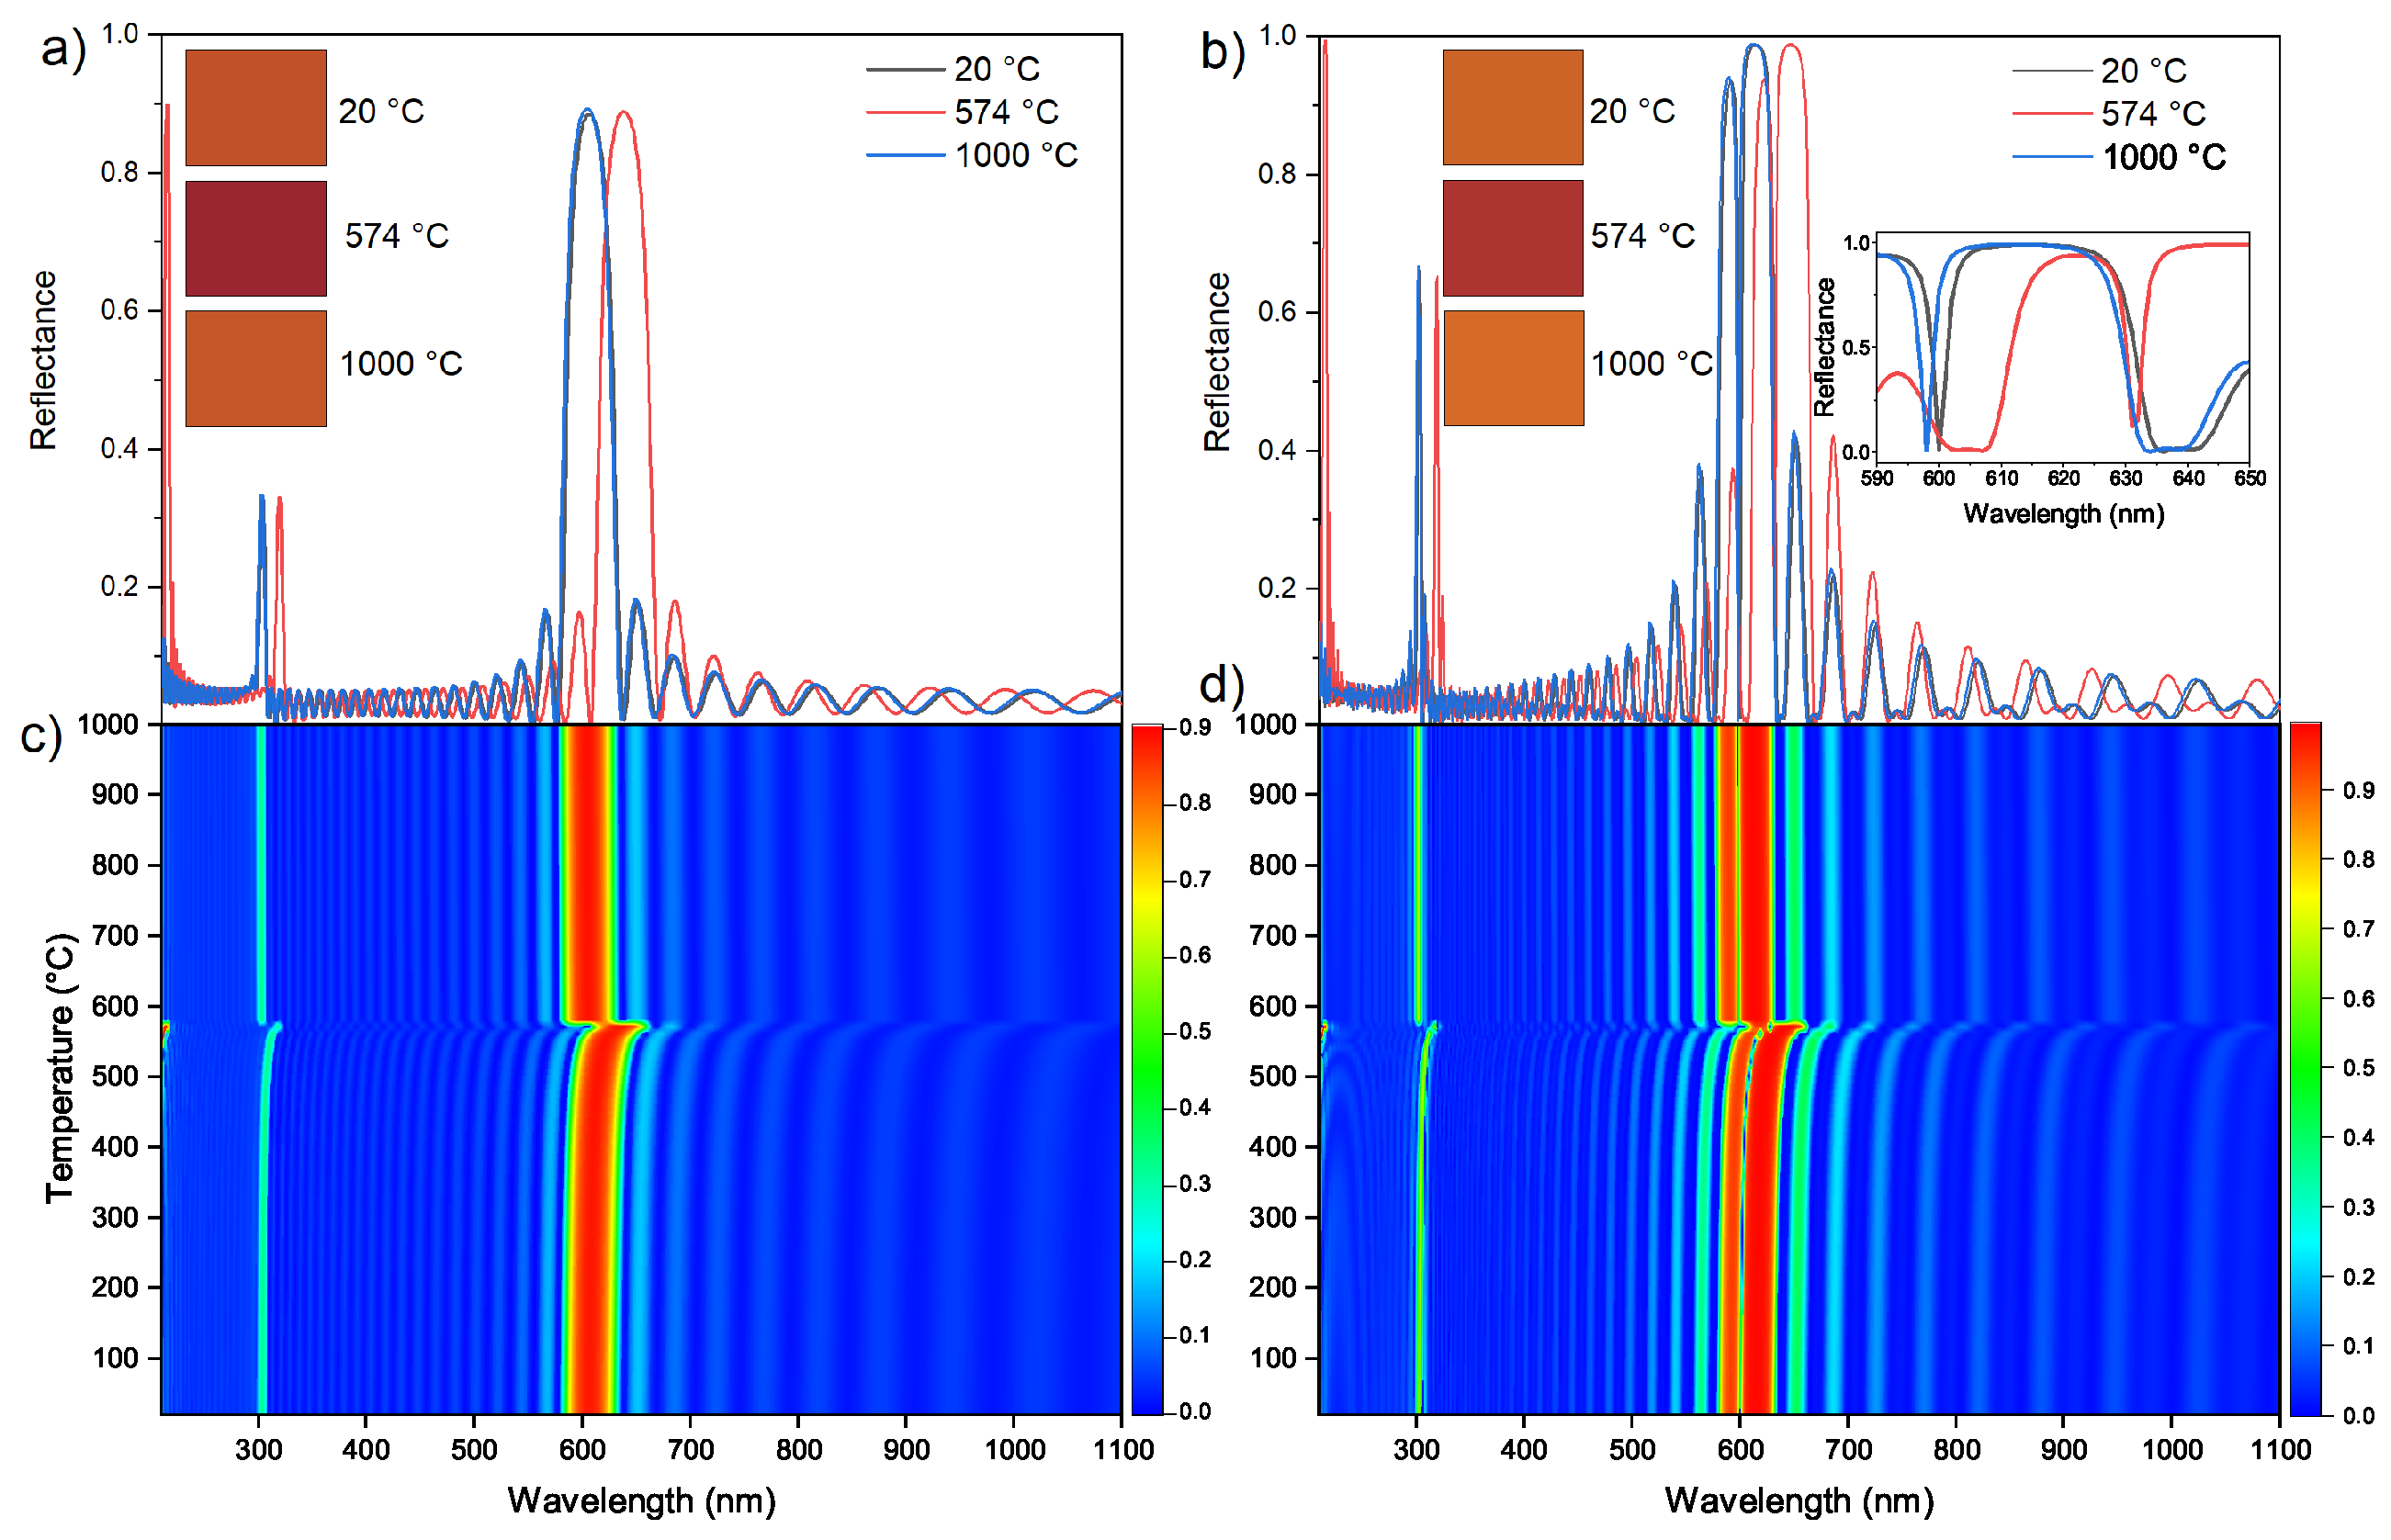
Once the silicon that forms the skeleton of the layers is transformed into quartz, a PQz photonic crystal is obtained. Based on this, Figure 8 illustrates the optical behavior of a PQz photonic crystal exposed to high temperatures. Figure 8c,d shows a contour plot of the optical response as a function of temperature for a DBR and for an FPM, respectively. Meanwhile, Figure 8a,b show the optical response of the PQz photonic crystal at three different temperatures, 20, 574, and 1000 °C. These temperatures were selected to show the optical response at the minimum and maximum temperatures as well as the transition temperature. Based on this, a redshift in the bandgap is visible because of the positive growing thermal expansion coefficient up to a temperature of 574 °C; after that, the thermal expansion coefficient changes abruptly due to the α β transition. The maximum redshift is approximately 30 nm, which is also observed for the defective mode in the FPM. After the transition temperature, the thermal expansion coefficient becomes negative. This generates a shrink in the thickness of the layers, which causes a blueshift in the bandgap. Because the thermal coefficient is relatively small after the transition, the bandgap remains almost the same, with a blueshift of only 2 nm in the DBR and FPM cases (see inset in Figure 8b). The color simulations also depict this behavior. The colors for the minimum and maximum temperatures are almost identical to the naked eye, whereas the color right before the transition is different.
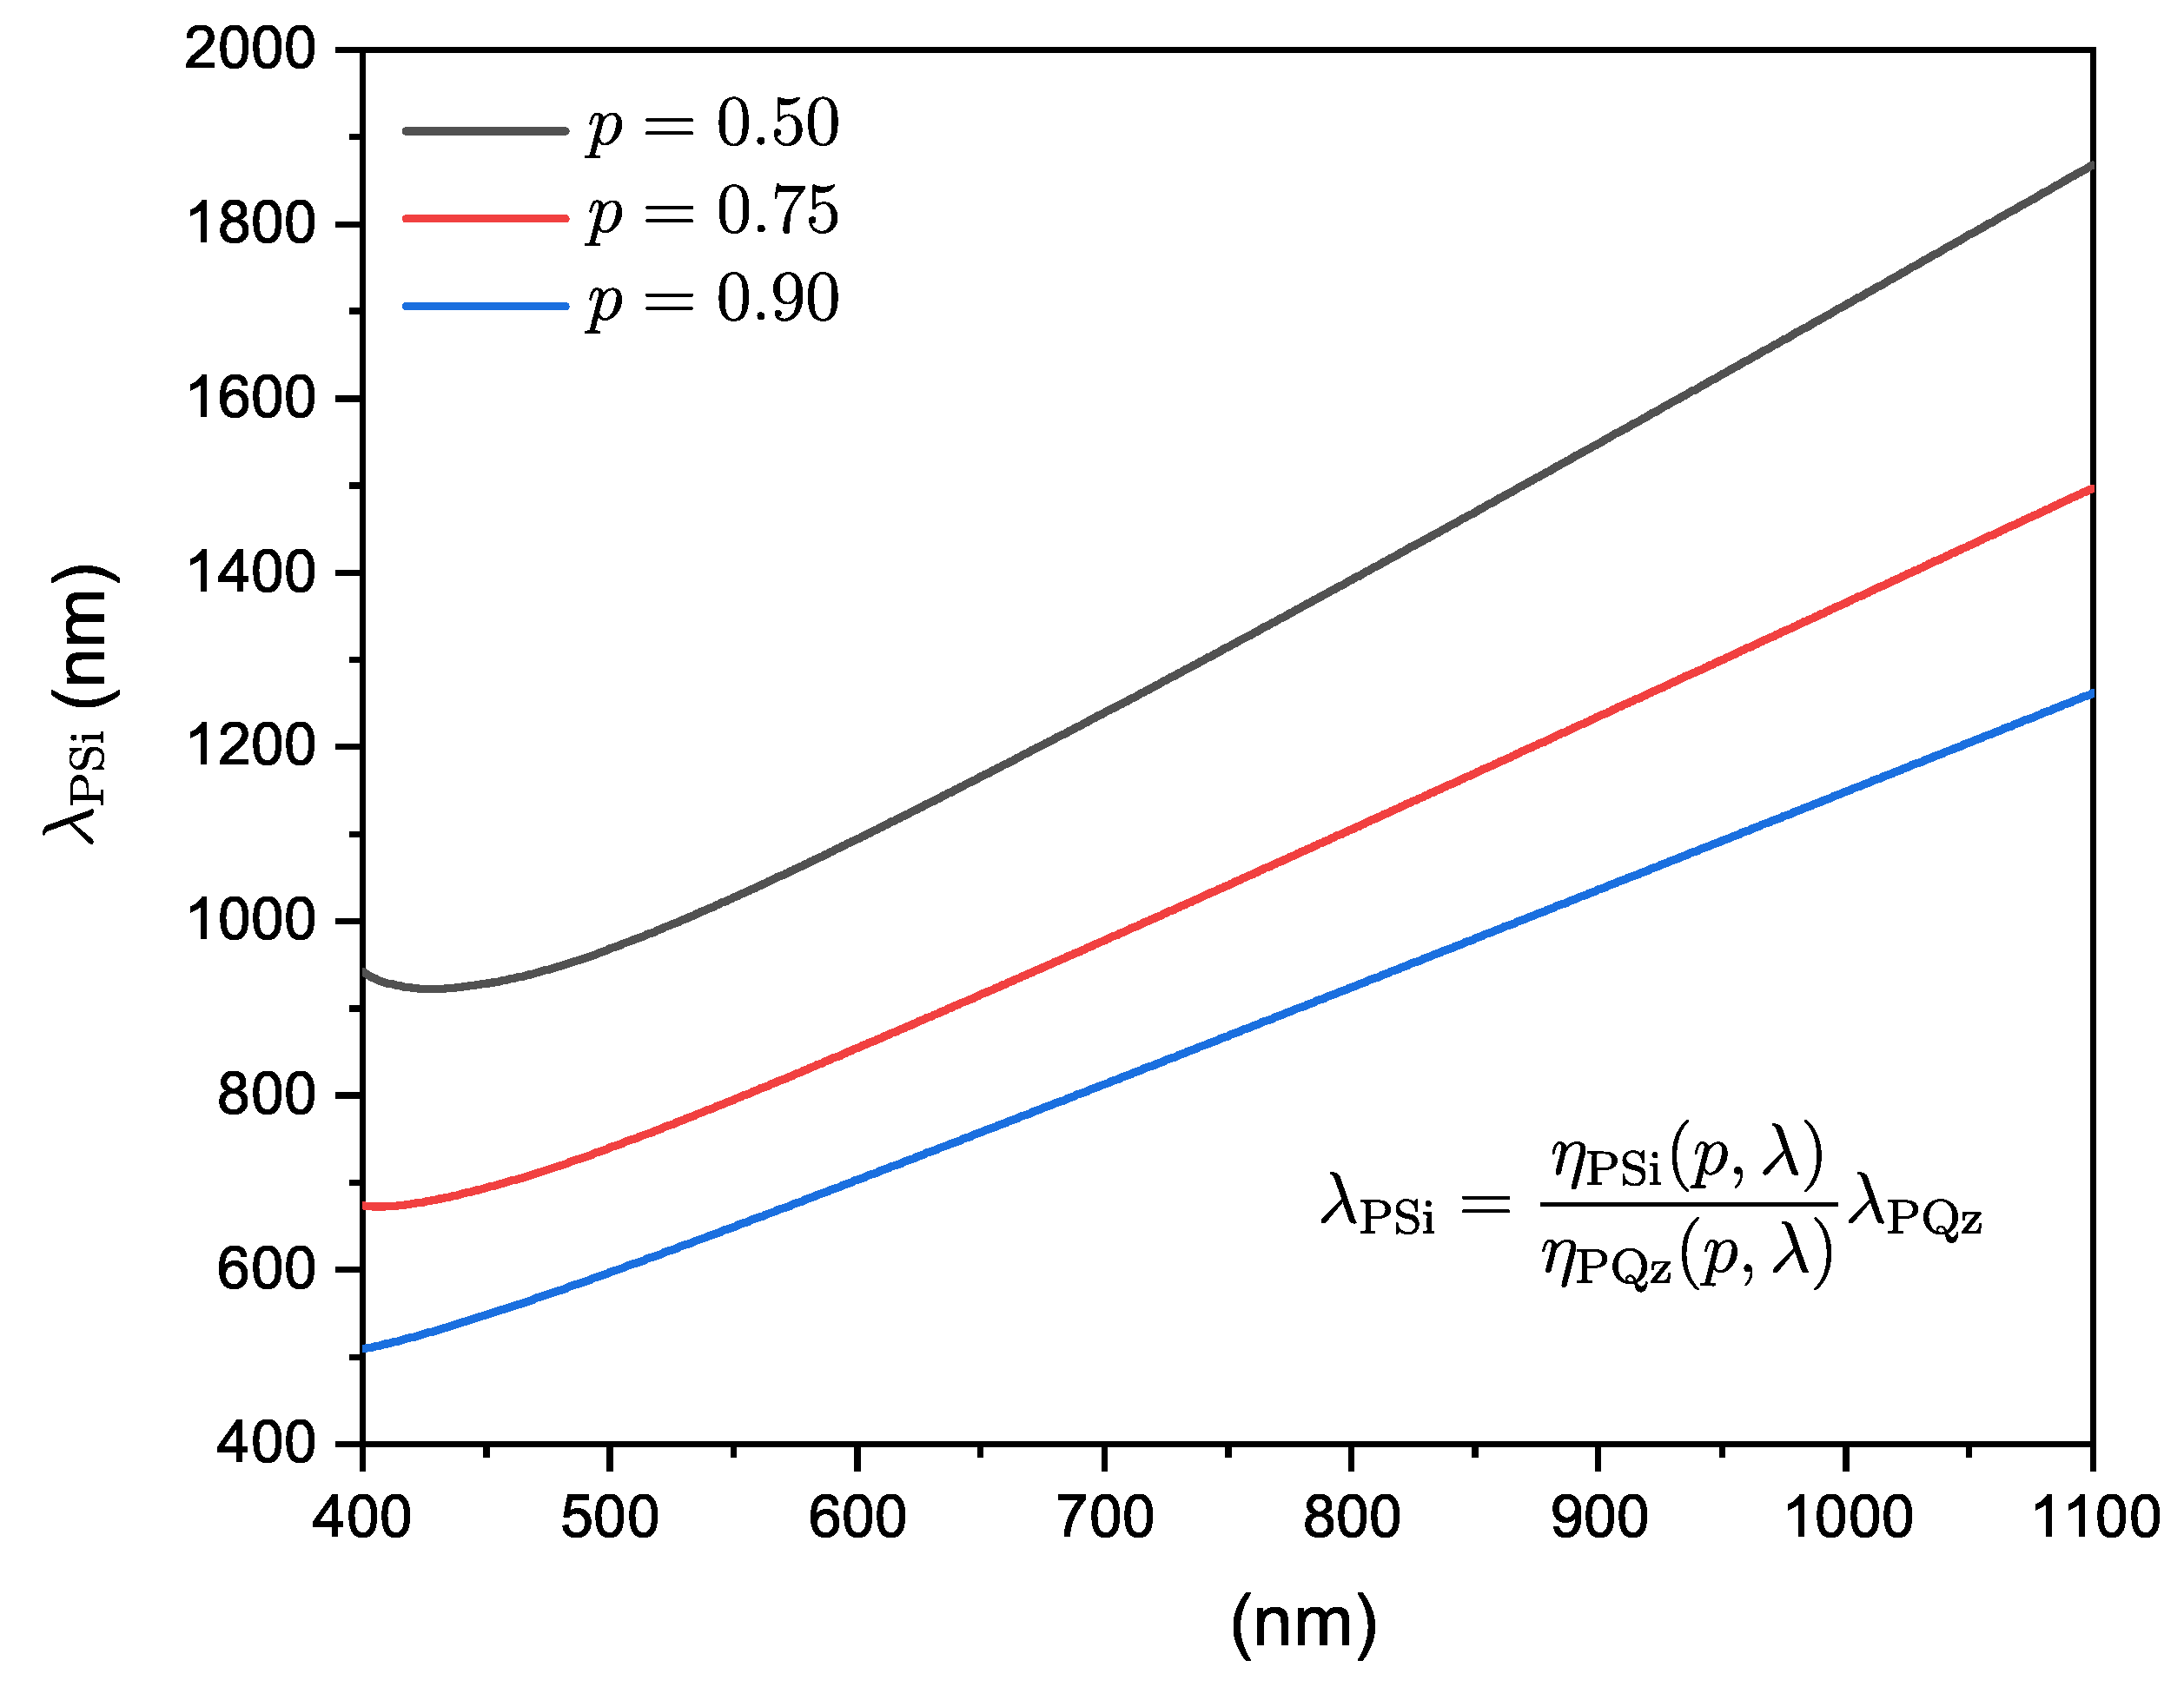
To design a PQz photonic crystal from the thermal oxidation of c-Si, it is necessary to map the bandgap spectral position and bandwidth. Calculating the bandwidth is straightforward as it only depends on the refractive index ratio of the layers. However, determining the centering wavelength is more complex. Given that the refractive index of silicon is larger than that of quartz for all wavelengths (see Figure 2), a blueshift is always going to occur. Nonetheless, this blueshift is not linear. Figure 9 shows the mapping of the center wavelength of PSi and PQz photonic crystals for different porosities. The figure also displays the equation used for the calculations which is derived from the Bragg one-quarter rule. This equation is for the optical path of one layer at room temperature, which means that the layers have the same thickness.
For porosities near 1, the blue curve is almost linear because the refractive index aspect ratio remains almost constant across all centering wavelengths since the layer is mostly air and the dispersive properties of the materials are negligible. Meanwhile, as porosity decreases, the aspect ratio becomes highly dependent on the centering wavelength because the dispersive characteristics of silicon and quartz are no longer negligible. This is particularly noticeable in the blue curve near the UV region, where silicon and quartz are more dispersive. Moreover, this has to be applied to the two layers, making the mapping from Si to Qz inefficient for designing PQz photonic crystals. With this in mind, to design a PQz photonic crystal, it is recommended to first design a PQz photonic crystal with the desired optical response. Then, its characteristics must be mapped to PSi for fabrication and thermal oxidation.

6. Conclusions

This study explored the thermal stability of porous one-dimensional photonic crystals based on silicon (PSi) and its oxidized form, porous quartz (PQz), for high-temperature applications. The results demonstrate that PSi photonic crystals maintain their structural integrity during thermal oxidation, effectively transforming into PQz while preserving the original porosity and multilayer configuration. This enables the creation of photonic structures with identical geometries but differing chemical compositions, enhancing the versatility of these materials for optical applications.
The simulations conducted reveal that the optical response of PSi and PQz photonic crystals exhibits a clear temperature dependence. In particular, PSi photonic structures showed a redshift in the photonic bandgap due to the positive thermal expansion coefficient. In contrast, after complete oxidation, PQz structures exhibited improved thermal stability, with a moderate redshift and minimal changes in optical properties across a wide temperature range. This confirms the potential of PQz as a robust material for high-temperature photonics, offering a tunable yet stable optical response.
Furthermore, the transformation of PSi to PQz through thermal oxidation in an oxidizing atmosphere has been shown to result in minimal alteration of the porosity and structural integrity of the photonic crystal. This process enables a straightforward fabrication route for creating high-temperature stable photonic devices, allowing for precise control of the optical properties via initial design in the PSi phase and subsequent oxidation.
Overall, the findings highlight the feasibility of using porous-silicon-based photonic structures for high-temperature applications by leveraging the thermal stability and tunable optical properties of PQz. This research underscores the importance of material selection and structural design in developing photonic devices capable of maintaining performance under extreme conditions, thereby advancing the field of high-temperature photonics. Future work should focus on optimizing the fabrication processes for industrial scalability and exploring additional material combinations that could further enhance the optical properties of photonic crystals in demanding environments.

Author Contributions

Conceptualization, C.I., I.A.L.-C. and C.F.R.-G.; data curation, C.I., I.A.L.-C. and C.F.R.-G.; formal analysis, I.A.L.-C., J.P.Z.D.P. and C.F.R.-G.; funding acquisition, C.I. and E.K.A.R.; investigation, I.A.L.-C. and C.F.R.-G.; methodology, C.I., I.A.L.-C., E.K.A.R., J.A.R.S. and C.F.R.-G.; resources, C.I., E.K.A.R. and J.P.Z.D.P.; software, C.I., I.A.L.-C. and E.K.A.R.; supervision, C.I., I.A.L.-C. and C.F.R.-G.; validation, I.A.L.-C., J.A.R.S. and C.F.R.-G.; visualization, I.A.L.-C. and C.F.R.-G.; writing—original draft preparation, C.I., I.A.L.-C. and C.F.R.-G.; writing—review and editing, C.I., I.A.L.-C., J.A.R.S., J.P.Z.D.P. and C.F.R.-G. All authors have read and agreed to the published version of the manuscript.

Funding

This research received no external funding.

Institutional Review Board Statement

Not applicable.

Informed Consent Statement

Not applicable.

Data Availability Statement

The data presented in this study are available on request from the corresponding author.

Acknowledgments

The authors are eternally grateful for the scholarships provided by the SNII program from SECIHTI-Mexico.

Conflicts of Interest

The authors declare no conflict of interest.

References

  1. Joannopoulos, J.D.; Villeneuve, P.R.; Fan, S. Photonic crystals: Putting a new twist on light. Nature 1997, 386, 143–149. [Google Scholar] [CrossRef]
  2. Joannopoulos, J.; Villeneuve, P.R.; Fan, S. Photonic crystals. Solid State Commun. 1997, 102, 165–173. [Google Scholar] [CrossRef]
  3. Yablonovitch, E. Inhibited Spontaneous Emission in Solid-State Physics and Electronics. Phys. Rev. Lett. 1987, 58, 2059–2062. [Google Scholar] [CrossRef]
  4. Yablonovitch, E. Photonic band-gap structures. J. Opt. Soc. Am. B 1993, 10, 283–295. [Google Scholar] [CrossRef]
  5. Yablonovitch, E. Photonic Crystals. J. Mod. Opt. 1994, 41, 173–194. [Google Scholar] [CrossRef]
  6. Mizeikis, V.; Juodkazis, S.; Marcinkevičius, A.; Matsuo, S.; Misawa, H. Tailoring and characterization of photonic crystals. J. Photochem. Photobiol. C Photochem. Rev. 2001, 2, 35–69. [Google Scholar] [CrossRef]
  7. Butt, M.; Khonina, S.; Kazanskiy, N. Recent advances in photonic crystal optical devices: A review. Opt. Laser Technol. 2021, 142, 107265. [Google Scholar] [CrossRef]
  8. Fu, L.; Lin, M.; Liang, Z.; Wang, Q.; Zheng, Y.; Ouyang, Z. The Transmission Properties of One-Dimensional Photonic Crystals with Gradient Materials. Materials 2022, 15, 8049. [Google Scholar] [CrossRef] [PubMed]
  9. Zhang, S.; Huang, B.; Bian, Y.; Han, C.; Tian, D.; Chen, X.; Qiu, J.; Zhu, A.; Yang, A.; Shao, J. Two-dimensional photonic crystals as selective filters for thermophotovoltaic applications. Opt. Express 2023, 31, 9186–9195. [Google Scholar] [CrossRef]
  10. Ren, H.; Jiang, C.; Hu, W.; Gao, M.; Wang, J. Photonic crystal channel drop filter with a wavelength-selective reflection micro-cavity. Opt. Express 2006, 14, 2446–2458. [Google Scholar] [CrossRef]
  11. Zimmermann, J.; Kamp, M.; Forchel, A.; März, R. Photonic crystal waveguide directional couplers as wavelength selective optical filters. Opt. Commun. 2004, 230, 387–392. [Google Scholar] [CrossRef]
  12. Gevorgyan, A.H.; Vanyushkin, N.A.; Rafayelyan, M.S. Light localization in 1D chirped photonic crystals. Eur. Phys. J. Plus 2022, 137, 719. [Google Scholar] [CrossRef]
  13. Wilson, M. A photonic crystal localizes light in two dimensions. Phys. Today 2007, 60, 22–23. [Google Scholar] [CrossRef]
  14. Deych, L.; Lisyansky, A. Localization of light in one-dimensional disordered photonic crystals: Statistics of resonant transmission in the band gap region. In Proceedings of the Frontiers in Optics; Optica Publishing Group: Washington, DC, USA, 2003; p. WB1. [Google Scholar] [CrossRef]
  15. Tanaue, H.B.; Reyes-Gómez, E.; Bruno-Alfonso, A. Light localization in one-dimensional photonic crystal heterostructures. Photonics Nanostruct. Fundam. Appl. 2021, 47, 100958. [Google Scholar] [CrossRef]
  16. Kang, L.; Fei, H.; Lin, H.; Wu, M.; Wang, X.; Zhang, M.; Liu, X.; Sun, F.; Chen, Z. Thermal tunable silicon valley photonic crystal ring resonators at the telecommunication wavelength. Opt. Express 2023, 31, 2807–2815. [Google Scholar] [CrossRef] [PubMed]
  17. Singh, J.J.; Dhawan, D.; Gupta, N. All-optical photonic crystal logic gates for optical computing: An extensive review. Opt. Eng. 2020, 59, 110901. [Google Scholar] [CrossRef]
  18. Rao, D.G.S.; Palacharla, V.; Swarnakar, S.; Kumar, S. Design of all-optical D flip-flop using photonic crystal waveguides for optical computing and networking. Appl. Opt. 2020, 59, 7139–7143. [Google Scholar] [CrossRef] [PubMed]
  19. Rao, D.G.S.; Swarnakar, S.; Kumar, S. Performance analysis of all-optical NAND, NOR, and XNOR logic gates using photonic crystal waveguide for optical computing applications. Opt. Eng. 2020, 59, 057101. [Google Scholar] [CrossRef]
  20. Sayed, F.A.; Elsayed, H.A.; Mehaney, A.; Eissa, M.F.; Aly, A.H. A doped-polymer based porous silicon photonic crystal sensor for the detection of gamma-ray radiation. RSC Adv. 2023, 13, 3123–3138. [Google Scholar] [CrossRef] [PubMed]
  21. Zaky, Z.A.; Al-Dossari, M.; Sharma, A.; Aly, A.H. Effective pressure sensor using the parity-time symmetric photonic crystal. Phys. Scr. 2023, 98, 035522. [Google Scholar] [CrossRef]
  22. Pacholski, C. Photonic Crystal Sensors Based on Porous Silicon. Sensors 2013, 13, 4694–4713. [Google Scholar] [CrossRef] [PubMed]
  23. Exner, A.T.; Pavlichenko, I.; Lotsch, B.V.; Scarpa, G.; Lugli, P. Low-Cost Thermo-Optic Imaging Sensors: A Detection Principle Based on Tunable One-Dimensional Photonic Crystals. ACS Appl. Mater. Interfaces 2013, 5, 1575–1582. [Google Scholar] [CrossRef] [PubMed]
  24. Carroll, L.; Lee, J.S.; Scarcella, C.; Gradkowski, K.; Duperron, M.; Lu, H.; Zhao, Y.; Eason, C.; Morrissey, P.; Rensing, M.; et al. Photonic Packaging: Transforming Silicon Photonic Integrated Circuits into Photonic Devices. Appl. Sci. 2016, 6, 426. [Google Scholar] [CrossRef]
  25. Dong, P.; Chen, Y.K.; Duan, G.H.; Neilson, D.T. Silicon photonic devices and integrated circuits. Nanophotonics 2014, 3, 215–228. [Google Scholar] [CrossRef]
  26. Guo, X.; Ji, X.; Yao, B.; Tan, T.; Chu, A.; Westreich, O.; Dutt, A.; Wong, C.; Su, Y. Ultra-wideband integrated photonic devices on silicon platform: From visible to mid-IR. Nanophotonics 2023, 12, 167–196. [Google Scholar] [CrossRef] [PubMed]
  27. Isaza, C.; Lujan-Cabrera, I.A.; Anaya Rivera, E.K.; Rizzo Sierra, J.A.; Zavala De Paz, J.P.; Ramirez-Gutierrez, C.F. Generation of a Synthetic Database for the Optical Response of One-Dimensional Photonic Crystals Using Genetic Algorithms. Mathematics 2022, 10, 4484. [Google Scholar] [CrossRef]
  28. Yablonovitch, E. Photonic crystals: Semiconductors of light. Sci. Am. 2001, 285, 46–55. [Google Scholar] [CrossRef]
  29. Kamp, M.; Happ, T.; Mahnkopf, S.; Duan, G.; Anand, S.; Forchel, A. Semiconductor photonic crystals for optoelectronics. Phys. E Low-Dimens. Syst. Nanostruct. 2004, 21, 802–808. [Google Scholar] [CrossRef]
  30. Benisty, H.; Lourtioz, J.M.; Chelnokov, A.; Combrie, S.; Checoury, X. Recent Advances Toward Optical Devices in Semiconductor-Based Photonic Crystals. Proc. IEEE 2006, 94, 997–1023. [Google Scholar] [CrossRef]
  31. El-Kady, I.; Sigalas, M.M.; Biswas, R.; Ho, K.M.; Soukoulis, C.M. Metallic photonic crystals at optical wavelengths. Phys. Rev. B 2000, 62, 15299–15302. [Google Scholar] [CrossRef]
  32. Vasilantonakis, N.; Terzaki, K.; Sakellari, I.; Purlys, V.; Gray, D.; Soukoulis, C.M.; Vamvakaki, M.; Kafesaki, M.; Farsari, M. Three-Dimensional Metallic Photonic Crystals with Optical Bandgaps. Adv. Mater. 2012, 24, 1101–1105. [Google Scholar] [CrossRef] [PubMed]
  33. Romanato, F.; Businaro, L.; Vaccari, L.; Cabrini, S.; Candeloro, P.; De Vittorio, M.; Passaseo, A.; Todaro, M.; Cingolani, R.; Cattaruzza, E.; et al. Fabrication of 3D metallic photonic crystals by X-ray lithography. Microelectron. Eng. 2003, 67–68, 479–486. [Google Scholar] [CrossRef]
  34. Qian, L.; Hu, Y.; Chen, Z.; Zhao, D.; Dong, J.; Chen, X. Temperature Dependence of Optical Bistability in Superconductor–Semiconductor Photonic Crystals Embedded with Graphene. Crystals 2023, 13, 545. [Google Scholar] [CrossRef]
  35. Aly, A.H.; Sabra, W. Superconductor-Semiconductor Metamaterial Photonic Crystals. J. Supercond. Nov. Magn. 2016, 29, 1981–1986. [Google Scholar] [CrossRef]
  36. Segovia-Chaves, F.; Vinck-Posada, H. Dependence of the defect mode with temperature, pressure and angle of incidence in a 1D semiconductor-superconductor photonic crystal. Phys. C Supercond. Its Appl. 2018, 553, 1–7. [Google Scholar] [CrossRef]
  37. Kitzerow, H.S.; Lorenz, A.; Matthias, H. Tuneable photonic crystals obtained by liquid crystal infiltration. Phys. Status Solidi (a) 2007, 204, 3754–3767. [Google Scholar] [CrossRef]
  38. Ozaki, M.; Matsuhisa, Y.; Yoshida, H.; Ozaki, R.; Fujii, A. Photonic crystals based on chiral liquid crystal. Phys. Status Solidi (a) 2007, 204, 3777–3789. [Google Scholar] [CrossRef]
  39. Ramirez-Gutierrez, C.F.; Martinez-Hernandez, H.D.; Lujan-Cabrera, I.A.; Rodriguez-García, M.E. Design, fabrication, and optical characterization of one-dimensional photonic crystals based on porous silicon assisted by in-situ photoacoustics. Sci. Rep. 2019, 9, 14732. [Google Scholar] [CrossRef] [PubMed]
  40. Calvo, M.E.; Colodrero, S.; Hidalgo, N.; Lozano, G.; López-López, C.; Sánchez-Sobrado, O.; Míguez, H. Porous one dimensional photonic crystals: Novel multifunctional materials for environmental and energy applications. Energy Environ. Sci. 2011, 4, 4800–4812. [Google Scholar] [CrossRef]
  41. Ortiz-Vazquez, E.; Lujan-Cabrera, I.; Isaza, C.; Rizzo-Sierra, J.; Ramirez-Gutierrez, C. Design of broadband modulated one-dimensional photonic crystals based on porous silicon using evolutionary search. Optik 2022, 260, 169002. [Google Scholar] [CrossRef]
  42. Dias, M.R.S.; Gong, T.; Duncan, M.A.; Ness, S.C.; McCormack, S.J.; Leite, M.S.; Munday, J.N. Photonics roadmap for ultra-high-temperature thermophotovoltaics. Joule 2023, 7, 2209–2227. [Google Scholar] [CrossRef]
  43. Kim, J.H.; Jung, S.M.; Shin, M.W. High-temperature degradation of one-dimensional metallodielectric (W/SiO2) photonic crystal as selective thermal emitter for thermophotovoltaic system. Opt. Mater. 2017, 72, 45–51. [Google Scholar] [CrossRef]
  44. Du, Q. High energy radiation damage on silicon photonic devices: A review. Opt. Mater. Express 2023, 13, 403–412. [Google Scholar] [CrossRef]
  45. Rinnerbauer, V.; Ndao, S.; Yeng, Y.X.; Chan, W.R.; Senkevich, J.J.; Joannopoulos, J.D.; Soljačić, M.; Celanovic, I. Recent developments in high-temperature photonic crystals for energy conversion. Energy Environ. Sci. 2012, 5, 8815–8823. [Google Scholar] [CrossRef]
  46. Tan, C. Review and analysis of refractive index temperature dependence in amorphous SiO2. J. Non-Cryst. Solids 1998, 238, 30–36. [Google Scholar] [CrossRef]
  47. Tan, C.Z. Dependence of the refractive index on density, temperature, and the wavelength of the incident light. Eur. Phys. J. B 2021, 94, 139. [Google Scholar] [CrossRef]
  48. Waxler, R.M.; Weir, C.E. Effect of Hydrostatic Pressure on the Refractive Indices of Some Solids. J. Res. Natl. Bur. Stand A Phys. Chem. 1965, 69A, 325–333. [Google Scholar] [CrossRef]
  49. Fan, S. Thermal Photonics and Energy Applications. Joule 2017, 1, 264–273. [Google Scholar] [CrossRef]
  50. Yoo, M.J.; Pyun, K.R.; Jung, Y.; Lee, M.; Lee, J.; Ko, S.H. Switchable radiative cooling and solar heating for sustainable thermal management. Nanophotonics 2024, 13, 543–561. [Google Scholar] [CrossRef]
  51. Bahramipour, S.S.; Askarpour, A.N. One-dimensional photonic crystal with tilted termination and its angular filtering properties for radiative cooling. Opt. Express 2024, 32, 5191–5205. [Google Scholar] [CrossRef] [PubMed]
  52. Li, W.; Liu, T.; Zhu, J. Thermal photonics for sustainability. Nanophotonics 2024, 13, 539–541. [Google Scholar] [CrossRef]
  53. Ramirez-Gutierrez, C.F.; Lujan-Cabrera, I.A.; Isaza, C.; Anaya Rivera, E.K.; Rodriguez-Garcia, M.E. In Situ Photoacoustic Study of Optical Properties of P-Type (111) Porous Silicon Thin Films. Nanomaterials 2021, 11, 1314. [Google Scholar] [CrossRef] [PubMed]
  54. Sierra-Moreno, R.F.; Lujan-Cabrera, I.A.; Cabrera-Teran, J.M.; Ortiz-Vazquez, E.; Rodriguez-Garcia, M.E.; Ramirez-Gutierrez, C.F. Study of the optical response of oxidized porous silicon structures by thermal oxidation in air. J. Mater. Sci. 2022, 57, 11226–11241. [Google Scholar] [CrossRef]
  55. Jiménez-Vivanco, M.R.; Herrera, R.; Martínez, L.; Morales, F.; Misaghian, K.; Toledo-Solano, M.; Lugo, J.E. Theoretical and Experimental Study of Optical Losses in a Periodic/Quasiperiodic Structure Based on Porous Si-SiO2. Photonics 2023, 10, 1009. [Google Scholar] [CrossRef]
  56. Castillo-Gallardo, V.; Puente-Díaz, L.E.; Mochán Backal, W.L.; Agarwal, V. Porous silica based controllable reversible freestanding Bragg structures: From omnidirectional mirrors to transparency. Ceram. Int. 2024; in proof. [Google Scholar] [CrossRef]
  57. Schubert, E.F.; Kim, J.K.; Xi, J.Q. Low-refractive-index materials: A new class of optical thin-film materials. Phys. Status Solidi (b) 2007, 244, 3002–3008. [Google Scholar] [CrossRef]
  58. Rajan, S.P.; Keloth Paduvilan, J.; Velayudhan, P.; Krishnageham Sidharthan, S.; Simon, S.M.; Thomas, S. Progress in 2D/3D nanomaterials incorporated polymer thin films for refractive index engineering: A critical review. J. Polym. Res. 2024, 31, 124. [Google Scholar] [CrossRef]
  59. Niklasson, G.A.; Granqvist, C.G.; Hunderi, O. Effective medium models for the optical properties of inhomogeneous materials. Appl. Opt. 1981, 20, 26–30. [Google Scholar] [CrossRef]
  60. Ramirez-Gutierrez, C.F.; Castaño-Yepes, J.D.; Rodriguez-García, M.E. In situ photoacoustic characterization for porous silicon growing: Detection principles. J. Appl. Phys. 2016, 119, 185103. [Google Scholar] [CrossRef]
  61. Kuntyi, O.; Zozulya, G.; Shepida, M. Porous Silicon Formation by Electrochemical Etching. Adv. Mater. Sci. Eng. 2022, 2022, 1482877. [Google Scholar] [CrossRef]
  62. Bardet, B.; De Sousa Meneses, D.; Defforge, T.; Billoué, J.; Gautier, G. In situ investigation of mesoporous silicon oxidation kinetics using infrared emittance spectroscopy. Phys. Chem. Chem. Phys. 2016, 18, 18201–18208. [Google Scholar] [CrossRef]
  63. Green, M.A. Self-consistent optical parameters of intrinsic silicon at 300K including temperature coefficients. Sol. Energy Mater. Sol. Cells 2008, 92, 1305–1310. [Google Scholar] [CrossRef]
  64. Khashan, M.; Nassif, A. Dispersion of the optical constants of quartz and polymethyl methacrylate glasses in a wide spectral range: 0.2–3 μm. Opt. Commun. 2001, 188, 129–139. [Google Scholar] [CrossRef]
  65. Choy, T.C. Effective Medium Theory: Principles and Applications; Oxford University Press: Oxford, UK, 2015; Volume 165. [Google Scholar]
  66. Missoni, L.L.; Ortiz, G.P.; Martínez Ricci, M.L.; Toranzos, V.J.; Mochán, W.L. Rough 1D photonic crystals: A transfer matrix approach. Opt. Mater. 2020, 109, 110012. [Google Scholar] [CrossRef]
  67. Mitsas, C.L.; Siapkas, D.I. Generalized matrix method for analysis of coherent and incoherent reflectance and transmittance of multilayer structures with rough surfaces, interfaces, and finite substrates. Appl. Opt. 1995, 34, 1678–1683. [Google Scholar] [CrossRef]
  68. Rego, G. Temperature Dependence of the Thermo-Optic Coefficient of SiO2 Glass. Sensors 2023, 23, 6023. [Google Scholar] [CrossRef]
  69. Watanabe, H.; Yamada, N.; Okaji, M. Linear Thermal Expansion Coefficient of Silicon from 293 to 1000 K. Int. J. Thermophys. 2004, 25, 221–236. [Google Scholar] [CrossRef]
  70. Okada, Y.; Tokumaru, Y. Precise determination of lattice parameter and thermal expansion coefficient of silicon between 300 and 1500 K. J. Appl. Phys. 1984, 56, 314–320. [Google Scholar] [CrossRef]
  71. Polyakova, I.G. 4. The Main Silica Phases and Some of Their Properties. In Glass; Schmelzer, J.W.P., Ed.; De Gruyter: Berlin, Germany; Boston, MA, USA, 2014; pp. 197–268. [Google Scholar] [CrossRef]
  72. Johnson, S.E.; Song, W.J.; Cook, A.C.; Vel, S.S.; Gerbi, C.C. The quartz αβ phase transition: Does it drive damage and reaction in continental crust? Earth Planet. Sci. Lett. 2021, 553, 116622. [Google Scholar] [CrossRef]
  73. Vuye, G.; Fisson, S.; Nguyen Van, V.; Wang, Y.; Rivory, J.; Abelès, F. Temperature dependence of the dielectric function of silicon using in situ spectroscopic ellipsometry. Thin Solid Film. 1993, 233, 166–170. [Google Scholar] [CrossRef]
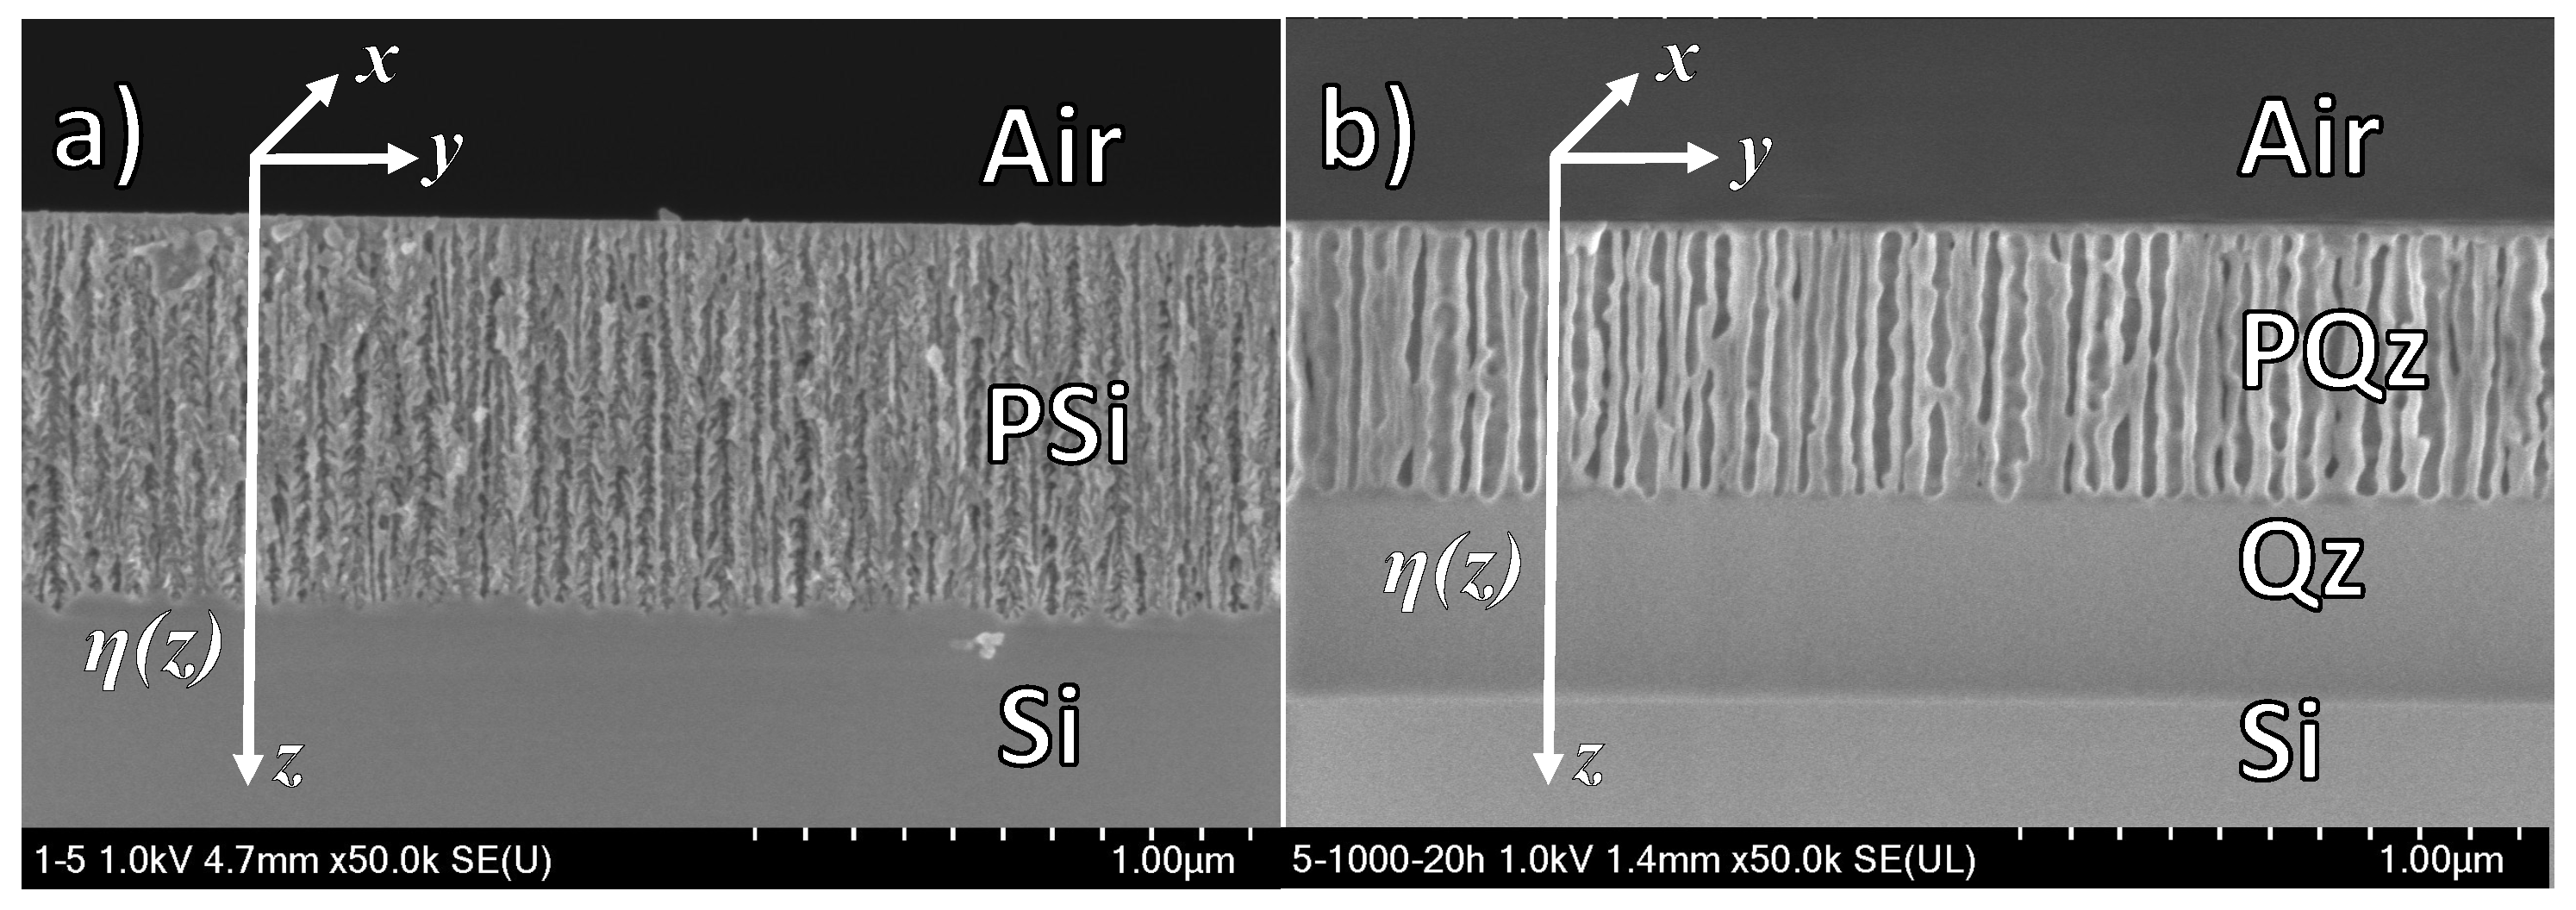
Figure 1. SEM images of the cross-sections of (a) a thin film of porous silicon supported on a silicon substrate, and (b) a heterostructure of thin films consisting of a porous quartz film followed by a bulk quartz film supported on crystalline silicon. These images correspond to different samples, presented as examples of materials and structures that can be experimentally obtained.
Photonics 12 00094 g001
Figure 2. Refractive index ( η ) and extinction coefficient ( κ ) as a function of wavelength for (a) bulk silicon [63] and (b) bulk quartz [64] at the same scale for comparison. The inset in (b) shows a zoom-in of the quartz optical constants as a function of the wavelength. Refractive index variation of (c) crystalline Si and (c) quartz for two different wavelengths (550 and 800 nm) using the effective medium theory of a mixture with air [65]. The inset in (d) displays a zoom-in of the quartz refractive index as a function of the porosity for better detail appreciation.
Photonics 12 00094 g002
Figure 3. Thermal expansion coefficient as a function of temperature of (a) silicon and (b) quartz.
Photonics 12 00094 g003
Figure 4. Graphical representation of a porous silicon (PSi) photonic crystal, which is later transformed into a porous quartz (PQz) photonic crystal through thermal oxidation. Since PSi has a higher refractive index, the structure reflects longer wavelengths, such as red. However, when it undergoes thermal oxidation to become PQz, despite maintaining the same geometric configuration, the refractive index decreases. As a result, the optical path is shorter, and the structure reflects shorter wavelengths, such as green.
Photonics 12 00094 g004
Figure 5. Contour plot of the optical response (reflectance) of (a) a DBR and (b) an FPM photonic crystal as a function of temperature. The color scale represents the reflectance values. Experimental data for the refractive index were taken from [73].
Photonics 12 00094 g005
Figure 6. Optical response of PSi DBR and FPM as a function of temperature. (a,b) Reflectance response at 20 and 1000° of DBR and FPM. Colored boxes represent the color simulation for each temperature. Contour plots of the optical response of (c) DBR and (d) FPM as a function of temperature. Thermo-optical coefficient and thermal expansion data were used for the simulation.
Photonics 12 00094 g006
Figure 7. Optical response of PSi DBR and FPM as a function of oxidation percentage and transformation of c-Si to quartz: (a,b) Reflectance response at three different oxidation percentages. The colored boxes represent the simulated color for each percentage. Contour plots showing the optical response of (c) DBR and (d) FPM as a function of oxidation percentage.
Photonics 12 00094 g007
Figure 8. Optical response of PQz DBR and FPM as a function of temperature. (a,b) Reflectance response at 20, 574, and 1000° of DBR and FPM. Colored boxes represent the color simulation for each temperature. The inset in (b) shows the displacement on the defect mode at different temperatures. Contour plots of the optical response of (c) DBR and (d) FPM as a function of temperature. Thermo-optical coefficient and thermal expansion data were used for the simulation.
Photonics 12 00094 g008
Figure 9. Behavior of the centering wavelength for PSi and PQz photonic crystals (with same layer thickness) for different porosities. Also displayed here is the equation used for the calculations which was derived from the one-quarter Bragg rule.
Photonics 12 00094 g009
Table 1. Simulation parameters for DBR and FPM photonic structures. Herein, H and L represent the layers with high and low refractive index, respectively. By contrast, H c represents the defective layer in the FPM structure and S is the substrate (c-Si).
Photonic StructureDBRFPM
Structure ( H L ) 20 S ( H L ) 20 H c ( L H ) 20 s
p H 0.750.75
p L 0.910.91
p H c 0.750.75
d H (nm)160160
d L (nm)120120
d H c (nm)-100
Disclaimer/Publisher’s Note: The statements, opinions and data contained in all publications are solely those of the individual author(s) and contributor(s) and not of MDPI and/or the editor(s). MDPI and/or the editor(s) disclaim responsibility for any injury to people or property resulting from any ideas, methods, instructions or products referred to in the content.