Abstract
We demonstrate efficient loading of an Yb three-dimensional magneto-optical trap (3D MOT) on the 1S0 → 1P1 transition. The experiment employs a two-dimensional magneto-optical trap (2D MOT) as an efficient cold atom source. Through optimization of the 2D MOT, auxiliary Zeeman slower, and push beam parameters that govern atomic capture, we achieve an atomic loading rate of 5 × atoms/s in the 3D MOT, with approximately ∼107 trapped atoms. Our experimental results confirm the successful transfer of a substantial number of atoms from the 2D region to the science chamber via the push beam, providing an experimental foundation for subsequent implementation of narrow-line MOT and two-color MOT.
1. Introduction
Alkaline-earth atoms play a crucial role in quantum technologies, particularly in quantum information processing [1,2], high-precision quantum simulation [3,4,5,6], and quantum interferometry [7,8]. Among them, ytterbium atoms have emerged as an ideal system for studying many-body interactions, quantum degenerate gases, and optical lattice clocks [9,10,11,12], owing to their narrow-line metastable state.
The narrow-linewidth cooling of ytterbium atoms presents significant technical challenges due to weak cooling forces and limited capture velocity. To overcome these challenges, researchers have made extensive efforts. These include crossed-beam slowing techniques that enhance loading rate by combining a Zeeman slower with additional broad-line transition laser beams [13]. Two-color MOT systems utilize both broad-line and narrow-line transitions for rapid loading and efficient cooling [14]. For single-atom manipulation, narrow-linewidth cooling and imaging in optical tweezer arrays has been demonstrated using the narrow-line transition with frequency broadening [15]. Additionally, compact 2D-/3D-MOT setups achieve narrow-linewidth trapping and quantum-degenerate gases without a Zeeman slower [16].
Among the various approaches, the two-dimensional magneto-optical trap (2D MOT) has emerged as a particularly promising solution, owing to its compact structure and efficiency as an atomic source [15,16,17,18,19]. This approach effectively circumvents the technical limitations associated with traditional methods such as the Zeeman slower [20,21], including vacuum contamination and interference from blackbody radiation generated by high-temperature ytterbium ovens. While the 2D MOT offers advantages in compactness and efficiency, it delivers relatively low atom flux to the 3D region. This makes it difficult to directly observe atomic fluorescence and reliably determine whether the push beam has successfully transferred atoms from the 2D to the 3D region. This confirmation is crucial for the successful implementation of narrow-line three-dimensional magneto-optical trap (3D MOT). To address this challenge, the broad-line 3D MOT offers a viable solution, while certain experimental aspects of this approach remain insufficiently explored.
Herein, we employed a 2D MOT as the atomic source to investigate the loading of Yb atoms in a broad-line 3D MOT. The loading rate was systematically characterized as a function of various experimental parameters, including the optical power for the 2D MOT, the power for the Zeeman slower beam, and different push beam configurations. The results provide a robust foundation for the investigation of narrow-linewidth laser cooling based on the 1S0 → 3P1 intercombination transition at 556 nm.
2. Experimental System
The experimental protocol was executed under ultra-high-vacuum (UHV) conditions (∼2.2 × Torr) shown in Figure 1a. The system comprises three chambers: an oven chamber, a two-dimensional magneto-optical trap (2D MOT) for transverse cooling, and a science chamber. The science chamber houses a three-dimensional magneto-optical trap (3D MOT) dedicated to the preparation of ultracold atoms. Notably, this setup also contains an auxiliary Zeeman slower, as shown in Figure 1b.
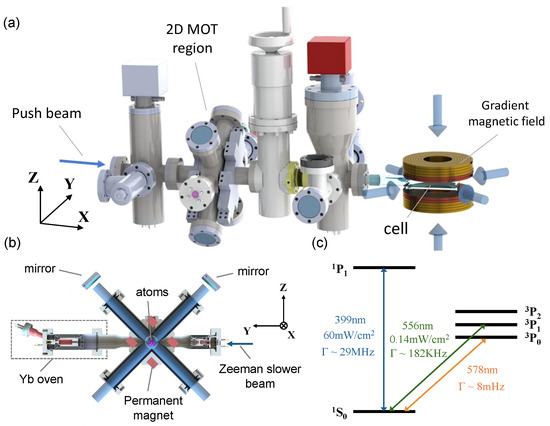
Figure 1.
Experimental setup, schematic of the 2D MOT region, and energy-level diagram of ytterbium atoms. (a) Schematic diagram of the experimental setup. The figure shows the complete experimental system for Yb atom cooling and trapping. The Yb atomic beam produced by the oven is first trapped by the 2D MOT, and then pushed into the 3D MOT by the push beam for further cooling and trapping. (b) Schematic of the 2D MOT system. This figure highlights the Yb oven, Zeeman slower beam, and the 2D MOT structure. A detailed view of the 2D MOT shows its two mutually perpendicular, retro-reflected beams and marks the positions of the permanent magnets along with the trapped atomic cloud. (c) Yb atomic energy structure. It shows the energy levels involved in the transitions affording the 399 and 556 nm laser used herein.
Yb samples were heated in a home-made oven chamber to 380 ± 2 °C to achieve a saturated vapor pressure of 3 × Torr for continuous atomic flux generation. The thermal atomic flux was hydrodynamically collimated using an array of precision-engineered microchannel nozzles. This optimized geometry facilitated the delivery of a high-flux low-divergence atomic beam to subsequent 2D laser cooling stages.
In the 2D MOT region, eight sets of permanent magnets were arranged in a symmetric configuration in the orthogonal plane defined by the cross-arm structure. As shown in Figure 1b, the magnet array generated a magnetic field with axial and radial gradients of 74.90 and 6.185 G/cm, respectively. A push beam transported atoms from the 2D MOT region into the science chamber, where they were cooled by a 3D MOT on the 1S0 → 1P1 transition. The diameters of the 2D MOT and push beam were approximately 16.8 and 6.8 mm, respectively. A pair of anti-Helmholtz coils positioned above and below the science chamber provided the magnetic field gradient necessary for the 3D MOT. The axial magnetic field gradient of the 3D MOT was typically maintained at 46 G/cm. The atom number and MOT loading rate were determined by collecting the fluorescence.
The excited states of Yb gave rise to two important transitions (Figure 1c). The broad-line transition (1S0 → 1P1, 399 nm, linewidth 29 MHz) was used for the blue MOT, with a fiber laser generating the required 399 nm laser for cooling. Additionally, the 1S0 → 3P1 transition, which is a narrow-line transition characterized by its low scattering force and slow acceleration, can also serve as a push beam [15].
The optical path system is schematically presented in Figure 2. There are 2D MOT cooling beams, a Zeeman slower beam, a push beam and blue MOT trapping beams. The laser frequency is locked at a detuning of −109 MHz from the 1S0 → 1P1resonance transition; the 2D MOT trapping beams are frequency-shifted by the first-order diffraction of an acousto-optic modulator (AOM) driven at +74 MHz, corresponding to a detuning of −35 MHz. The Zeeman slower (ZS) beam shares the same AOM with the 2D MOT trapping beams and uses the zeroth-order diffracted beam, producing a detuning of −109 MHz. The push beam is modulated by an AOM at +109 MHz, matching the resonant frequency. Both the horizontal and vertical trapping beams of the 3D MOT are shifted by AOMs operating at +80 MHz, resulting in a detuning of −19 MHz. An ultra-low-expansion (ULE) cavity was employed to lock the fiber laser [22]. The fineness of this cavity is approximately 1500, and the free spectral range (FSR) is 1.5 GHz; this exhibits a full width at half maximum (FWHM) of the cavity resonance for near ∼1 MHz. Compared with the wavelength meter locking scheme, the laser frequency locked to the cavity is more stable due to smaller drift. This study also employed a 556 nm laser as a push beam to examine its influence on the atom loading rate. Like the blue laser locking scheme, the 556 nm laser system was also frequency-stabilized by another ultrastable optical reference cavity (stable laser systems).
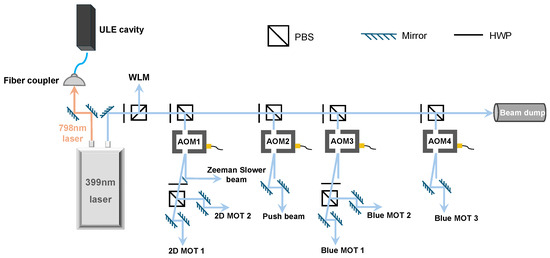
Figure 2.
Schematic of the laser setup. A fiber laser with a wavelength of 399 nm was used to provide the beams required for the experiment. PBS: polarizing beam splitter; AOM: acousto-optic modulator; HWP: half-wave plate; WLM: wavelength meter; ULE cavity: ultra-low-expansion cavity.
3. Results and Discussion
The real-time fluorescence was detected via an Amplified Detector (APD) (PDA20X2). The loading curves are shown in Figure 3. We analyze the curves by the function of [23,24], where R is the loading rate and is the collisional loss rate. The insert in Figure 3 is the fluorescence image of the 3D MOT with atom number around 106 at a low field of ∼4 G/cm.
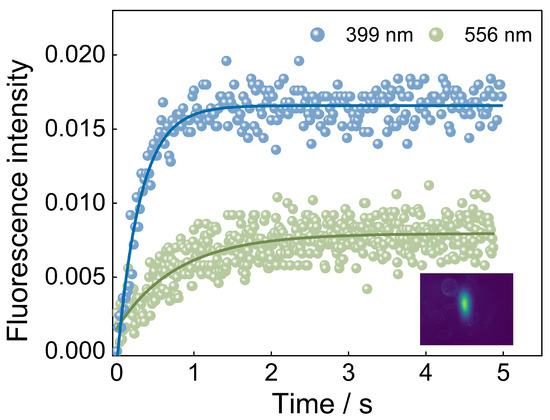
Figure 3.
Loading curves for the 399 and 556 nm light as push beams. The corresponding atomic loading rates are 0.78 × atoms/s and 0.15 × atoms/s respectively. The solid line represents the fitting result based on the formula given in the text. The inset shows the atomic fluorescence image under low magnetic field condition.
We characterized the dependence of the atomic loading rate on several important optical parameters (Figure 4), including the distance from the laser power for the 2D MOT and the Zeeman slower beam.For the 2D MOT, the loading rate increased with the optical power. The limited laser power was insufficient to achieve saturation, although the loading rate was expected to saturate at high power [25]. The solid line represents the fitting curve with a theory. The loading rate L is proportional to the atomic flux Φ, and the atomic flux is proportional to ; it follows that , where , and represents the capture velocity [17].
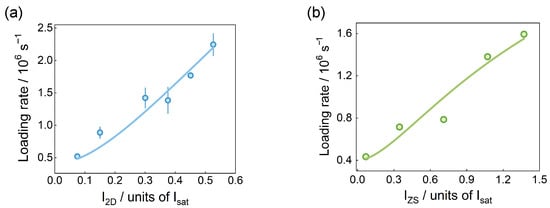
Figure 4.
Dependence of 3D MOT loading rate on the optical power for the (a) 2D MOT cooling beam and (b) Zeeman slower beam. For each point, the oven temperature is set to 370 °C. (The optimal loading rate in (a) corresponds to = 0.526, with = 1.295, = 0.004. In (b), the optimal loading rate corresponds to = 1.372, with = 0.316, = 0.005.) Circles and solid lines represent the experimental data and corresponding linear fits, respectively.
Figure 4b shows the power effect of the Zeeman slower beam, which has similar behavior to Figure 4a; we use the same model to fit the data.
For the 399 nm push beam, the loading rates are maximized around 0.01 ( = 60 mW/cm2), with higher powers resulting in lower loading rates (Figure 5a). This behavior occurs because larger push beam intensities result in the finite capture efficiency of longitudinal velocities beyond the capture velocity. Consequently, when the push beam intensities exceed a certain threshold, the atomic loading rate decreases.
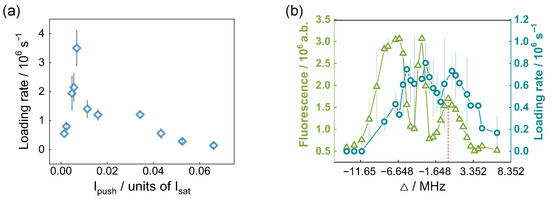
Figure 5.
Dependence of the 3D MOT loading rate on push beam power and detuning (Δ). (a) Loading rate as a function of optical power for the 399 nm push beam. (b) Effects of Δ on the atomic loading rate (right axis) for the 556 nm push beam (dark green circles: spectroscopic data for the 1S0 → 3P1 transition; red dotted line: resonant position). The three peaks represent the three magnetic sublevels of 3P1. Both the push beam parameters are = 1.421, = 0.301 and T = 370 °C. However, the push beam powers that achieve the optimal loading are different for them, which are = 0.007 and = 2.164.
We had taken the broad-line transition (29 MHz) laser as push beam to research the power dependence of the loading rate. However, owing to the large natural linewidth of the 1S0 → 1P1 transition, the scattering force due to this transition would push the atoms across the vacuum chamber at a velocity beyond the capture velocity of the narrow-line MOT; this makes it difficult to capture atoms in a narrow-line MOT in further experiments. Hence, we also researched the green laser (556 nm) with a narrow-line transition (182 kHz) as a push beam. In order to find the resonance frequency for the narrow-line transition, spectroscopy was performed, shown in Figure 5b.
Owing to the Doppler effect, the atomic loading rate was offset relative to the resonant transition. The detuning for the maximum atomic loading rate was approximately −0.5 MHz with respect to the resonant frequency. When the detuning exceeded this critical threshold, the system entered the detuning regime (), the scattering force decreasing because of a decrease in the photon scattering cross-section. This decrease resulted in a reduction in the atomic loading rate. The power effect is not shown here, as it should behave similarly to the blue laser shown in Figure 3. The maximum loading rate was lower than that observed for the blue laser because of the notably smaller scattering force in the former case. The loading curves for the 556 and 399 nm push beams are shown together in Figure 3; it can be found that the atomic loading rate was much higher for the 399 nm beam.
The atomic loading rate increased with the oven temperature (Figure 6). After setting each temperature, we allowed the system to stabilize for 30 min to reach thermal equilibrium before commencing measurements, ultimately recording a maximum loading rate of 9.19 × 10⁵ atoms/s. The solid line in the figure is a result obtained through simple theoretical fitting, where the loading rate is proportional to [26]. Although higher loading rates could theoretically be obtained through further temperature elevation, practical limitations prevented additional optimization. Specifically, to ensure equipment integrity and prevent potential thermal damage to the vacuum system components, we maintained the oven temperature at levels below the operational safety threshold.
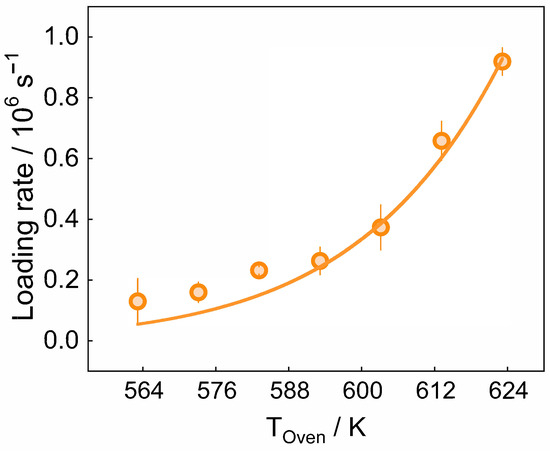
Figure 6.
Effect of oven temperature (Kelvin temperature) on loading rate. Circles and the solid line represent the experimental data and corresponding exponential fit, respectively. The other parameters are = 1.365, = 0.338 and = 0.002 .
4. Conclusions
This study demonstrates efficient loading of ytterbium atoms in a blue MOT. We obtain the relationship between the laser power for the 2D MOT and Zeeman slower within an adjustable power range and the loading rate of the 3D MOT. Even with limited laser power, where the atomic loading rate does not reach saturation, a sufficient number of atoms could still be obtained, which laid the foundation for subsequent optical tweezer experiments [27]. We also studied the influence of push beams at two different frequencies on the loading rate. The results show that using a 399 nm push beam leads to a higher atomic loading rate. Moreover, we found that a significant blue MOT could be established even at a low gradient of ∼4 G/cm, holding promise for the development of a two-color Yb MOT.
In addition, we also obtain the loading rate of multiple isotopes for ytterbium in the MOT. At an oven temperature of 643.15 K, the parameters of each isotope are summarized in Table 1, including statistics, abundance, detuning and loading rate. From the data in the table, it can be seen that the loading rate of isotopes is positively correlated with their natural abundance.

Table 1.
Overview of loading rates of the stable isotopes of ytterbium. The natural abundances are referenced [28]. Δf is the relative frequency shift to 174Yb for the singlet cooling transition. L shows the relative loading rates obtained in this work.
Author Contributions
Conceptualization, Z.Z.; methodology, Z.Z.; software, Z.Z. and Q.Z.; validation, S.W. and J.J.; formal analysis, W.L. and J.W.; investigation, Y.L.; data curation, J.M.; writing—original draft preparation, Z.Z.; writing—review and editing, W.L. and J.W.; visualization, W.L.; supervision, J.W.; project administration, J.W.; funding acquisition, J.W. All authors have read and agreed to the published version of the manuscript.
Funding
This work is supported by the Innovation Program for Quantum Science and Technology (Grant No. 2021ZD0302103), the National Natural Science Foundation of China (Grant Nos. 62325505, 62020106014, 62175140, 62475138, 62422508) and the Graduate education innovation project of Shanxi Province (2024TD03).
Institutional Review Board Statement
Not applicable.
Informed Consent Statement
Not applicable.
Data Availability Statement
Data underlying the results presented in this paper are not publicly available at this time but may be obtained from the authors upon reasonable request.
Conflicts of Interest
The authors declare no conflict of interest.
References
- Daley, A.J.; Boyd, M.M.; Ye, J.; Zoller, P. Quantum computing with alkaline-earth-metal atoms. Phys. Rev. Lett. 2008, 101, 170504. [Google Scholar] [CrossRef]
- Gorshkov, A.V.; Rey, A.M.; Daley, A.J.; Boyd, M.M.; Ye, J.; Zoller, P.; Lukin, M.D. Alkaline-earth-metal atoms as few-qubit quantum registers. Phys. Rev. Lett. 2009, 102, 110503. [Google Scholar] [CrossRef]
- Zhang, X.; Bishof, M.; Bromley, S.L.; Kraus, C.V.; Safronova, M.S.; Zoller, P.; Rey, A.M.; Ye, J. Spectroscopic observation of SU (N)-symmetric interactions in Sr orbital magnetism. Science 2014, 345, 1467–1473. [Google Scholar] [CrossRef] [PubMed]
- Zhang, R.; Cheng, Y.; Zhai, H.; Zhang, P. Orbital Feshbach resonance in alkali-earth atoms. Phys. Rev. Lett. 2015, 115, 135301. [Google Scholar] [CrossRef] [PubMed]
- Pagano, G.; Mancini, M.; Cappellini, G.; Livi, L.; Sias, C.; Catani, J.; Inguscio, M.; Fallani, L. Strongly interacting gas of two-electron fermions at an orbital Feshbach resonance. Phys. Rev. Lett. 2015, 115, 265301. [Google Scholar] [CrossRef] [PubMed]
- Höfer, M.; Riegger, L.; Scazza, F.; Hofrichter, C.; Fernandes, D.; Parish, M.; Levinsen, J.; Bloch, I.; Fölling, S. Observation of an orbital interaction-induced Feshbach resonance in Yb 173. Phys. Rev. Lett. 2015, 115, 265302. [Google Scholar] [CrossRef]
- Jin, R.B.; Zeng, Z.Q.; You, C.; Yuan, C. Quantum interferometers: Principles and applications. Prog. Quantum Electron. 2024, 96, 100519. [Google Scholar] [CrossRef]
- Biedermann, G.; Wu, X.; Deslauriers, L.; Roy, S.; Mahadeswaraswamy, C.; Kasevich, M. Testing gravity with cold-atom interferometers. Phys. Rev. A 2015, 91, 033629. [Google Scholar] [CrossRef]
- Zheng, X.; Dolde, J.; Lochab, V.; Merriman, B.N.; Li, H.; Kolkowitz, S. Differential clock comparisons with a multiplexed optical lattice clock. Nature 2022, 602, 425–430. [Google Scholar] [CrossRef]
- Takamoto, M.; Ushijima, I.; Ohmae, N.; Yahagi, T.; Kokado, K.; Shinkai, H.; Katori, H. Test of general relativity by a pair of transportable optical lattice clocks. Nat. Photonics 2020, 14, 411–415. [Google Scholar]
- Bloom, B.; Nicholson, T.; Williams, J.; Campbell, S.; Bishof, M.; Zhang, X.; Zhang, W.; Bromley, S.; Ye, J. An optical lattice clock with accuracy and stability at the 10–18 level. Nature 2014, 506, 71–75. [Google Scholar] [CrossRef]
- Beloy, K.; Hinkley, N.; Phillips, N.B.; Sherman, J.A.; Schioppo, M.; Lehman, J.; Feldman, A.; Hanssen, L.M.; Oates, C.W.; Ludlow, A.D. Atomic clock with 1× 10–18 room-temperature blackbody Stark uncertainty. Phys. Rev. Lett. 2014, 113, 260801. [Google Scholar] [CrossRef]
- Plotkin-Swing, B.; Wirth, A.; Gochnauer, D.; Rahman, T.; McAlpine, K.E.; Gupta, S. Crossed-beam slowing to enhance narrow-line ytterbium magneto-optic traps. Rev. Sci. Instrum. 2020, 91, 093201. [Google Scholar] [CrossRef] [PubMed]
- Li, X.; Wang, Y.; Yu, L.; Song, B. Two-color magneto-optical trapping of ytterbium atoms. arXiv 2025, arXiv:2503.24383. [Google Scholar]
- Saskin, S.; Wilson, J.; Grinkemeyer, B.; Thompson, J. Narrow-line cooling and imaging of ytterbium atoms in an optical tweezer array. Phys. Rev. Lett. 2019, 122, 143002. [Google Scholar] [CrossRef]
- Dörscher, S.; Thobe, A.; Hundt, B.; Kochanke, A.; Le Targat, R.; Windpassinger, P.; Becker, C.; Sengstock, K. Creation of quantum-degenerate gases of ytterbium in a compact 2D-/3D-magneto-optical trap setup. Rev. Sci. Instrum. 2013, 84, 043109. [Google Scholar]
- Tiecke, T.; Gensemer, S.; Ludewig, A.; Walraven, J. High-flux two-dimensional magneto-optical-trap source for cold lithium atoms. Phys. Rev. A At. Mol. Opt. Phys. 2009, 80, 013409. [Google Scholar] [CrossRef]
- Lamporesi, G.; Donadello, S.; Serafini, S.; Ferrari, G. Compact high-flux source of cold sodium atoms. Rev. Sci. Instrum. 2013, 84, 063102. [Google Scholar]
- Wang, X.; Muthu-Arachchige, T.; Legrand, T.; Müller, L.; Alt, W.; Hofferberth, S.; Uruñuela, E. Two-color ytterbium magneto-optical trap in a compact dual-chamber setup. Phys. Rev. Appl. 2025, 23, 014004. [Google Scholar] [CrossRef]
- Phillips, W.D.; Metcalf, H. Laser deceleration of an atomic beam. Phys. Rev. Lett. 1982, 48, 596. [Google Scholar] [CrossRef]
- Courtillot, I.; Quessada, A.; Kovacich, R.; Zondy, J.; Landragin, A.; Clairon, A.; Lemonde, P. Efficient cooling and trapping of strontium atoms. Opt. Lett. 2003, 28, 468–470. [Google Scholar] [CrossRef] [PubMed]
- Wang, W.; Subhankar, S.; Britton, J.W. A practical guide to feedback control for Pound–Drever–Hall laser linewidth narrowing. Appl. Phys. B 2025, 131, 146. [Google Scholar] [CrossRef]
- Wodey, E.; Rengelink, R.; Meiners, C.; Rasel, E.; Schlippert, D. A robust, high-flux source of laser-cooled ytterbium atoms. J. Phys. B At. Mol. Opt. Phys. 2021, 54, 035301. [Google Scholar] [CrossRef]
- Li, Z.-L.; Shi, Z.-L.; Wang, P.-J. Design and research of two-dimensional magneto-optical trap of sodium atom using permanent magnets. Acta Phys. Sin. 2020, 69, 126701. [Google Scholar] [CrossRef]
- Nosske, I.; Couturier, L.; Hu, F.; Tan, C.; Qiao, C.; Blume, J.; Jiang, Y.; Chen, P.; Weidemüller, M. Two-dimensional magneto-optical trap as a source for cold strontium atoms. Phys. Rev. A 2017, 96, 053415. [Google Scholar] [CrossRef]
- Alcock, C.B.; Itkin, V.; Horrigan, M. Vapour pressure equations for the metallic elements: 298–2500 K. Can. Metall. Q. 1984, 23, 309–313. [Google Scholar] [CrossRef]
- Raha, M.; Chen, S.; Phenicie, C.M.; Ourari, S.; Dibos, A.M.; Thompson, J.D. Optical quantum nondemolition measurement of a single rare earth ion qubit. Nat. Commun. 2020, 11, 1605. [Google Scholar] [CrossRef] [PubMed]
- Berglund, M.; Wieser, M.E. Isotopic compositions of the elements 2009 (IUPAC Technical Report). Pure Appl. Chem. 2011, 83, 397–410. [Google Scholar] [CrossRef]
Disclaimer/Publisher’s Note: The statements, opinions and data contained in all publications are solely those of the individual author(s) and contributor(s) and not of MDPI and/or the editor(s). MDPI and/or the editor(s) disclaim responsibility for any injury to people or property resulting from any ideas, methods, instructions or products referred to in the content. |
© 2025 by the authors. Licensee MDPI, Basel, Switzerland. This article is an open access article distributed under the terms and conditions of the Creative Commons Attribution (CC BY) license (https://creativecommons.org/licenses/by/4.0/).