1. Introduction
Particles, whether they are in the micron or nanometer range size, which are too small for direct observation, undergo a perpetual motion within a carrier fluid. The incessant, seemingly random movement of microscopic particles suspended in a fluid medium, known as Brownian motion, has captivated scientists since its initial observation by Robert Brown in 1827 [
1]. Brownian motion has since emerged as a fundamental and ubiquitous phenomenon, serving as a cornerstone in our understanding of stochastic processes.
The implications of Brownian motion reverberate throughout numerous scientific disciplines, extending its influence on chemistry, physics, biology, and materials science. Micro and nanoparticles, with their small dimensions and high surface-to-volume ratios, are subjected to the intricate forces governing Brownian motion. These particles, whether they are synthetic nanoparticles engineered for novel applications or biological entities like proteins and viruses, experience a complex interplay between thermal fluctuations and hydrodynamic forces as they move within a fluid.
To study micro and nanoparticles’ behavior in a fluid, an investigation technique called Dynamic Light Scattering (DLS), is currently used to provide insights into the dynamics of suspended particles [
2,
3,
4,
5,
6]. A coherent monochromatic light source is employed, with the particles in suspension as its target. Within the illuminated area, individual particles induce quasi-elastic scattering of the incident light beam. These scattered wavelets from all particles constructively and destructively interfere at each point in space. When positioned within this interference pattern, a detector measures the scattered light intensity, which is then converted into a voltage directly proportional to the intensity. This voltage is recorded at regular time intervals, generating a Dynamic Light Scattering time series (DLS TS) suitable for subsequent analysis.
The particles undergo a continuous, random motion, conventionally referred to as Brownian motion. Because of the particles’ continuous chaotic motion, both the intensity and the phase of the wavelets scattered by particles exhibit constant and random variations over time [
7,
8]. The interference field contains information about all the particles within the beam area, making it possible to analyze the DLS TS to extract information about the size of the suspended particles.
Dynamic Light Scattering time series (DLS TS) data can be analyzed using a simplified approach to determine the average diameter of suspended particles, as demonstrated in prior studies [
9] Alternatively, it can be used to estimate particle size distribution (PSD) through various assumptions and approximations. These approximations include maximum entropy algorithms [
10,
11] and the CONTIN method [
12,
13]. The maximum entropy method [
10,
11], for example, is an advanced fitting technique that assigns an entropy value to each possible solution and selects the one with the highest entropy as the most likely distribution. However, the fitting procedure within the maximum entropy method can be computationally expensive.
Another frequently used approach for assessing particle size distribution is CONTIN, which relies on the inverse Laplace transform [
12,
13]. However, applying the inverse Laplace transformation to numerical data is known to be sensitive to noise (e.g., experimental noise) [
14,
15], as it poses an ill-posed mathematical problem, potentially leading to ambiguous results. The CONTIN method overcomes this limitation by introducing regularization; the choice of the regularization parameter significantly influences the resulting solution.
Various procedures, including those based on Artificial Neural Networks (ANNs) [
16,
17], have been employed for processing DLS time series (DLS TS) data. One approach reported in [
18] utilized an averaged scattered light intensity frequency spectrum as input to a three-layer feedforward ANN, with the network predicting the average diameter of the suspended particles. While the particle size range in this case was limited to 350 nm, the work served as proof of concept for employing ANNs in DLS TS processing. A subsequent study [
19], building upon [
18], utilized the autocorrelation of the DLS TS as input to an ANN, with the output being the average particle diameter. Both ANNs described in [
18,
19] proved to be several thousand times faster than fitting either the Lorentzian line to the frequency spectrum [
11,
12], or the autocorrelation, with relatively small errors. Enhanced utilization of ANNs is demonstrated in [
20], where the particle size measurement range was extended to 6000 nm. Reference [
21] describes an attempt to use the Shannon entropy of a DLS TS to estimate the average diameter of the particles in suspension.
The results presented here are the continuation of the work presented in [
18,
19,
20,
21], aiming to develop a DLS device with a very simple setup, made from conventional electronics rather than custom made parts, with a simple data processing procedure that can run on a light and portable computing platform. The work presented here uses the co-occurence matrix applied to TSs rather than images and an extended definition of the moment if inertia for the co-occurence matrix is used to determine the average diameter of the particles in suspension. To my knowledge, such an approach has not been published yet at the date of submitting the manuscript.
In the subsequent sections, we will present an algorithm that has been developed and used to generate TSs produced by a chaotic system using deterministic functions; we will test the TS for accuracy using the DLS technique for processing TS. Moreover, we will present an alternative of looking at TS by computing the co-occurrence matrix and the moments of the distribution, in relation to the diameter of the particles the TSs were generated for.
2. Materials and Methods
2.1. Dynamic Light Scattering TS-Processing Algorithm
The work presented here refers to a particular type of TS, which is DLS TS. These TSs have the feature of being linked to the average diameter of the particles in suspension that scatter coherent light, which interferes and produces the recording. The recording, consisting of a signal proportional to the intensity of the scattered light in the detector’s location and typically digitized using a regular data acquisition system [
22,
23], is the DLS TS. The detector consisted of a PIN diode and an amplifier. The data acquisition rate was 16,000 Hz, which is the same as the frequency used to generate the TSs.
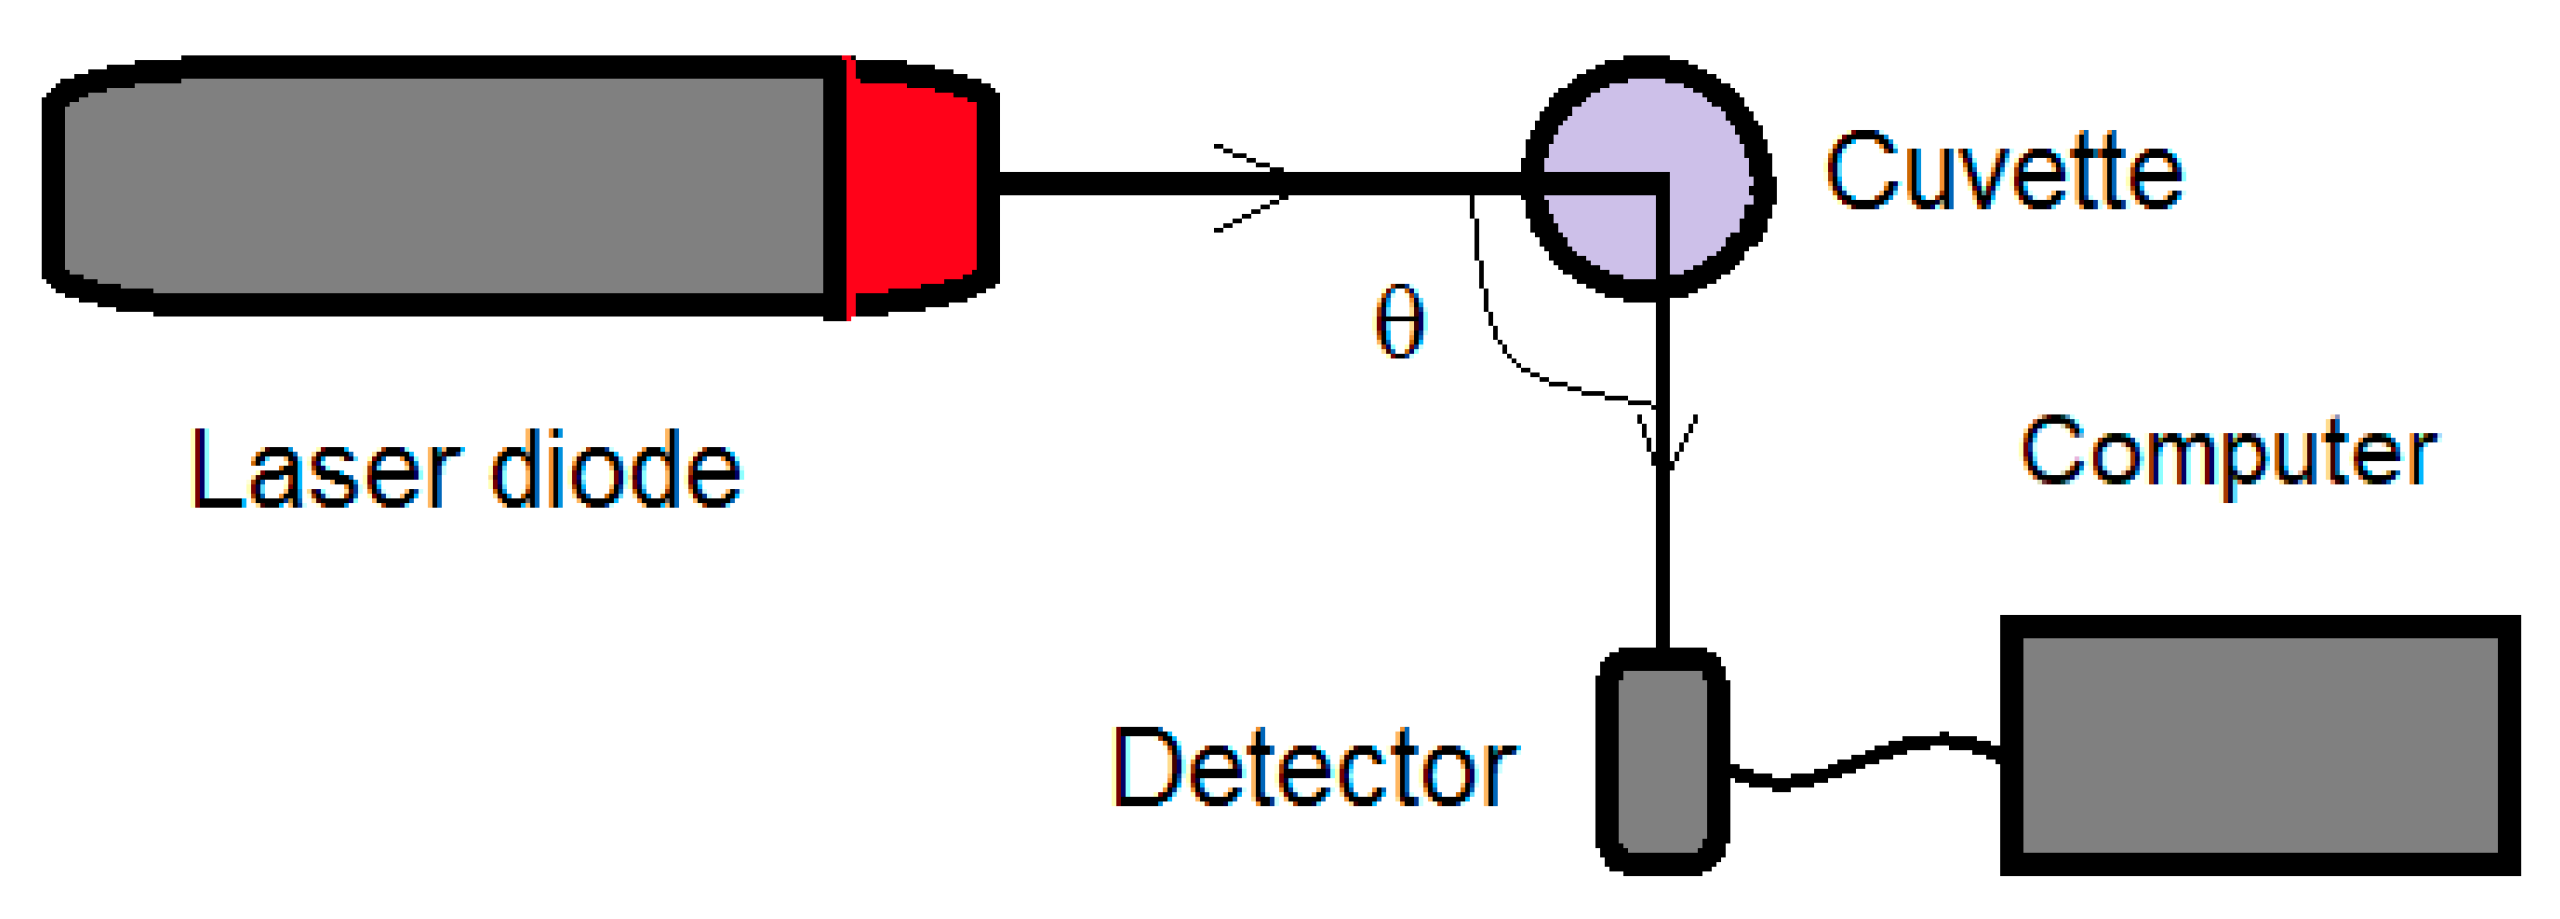
In the context of a simple Dynamic Light Scattering (DLS) experiment, the experimental setup is illustrated in
Figure 1. Typically, the θ angle is set to 90°, and in practical applications, a hardware autocorrelator is employed to compute the autocorrelation function of the DLS time series [
3,
6], which, over time, has been replaced by a computer for both TS recording and subsequent processing.
To test the generated time series, we employed the fast Fourier transform algorithm (FFT) [
24,
25] to calculate the power spectrum (PS), which is the absolute value of the frequency spectrum of the light intensity time series.
The experimentally obtained spectrum can be compared with the theoretically expected spectrum described by the Lorentzian line
S(
f) in Equation (1).
The Lorentzian function S(f) is characterized by two free parameters and denoted as a0 and a1. In the scattered light intensity frequency spectrum (also named power spectrum, PS) described by Equation (1), parameter a0 acts as a scaling factor within the range of the PS data, while parameter a1 non-linearly influences the function. In a log–log scaled plot, modifying a1 shifts the turnover point of the Lorentzian line along the frequency axis.
To fit the Lorentzian function to the PS, a non-linear minimization procedure is employed [
9]. This procedure minimizes the distance between the function and the data, often referred to as χ
2 per point, as indicated in Equation (2):
Once the fit is successfully executed, the parameter values that provide the best fit are determined. The diameter of the suspended particles can then be calculated as twice the radius
R, using Equation (3):
where q is the scattering vector:
In Equation (3), η represents the dynamic viscosity coefficient of the solvent, T is the absolute temperature of the suspension, kB denotes Boltzmann’s constant, θ signifies the scattering angle, n stands for the solvent refractive index, and λ represents the laser radiation wavelength in a vacuum.
This alternative processing method, utilizing the PS on time series recorded at smaller angles and lower data acquisition rates, has been extensively documented in previous papers such as [
9]. The PS-based processing method offers the advantage of straightforward offline noise filtering by simply removing the frequency components in the PS typically associated with noise from the data to be fitted to. Using autocorrelation requires active filtering of the signal, which is not as efficient as simply removing the frequency window from the spectrum, and requires a filtering device; this departs from the line of simplifying the experimental setup and the TS-processing procedure. Moreover, examining the shape of the PS, the assumption of monodisperse particle size distribution can easily be verified.
2.2. Stochastic Time Series Generation Algorithm
As previously mentioned, one of the challenges addressed in this paper is to simulate the outcome of a stochastic system, specifically the time series generated by coherent light scattered by a suspension, using a deterministic procedure. This straightforward procedure involves the summation of harmonic functions, such as sine or cosine, each with different frequencies and amplitudes, at different time points to construct the time series, as defined in Equation (5).
In Equation (5),
S(
fi) denotes the amplitude (e.g., scattered light intensity), f
i denotes the frequency,
φi denotes the initial phase, and t denotes the time for the i-th component. Nf represents the number of frequencies used to generate the time series. The initial phases
φi of all components are generated using random numbers following a uniform distribution in the range [0, 2π]. The frequency values
fi are equally spaced within the interval [0,
fs/2], where fs represents the sampling rate of the data acquisition system used for recording the time series. The limitation to frequencies below
fs/2 is justified by the Whittaker–Nyquist–Kotelnikov–Shannon theorem [
26,
27,
28,
29], which, in Shannon’s version, asserts, “If a function x(t) contains no frequencies higher than f hertz, it is completely determined by giving its ordinates at a series of points spaced 1/(
2f) seconds apart” [
26]. When a time series is recorded or generated with a sampling rate fs, the resulting FFT produces a frequency spectrum within the interval [0,
fs/2] due to the inherent symmetry at half the sampling frequency [
24,
25]. This is important to consider when interpreting the calculated amplitudes, S(f
i), which are directly obtained from the FFT output.
A key aspect of generating realistic DLS time series (DLS TS) is the number of frequencies required. This, along with the minimum TS length, is comprehensively analyzed in [
20,
21]. Consistent with the findings in [
20,
21], we employed Nf = N/2 + 1 frequencies equally spaced across the spectrum for our generated time series (TSs) with N total data points. Each TS comprised 2
16 (65536) data points, which were chosen specifically as a power of 2. This ensures efficient implementation of the fast Fourier transform (FFT) algorithm, which avoids introducing artificial artifacts in the low-frequency region of the power spectrum (PS) by padding the data with zeros during calculations and this is a particular feature of the
fft Matlab function.
2.3. The Co-Occurrence Matrix and the Moments of the Distribution
The co-occurrence matrix, often referred to as a gray-level co-occurrence matrix, (GLCM) is a fundamental concept in image analysis. This mathematical representation expresses the spatial relationships between pixel values within a digital image. It quantifies the frequency with which specific pairs of pixel values occur within a defined spatial context or distance. This concept has been widely studied and applied in the field of computer vision and image processing [
30,
31,
32].
The construction of a co-occurrence matrix typically involves image discretization, a process in which the continuous pixel intensity values are mapped to a finite set of discrete levels or bins; it is a process which is referred to as quantization levels or gray levels [
33]. It is followed by establishing a spatial relationship to determine how pixels are paired for analysis [
29]. For each pair of pixels satisfying the criteria of the chosen spatial relationship, the corresponding cell within the co-occurrence matrix is incremented. This increment signifies the joint occurrence of specific pixel values at the designated spatial position [
28,
30]. Various properties have been derived from the co-occurrence matrix: contrast, energy (also called angular second moment), entropy, correlation, homogeneity, and dissimilarity [
28].
The Gray Level Co-occurrence Matrix (GLCM) is a statistical method commonly used to analyze the texture of images [
34,
35]. The values along its principal diagonal quantify the prevalence of homogeneous regions (areas with similar intensity values). Conversely, elements away from the diagonal with non-zero values indicate a higher degree of contrast between neighboring pixels in the image. The GLCM was used in a different manner to study the speckle variation in time on the Time History Speckle Pattern (THSP) [
36], which is a matrix constructed from successive images recorded on coherent light scattered by samples exhibiting activity, such as samples containing a solvent that evaporates or changes the water activity in plants. The moment of inertia was calculated on the GLCM [
37] and used to assess the activity of the sample.
In this work, we calculated the Gray Level Co-occurrence Matrix for TS instead for images and used it further to determine a relation with the average diameter that TS corresponds to.
2.4. The TS-GLCM Moments
If a TS presents a very slow variation, in many sequences, a value is followed by the same value, thus making the GLCM possess most of the elements on its main diagonal. On the contrary, if the TS presents fast variations, which means a big difference between consecutive data in TS, the GLCM presents a bigger spread of the values from its main diagonal. This suggests the definition of the moments of GLCM, if we view it as a distribution with the maximum on its main diagonal.
We define the moment Mn, the moment of order n of the GLCM as
In (6), l is the number of intensity levels, also called the number of gray levels. The absolute value of the difference i-j ensures that the moment Mn adds all the contribution of the elements in GLCM(i,j). The moments defined in Equation (6) were calculated for integer values of n of 1, 2, 3, 4.
2.5. Suspension of Particles with Variable Diameter
The procedure for estimating the diameter of the particles in suspension using the moment of inertia described in this paper was tested on real data; that is a suspension containing particles with different diameters. This can be achieved using size fractionation via sedimentation to achieve a distribution with a decreasing maximum diameter over time.
A total of 1 g of pharmaceutical grade burned clay was manually milled using a synthetic Sapphire mortar and pestle for 20 min to reduce the crystallite size to the hundreds of nanometer range. An amount of 0.1 g of the milled burned clay powder was mixed with 20 cm3 of deionized water. A total of 3 mL of suspension was then transferred to a 1 cm diameter glass cuvette for both sedimentation and DLS measurements. The cuvette was sealed to prevent evaporation and maintained a constant particle concentration during analysis.
Detailed descriptions of sedimentation for sample preparation can be found in reference [
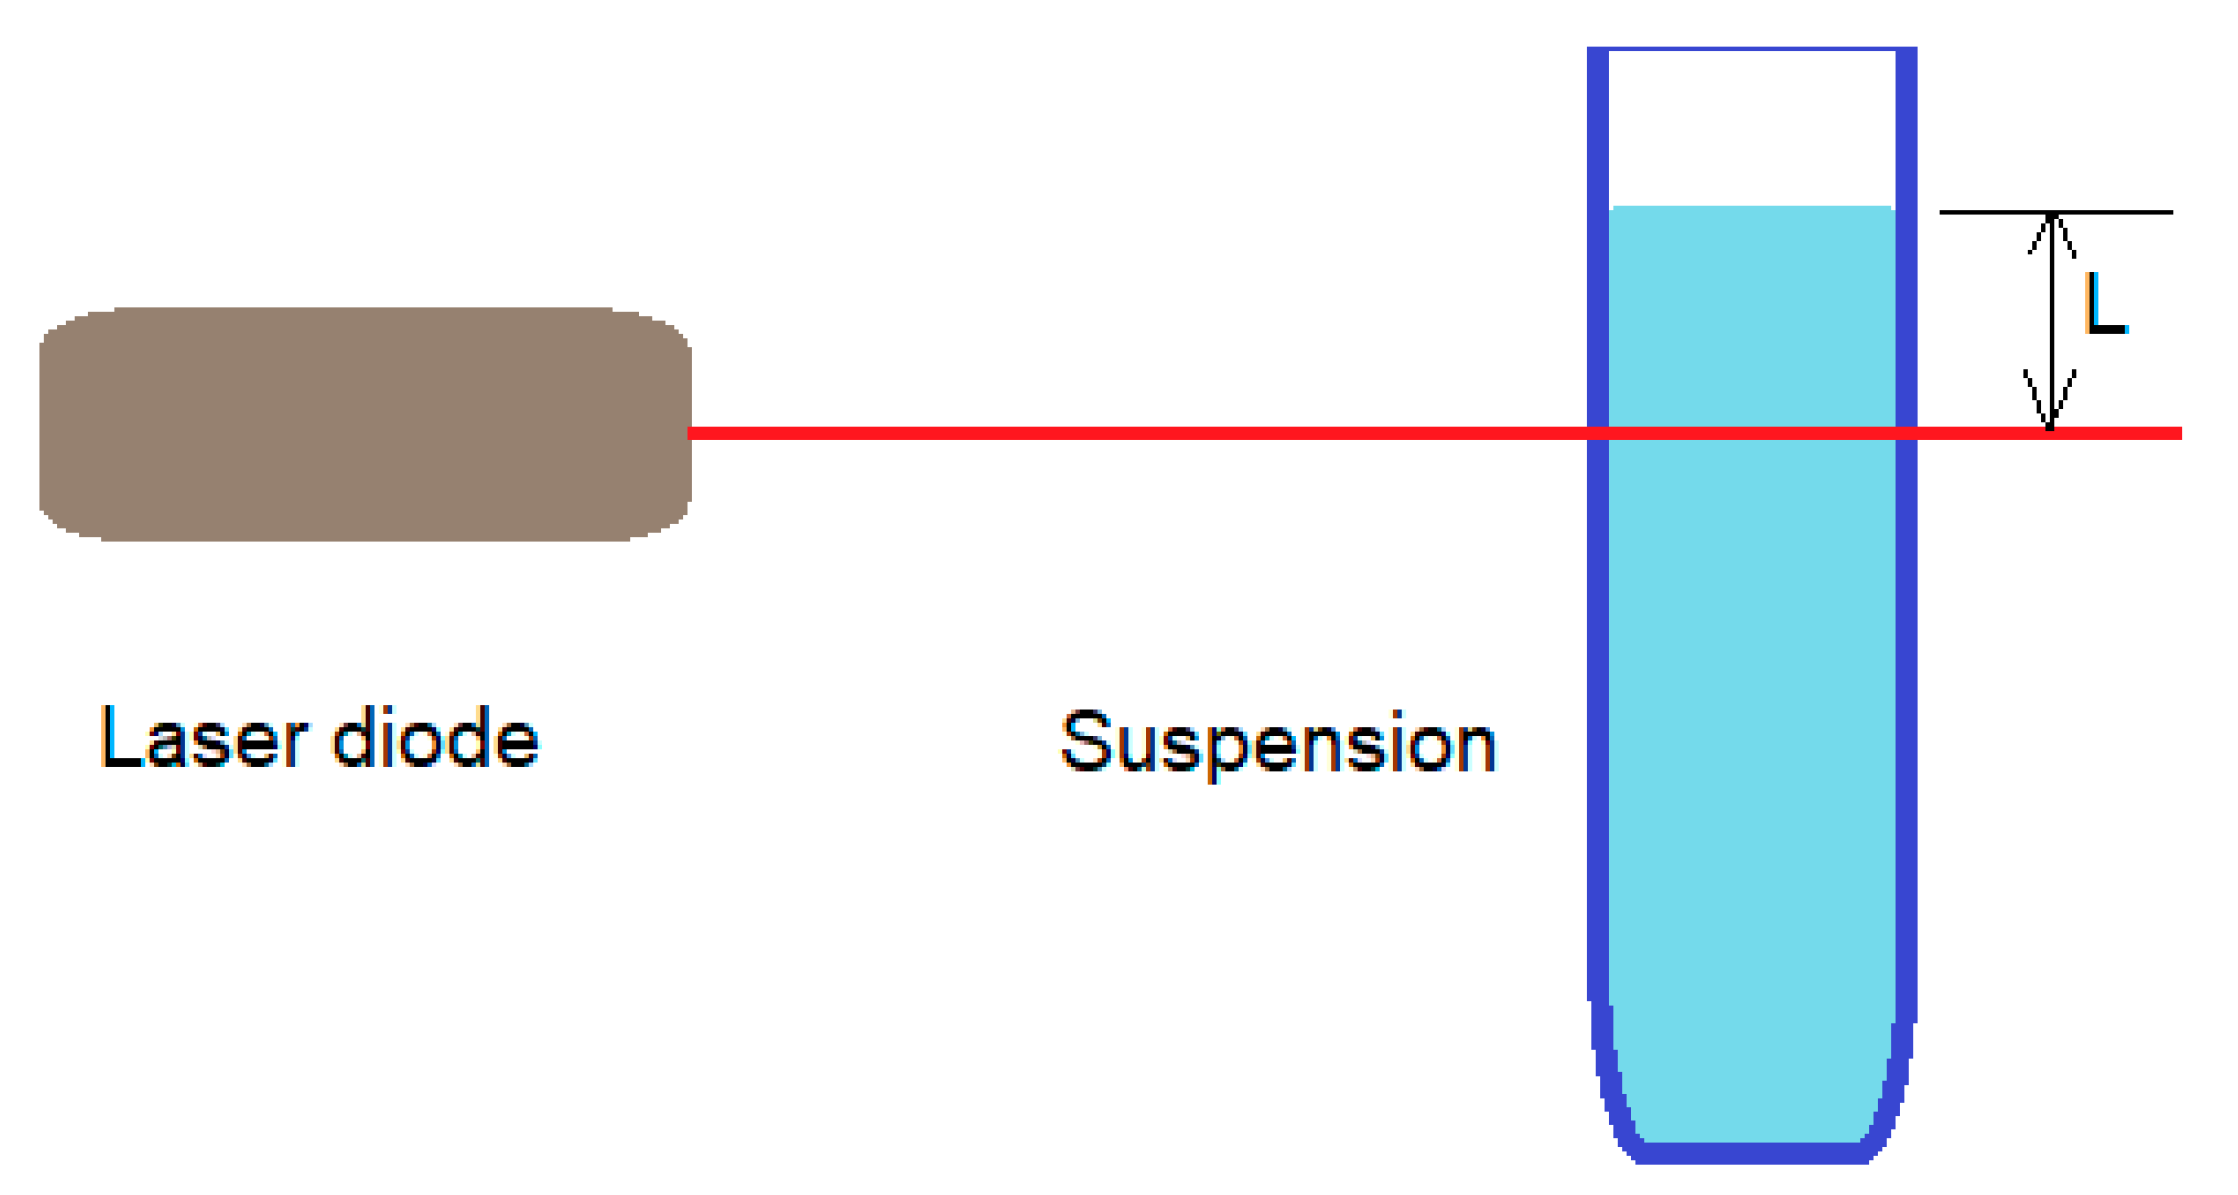
21] and a schematic of the experimental setup is illustrated in
Figure 2.
Briefly, when a spherical particle of diameter d and density
ρ is submerged in a fluid with density
ρ0 and dynamic viscosity η, the settling velocity v
l is governed by the balance of gravitational, buoyant, and drag forces as described by the Stokes equation:
where g is the gravitational acceleration and d is the particle diameter. This equation highlights the dependence of settling velocity on particle diameter squared,
d2. This feature is utilized to achieve a decrease in the maximum particle size of the suspension over time.
Larger particles settle faster than smaller ones, as Equation (7) reveals. In a cuvette with a liquid depth
L measured from the free surface and a time interval Δ
t after introducing the suspension, only particles with settling velocities v
l slower than L/Δt will remain in the beam path of the DLS instrument. This translates to a maximum particle diameter
dmax as described by
DLS measurements were conducted by recording time series data (TS) with a 4 h interval between consecutive measurements. This allowed for the monitoring of the decrease in the maximum particle size within the beam path over time. The cuvette liquid depth L was chosen to be 6 mm, balancing the desired variation in measured diameter with the potential influence of capillary ascension on the liquid level within the cuvette. It is important to acknowledge that this sedimentation procedure is primarily for sample preparation to obtain a decreasing maximum diameter distribution, and not a precise particle separation technique. Moreover, this procedure assures that the particles in suspension have a wider range of diameters, which is useful for testing the method that outputs the diameter of the particles in suspension.
The laser beam’s diameter was 0.5 mm, which is bigger than the diameter of the He-Ne laser beam but is in line with designing a simplified procedure for assessing the diameter of the particles in suspension. This width of the beam introduced an error in assessing the maximum particle diameter dmax as described by Equation (8).
2.6. Calibrated Beads
The procedure for estimating the diameter of the particles in suspension using the moment of inertia described in this paper was tested on size-calibrated beads as well.
The latex beads, also called latex particles, are spherical particles in the colloidal size range that are formed from polystyrene, produced by Thermofisher Scientifc (Waltham, MA, USA). Three types of beads were used, with average diameters of 20, 100, and 303 nm. The producer stated that because of the way that the polystyrene chains arrange themselves in the bead, the surface is very hydrophobic in character, thus preventing aggregation. Suspension of such beads were investigated using the reference DSL procedure and the proposed procedure using the moment of inertia, both described in
Section 2.1 and
Section 2.4, respectively. More details about the size and the range of the diameters, as stated by the producer, are presented in
Section 3.
3. Results and Discussion
As described in
Section 2.2, we generated time series (TSs) for each diameter in the range of 20–3000 nm with a 5 nm step using a custom MATLAB code. The procedure of estimating the average diameter, as described in
Section 2.1, was employed and the diameters for each TS were assessed. They were found to be very close to the diameter used for generating the TS, within a relative error below 1%.
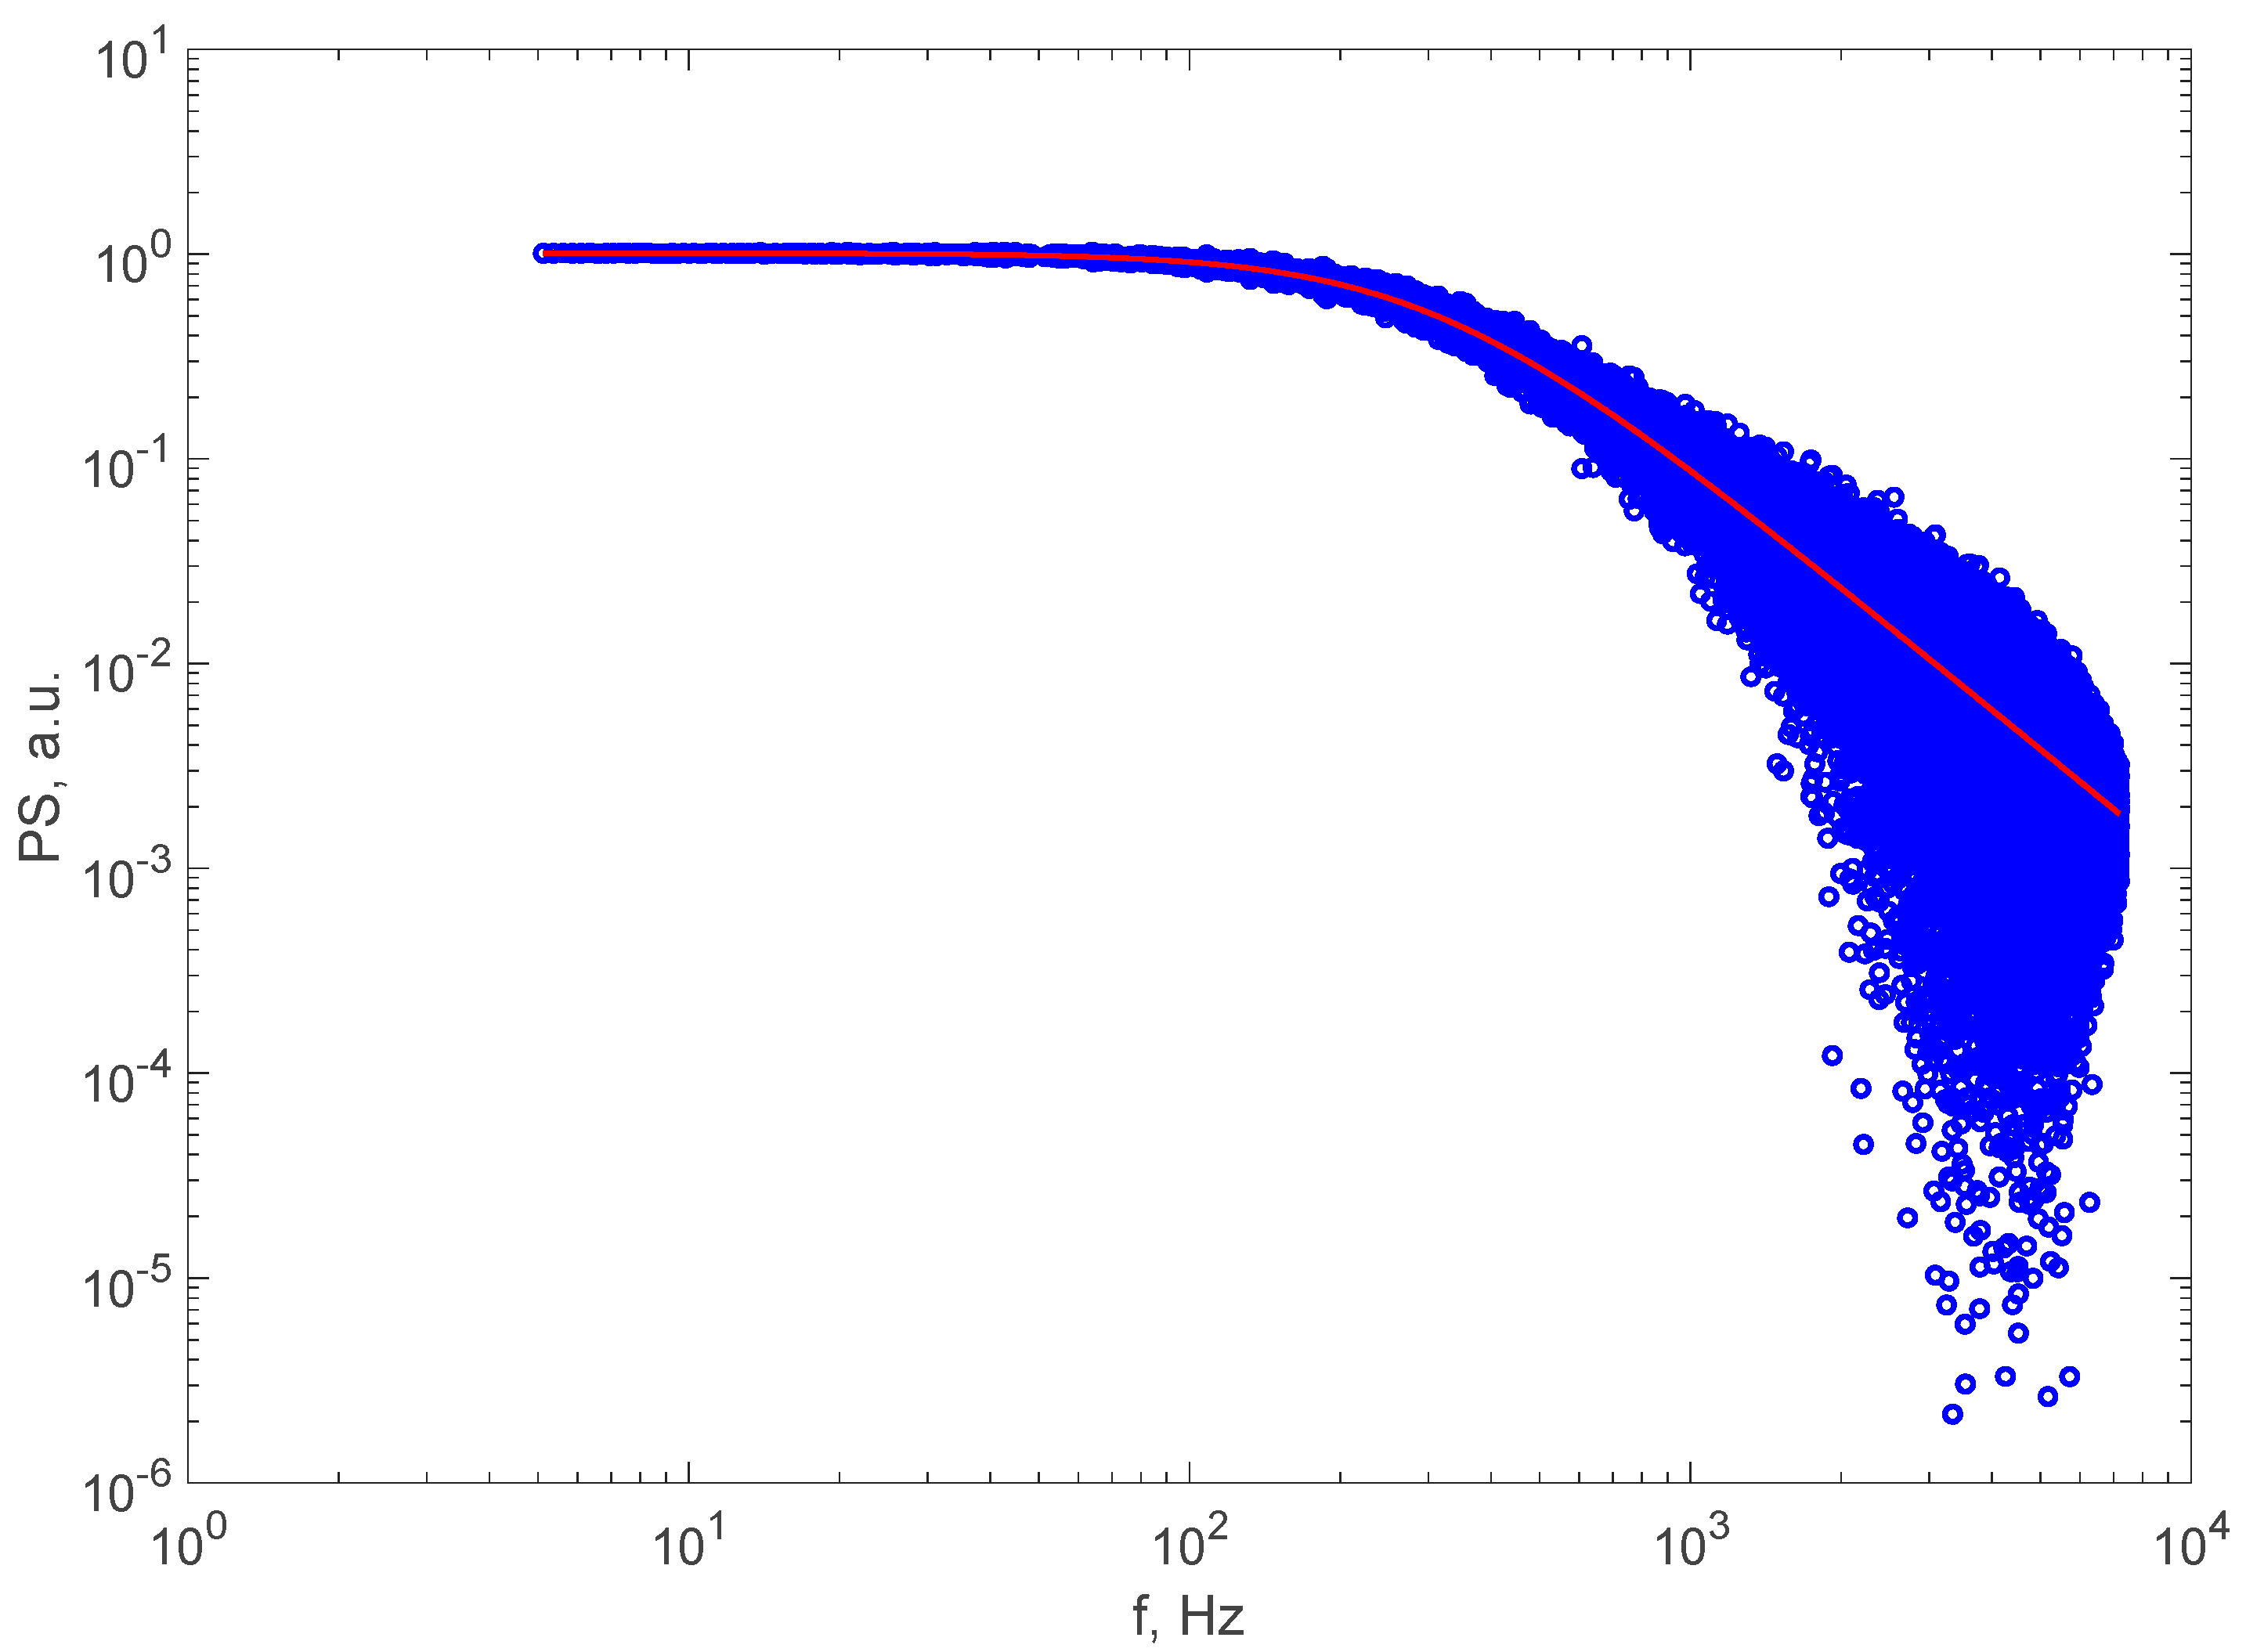
Figure 3 illustrates the PS of a TS generated for nanoparticles having a diameter of 150 nm where the solvent water was at 20 °C, together with the result of the simple DLS-fitting procedure. We noticed that the fit was very good, and the line stays very well on the PS data. The diameter found by the fitting procedure described in
Section 2.1 was 145 nm, which is very close to 150 nm, which was used to generate the TS. We consider the good match of the Lorentzian line and the closeness of the two diameters for each generated TS to be a validation test for the TS generation procedure described in
Section 2.2.
Furthermore, a GLCM was calculated for each TS using the algorithm described in
Section 2.3, implemented in the
graycomatrix MATLAB function. The moments of order one to three were calculated for each GLCM, and hence for each TS, using Equation (6). The code that calculated the GLCM and the moments was written in MATLAB 2023b, as well.
A number of eight intensity levels is typically used to analyze the properties of images [
31,
32,
33,
34]. The TS generated for DLS were analyzed using 64 levels of intensity instead; a total of 64 gray levels were used to ensure a more accurate variation in the MI with the diameter of the particles in suspension.
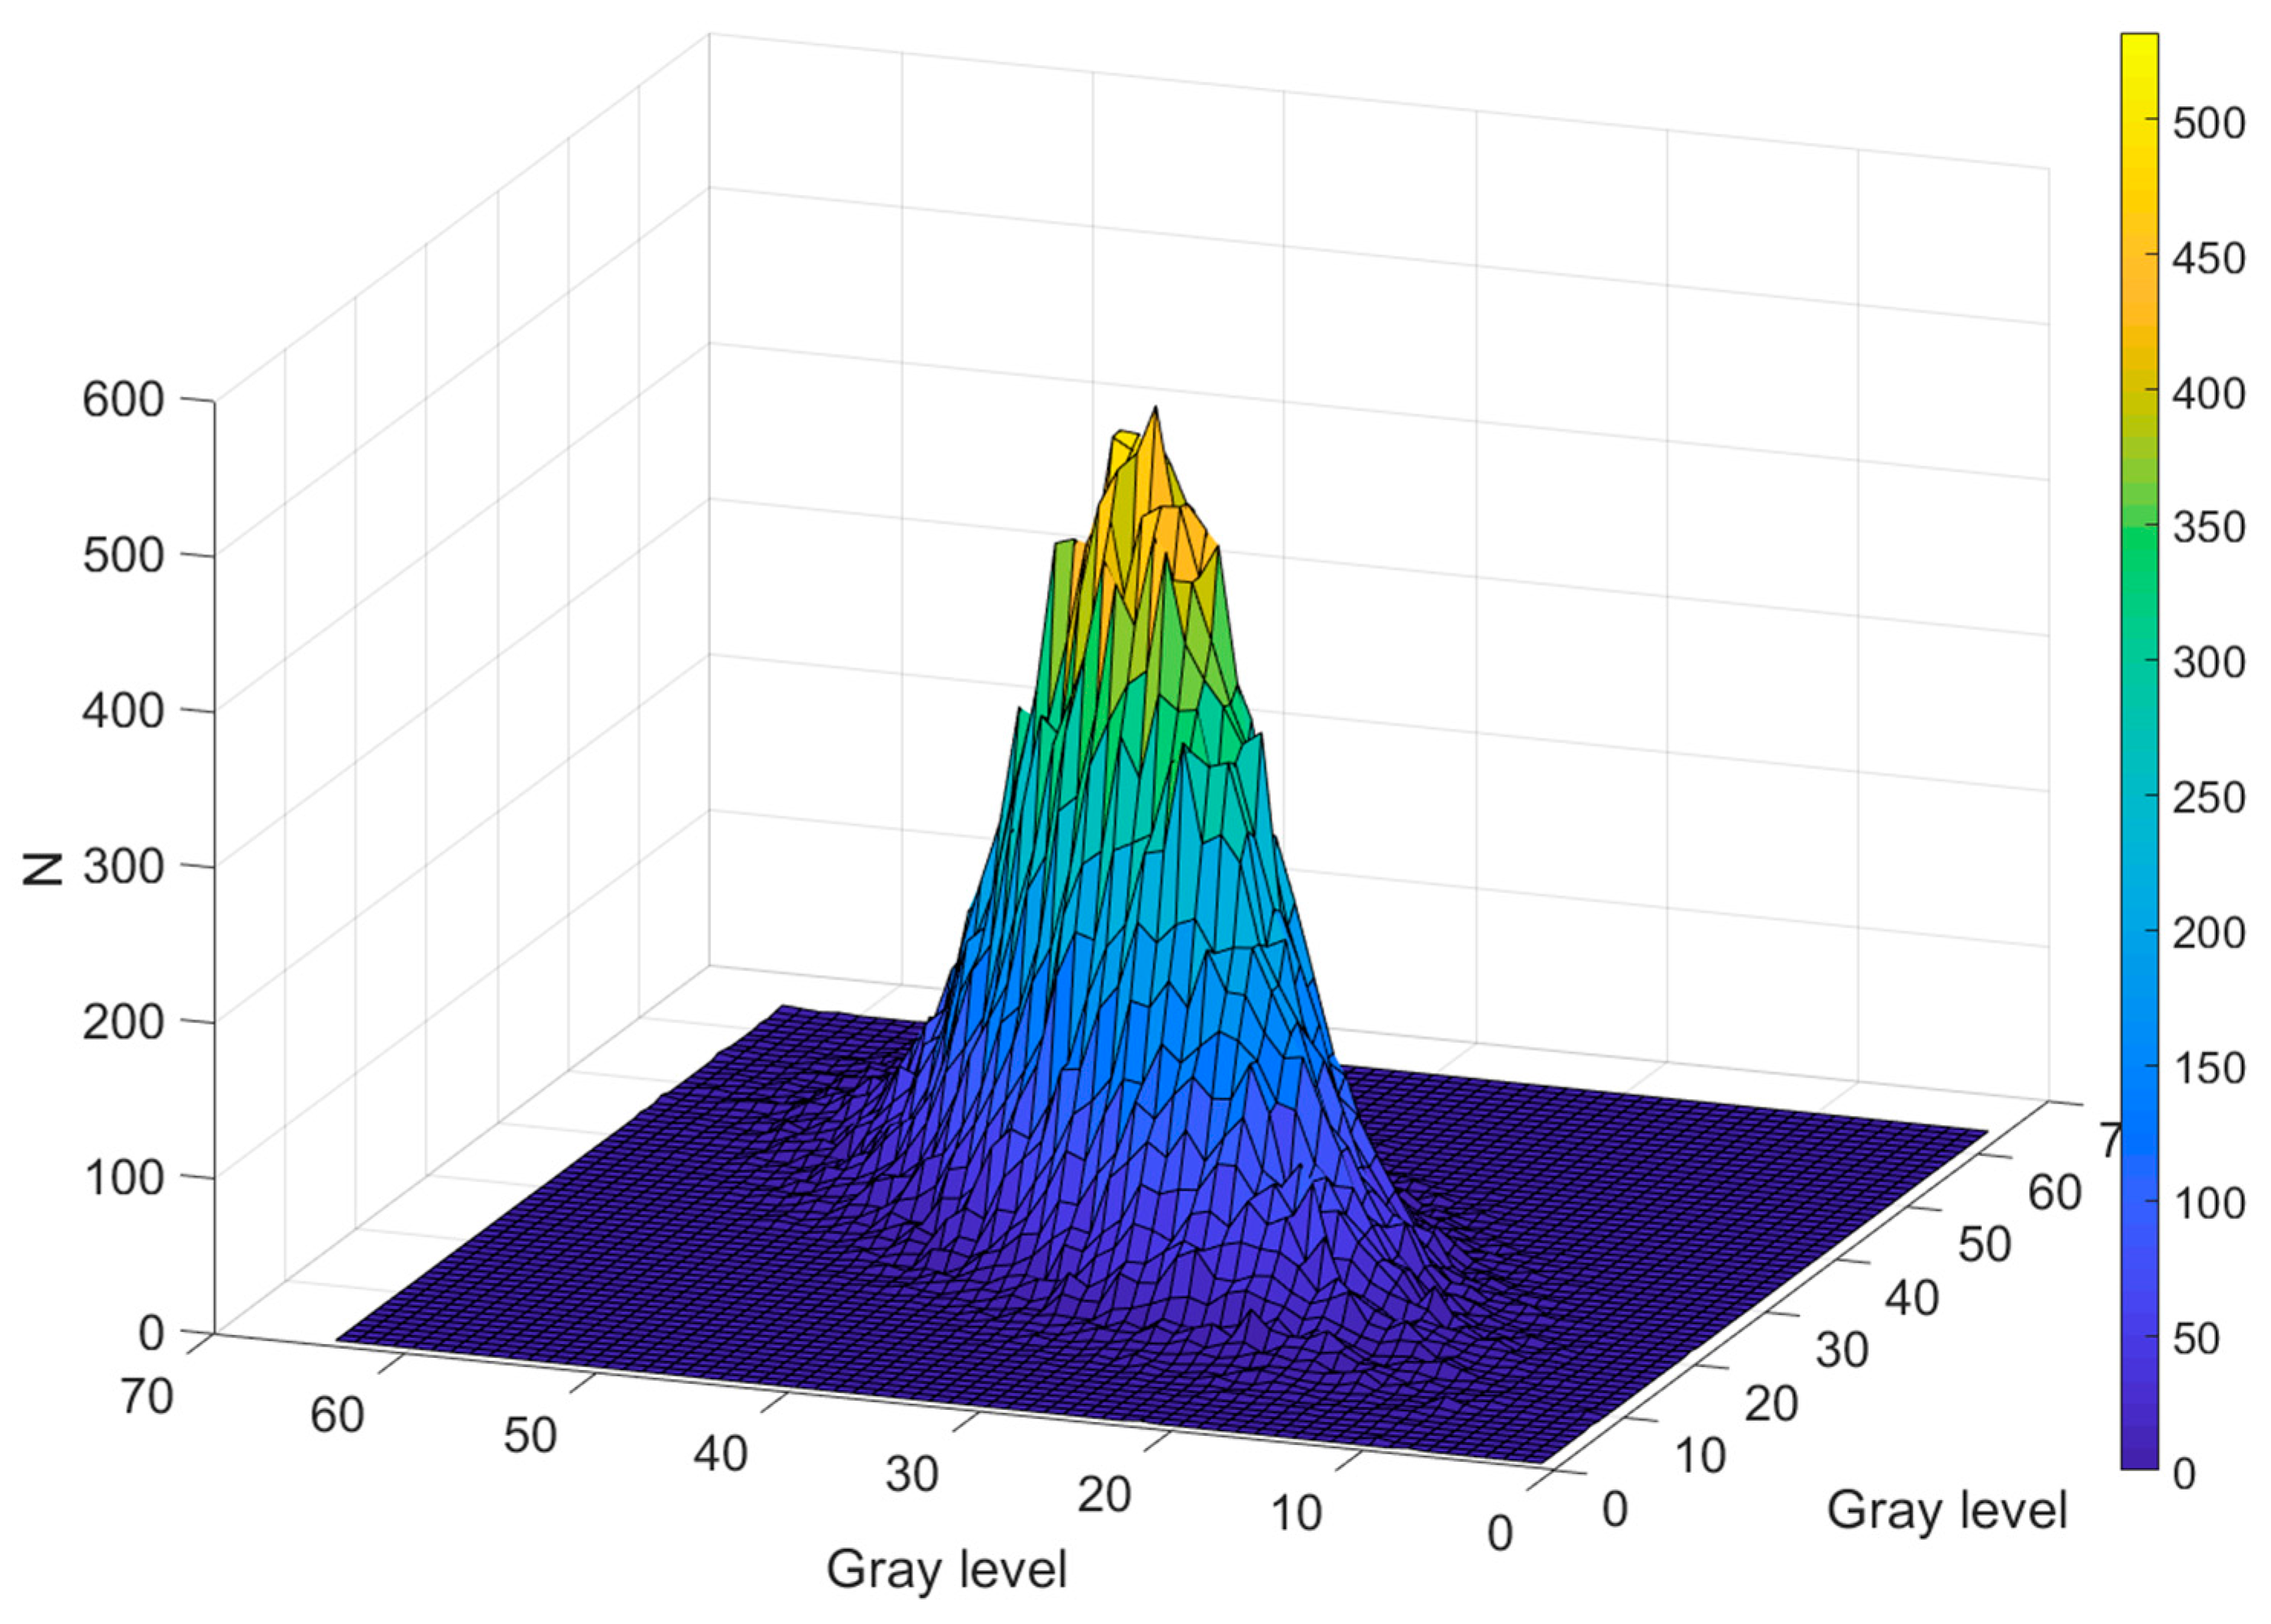
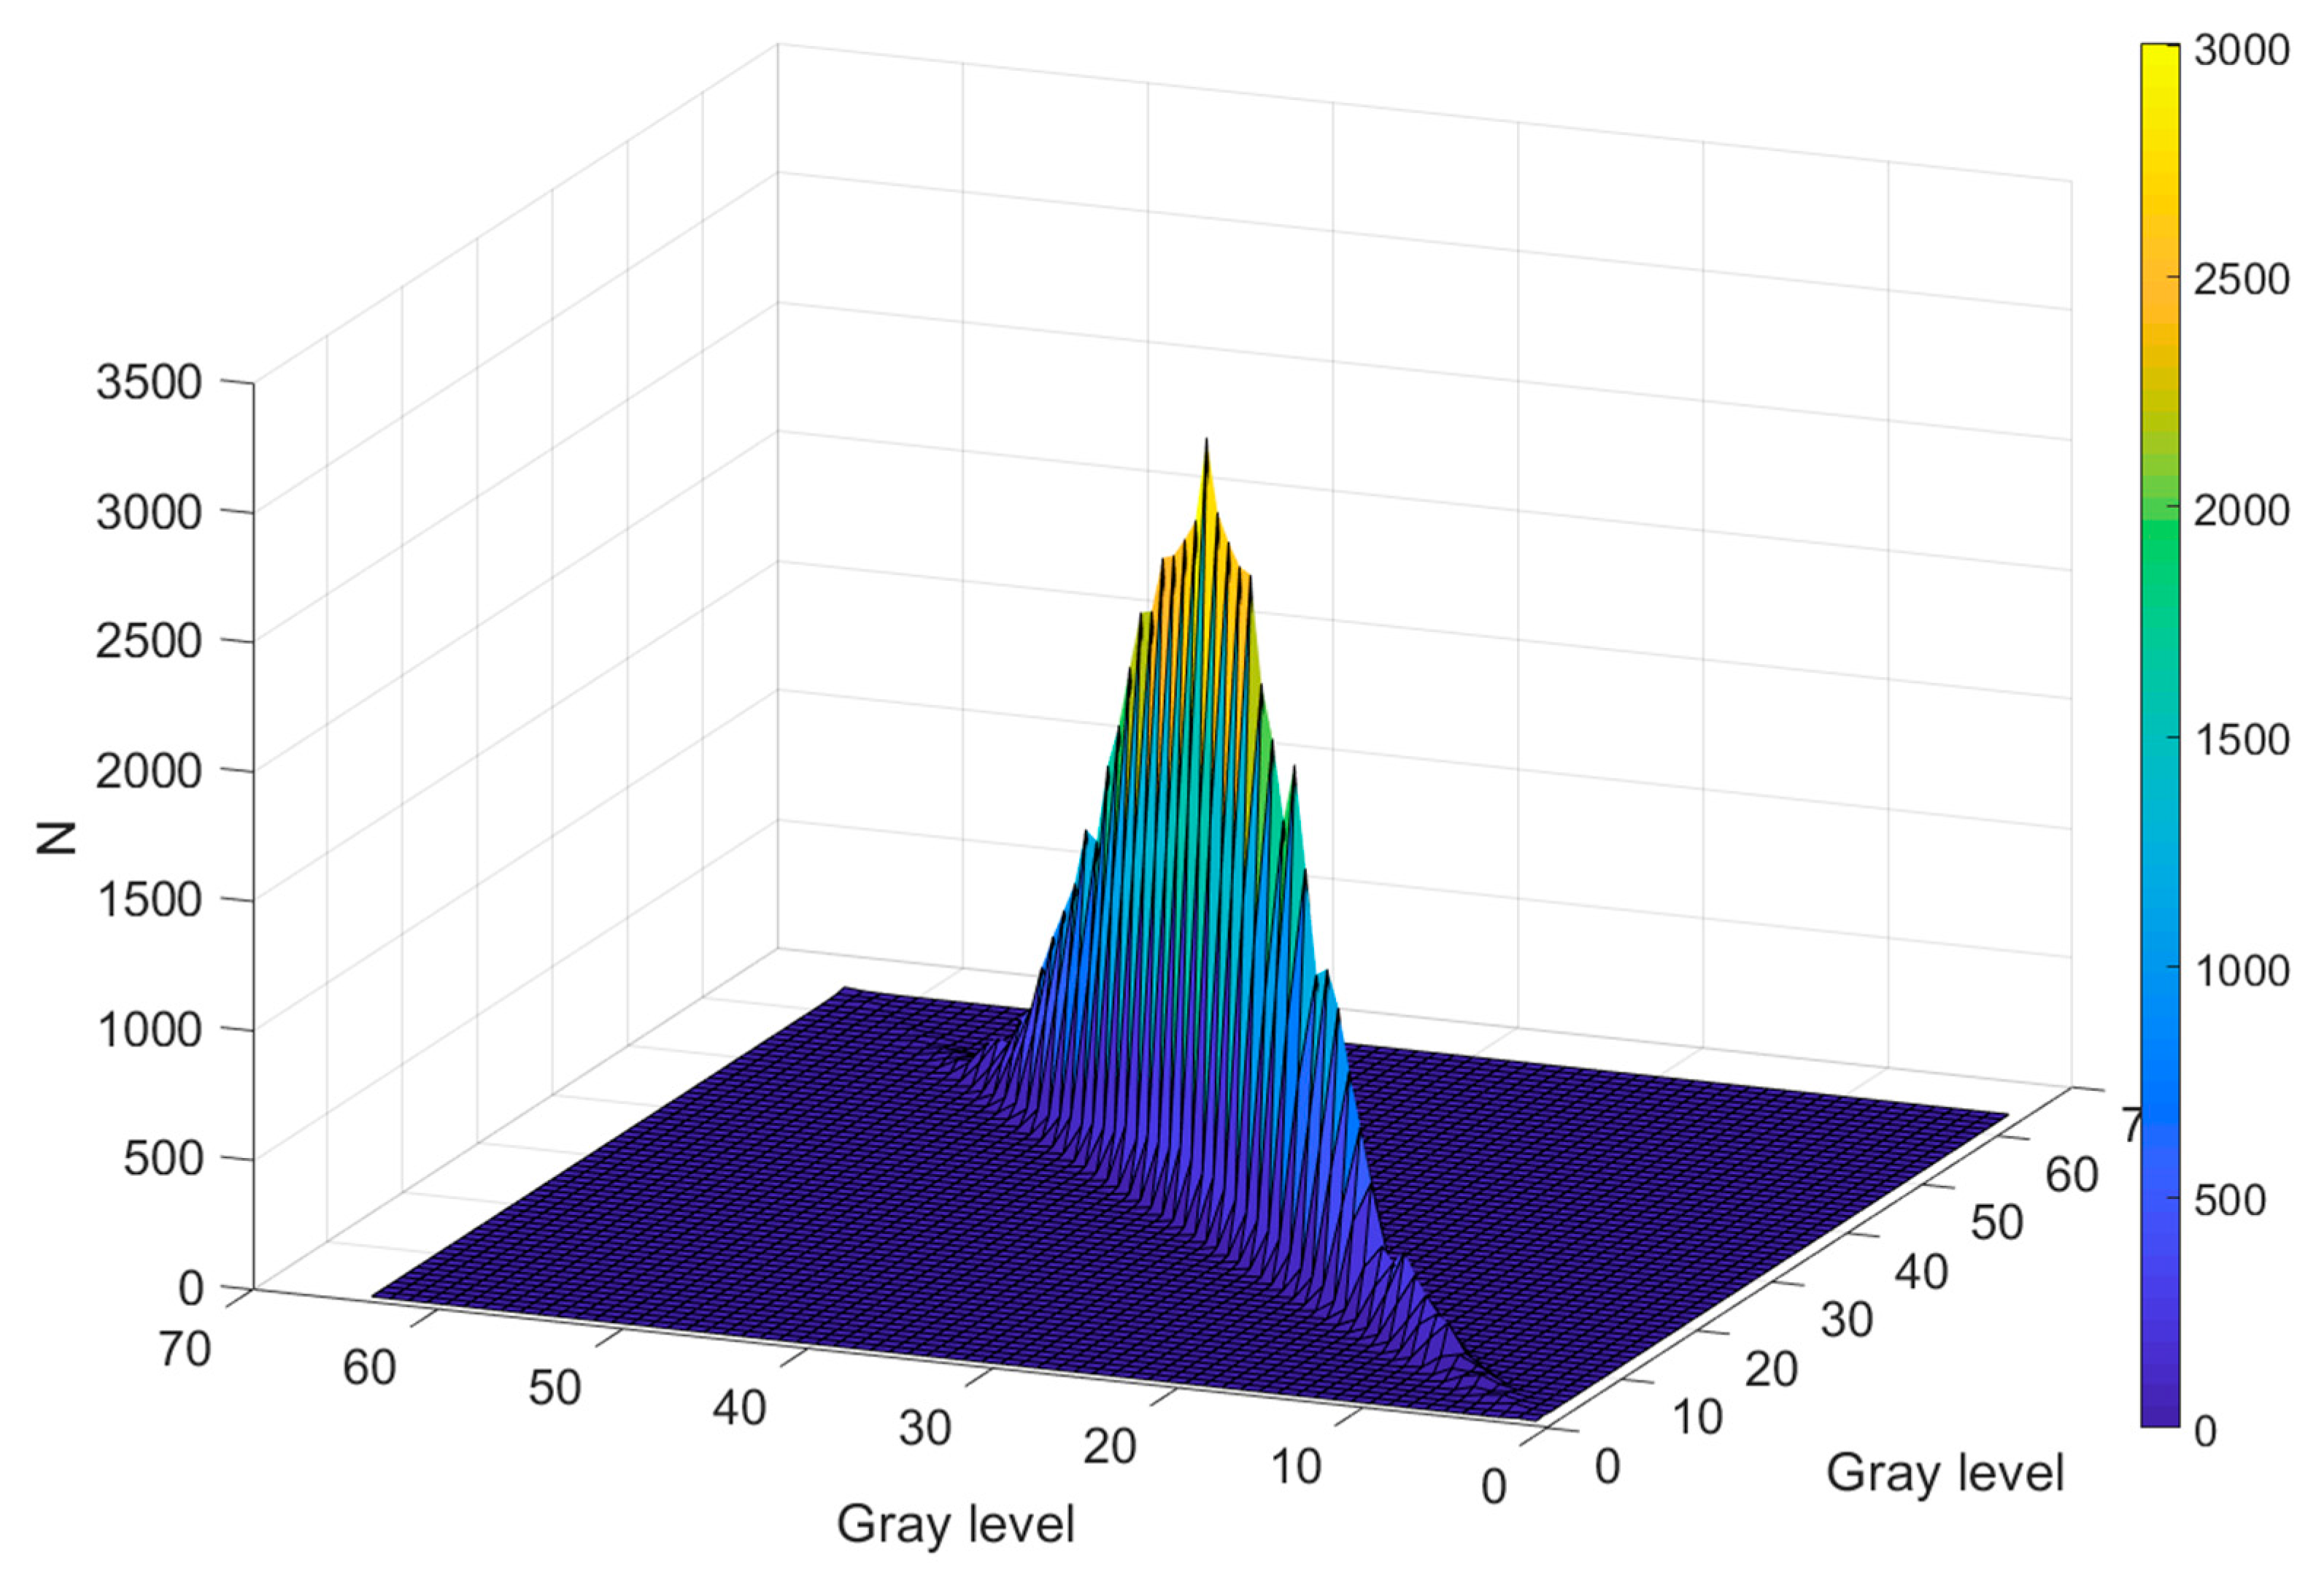
Figure 4 and
Figure 5 depict a 3D representation of the GLCM, having the number of co-occurrences, defined in
Section 2.3, on the Z axis and the gray level on X and Y axis. The GLCM in
Figure 4 was computed for the TS corresponding to a particle diameter of 35 nm and
Figure 5 was computed for the TS corresponding to a particle diameter of 3000 nm.
Examining
Figure 4 and
Figure 5, we notice that the distribution of the intensity levels for the TS corresponding to 35 nm particles is flatter and wider around the main diagonal of the GLCM, while the TS corresponding to 3000 nm is narrower around the main diagonal. This is consistent with the fact that the smaller the particles scattering the light are, the faster and bigger the scattered light fluctuations are. The 3D representation of the GLCM for the diameter in between follows the same trend.
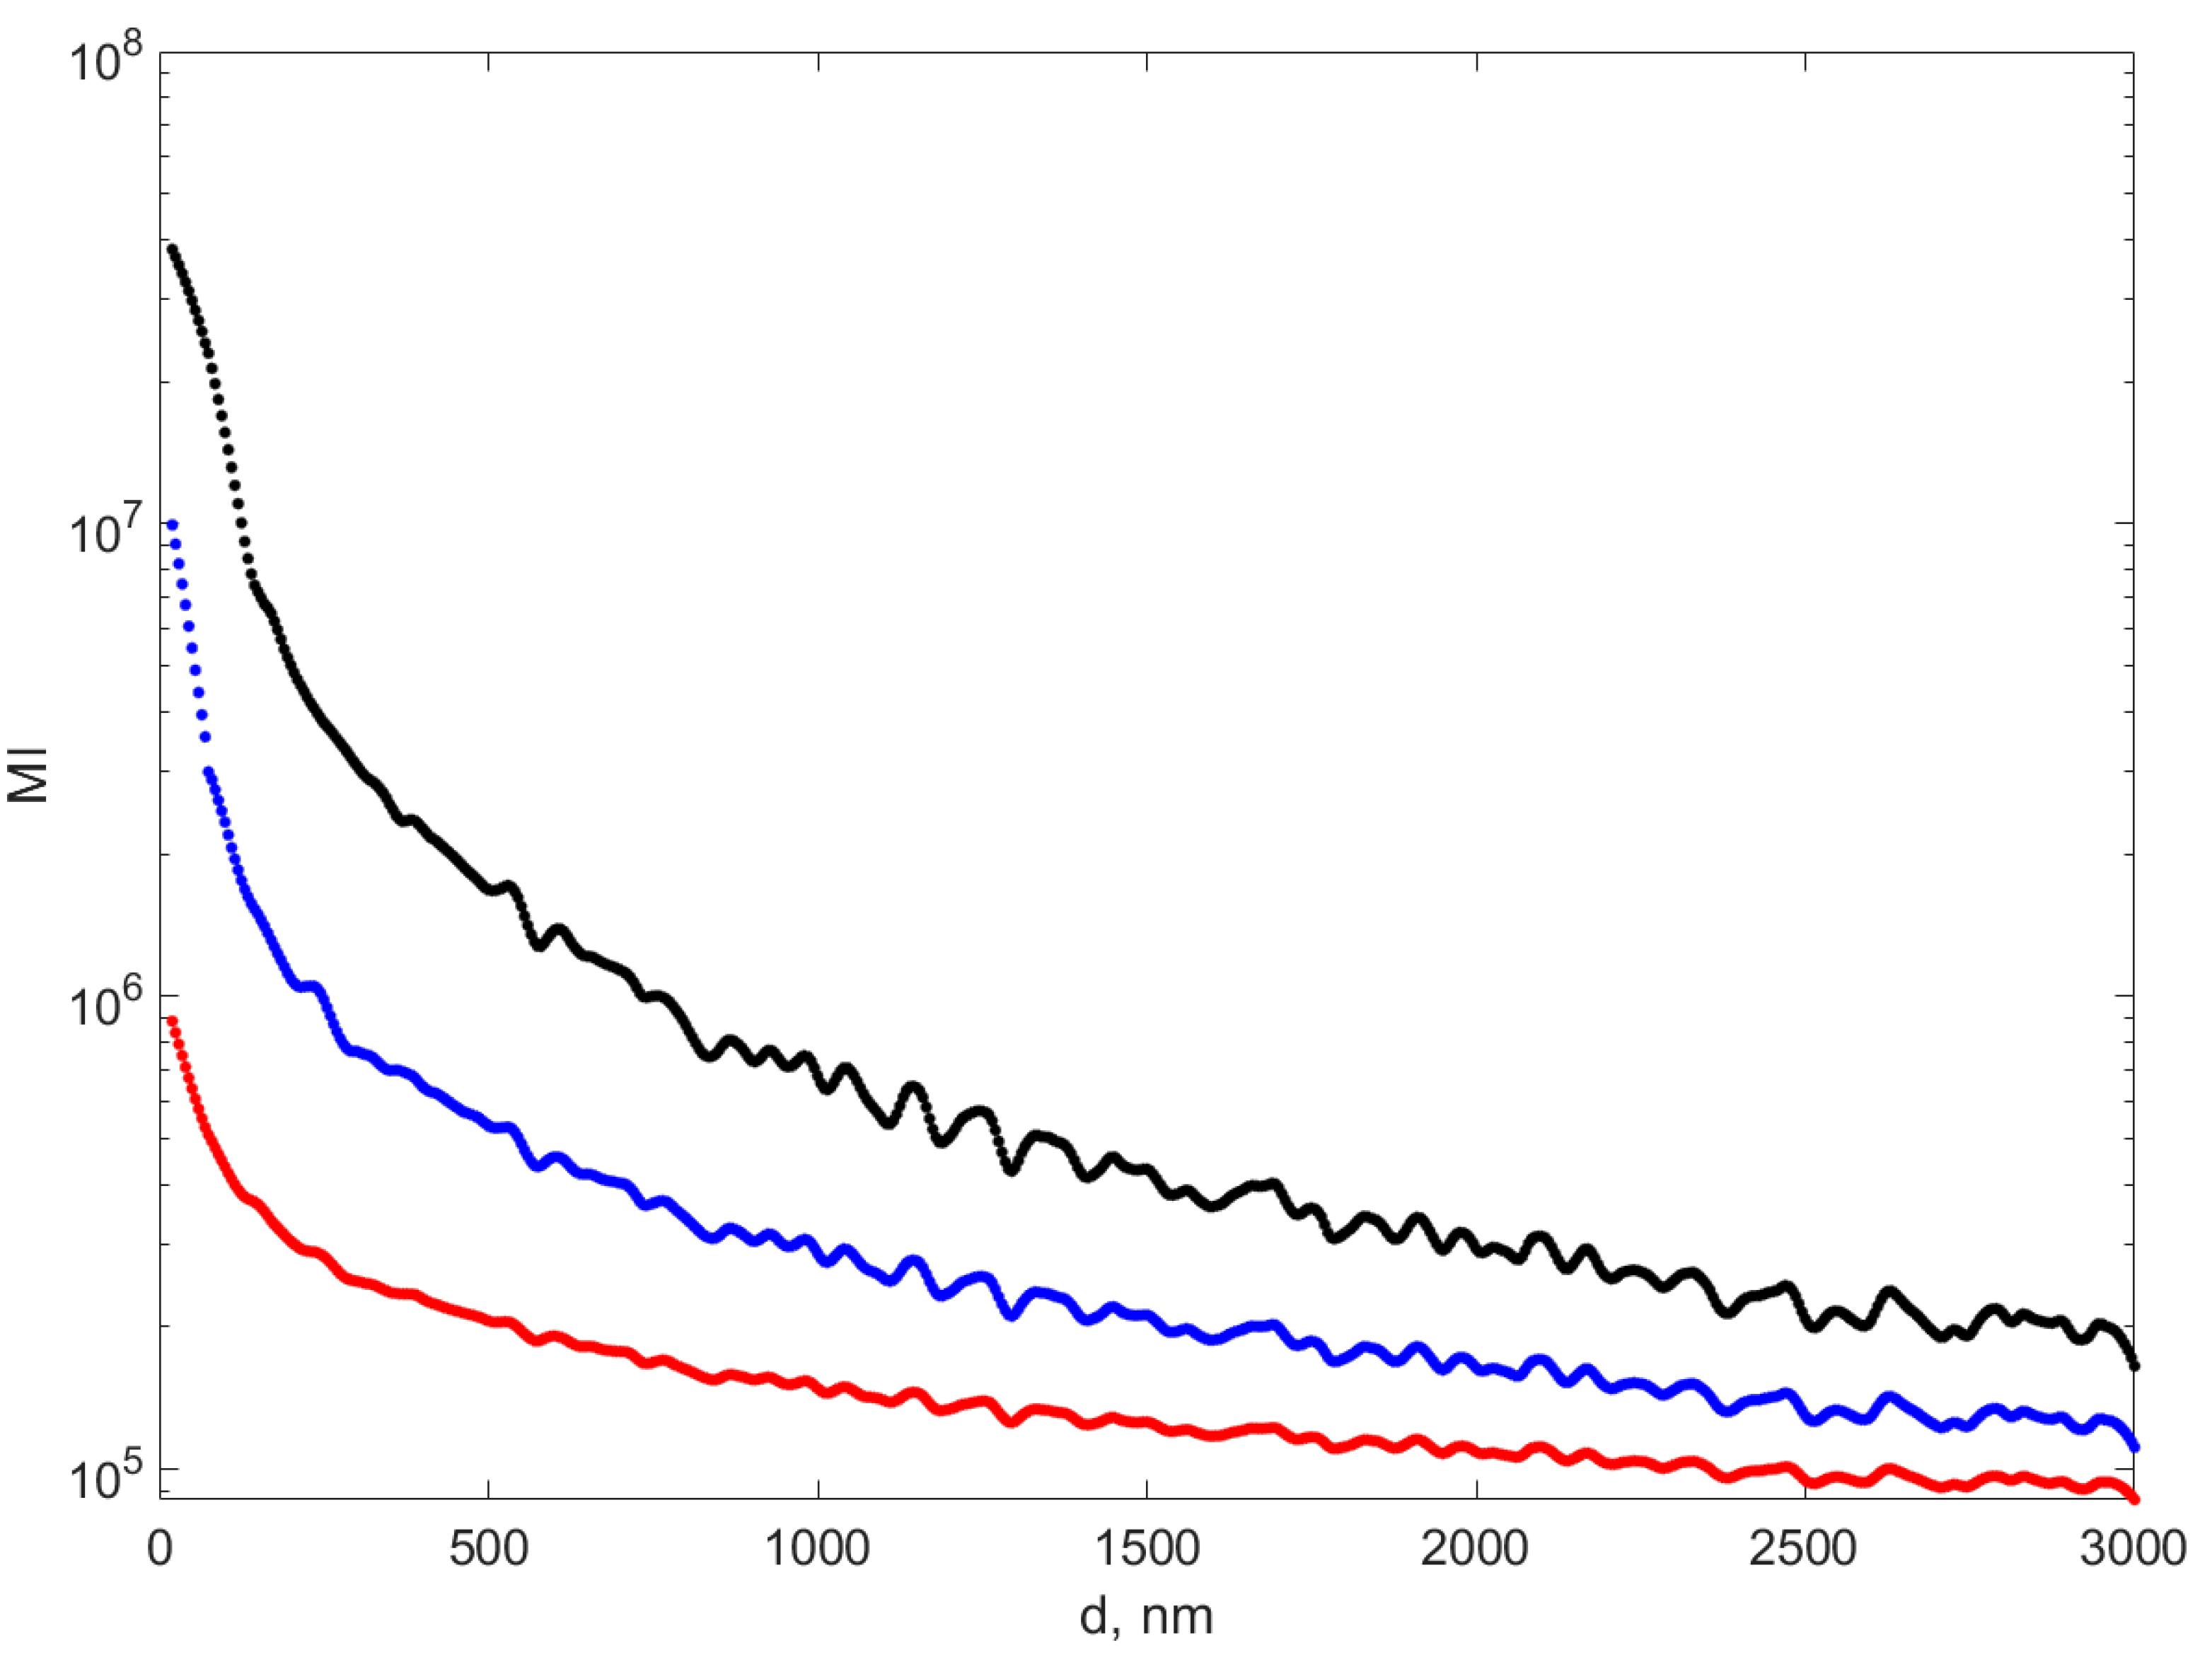
Moving further, we calculated the moments M1, M2, and M3 on the GLCMs corresponding to each TS and smoothed the big fluctuations using the moving average implemented in the Matlab function smoothdata, with a window of 27 and the algorithm parameter ‘rloess’ representing the robust quadratic regression over each window. The fluctuations are a consequence of the random numbers used for generating the TSs, as described in the previous section, and of the relatively small number of data points in each TS, with limitations imposed by the long time required to generate each TS, which was 25 min running on a Xeon processor at 2.5 MHz.
Figure 6 illustrates the variation in the first three moments with the diameter corresponding to the TS. As the values of the moments spread over more orders of magnitude, a logarithmic scale was used to illustrate them.
Figure 6 reveals that the moments have a monotone variation with the assumed diameter of the suspended particles, with fluctuations around a trend line and the variation is stronger as the order of the moment increases. The fourth moment has very big values in the low diameter range, as compared to the first two order moments, making them look flat near the diameter axis, therefore it was not shown in
Figure 6.
Monotone variation in the moments with the diameter suggests that the variation might be reverted to provide the diameter of the particles once the moment is known for a TS. For this purpose, rather than searching for an analytic function that produces the best fit, an Artificial Neural Network was the alternative. The Universal Approximation Theorem [
38] states that a feedforward neural network with a single hidden layer containing enough neurons can approximate any continuous function to arbitrary accuracy on a compact subset of the input space.
A feedforward ANN was designed and trained using MATLAB. The Levenberg–Marquard algorithm was used as a training algorithm and the Mean Squared Error for performance. The employed ANN architecture consisted of a single input neuron receiving the value of M value. It contained one hidden layer with 13 neurons and a single output neuron for predicting the diameter. Both the hidden and output layers used the tansig transfer function (MATLAB) for activation. The number of neurons in the hidden layer was iteratively increased until no further improvement (decrease) in the correlation coefficient (R) was observed. Raising the number of neurons will increase the R value but will produce overfitting, while reducing the prediction capability, which is the capability of producing an accurate result for M values which were not in the training set. The R values were 0.9958 for M1, 0.9734 for M2, and 0.9132 for M3.
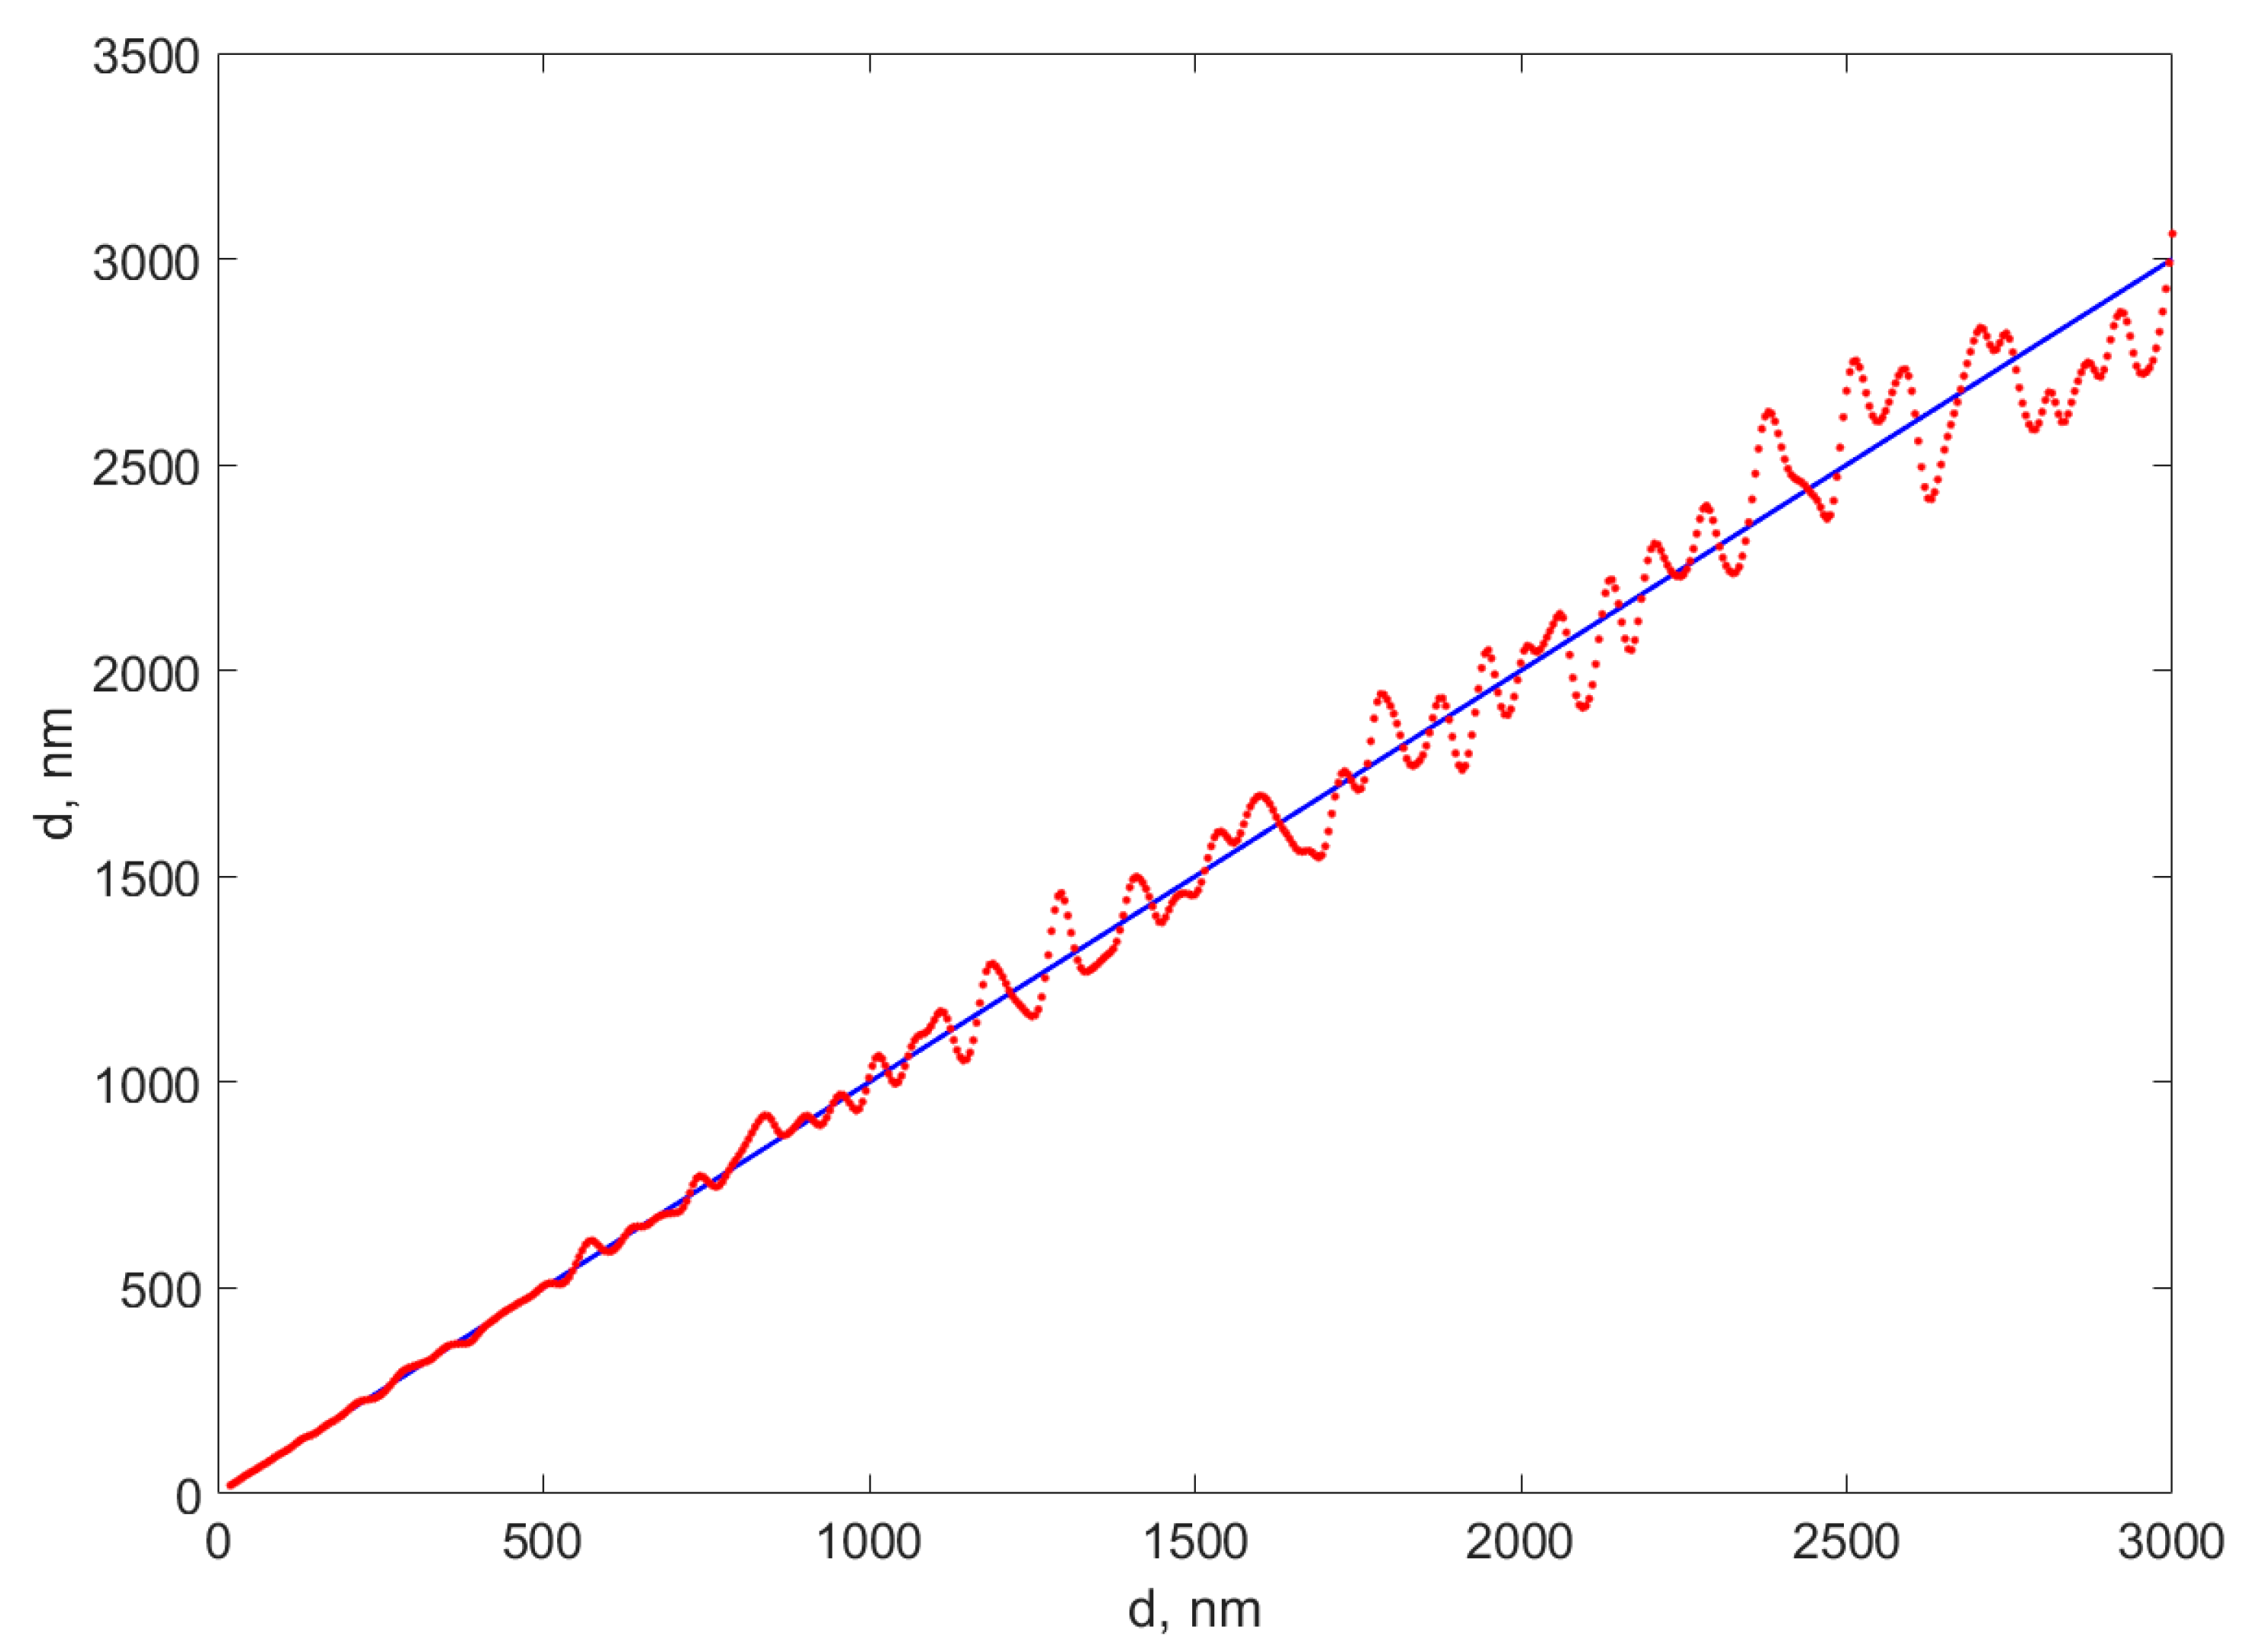
The diameters were assessed using the ANN saved as an MATLAB function with the biases and weights hard coded; therefore, it was easy to be exported in another programming language. The assessed diameters using the ANN for M1 are illustrated in
Figure 6, versus the diameters used in generating the TSs. The other diameters, computed with the ANN functions trained to revert M2 and M3, presented bigger differences from the diameters used to generate the TSs, especially in the very small diameters range, which is not evident on the plot; therefore, they are not presented in
Figure 7.
Figure 7 reveals that the ANN-computed diameters using M1 are relatively close to the diameters used in generating the TSs.
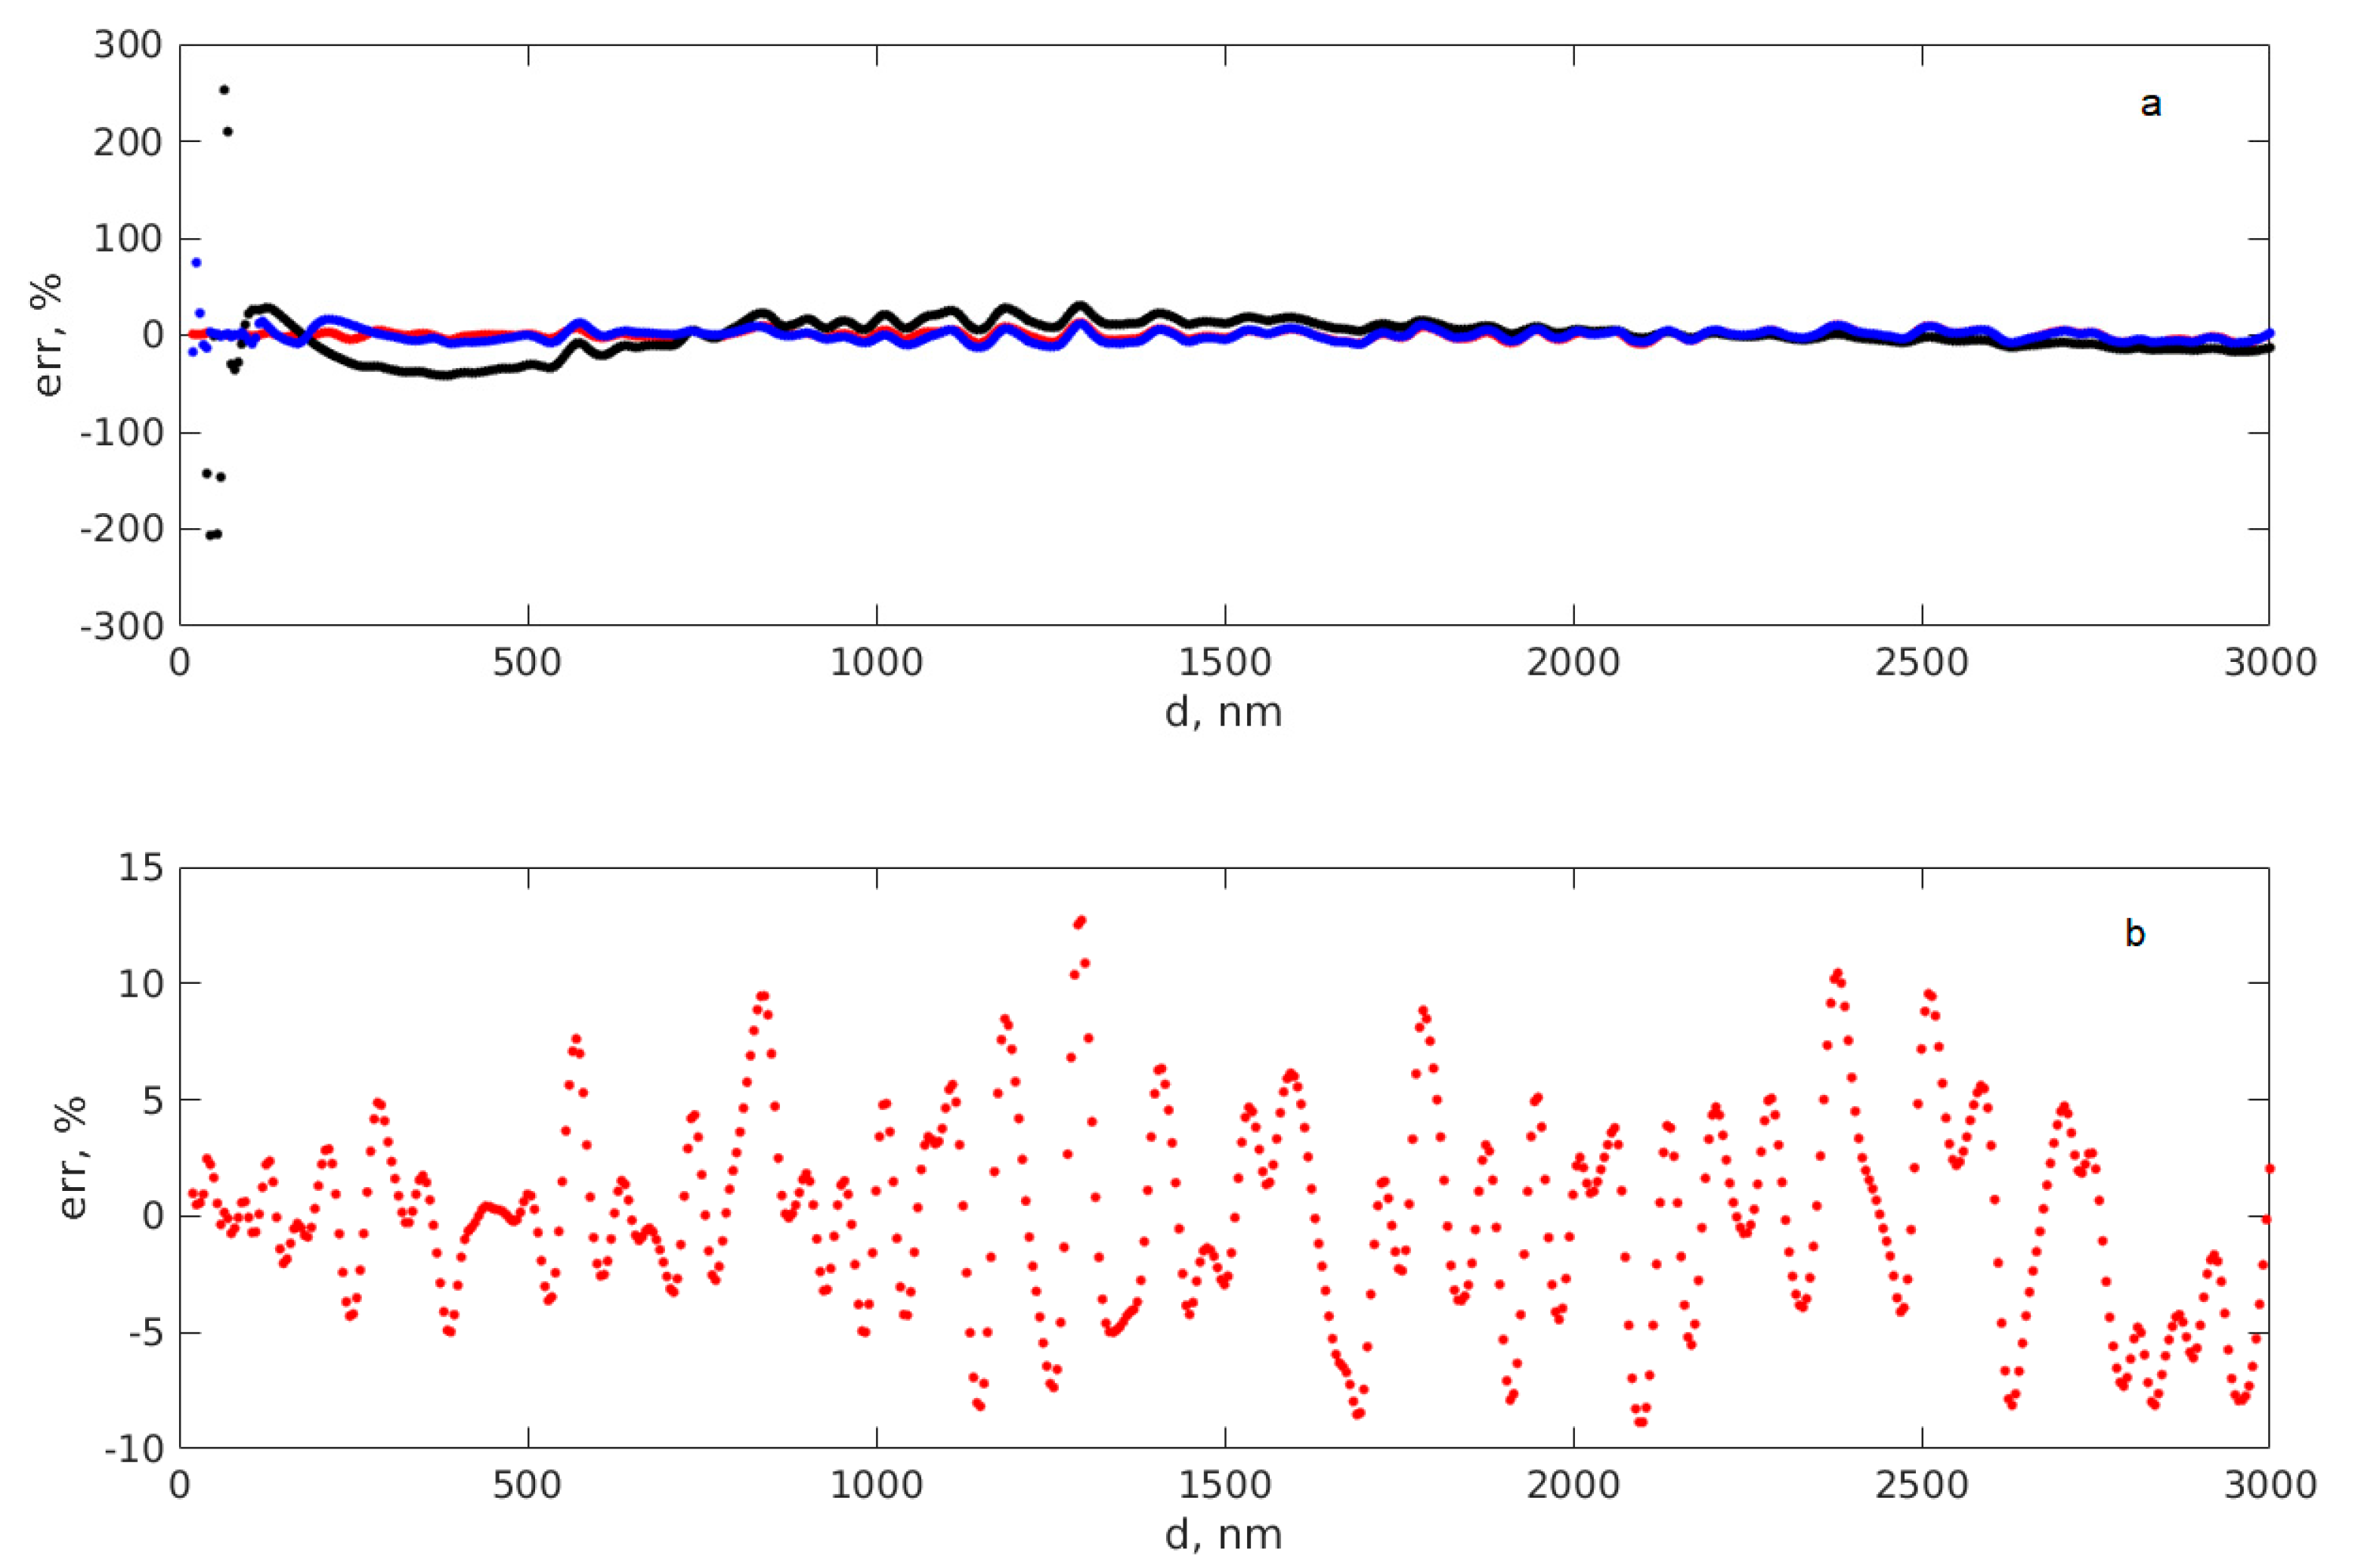
More insight into the closeness of the two types of diameters is brought by the relative errors, calculated with Equation (9):
The relative errors defined in Equation (9) versus the diameter used in generating the TSs are illustrated in
Figure 8.
Figure 8 reveals that the relative errors are rather big for M2 and M3 diameters, especially in the very low diameters range, which makes them unproper for practical applications. The M1 diameters, however, appear to be uniformly spread around zero, without presenting a particular pattern. Moreover, the absolute values of the relative errors are smaller than 15%, with most of them in the 0–5% range, which is reasonably accurate considering the simplicity of the procedure. Nevertheless, this accuracy was found for the simulated data. It is difficult to generate thousands of experimental TSs with a step of five diameters, especially because the calibrated beads have an error in the diameter.
The procedure was tested on experimental TS, recorded using size fractionation via sedimentation, as described in
Section 2.5. The density of the burned clay was 1400 kg/m
3 and the sedimentation and recording every 4 h lasted for 72 h; thus, it produced diameters in the range 100–900 nm. This range of particles is consistent with the diameter interval of the particles for which the IM procedure, consisting of computing the GLCM, calculating the IM, and returning the diameter from it using the trained ANN, is used.
The TSs were processed using both the DLS and MI procedures described in
Section 2.1,
Section 2.2 and
Section 2.3 and the maximum diameters of the particles remaining in suspension were assessed as in
Section 2.4 and data is presented in
Table 1. The last column in
Table 1 is the relative error of the MI diameters considering the DLS diameter as reference, as in Equation (10).
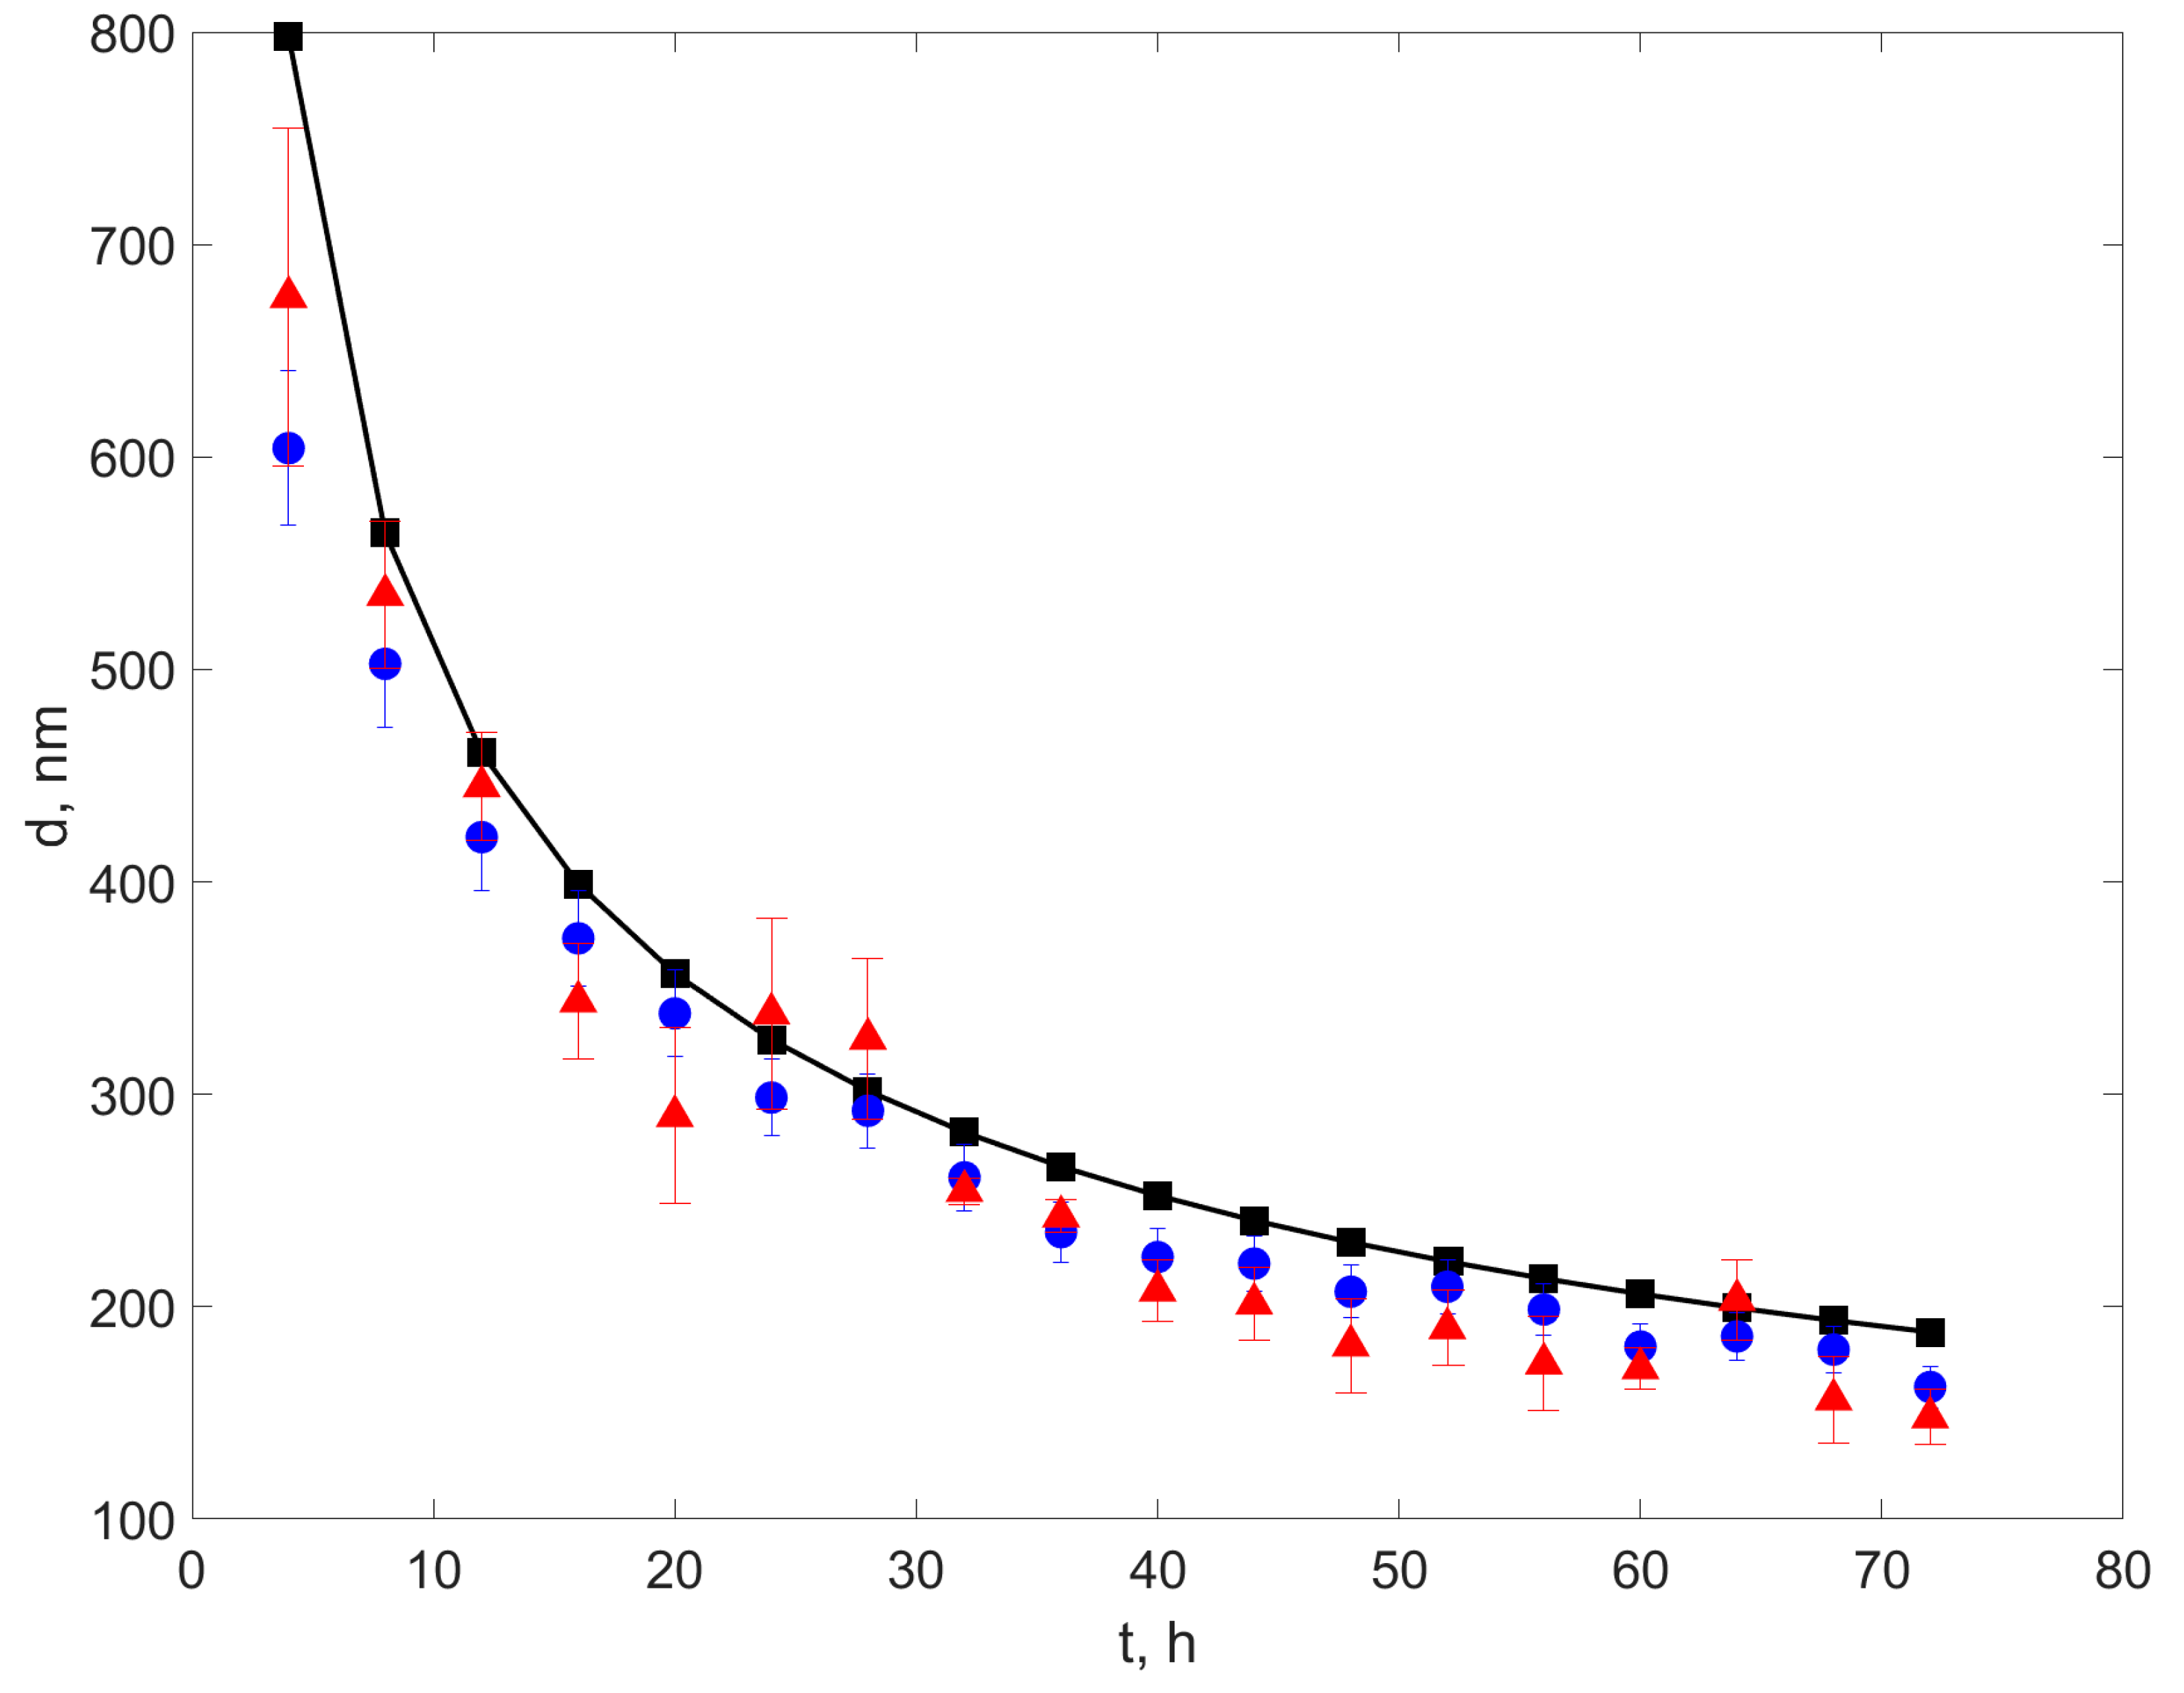
Data in
Table 1 is also illustrated in
Figure 9. The DLS errors were calculated following the procedure described in the annex of [
39] and are 9%; therefore, the error bars of the DLS diameters were 9% of the measured data.
Figure 9 reveals that both the DLS and the MI diameters follow the trend of the sedimentation diameters, which indicated that the diameter fractionation method worked well. We also notice that the DLS diameters are slightly smaller than the sedimentation diameters. This is consistent with the fact that the scattered light intensity is proportional to the diameter raised at the power of three; therefore, the DLS diameter assessed as described in
Section 2 is not an average of the diameter values in suspension but the average of the biggest diameters [
39]; yet, it is smaller than the biggest diameters. Moreover, the error bars of the IM diameters are overlapped, in part, which suggests that the MI procedure can be used to assess the approximate diameter of the biggest particles in suspension, with an error that proved to be less than 15% on the test with the experimental data and that the procedure is not sensitive to the smaller particles in suspension. The relative error of the method is therefore considered to be 15% and used further on to assess the relative errors for the calibrated latex beads.
Moreover, we should note that the DLS diameter error bars do not overlap with the sedimentation diameter. A possible cause can be the finite diameter of the laser beam, 0.5 mm, which introduces an error in assessing the maximum diameter of the particles in the beam area for a sedimentation length L of 6 mm, which, in its turn, is measured with an error, as the surface of the liquid is concave.
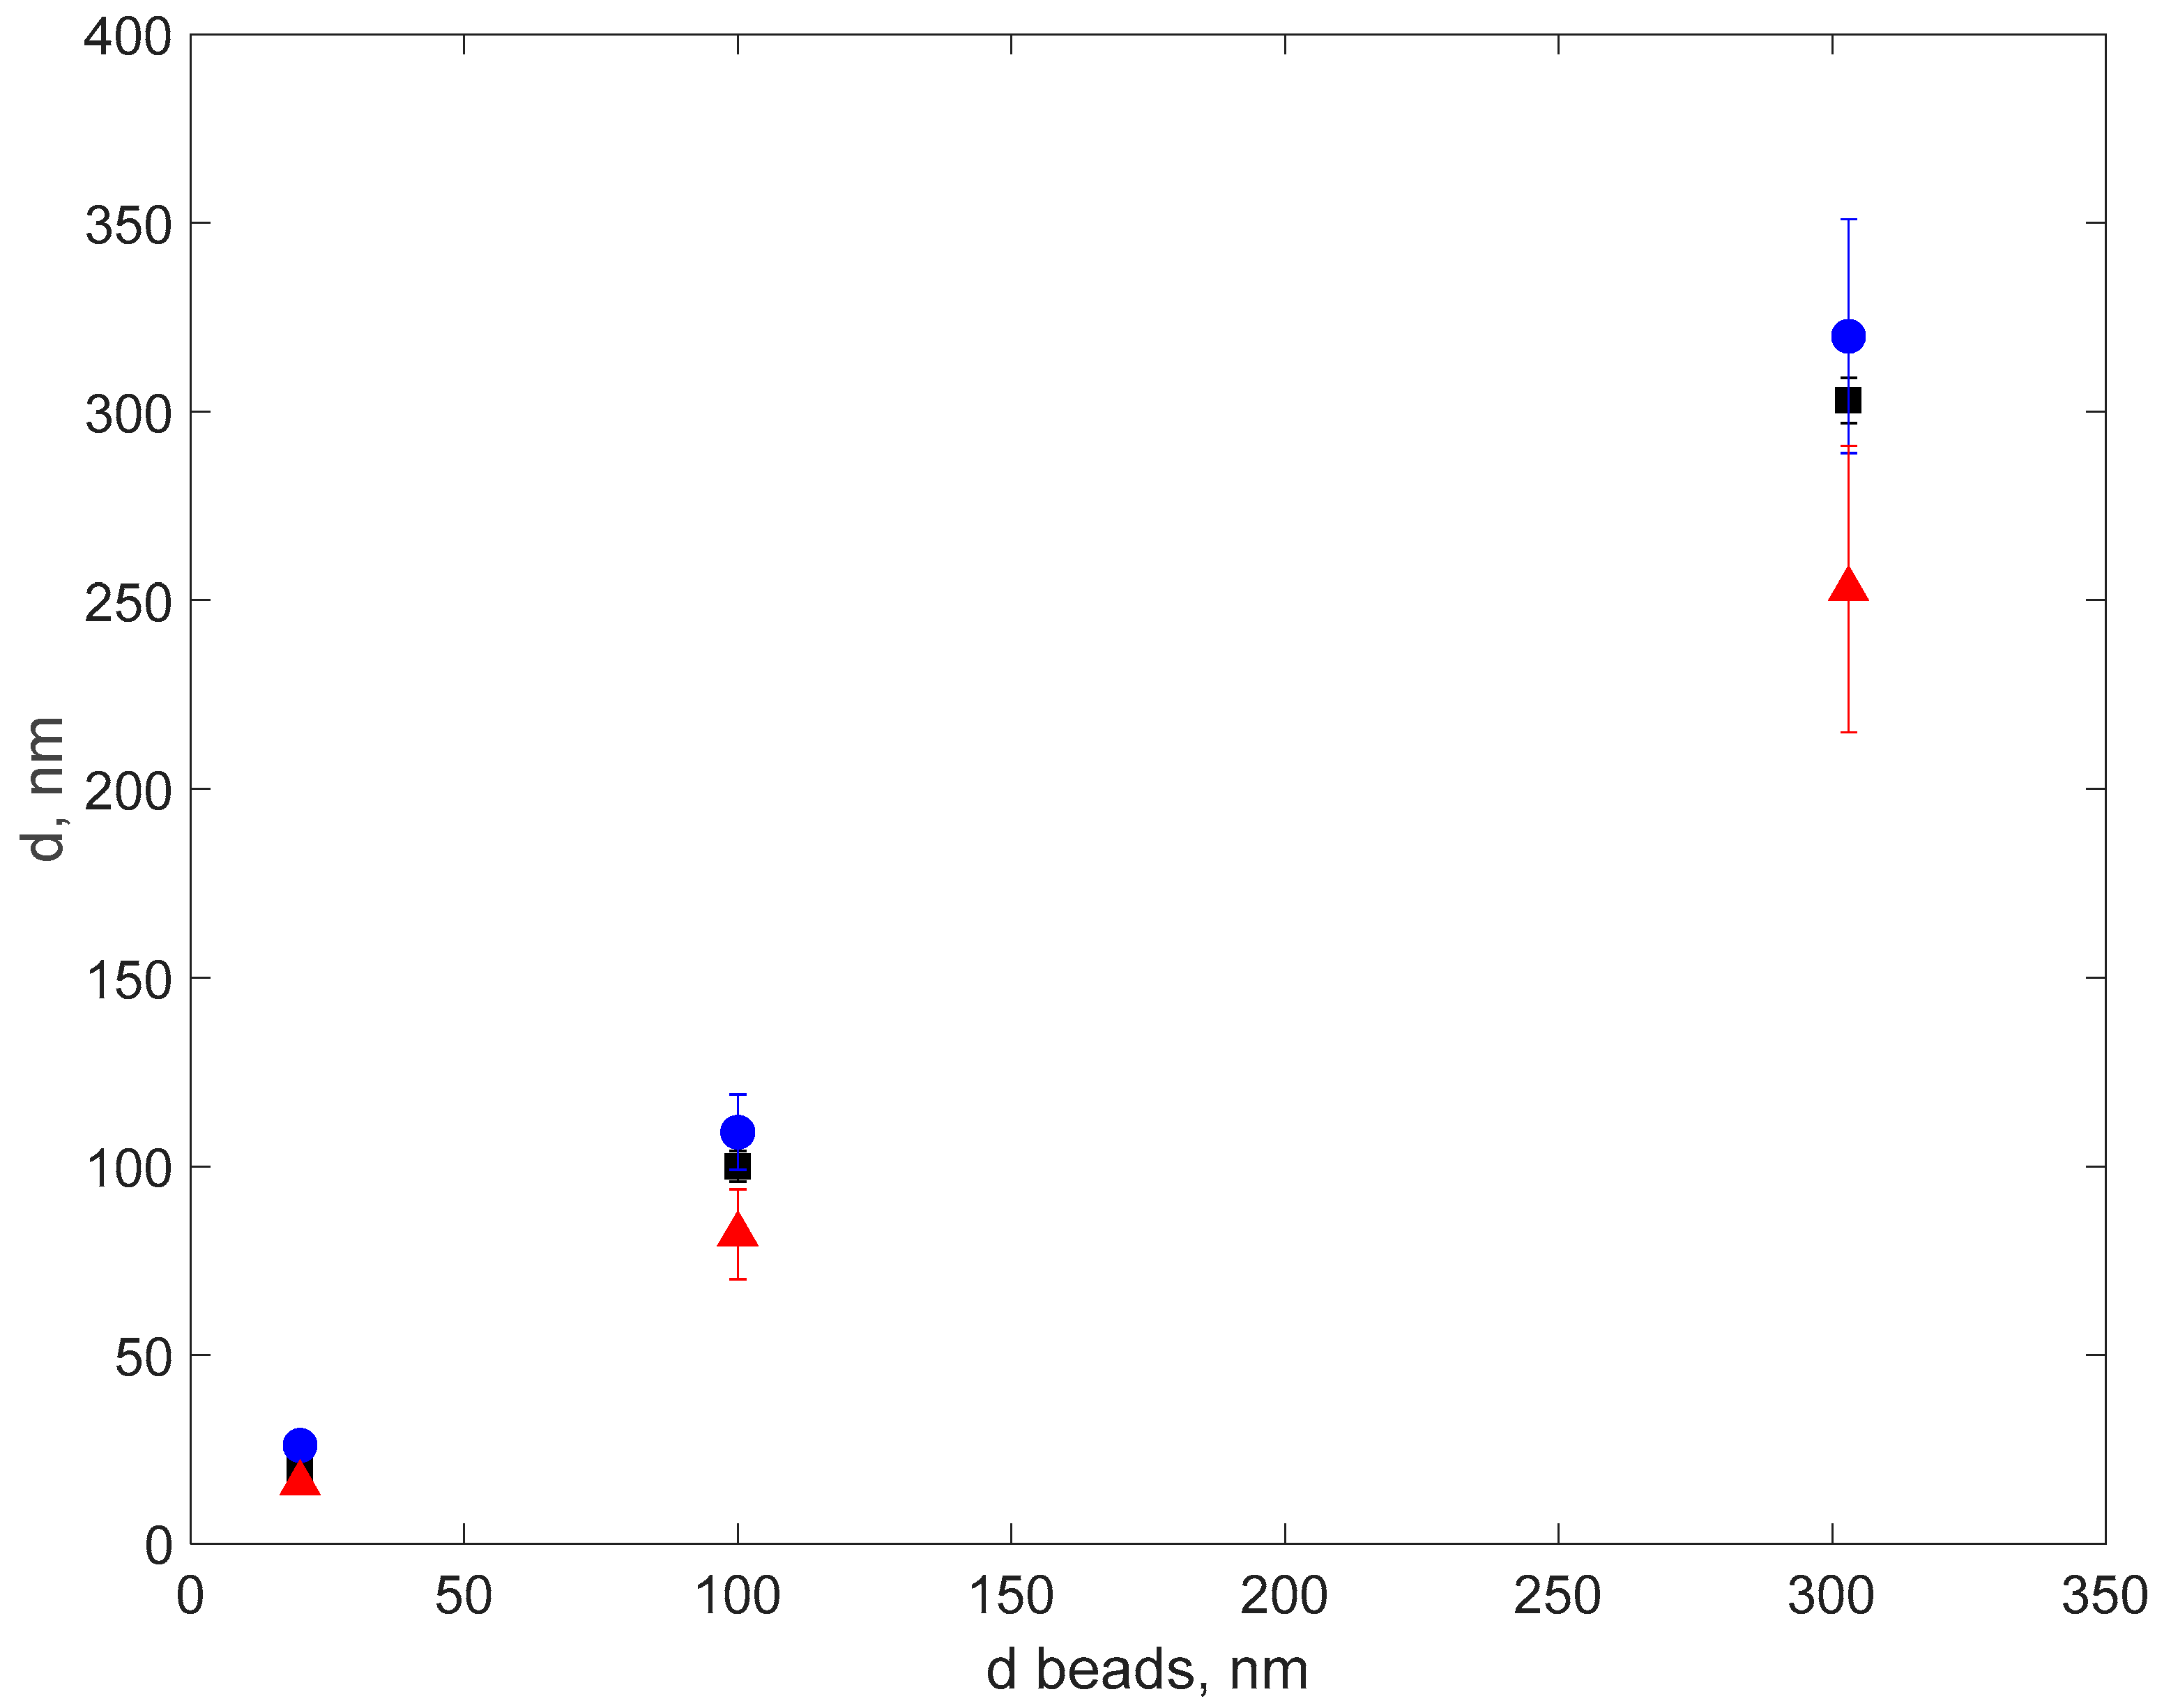
The results of the DLS and IM procedures on processing the DLS TSs recorded with the same DLS setup and with the same parameters, on calibrated latex balls in suspension, are presented in
Table 2.
The data in
Table 2 can be viewed in
Figure 10, where the error bars are Columns 3, 5, and 7.
Figure 10 reveals that the error bars of the DLS- and IM-assessed diameters do not fully overlap with the error bars of the latex beads indicated by the producer. This means, firstly, that the DLS procedure error is slightly bigger than estimated, which is 9%. Secondly, the MI procedure is, at its turn, slightly less precise than estimated from the simulated DLS TSs that were used to assess the IM and to train the ANN. Nevertheless, the IM-based procedure described in this paper outputs a diameter that is relatively close to the diameter that was used to generate the TSs and train the ANN, even if with relatively big errors. This can be considered a proof of concept for using this procedure not to replace the elaborated DLS procedures, as described in the Introduction section, but to develop a procedure that is less time consuming than the traditional DLS procedures, less computation intensive, and suitable to be exported to a light, portable computing platform, like a single board computer. Such a relatively simple device can be made more precise by training the ANN with data on a wider set of real data and can be used to detect particles in suspension that have a diameter bigger than a chosen threshold, therefore being an advanced sensor.
