1. Introduction
Azimuth sensing is essential in a wide range of industrial applications, including robotics and automation [
1], oil and gas drilling [
2], and autonomous vehicles [
3]. Tilt angle is a fundamental parameter in azimuth measurement, making accurate determination of both inclination and azimuth angles essential. Currently, inclinometers are commonly based on mechanical, micro-electromechanical systems (MEMS), and inertial measurement unit (IMU) methods; however, each approach has inherent limitations. Mechanical inclinometers are cost-effective and durable but are highly susceptible to external disturbances such as vibration and impact [
4]; MEMS-based inclinometers can be significantly downsized, but due to the brittleness of the materials, sensors are prone to fracture during practical use [
5]; IMU-based inclinometers offer high precision and adaptability to dynamic environments but are vulnerable to noise, particularly at high frequencies [
6]. These limitations highlight the urgent need for inclinometers with enhanced performance and higher sensitivity.
Fiber-optic inclinometers have attracted considerable research interest and have found broad applications due to their inherent advantages, including high precision, corrosion resistance, long service life, and capability for distributed sensing [
7,
8,
9]. Fiber-optic inclinometers are intrinsically safe and passive, are immune to electromagnetic interference, exhibit high accuracy and sensitivity, are capable of multiplexing and distributed sensing, exhibit durability, long-term stability, and remote sensing characteristics, and are suitable for operation in harsh environments. As a result, fiber-optic inclinometers hold an irreplaceable position in such fields as aerospace, energy and power, oil and gas, civil engineering, structural health monitoring, biomedicine, defense and security, and industrial process control [
10]. Depending on their functionality, fiber-optic inclinometers can be categorized into one-dimensional (1-D), two-dimensional (2-D), and three-dimensional (3-D) types. One-dimensional inclinometers are only sensitive to inclination. For instance, Canthadai et al. reported a simple low-cost portable tilt sensor using plastic optical fiber which achieved a sensitivity of 97 mV/° for a 100 gm weight attached to the cantilever [
11]. However, such configurations cannot provide azimuth information. Two-dimensional inclinometers, in contrast, enable simultaneous measurement of inclination and azimuth. Chang et al. proposed a novel 2-D fiber-optic inclinometer using two orthogonally arranged etched chirped fiber Bragg gratings (CFBGs), achieving high sensitivity with an inclination resolution of 0.003° [
12]. Nevertheless, yaw information remains unavailable with this design. More advanced 3-D inclinometers are capable of measuring pitch, roll, and yaw simultaneously. Pei et al. demonstrated a novel distributed inclinometer based on optical frequency domain reflectometry (OFDR) technology, employing the Frenet–Serret equation to reconstruct displacement with a maximum per-unit-length error below 0.45% [
13].
Because yaw data are often unnecessary in applications such as geothermal drilling and aerospace, and because having fewer sensing dimensions simplifies maintenance, improves calibration efficiency, and enhances interference immunity [
14,
15], this study focuses on 2-D fiber-optic inclinometers. Despite progress, existing 2-D fiber-optic tilt sensors still face the critical challenges of limited sensitivity and insufficient sensor stability under practical conditions [
16].
In this paper, we propose a novel inclinometer based on a multi-core fiber Fabry–Perot interferometer (FPI), employing the Vernier effect to overcome the issue of limited sensitivity. A cascaded FPI was inscribed in a seven-core fiber (SCF) using a femtosecond laser plane-by-plane direct writing technique. Owing to the Vernier effect, the sensitivity was significantly enhanced. The device exhibited a maximum sensitivity of −0.5272 nm/° for azimuthal angle measurement (maximum measurement error: 7.33°) and −0.5557 nm/° for inclination angle measurement (maximum measurement error: 5.97°). The measurement ranged from 0° to 360° for azimuth and −90° to 90° for inclination. The proposed all-fiber 2-D inclinometer is compact, offers a wide measurement range and high sensitivity, and demonstrates strong potential for practical applications in harsh environments.
2. Fabrication and Principle
To ensure measurement isotropy, a multi-core fiber is employed. The SCF is selected due to its typical space-division multiplexing (SDM) structure in optical communication, mature fabrication process, and low inter-core crosstalk [
17]. As shown in
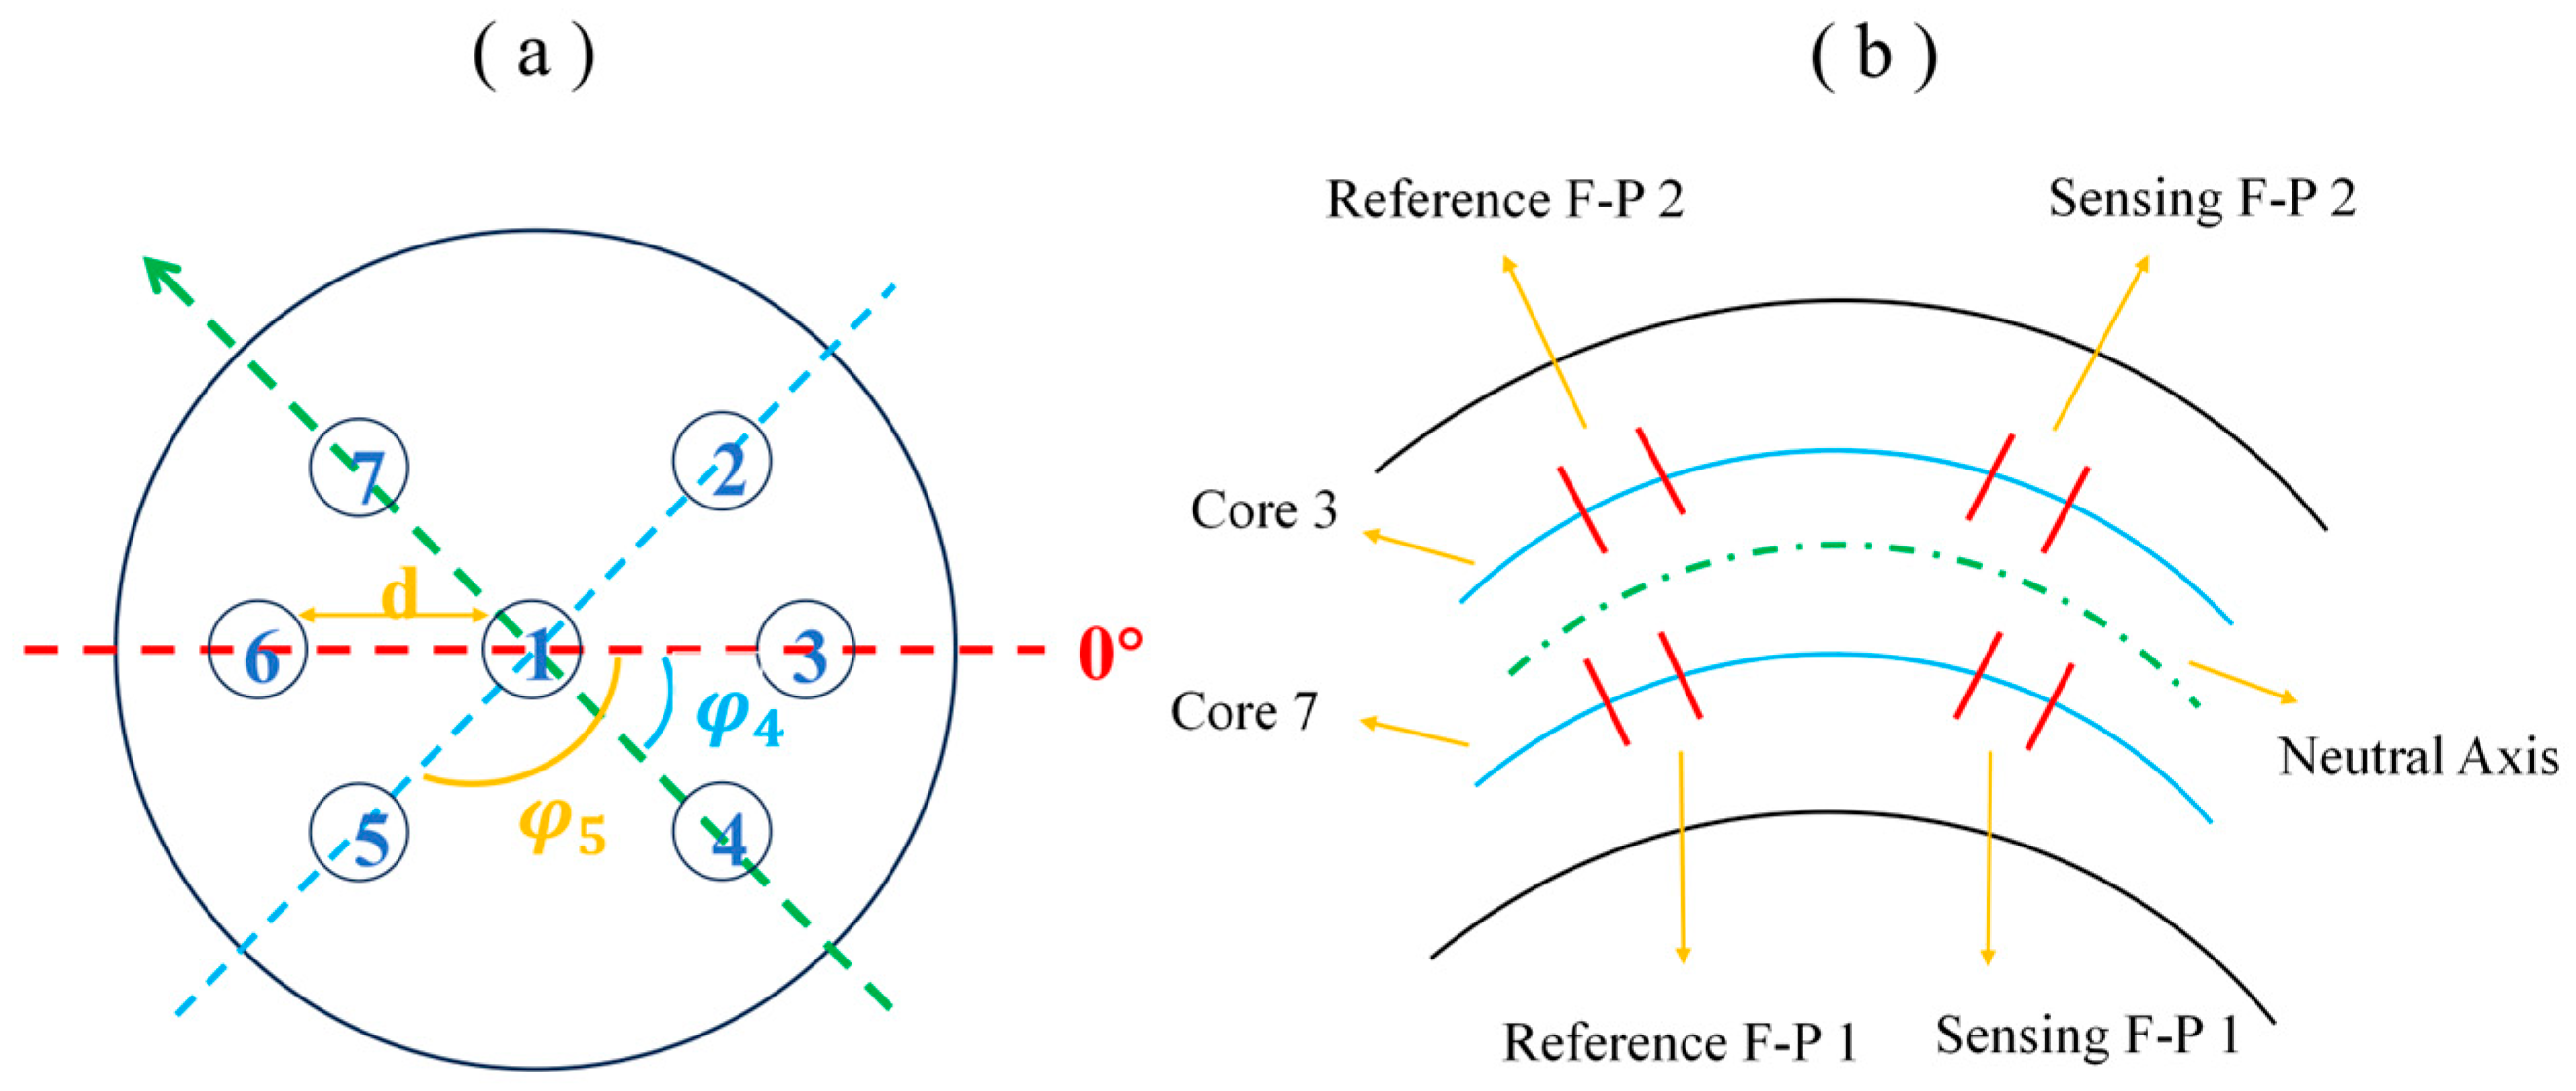
Figure 1a, the fiber comprises seven cores arranged in a hexagonal pattern within a common cladding. The cladding diameter
D is 150 μm, each core has a diameter of 8 μm, and the core-to-core pitch
d is 42 μm. Each core supports independent optical transmission while maintaining near-identical single-mode characteristics. The symmetric arrangement not only increases spatial density and transmission capacity, but also minimizes inter-core crosstalk through optimized spacing. The material of the coating layer of the SCF is acrylic resin with a core diameter of 8 μm. The short-term bending radius is not less than 7.5 mm, the long-term bending radius is not less than 15 mm, and the screening strength is not less than 50 kpsi. When a cascaded FPI is inscribed into different peripheral cores for tilt sensing, the sensing FPIs experience distinct strain responses under external perturbations, leading to measurable wavelength shifts, as schematically shown in
Figure 1b.
In this work, a femtosecond laser plane-by-plane direct writing method was used to inscribe cascaded Fabry–Perot interferometers (FPIs). This method generates periodic refractive index modulation points within the fiber core as the laser beam is precisely translated along the fiber axis. By adjusting the translation velocity along the y-axis, the periodicity of the refractive index modulation can be flexibly controlled. Compared with conventional phase mask techniques, this approach offers greater flexibility, enabling direct inscription into various types of fibers, including standard single-mode and dispersion-shifted fibers. The fabricated gratings exhibit high thermal stability, strong resistance to erasure at elevated temperatures, and compatibility with fiber coatings, which makes the method widely applicable to fiber lasers and advanced photonic devices.
For a single FPI inscribed within a fiber core, the free spectral range (
FSR) of the reflection spectrum can be expressed as:
where
λ is the operating wavelength,
n is the effective refractive index of the fiber core, and
L is the cavity length of the FPI.
According to the Vernier effect, when two FPIs with slightly different
FSRs are cascaded, their superimposed spectra generate a periodic envelope with a much larger effective
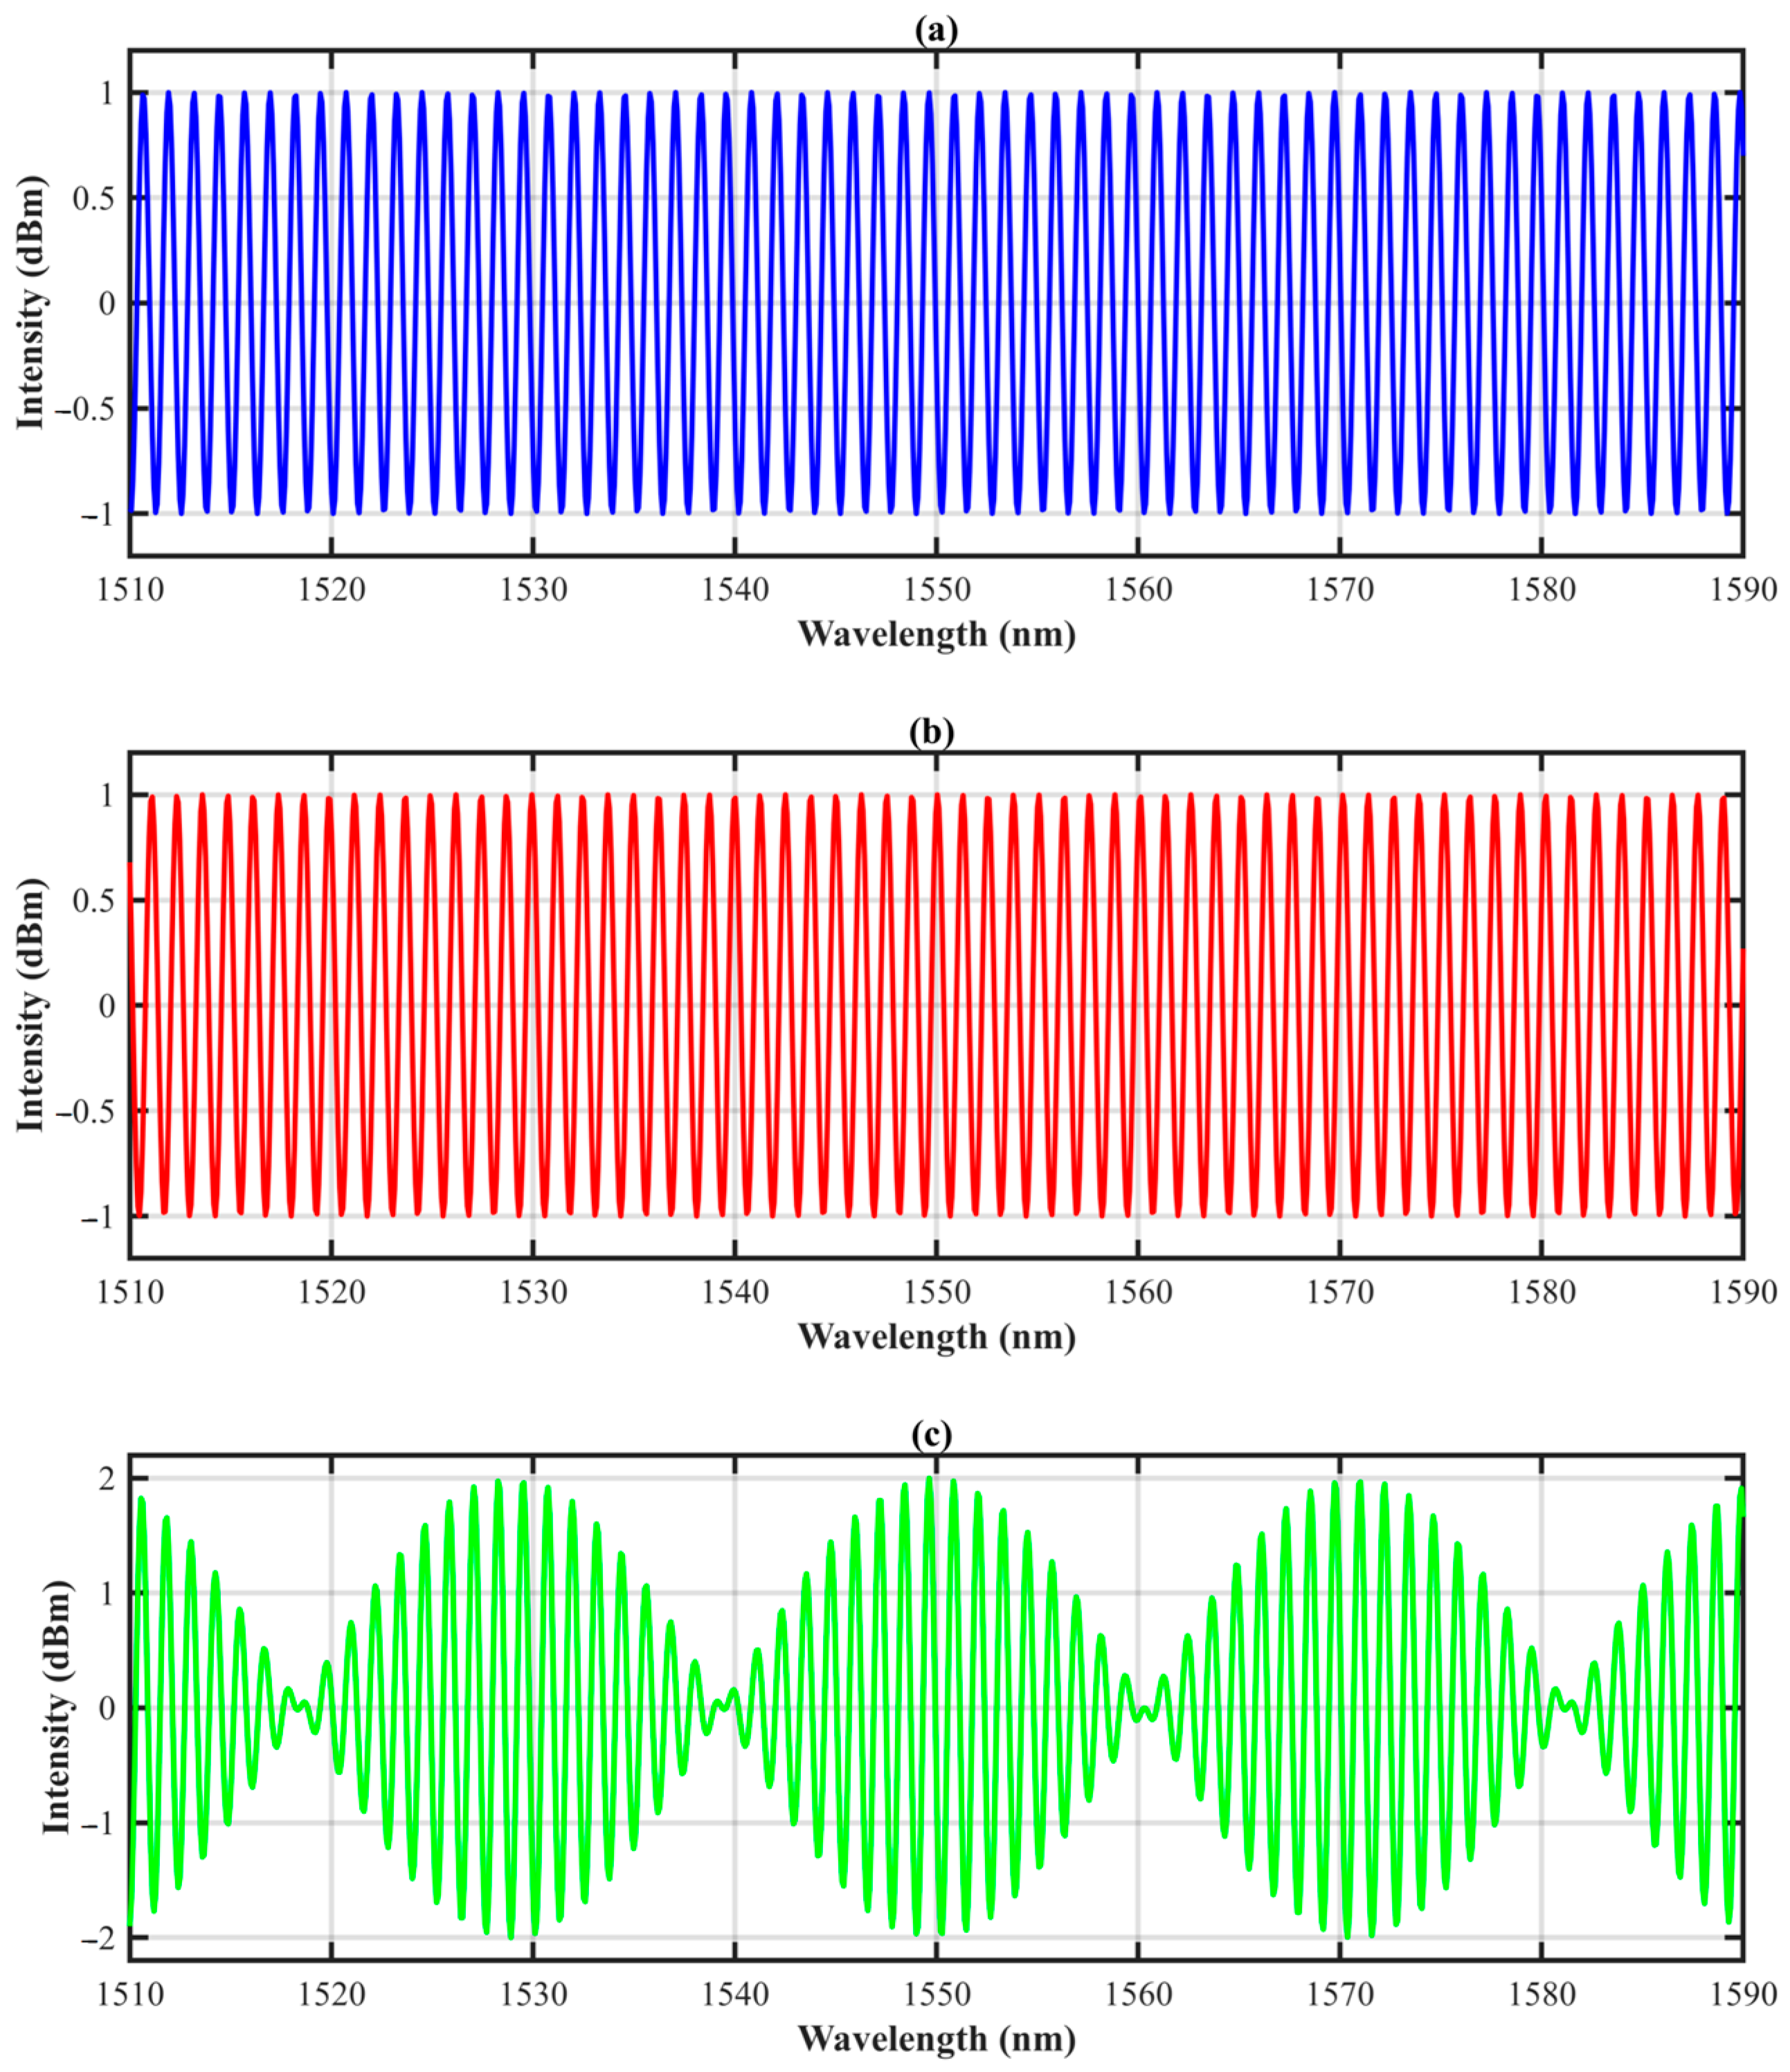
FSR, as illustrated in
Figure 2. For a cascaded FPI system consisting of a sensing FPI and a reference FPI, the
FSR of the Vernier envelope formed is:
where
and
correspond to the
FSRs of the sensing and reference FPIs, respectively.
The associated wavelength shift amplification factor
M introduced by the Vernier effect is given by:
This amplification significantly enhances the effective sensitivity of the cascaded interferometer system, providing a powerful mechanism for high-sensitivity angle measurement.
Figure 2 illustrates the scenario under ideal conditions.
Figure 2a,b represent single sinusoidal reflection spectra signals corresponding to the output of individual F-P cavities, whereas
Figure 2c depicts the sinusoidal product reflection spectrum signal modulated by the coupling of the F-P cavities from
Figure 2a,b. However, actual FPI reflection spectra typically exhibit amplitude variations and spectral asymmetries. In this work, cascaded FPIs were inscribed within the peripheral cores of the SCF. The reference cavity was designed with a length of 1020 μm, the sensing cavity had a length of 1000 μm, and the spacing between the two cavities was set to
= 10 cm. Based on these parameters, the wavelength shift amplification factor
M was calculated to be approximately 50, indicating that this scheme can achieve high sensitivity.
Figure 3a depicts the schematic of the FBG inscription system developed in our laboratory. The setup consists of a femtosecond laser system, a micro-machining stage, a real-time FBG monitoring system, and a positioning assistance system. Using this system, femtosecond laser plane-by-plane direct writing was employed to selectively inscribe FPIs into two chosen peripheral cores. In this study, core 3 and core 7 were selected as the sensing channels.
The schematic configuration of the fabricated FPI is illustrated in
Figure 3b. The left FPI serves as the reference cavity, which is not affected by external factors; thus, its cavity length and refractive index are constant, producing a stable reflection spectrum. The reference cavity needs to remain fixed during experimental measurements, so a longer spacing is necessary to avoid unexpectedly small movements of the reference cavity during the experiment [
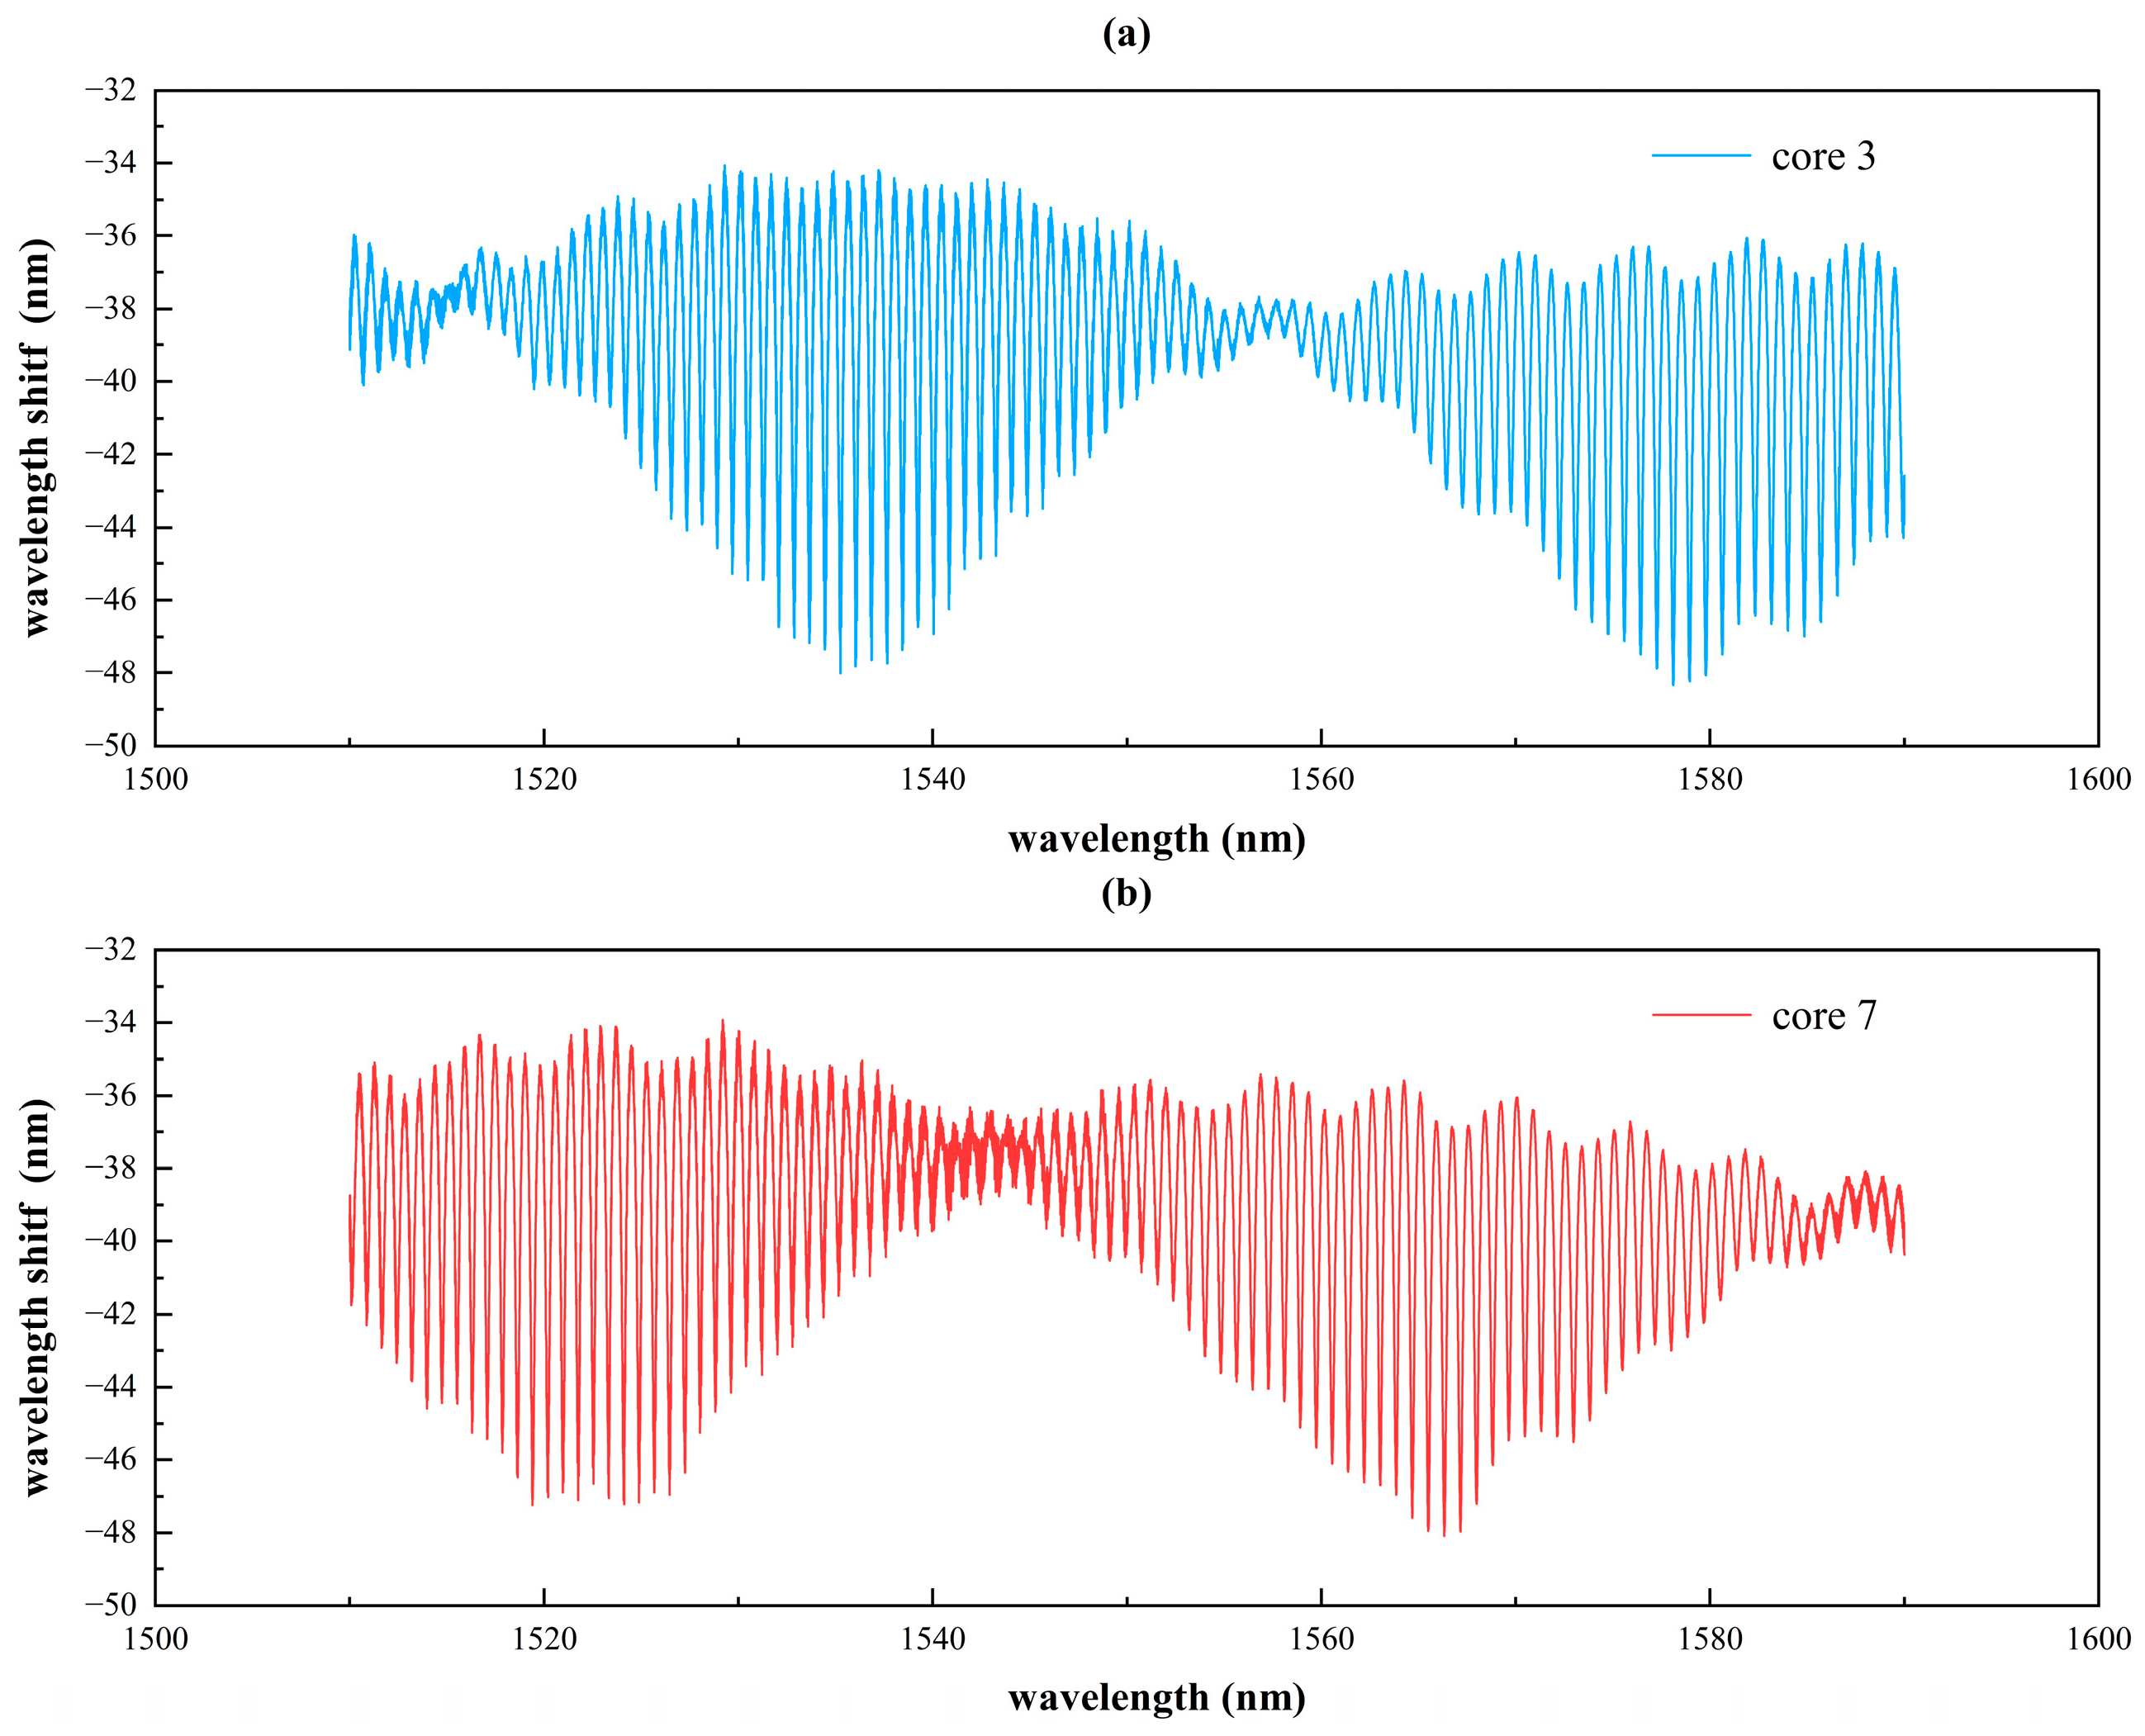
18]. In contrast, the right FPI serves as the sensing cavity, where external forces induce variations in cavity length and changes in refractive index, leading to measurable shifts in the reflection spectrum. Therefore, the cascaded reference and sensing cavities form a Vernier effect, producing a higher-resolution envelope spectrum, thus achieving a significant improvement in sensitivity. The reflection spectrum of the cascaded FPI based on the Vernier effect is shown in
Figure 4.
The schematic configuration of the inclinometer with cascaded FPIs inscribed in the SCF is shown in
Figure 5b. When subjected to tilting, the device deviates from its vertical axis, and the resulting offset angle can be decomposed into two components: inclination
and azimuth
. Inclination is defined as the angle between the tilt direction and the reference 0° tilt plane, while azimuth is defined as the angle between the tilt direction and the vertical reference axis, as illustrated in
Figure 5a,c.
To quantitatively describe the sensor response, it is necessary to establish the relationship between the wavelength shift and the two angular components and .
When an external force is applied to the experimental structure, the cavity length of the sensing FPI
changes, and the phase difference is an integer multiple (m) of the period. Accordingly, the wavelength of the sensing FPI
is:
Taking the first-order interference enhancement with m = 1, and assuming that the effective refractive index remains unchanged during the process and that the strain experienced by a single FPI
is
, the stress difference between two cores
is
. Performing a variation on both sides of Equation (4), and taking into account geometric and optical effects, the sensing FPI wavelength shift of any peripheral core
i is obtained as follows:
In the above, the refractive index of the core n is 1.468, the pitch d is defined as the distance between two adjacent cores, R is the tilt-induced bending radius.
Due to the application of the Vernier effect, the shift of the envelope wavelength has an amplification factor
M = 50. Considering the amplification factor
M introduced by the application of the Vernier effect, and multiplying
M directly into Equation (5), the sensing FPI wavelength shift of any peripheral core
i is obtained as follows:
When the fiber is tilted, one end of the free fiber (including the sensing FPI) moves away from the vertical direction, while the other end remains fixed. At this time, the tilt-induced bending radius
R consists of two parts, with the mass-induced
and the free-fiber-induced
calculated as follows:
In the above, the Young’s modulus of the fiber E is Pa, the second moment of the cross-sectional area I is , the weight of the mass m is kg, the gravitational acceleration g is , the distance between the FPI and the fixed point is m, the length of the free fiber L is m, and the fiber weight per unit length w is kg/m. Observing the theoretical equation, it is found that is determined solely by the parameter and is a constant value, while is determined by the inclination angle.
By substituting
and
into the theoretical Equation (6), the FPI wavelength shift of any two peripheral cores
i and
j can be obtained:
By combining theoretical Equations (9) and (10) and eliminating the common term
, the azimuth angle
can be obtained:
Observing the theoretical equation for azimuth angle , it can be seen that is only related to and .
By substituting the theoretical Equation (11) into Equation (6), the inclination angle
can be obtained:
Observing the theoretical equation for inclination angle , it can be seen that is related to and azimuth angle .
Therefore, under an arbitrary tilt condition, simultaneous measurement of both the azimuth and inclination angle can be achieved by detecting the wavelength shifts of the FPIs inscribed in two peripheral cores. This demonstrates that the proposed inclinometer is capable of resolving 2-D tilt angles with high accuracy [
19,
20].
3. Simulation of Inclinometer
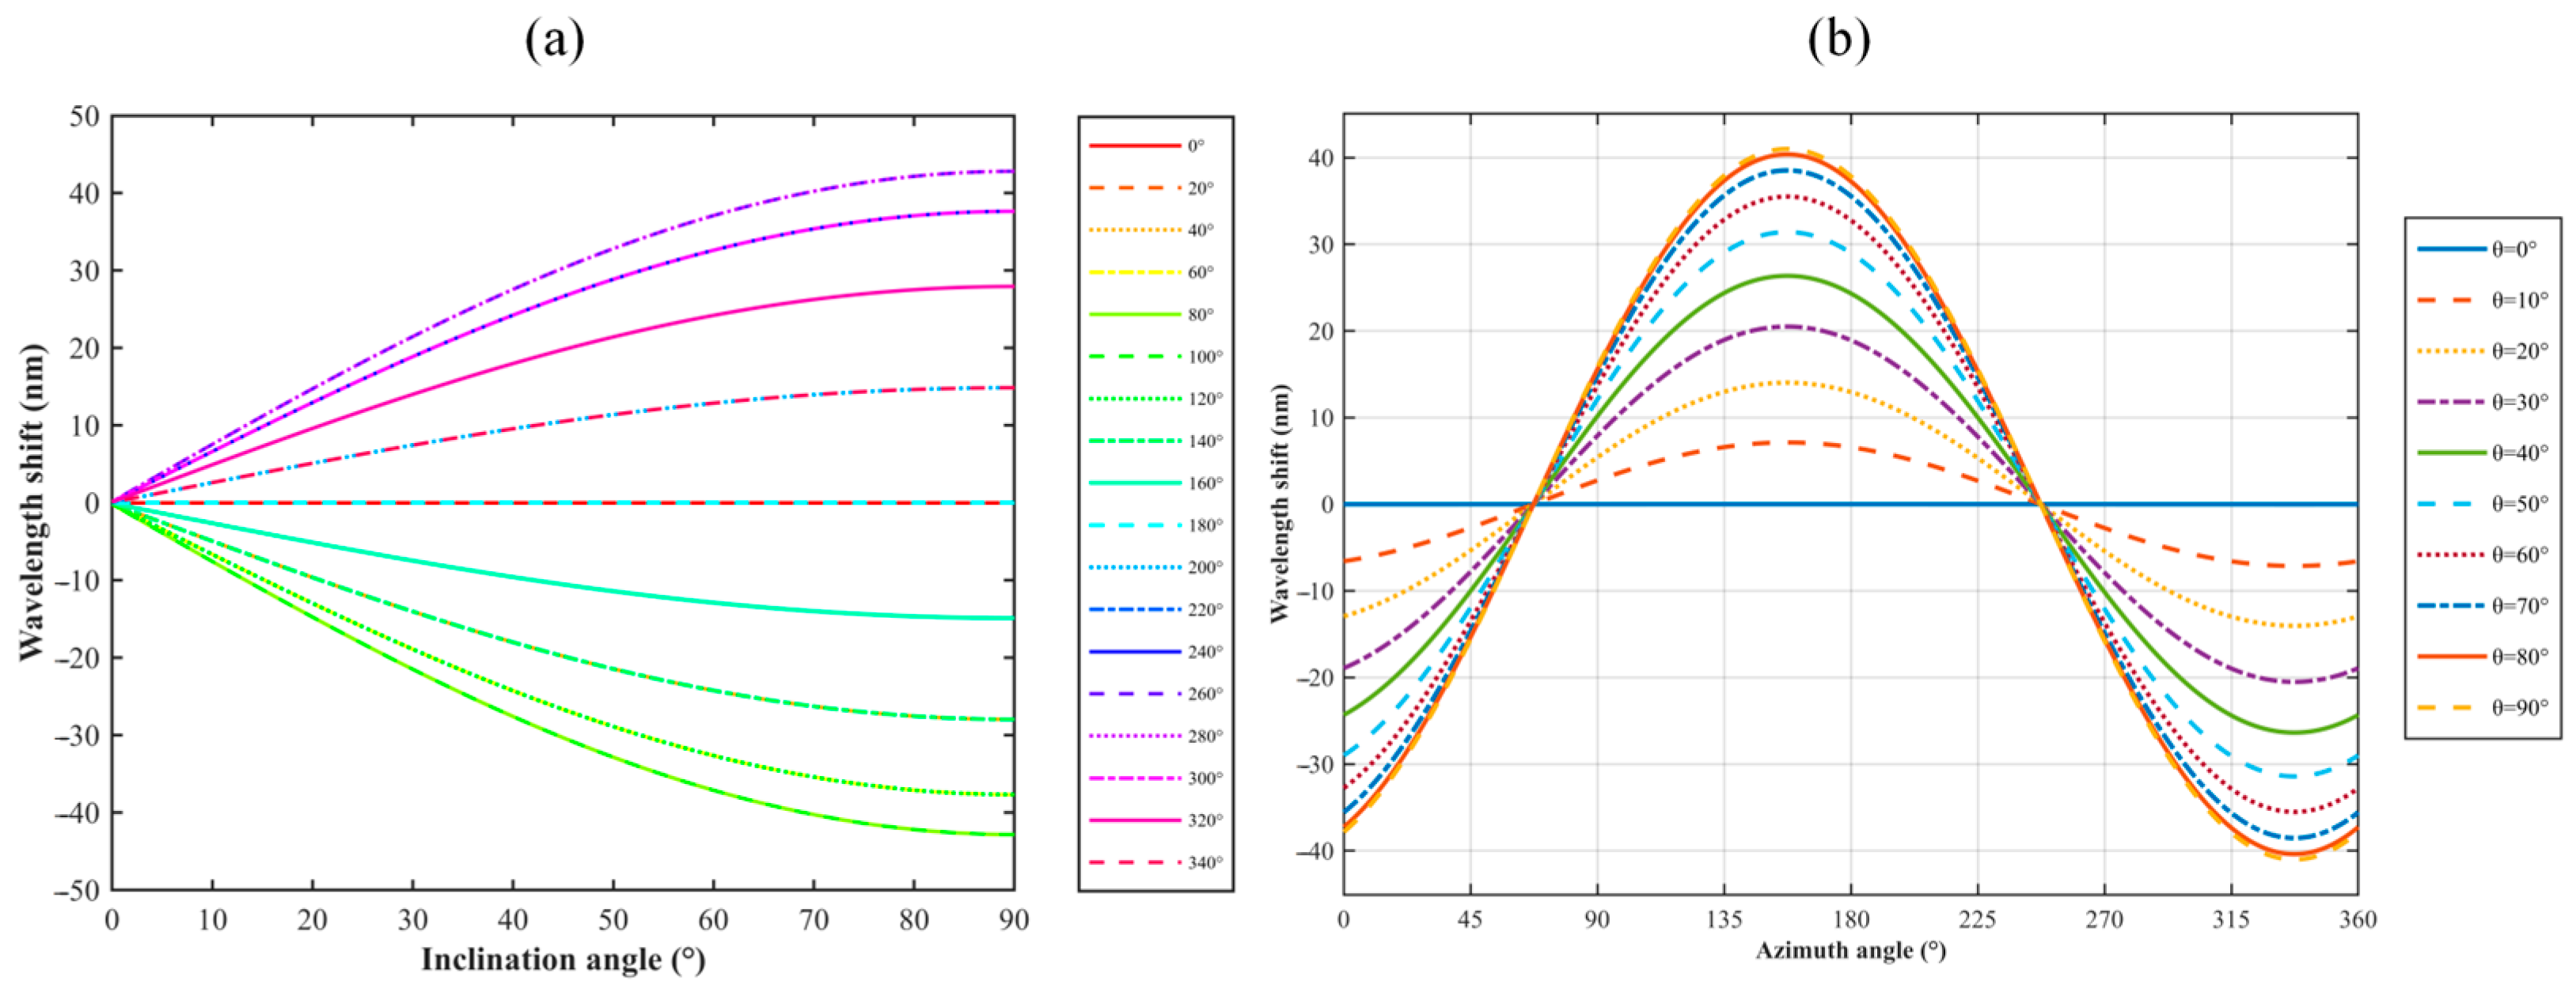
Numerical simulations were carried out in MATLAB (MATLAB R2023a) for the theoretical models described in Equation (9), and the results are presented in
Figure 6. Based on the model established from Equation (9), numerical simulations were performed in MATLAB.
Regarding subplot (a), first, by fixing the azimuth angle in Equation (13), simulations were conducted for the inclination angle and wavelength shift with a step size of 0.09° over the range of 0° to 90°. Subsequently, simulations were carried out for different azimuth angles with a step size of 20° over the range of 0° to 360°, examining the relationship between the inclination angle and wavelength shift under various azimuth conditions. Regarding subplot (b), first, by fixing the inclination angle in Equation (13), simulations were conducted for the azimuth angle and wavelength shift with a step size of 0.36° over the range of 0° to 360°. Subsequently, simulations were performed for different inclination angles with a step size of 10° over the range of 0° to 90°, examining the relationship between the azimuth angle and wavelength shift under various inclination conditions.
The following parameter values were used: the pitch d was 42 μm, the Young’s modulus of the fiber E was Pa, the second moment of the cross-sectional area I was , the weight of the mass m was kg, the gravitational acceleration g was , the distance between the FPI and the fixed point was m, the length of the free fiber L was m, the fiber weight per unit length w was kg/m, the refractive index of the core n was 1.468, the cavity length of the sensing FPI was 1000 μm, and the initial wavelength was 1552.77658 nm. In the experimental environment at that time, due to the change in the cavity length of the F-P cavity, the amplification factor M was actually 43.
By selecting specific inclination and azimuth values, the corresponding theoretical wavelength shift could be obtained directly from the simulation, thereby offering predictive guidance for subsequent experimental calibration and analysis.
4. Experimental Results and Discussion
The experimental setup is shown in
Figure 7. The inclinometer was fixed on the fiber- optic rotator, the multi-core fiber was connected to a fan-out device, and the SMF outputs of cores 3 and 7 were connected to the optical sensing interrogator (Luna, Si 255, Roanoke, VA, USA). Using the Enlight app, reflection spectra data corresponding to each core under various tilt conditions were recorded and processed on a computer.
In this experiment, the fiber length was set to
L = 56 mm, the distance between the FPI and the fixed point was
= 3 mm, and the attached mass was
m = 0.110 g. Tilt measurements were performed by varying inclination and azimuth angles systematically. The azimuth angle was swept from 0° to 360° in steps of 20°, while the inclination angle was varied from −90° to 90° in steps of 10°. The relationships between the wavelength shift
and the inclination angles
and azimuth angles
were obtained as shown in
Figure 8.
The observed curves reveal that the experimental dependence of
on
and
is consistent with the simulation results in
Figure 6, confirming strong agreement between theoretical predictions and experimental measurements. Curve fitting yielded a maximum sensitivity of −0.5272 nm/° for azimuth measurements, with a fitting range of 0°~360°, and the correlation coefficient
was 0.987; for inclination measurements, the maximum sensitivity was −0.5557 nm/°, with a fitting range of −90°~ 90° and an
value of 0.975.
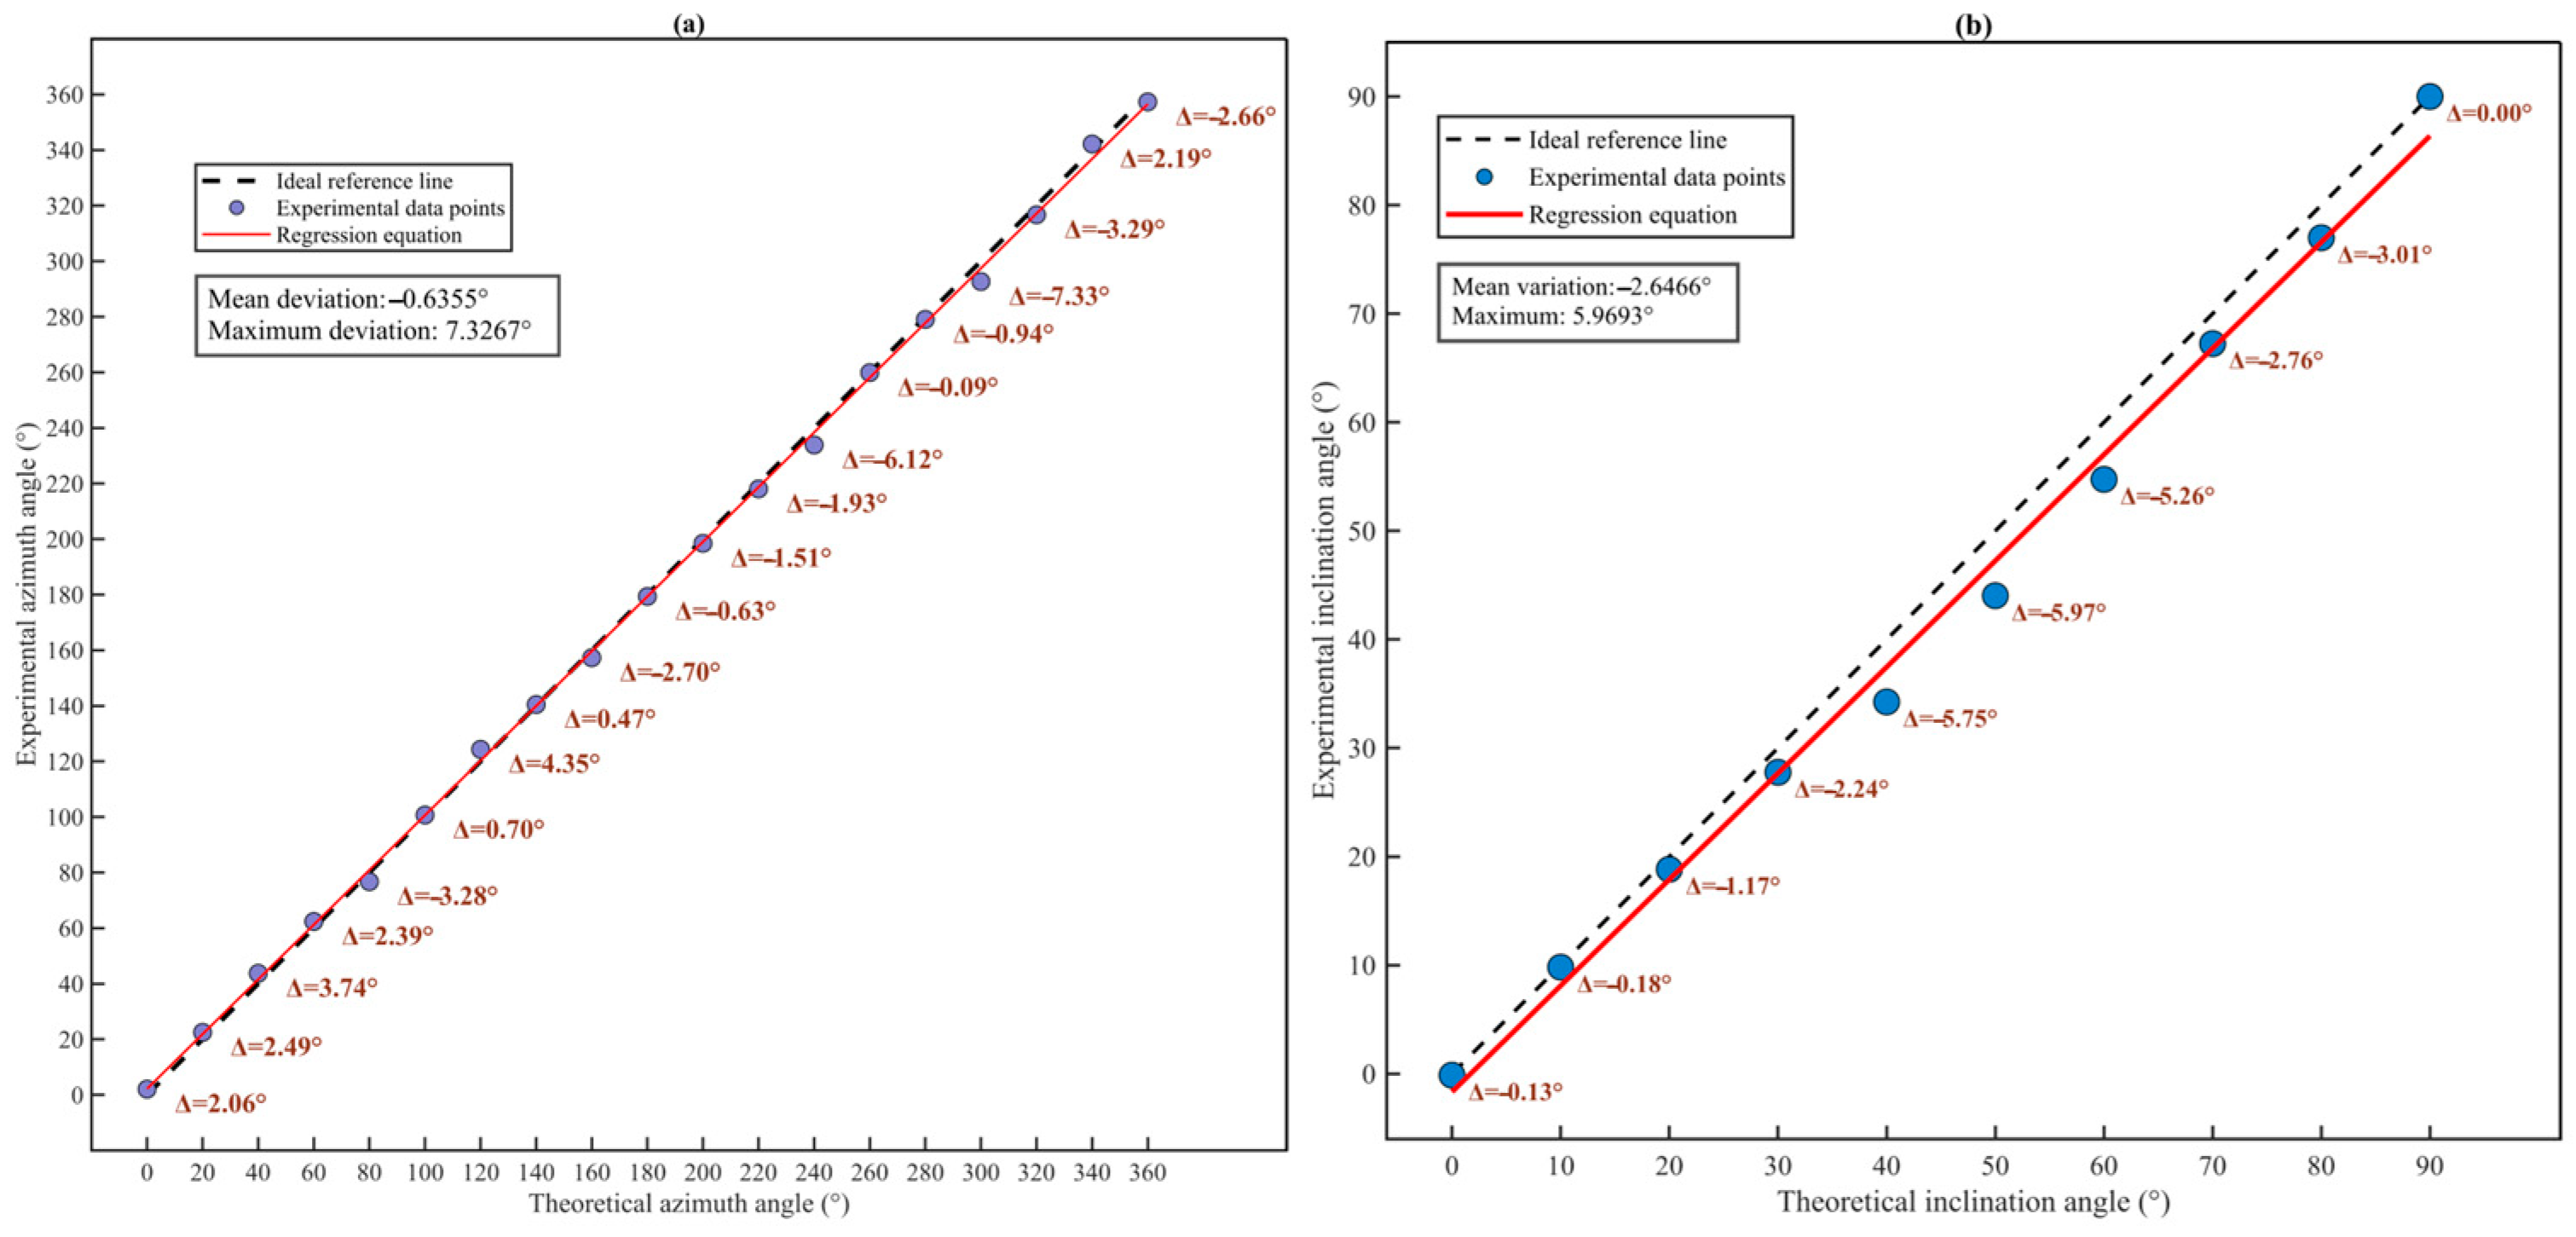
By substituting the experimentally obtained wavelength shift into the theoretical models of Equations (11) and (12), the corresponding theoretical azimuth and inclination angles were calculated. Therefore, using the wavelength shift as an intermediary variable, the experimental angles were compared with their theoretical counterparts, as shown in
Figure 9.
Although the comparison curves generally followed the expected trends, they did not perfectly align with the ideal
y =
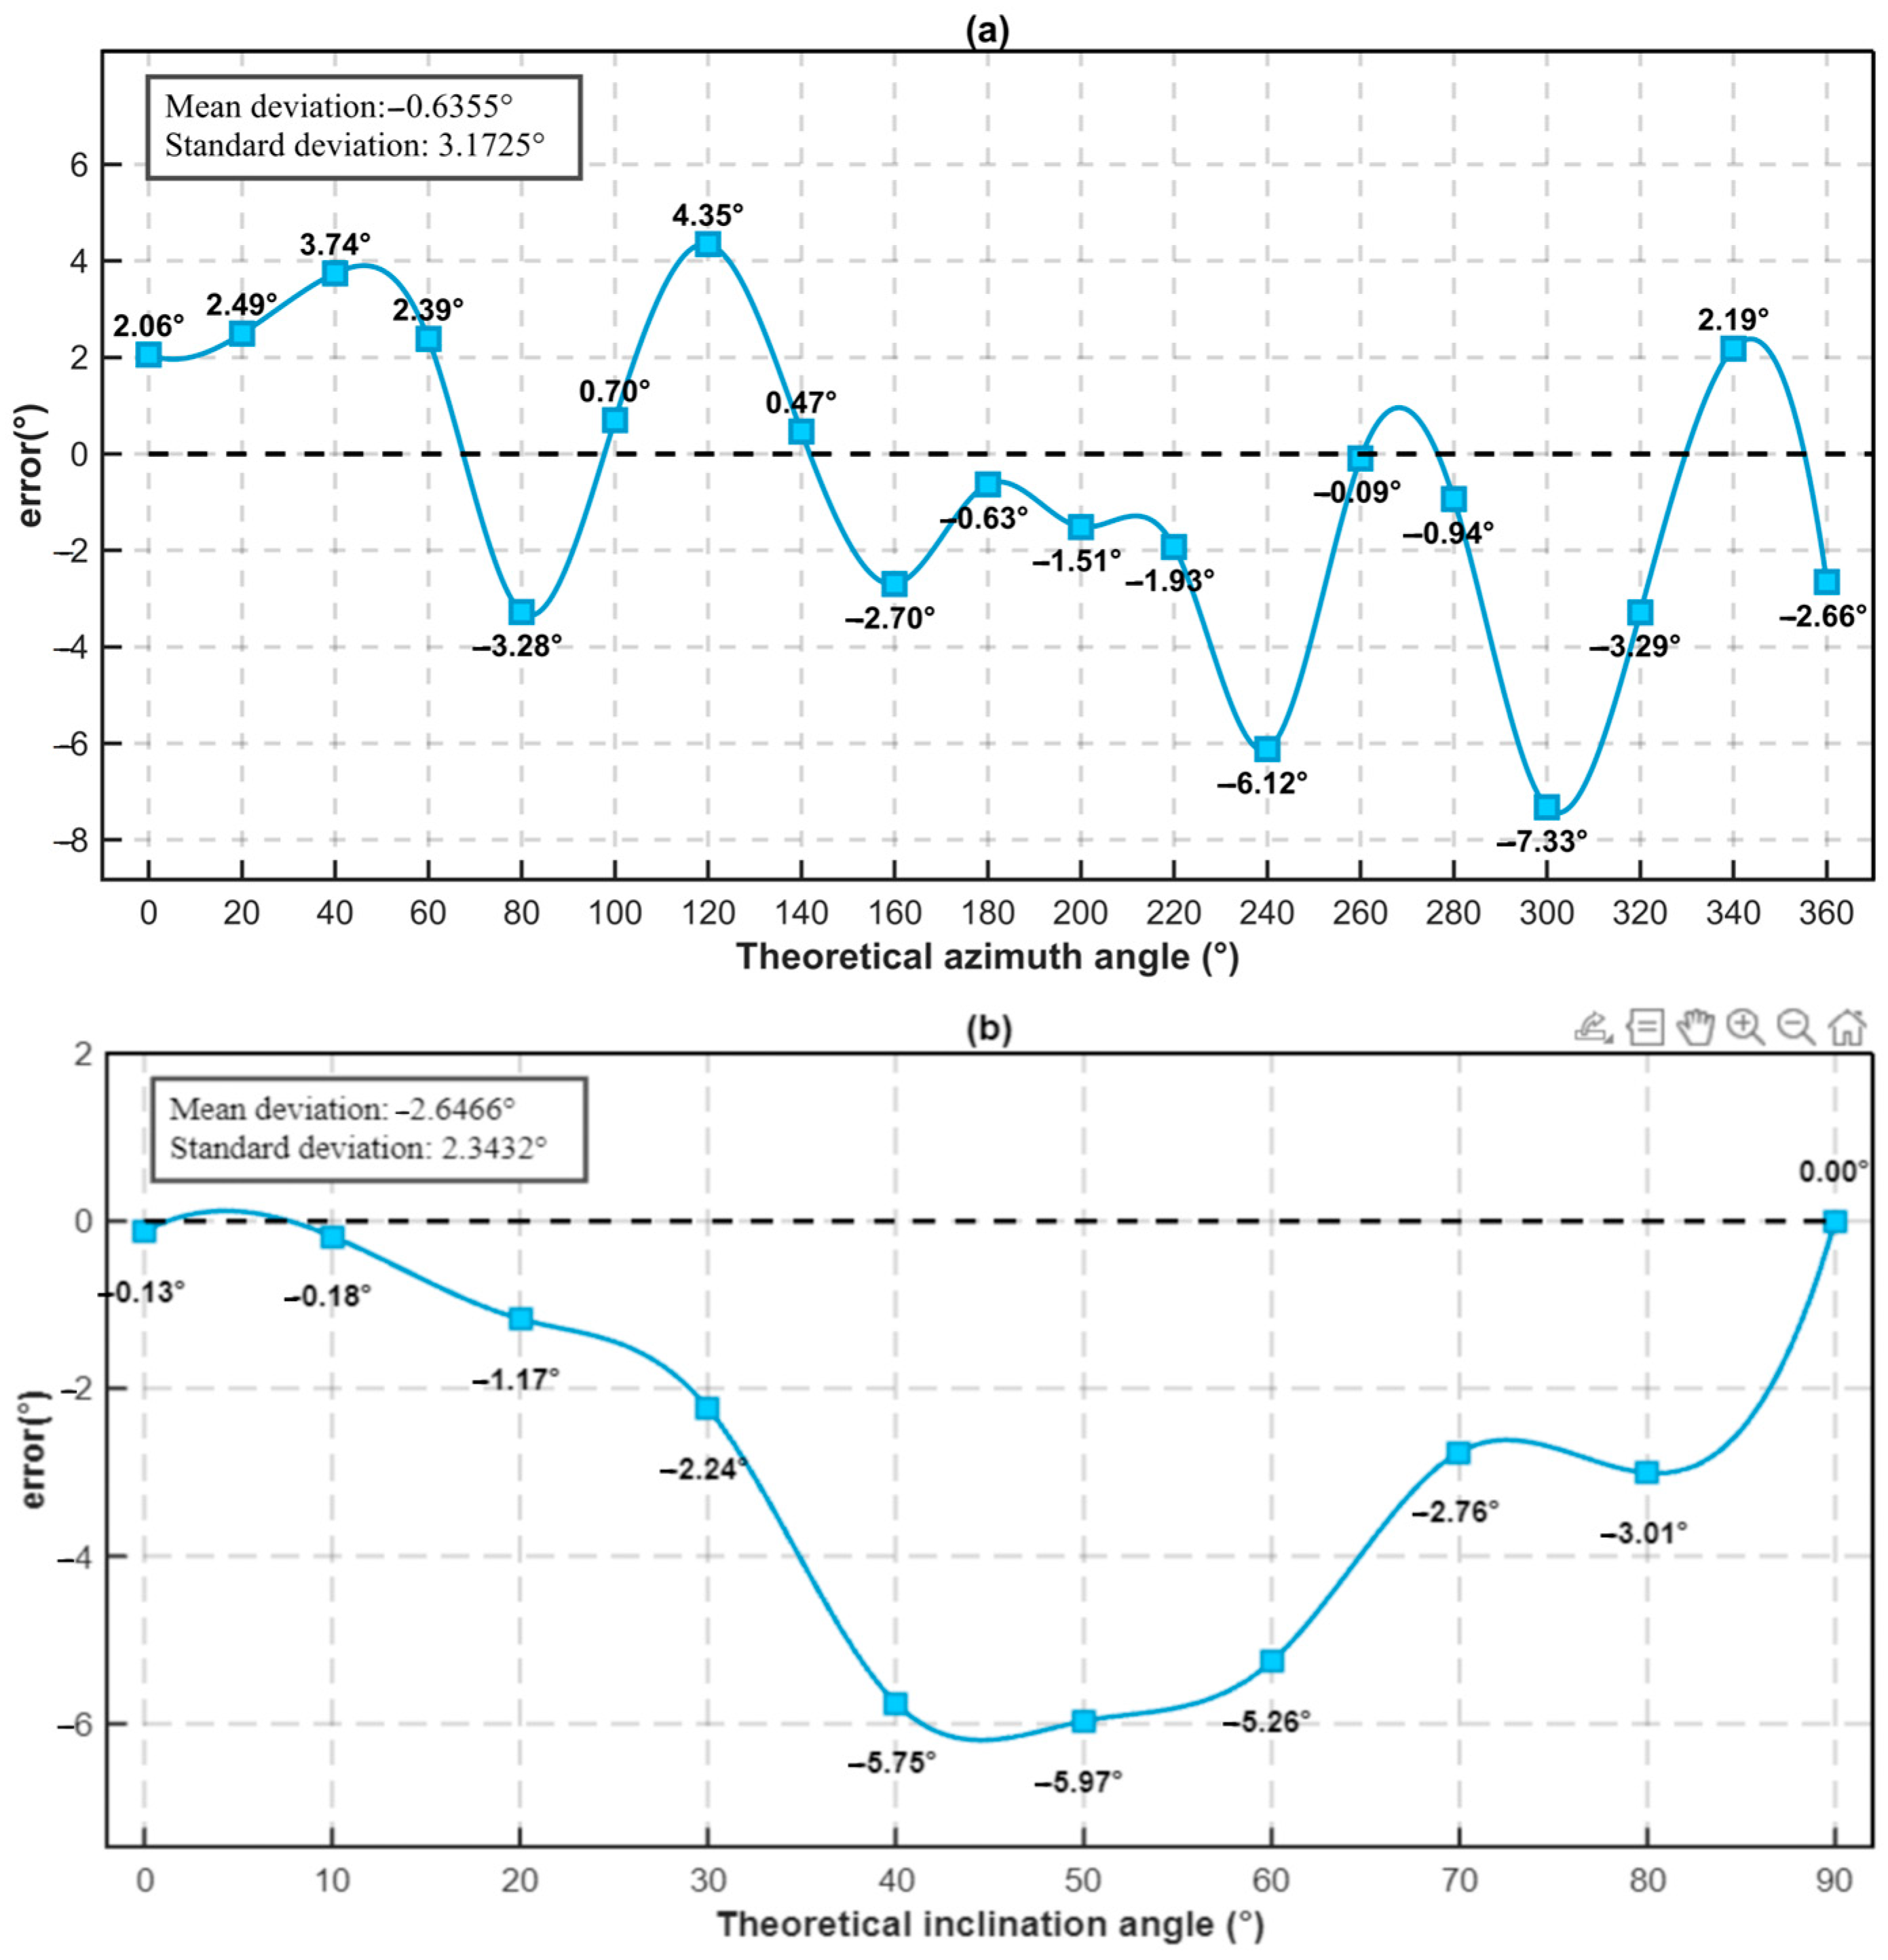
x line, suggesting the presence of systematic errors in angle determination. To further analyze these deviations, the differences between theoretical and experimental values were computed and plotted as wavelength shift errors, as shown in
Figure 10.
The error analysis shows that the azimuth maximum measurement error is 7.33° and the inclination maximum measurement error is 5.97°.
