Review

Recent Advancements in Optical Fiber Sensors for Non-Invasive Arterial Pulse Waveform Monitoring Applications: A Review

by
Jing Wen Chew
1,2,
Soon Xin Gan
2,*,
Jingxian Cui
2,
Wen Di Chan
1,
Sai T. Chu
1 and
Hwa-Yaw Tam
2,3
1
Department of Physics, City University of Hong Kong, Tat Chee Avenue, Kowloon, Hong Kong SAR, China
2
Photonics Research Institute, Department of Electrical and Electronic Engineering, The Hong Kong Polytechnic University, Hung Hom, Kowloon, Hong Kong SAR, China
3
School of Chinese Medicine, Hong Kong Baptist University, Hong Kong SAR, China
*
Author to whom correspondence should be addressed.
Photonics 2025, 12(7), 662; https://doi.org/10.3390/photonics12070662
Submission received: 4 June 2025 / Revised: 25 June 2025 / Accepted: 27 June 2025 / Published: 30 June 2025
(This article belongs to the Special Issue Novel Advances in Optical Fiber Gratings)

Abstract

The awareness of the importance of monitoring human vital signs has increased recently due to the outbreak of the COVID-19 pandemic. Non-invasive heart rate monitoring devices, in particular, have become some of the most popular tools for health monitoring. However, heart rate data alone are not enough to reflect the health of one’s cardiovascular function or arterial health. This growing interest has spurred research into developing high-fidelity non-invasive pulse waveform sensors. These sensors can provide valuable information such as data on blood pressure, arterial stiffness, and vascular aging from the pulse waveform. Among these sensors, optical fiber sensors (OFSs) stand out due to their remarkable properties, including resistance to electromagnetic interference, capability in monitoring multiple vital signals simultaneously, and biocompatibility. This paper reviews the latest advancements in using OFSs to measure human vital signs, with a focus on pulse waveform analysis. The various working mechanisms of OFSs and their performances in measuring the pulse waveform are discussed. In addition, we also address the challenges faced by OFSs in pulse waveform monitoring and explore the opportunities for future development. This technology shows great potential for both clinical and personal non-invasive pulse waveform monitoring applications.

1. Introduction

Since the COVID-19 pandemic outbreak in late 2019, people have become more attentive to their physical conditions, particularly their heart rate, respiration rate, blood oxygen level, and blood pressure (BP). These quantifiable physical conditions are known as physiological signals or vital signs. Recently, non-invasive sensors have emerged as affordable devices that enable users to monitor their physiological signals in real time, anytime and anywhere. The increasing demand for these sensors reflects a growing awareness of the importance of tracking vital signs. Continuous monitoring of these signs is crucial for the timely detection of health abnormalities and the early symptoms of certain diseases, allowing for appropriate measures and treatments to be promptly implemented. Hypertension, commonly known as high BP, is one such serious condition that demands attention. Responsible for over 10 million deaths annually, hypertension remains a silent yet lethal global health threat [1,2]. It poses economic burdens through direct medical costs and reduced productivity in those whom it affects. Studies estimate that investing in hypertension treatment programs could yield an 18-fold return on investment [1]. This highlights the importance of the prevention and early treatment of cardiovascular diseases.
Today’s common commercial non-invasive sensors primarily use electrocardiography (ECG) and photoplethysmography (PPG) techniques [3]. ECG measures the electrical impulses generated by heart contractions, whereas PPG measures the variation of reflected light from the blood vessels due to the change in blood volume during heartbeats. Although these methods are effective in obtaining heart rates, they cannot fully capture detailed data on a pulse waveform’s behavior as it travels through blood vessels. Pulse waveform analysis (PWA) plays a vital role in enhancing the accuracy of BP estimation [4,5,6,7], which can be evaluated from the pulse transit time (PTT) between two arterial vessels [4,5,8,9]. This underscores the need for high-fidelity pulse waveform data to ensure accurate BP assessment. Beyond BP, studies in western medicine highlight the pulse waveform’s broader diagnostic potential, revealing insights into vascular aging, arterial stiffness [10,11], and early indicators of conditions such as pancreatitis, appendicitis, and duodenal ulcers [12,13]. These findings reveal that arterial pulse waveforms contain a wealth of information related to organ health. Notably, pulse diagnosis has been a cornerstone of traditional Chinese medicine (TCM) for thousands of years [14] and was recognized by the World Health Organization in 2022 [15]. TCM practitioners assess 28 pulse conditions through palpation, each linked to specific organ systems [15,16,17]. This further strengthens the critical role of PWA in monitoring pulse waveforms, rather than relying solely on heart rate, to unlock comprehensive health insights. It also highlights the importance of sensors that can deliver high-fidelity PWA measurements.
In recent years, non-invasive sensors designed to capture pulse waveforms have gained significant popularity, aiming for long-term, continuous pulse waveform monitoring without compromising the comfort of users. The current trend in the development of these sensors is to make them flexible, wearable, and highly sensitive. At present, flexible wearable sensors with six different working principles are commonly studied. These include piezoresistive sensors [18,19], capacitive sensors [20,21,22], piezoelectric sensors [23,24,25], triboelectric sensors [26,27], magnetoelastic sensors [28], and optical fiber sensors [29,30,31]. Table 1 summarizes the working principles, advantages, and limitations of these sensors. In general, these sensors can be separated into two categories: Category 1 sensors detect variations in electrical properties such as resistance, capacitance, and charge, while Category 2 sensors rely on changes in optical properties, including the light intensity or wavelength caused by pressure shifts ( Δ P ). OFSs are the sole representatives of Category 2, with the other examples falling into Category 1. Sensors in Category 1, particularly capacitive and triboelectric sensors, often exhibit advantages such as rapid response times and high sensitivity, which enable more precise pulse waveform measurements. However, to achieve the desired electrical properties and sensitivity, these sensors often need to be specially engineered with microstructures on their sensing surfaces [18,19,20,23,26,32], which increases the complexity and time required for their fabrication. Additionally, they are vulnerable to electromagnetic interference and non-electrical safety issues, which can compromise data accuracy and limit their deployment in environments such as magnetic resonance imaging examination rooms or industrial settings. In contrast, OFSs inherently overcome these issues owing to their dielectric nature. Examples of OFS uses in a magnetic field environment can be found in [33,34,35]. Furthermore, the sensing element of OFSs does not require a complex fabrication process to obtain a pulse waveform with a high signal-to-noise ratio (SNR). Despite its bulky detection system, OFS allows for high-fidelity, long-term detection of pulse waveforms. These features make OFSs an attractive area of research for further exploration as pulse sensors, focusing on sensing sensitivity, miniaturization, and reducing the demodulation cost of long-term health monitoring [36,37].
In addition to the aforementioned advantages, OFS allows small, non-invasive, real-time, and multi-point monitoring. With diameters ranging from a few to hundreds of micrometers, optical fibers provide relatively high spatial resolutions for detecting minute changes in a human’s arteries. Their flexibility depends on the type of materials used in the fabrication, such as silica [38,39,40] and polymer [41,42], which are chosen based on the specific applications. Additionally, the integration of OFSs in flexible substrates overcomes the traditional trade-off in wearability, characterized by brittleness under transverse force and a lack of comfort [43,44]. Their development in vital sign monitoring, sport training, and clinical monitoring has advanced significantly in the early part of this decade. This paper focuses on the recent developments in OFSs for arterial pulse waveform sensing over the last decade. First, the importance of obtaining pulse waveforms using non-invasive sensors in health monitoring is emphasized, and the advantages of OFSs as health monitoring sensors are introduced as compared to Category 1 (Section 1). Next, the working principles of different types of OFSs are presented (Section 2). Then, the background of PWA in both modern medicine and TCM is introduced in Section 3. Following this, the applications and sensing performances of OFSs, based on their types, in measuring pulse waveforms are reviewed and summarized (Section 4). Finally, the challenges and opportunities of using OFSs in arterial pulse waveform monitoring are discussed (Section 5).

2. Working Principles of OFSs

In general, OFSs rely on changes in detecting optical parameters after interacting with physical objects. These parameters include the wavelength, intensity, and phase of the optical signals. Photodetectors or demodulators measure these changes in optical signals. For health monitoring, most OFSs rely on wavelength and intensity demodulation. When placed perpendicular to blood vessels on the skin surface, these sensors can detect vessel expansion and contraction with changes in the wavelength or intensity—depending on the sensor type—to capture the arterial pulse waveform. PWA enables the evaluation of blood pressure, which is discussed in Section 3. The working principles of OFSs based on their structures are discussed in the following sections.

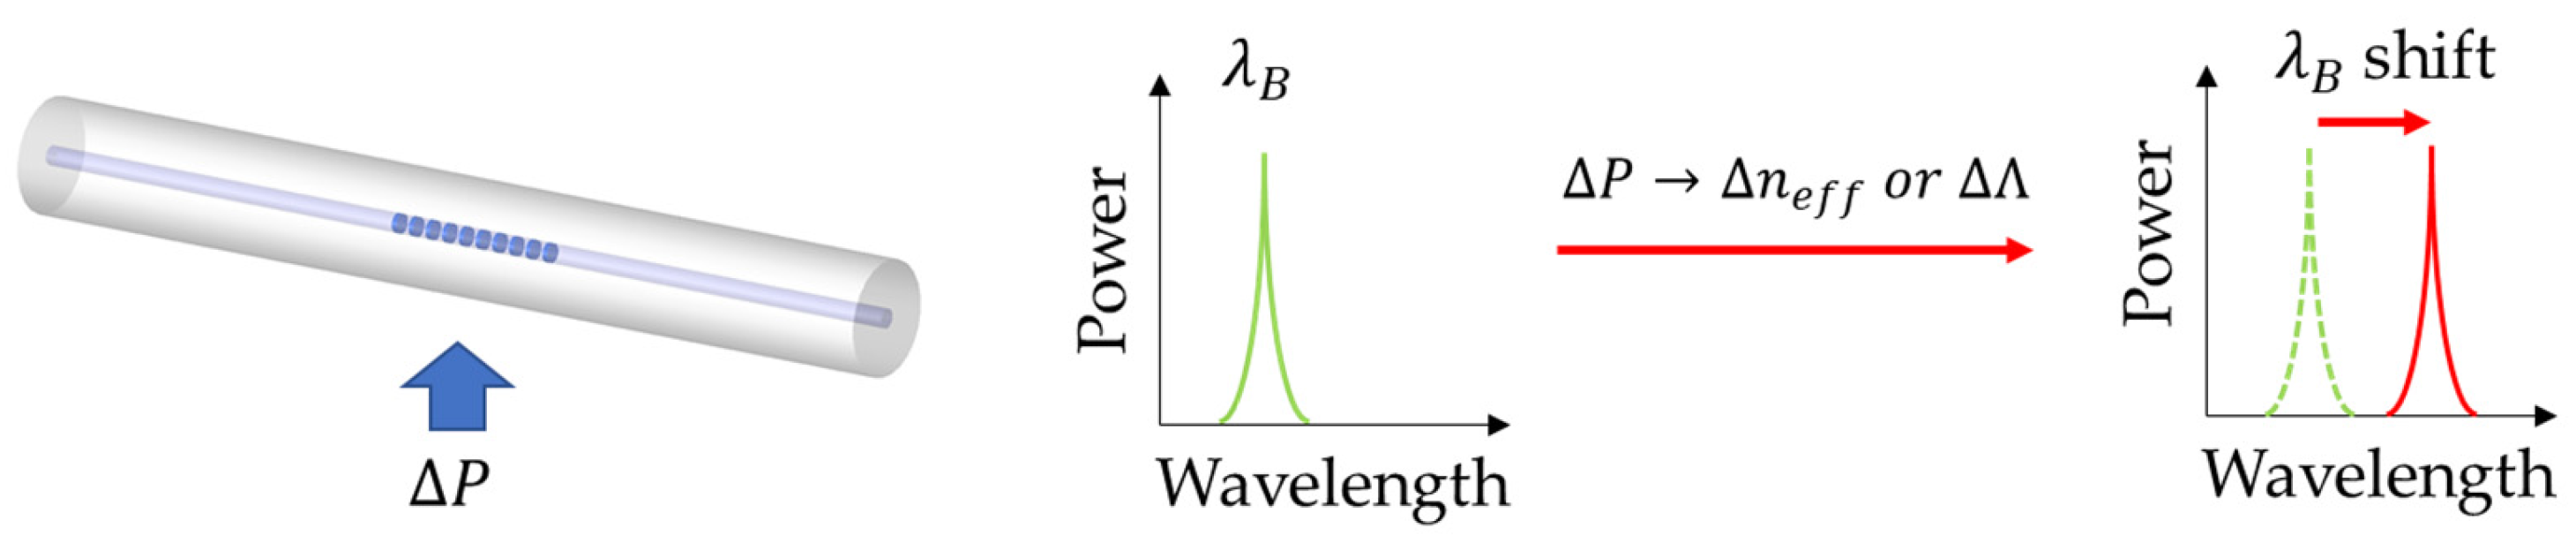
2.1. Fiber Bragg Grating Sensors

Fiber Bragg grating (FBG) sensors are some of the most well-known and widely used OFSs in fiber–optic technology. FBGs are created by introducing a periodic variation of the refractive index in the core of an optical fiber, as shown in Figure 1. When a broadband light source propagates through the FBG sensor, a narrow optical spectrum with a specific wavelength, namely the Bragg wavelength ( λ B ), is reflected, and the remaining wavelength continues to propagate in the forward direction. The λ B is expressed by Equation (1) as
λ B = 2 n e f f Λ ,
where n e f f is the effective refractive index of the core of the fiber and Λ is the period of the grating [45]. The n e f f and Λ change with the surrounding temperature and axial strain, which in turn change the value of λ B . This relationship enables the detection of the arterial pulse on the human skin by converting subtle mechanical changes into measurable wavelength variations. In other words, the pulse waves are measured based on the reflected signals’ wavelengths rather than their optical power. With different designs of the grating periods and cladding structures, variants of FBGs such as etched FBGs [46], chirped FBGs [47], and long-period grating (LPG) [48] have been developed and applied for arterial pulse waveform measurement. Furthermore, FBGs can be inscribed in polymer optical fiber (POF) [42,49,50,51], increasing the number of choices of fiber type that can be used. Polymer FBGs have advantages in terms of their mechanical properties, as the change in axial strain is larger for softer polymer FBGs, making them more sensitive than traditional silica-based FBGs. Both silica and polymer FBGs are well-suited for developing long-term or disposable biosensors owing to their robustness and simple structure.

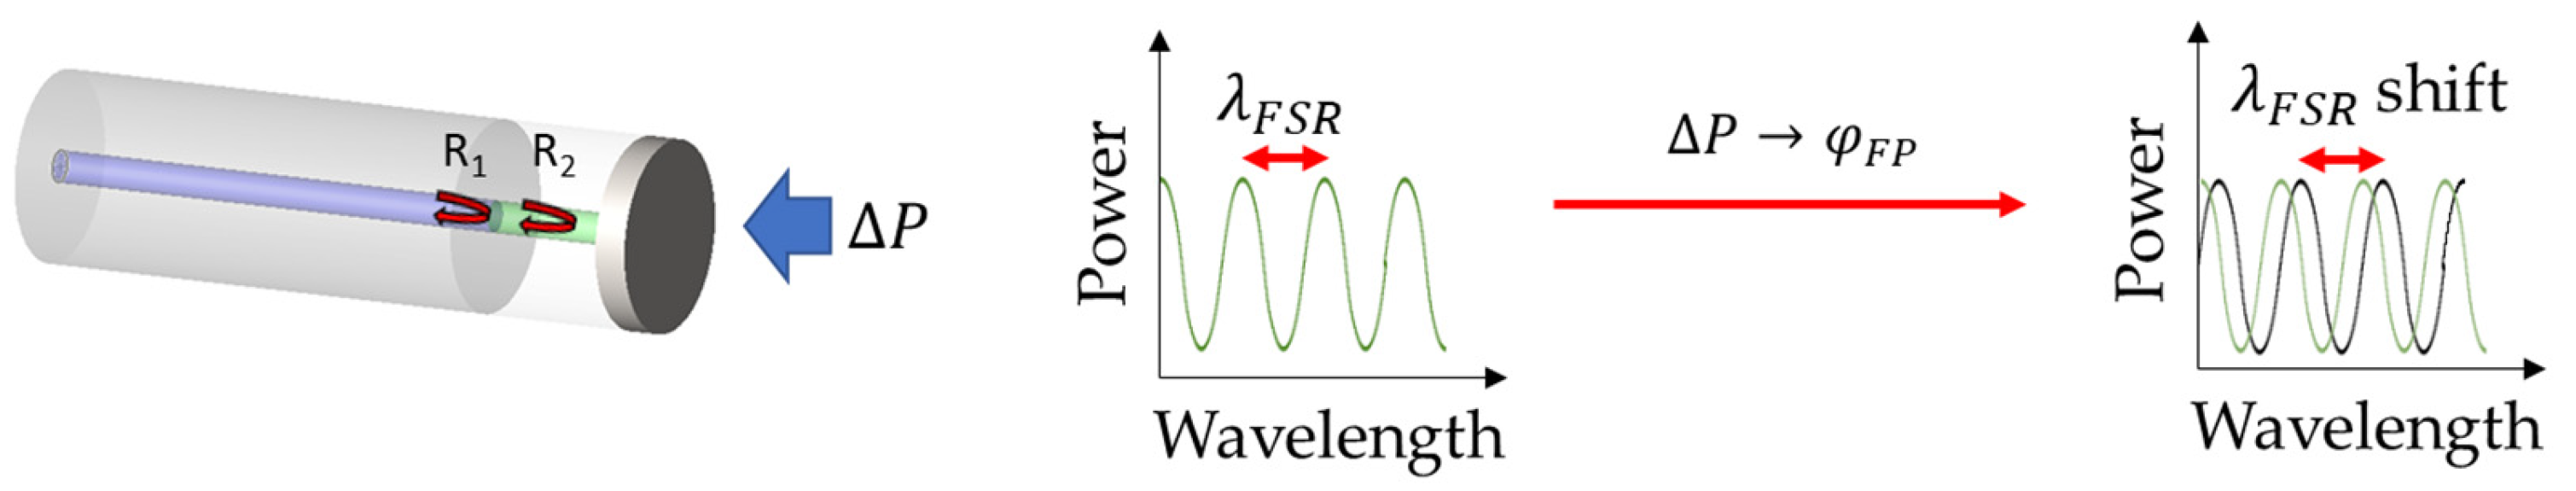
2.2. Fabry–Pérot Interferometer Fiber Sensors

Fabry–Pérot Interferometer (FPI) fiber sensors usually consist of a single mode fiber (SMF), a cavity, and two reflective surfaces or diaphragms, as illustrated in Figure 2. This structure allows the creation of a compact sensing probe for measurement. Light propagates through the cavity from the fiber and is eventually reflected from the reflective surface and diaphragm to form interference patterns. The phase difference between the beams in the cavity, φ F P , can be expressed as Equation (2),
φ F P = 4 π λ n l ,
where λ is the wavelength of the transmitted light, n is the refractive index of the cavity, and l is the length of the cavity [52]. The free spectral range (FSR) or the central wavelength of the FPI fiber sensor is expressed by the n and l of the cavity. The sensitivity of the sensor depends on the mechanical properties (or deflection) of the reflecting diaphragm. Common choices for the diaphragm have high flexibility and reflectivity, such as graphene sheets [53], polymers [52], or composite materials [31]. Ma et al. [54] established a relationship between the cavity length l and the pressure P caused by the pulse as follows:
l = 3 ( 1 ν 2 ) D 4 256 E t 3 P ,
where ν , E , D , and t are the Poisson’s ratio, Young’s modulus, diameter, and thickness of the diaphragm, respectively. This probe-based sensor is suitable for both clinical and personal health monitoring.

2.3. Cascaded Optical Fiber Sensors

Cascaded optical fiber (COF) sensors, also known as hetero-core fiber sensors, are sensors that consist of different types of fibers spliced together. A typical structure of COF includes a multimode fiber (MMF) spliced between two SMFs, as shown in Figure 3. This configuration creates a mismatch in mode field diameter, exciting higher-order modes of light that propagate along the MMF core, resulting in multimode interference or Mach–Zehnder interference in the transmission spectrum. Some researchers suggest replacing the MMF with a no-core fiber or capillary optical fiber to enhance sensitivity, making the system act like an FPI fiber sensor. These examples are discussed in Section 4. Consider two-beam interference with the total intensity, I t o t a l , expressed in Equation (4) [55]:
I t o t a l = I 1 + I 2 + 2 I 1 I 2 cos φ ,
where I 1 and I 2 are the intensity of the two beams and φ is the phase difference of the beams in the sensing region, depending on the propagation length ( l F ) and the effective refractive index ( n e f f ), as shown in Equation (5):
φ = 2 π l F λ n e f f ,
The total intensity, I t o t a l , responds to variations in the l F of the fiber due to the external factors, such as arterial pulsing. One can detect either the shift in the dip wavelength ( λ d i p ) or the change in the output power ( P o u t ) at a specific wavelength, as shown in Figure 3. By carefully designing the fiber structure (related to n e f f and l ) and material (related to l ) of the fibers, the sensitivity of the COF sensor can be optimized. Its simple fabrication structure makes it a cost-effective tool for arterial pulse sensing applications.

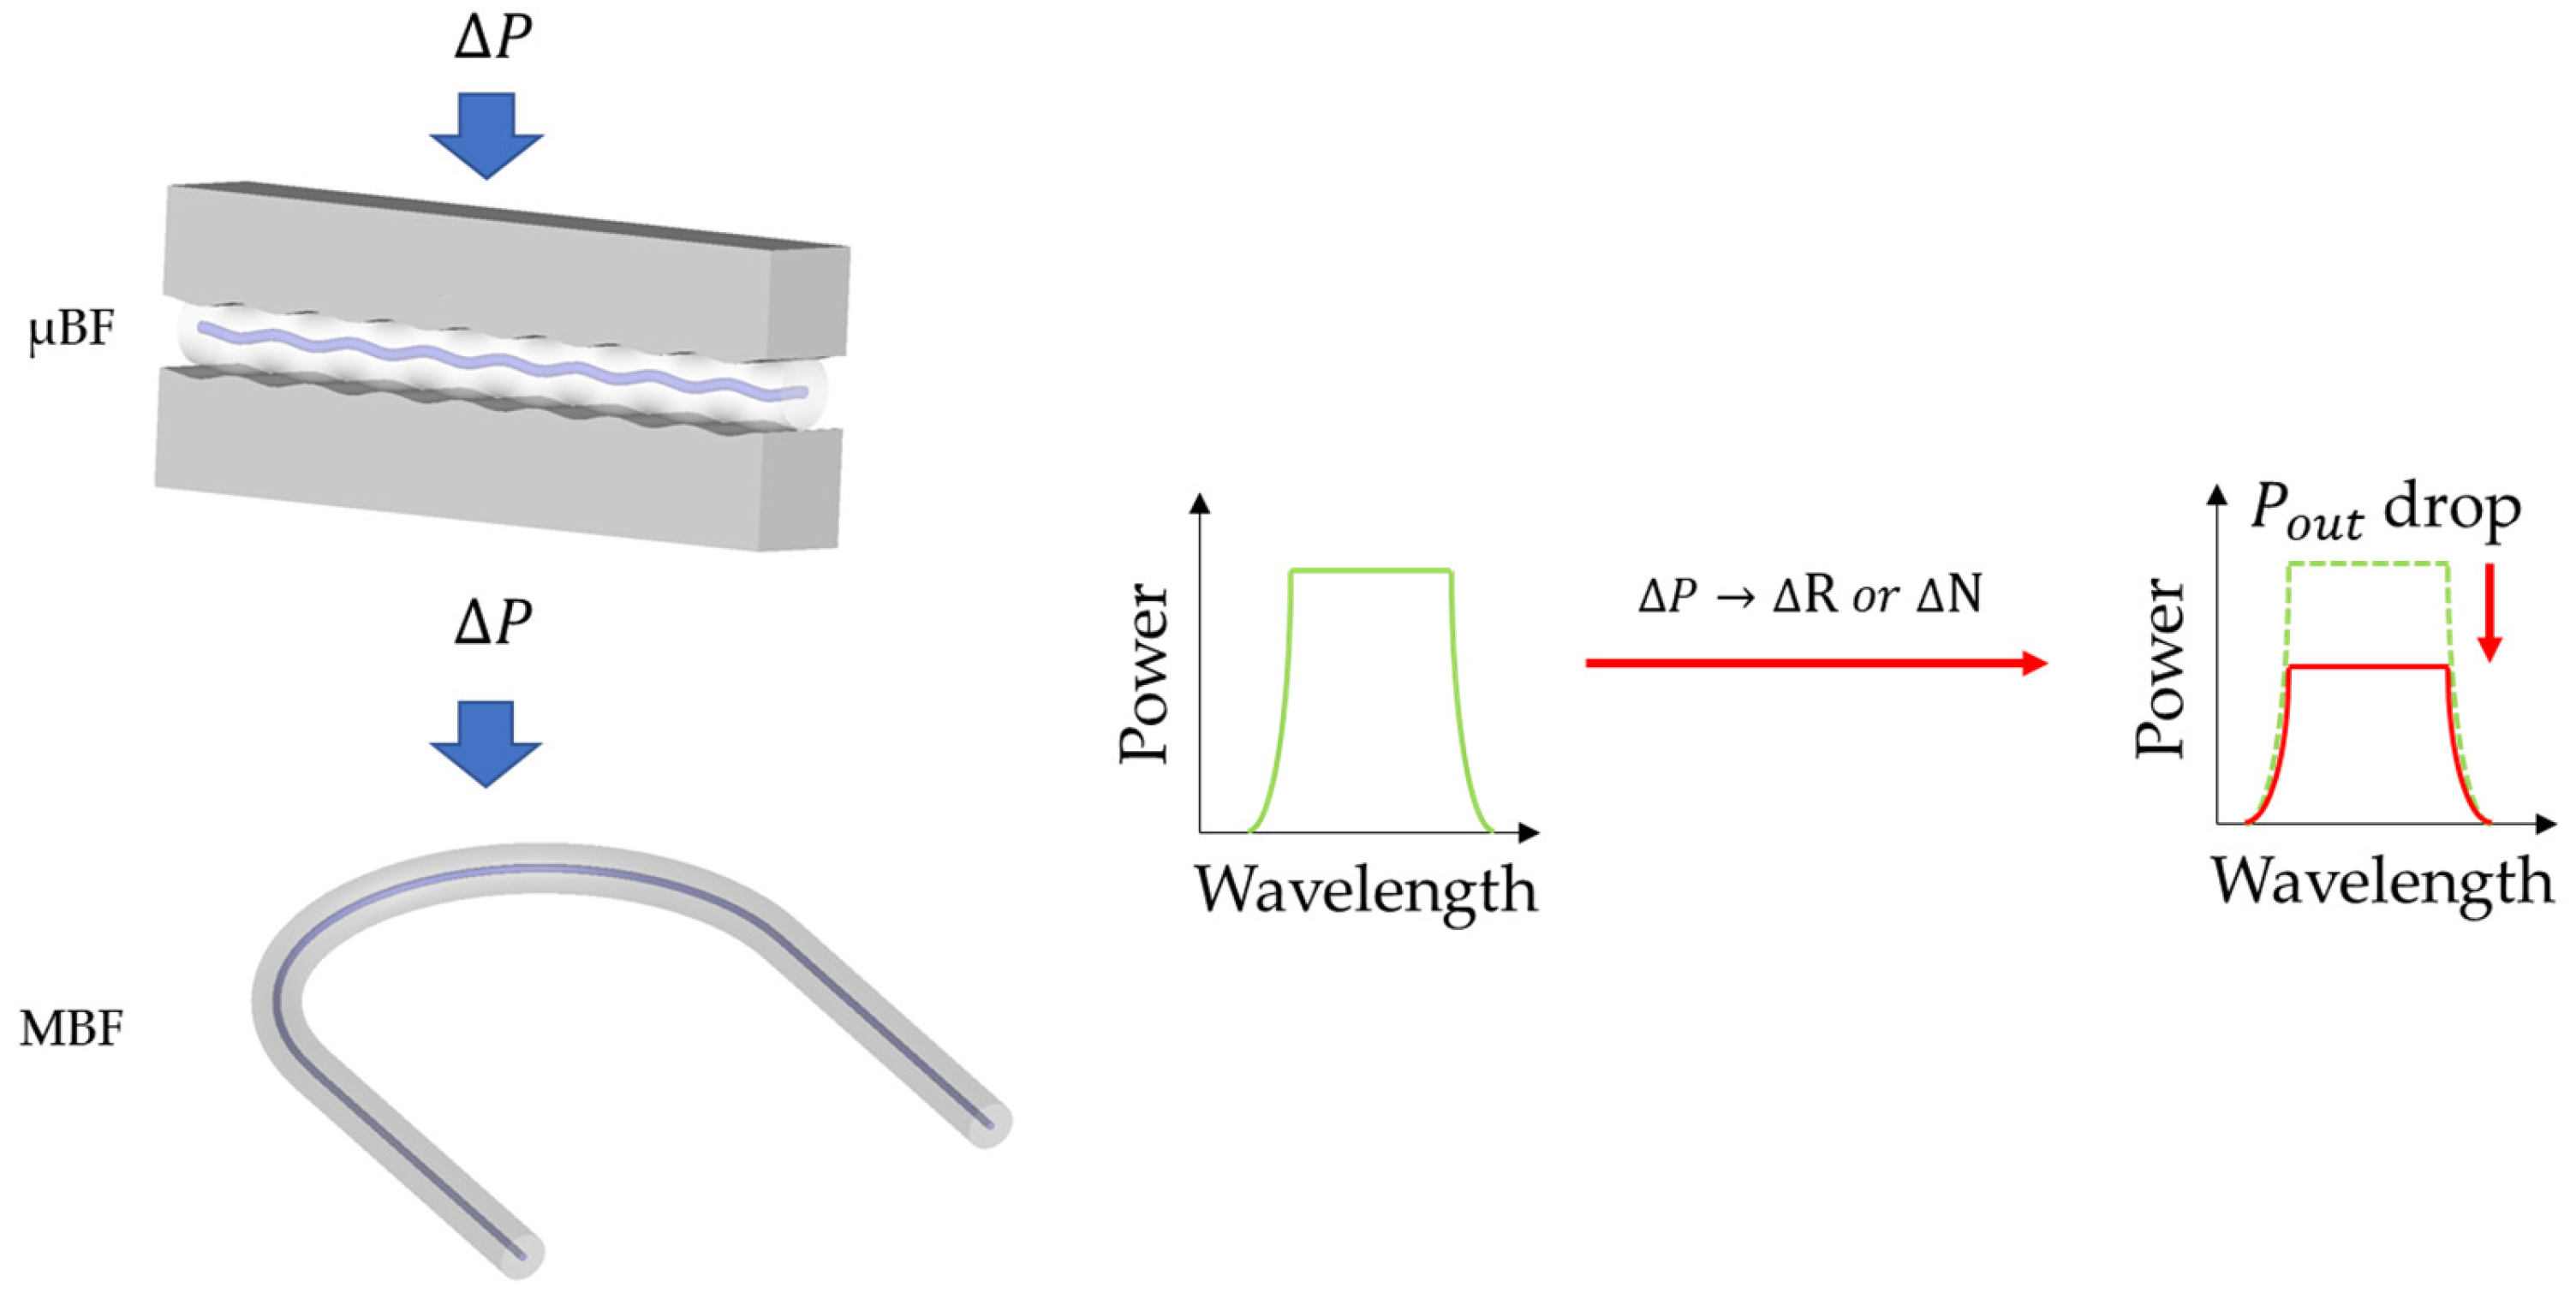
2.4. Macro-/Micro-Bend Fiber Sensors

Bent fiber sensors have the simplest structures among the OFSs discussed in this section. They can be categorized into macro-bending (MBF) and micro-bending (µBF) fiber sensors. Following the convention from Corning Inc. [56], a µBF has high-frequency physical perturbations at a certain section of the optical fiber, with its bending radius ( R ) being less than 1 mm (e.g., an optical fiber in a wavy form [57]). On the other hand, the R of an MBF is larger than 1 mm (e.g., a sawtooth- [58], U-, or loop-shaped optical fiber [30]). Figure 4 shows the examples of the µBF (wavy form) and MBF sensors (U-shaped). The bending region is very sensitive to external physical deformations, as it alters the total internal reflection in the core of the fiber. This results in some light in the core of the bent fiber being lost to the cladding, resulting in output power attenuation. The output power P o u t of the bent fiber sensor is related to the R and the period of bending ( N ), as described in Equation (6) [37]:
P o u t = P i n η 1 N · e ( η 2 R ) ,
where P i n is the input optical power and η 1 and η 2 are expressions that relate the attenuation and propagating coefficients of the optical fiber, respectively [59]. In addition to silica-based optical fibers, POF is often the choice of material for bent fibers due to their larger elastic limit and softness. This choice reduces the risk of fiber breakage, making POF-based bent fibers more suitable for integration into smart textiles [57]. Some studies have partially removed the cladding of bent fibers to increase their sensitivity [60,61], although this method compromises the mechanical strength of the bent fibers and reduces sensor robustness. Furthermore, bent fiber sensors do not provide large spatial resolutions compared to FBG, FPI, and COF sensors. Nevertheless, bent fiber sensors can be regarded as a highly cost-effective solution for pulse waveform detection.

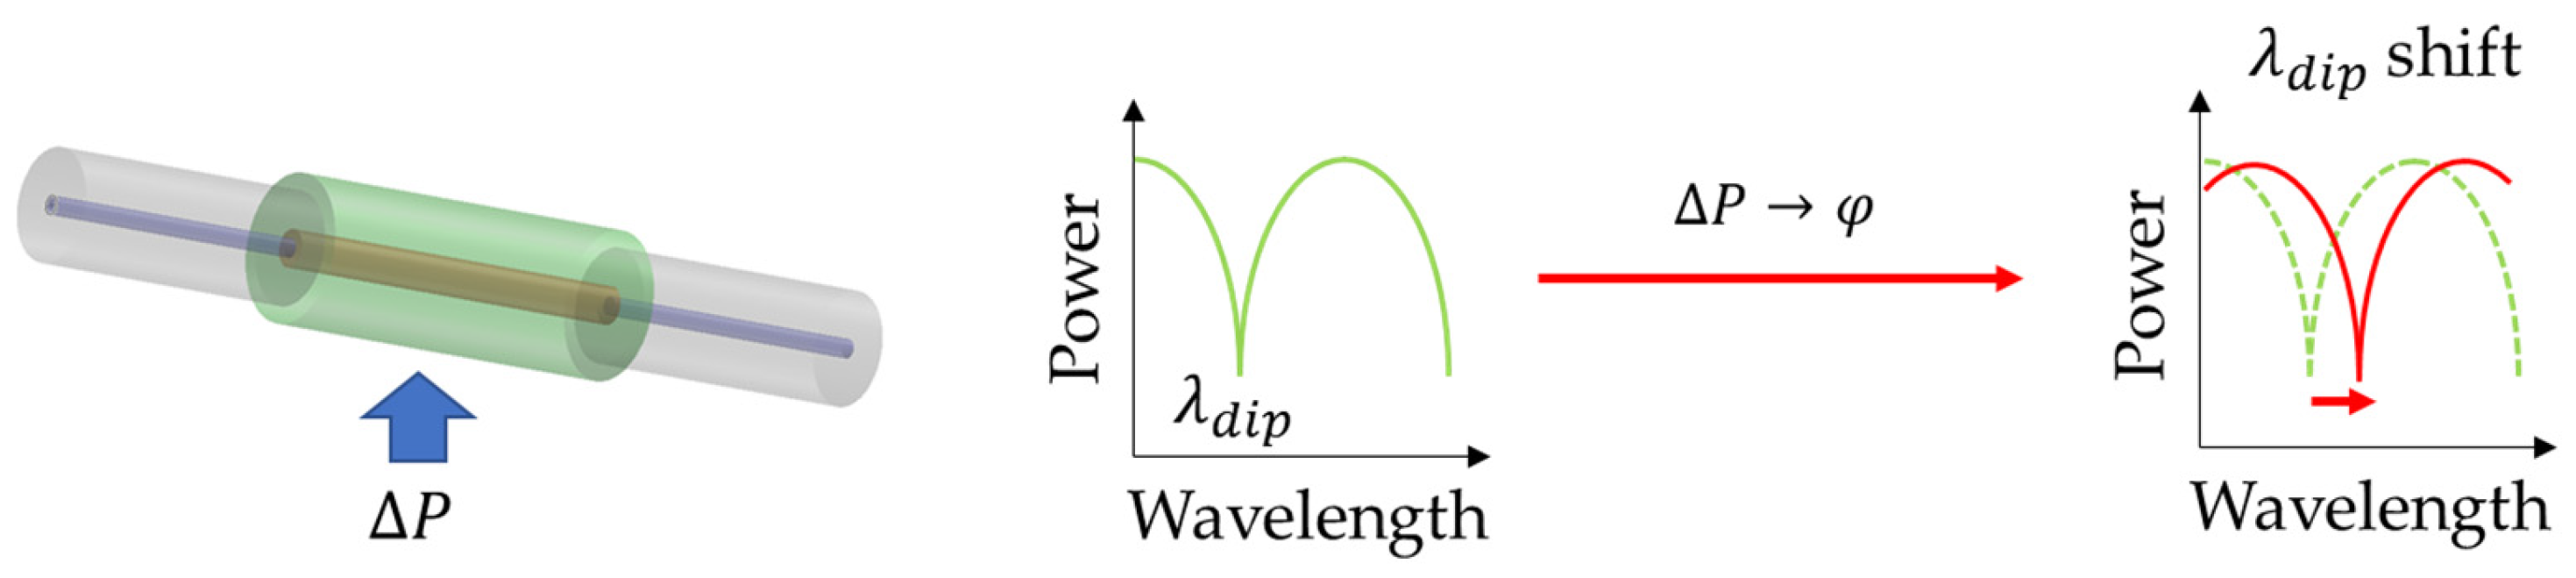
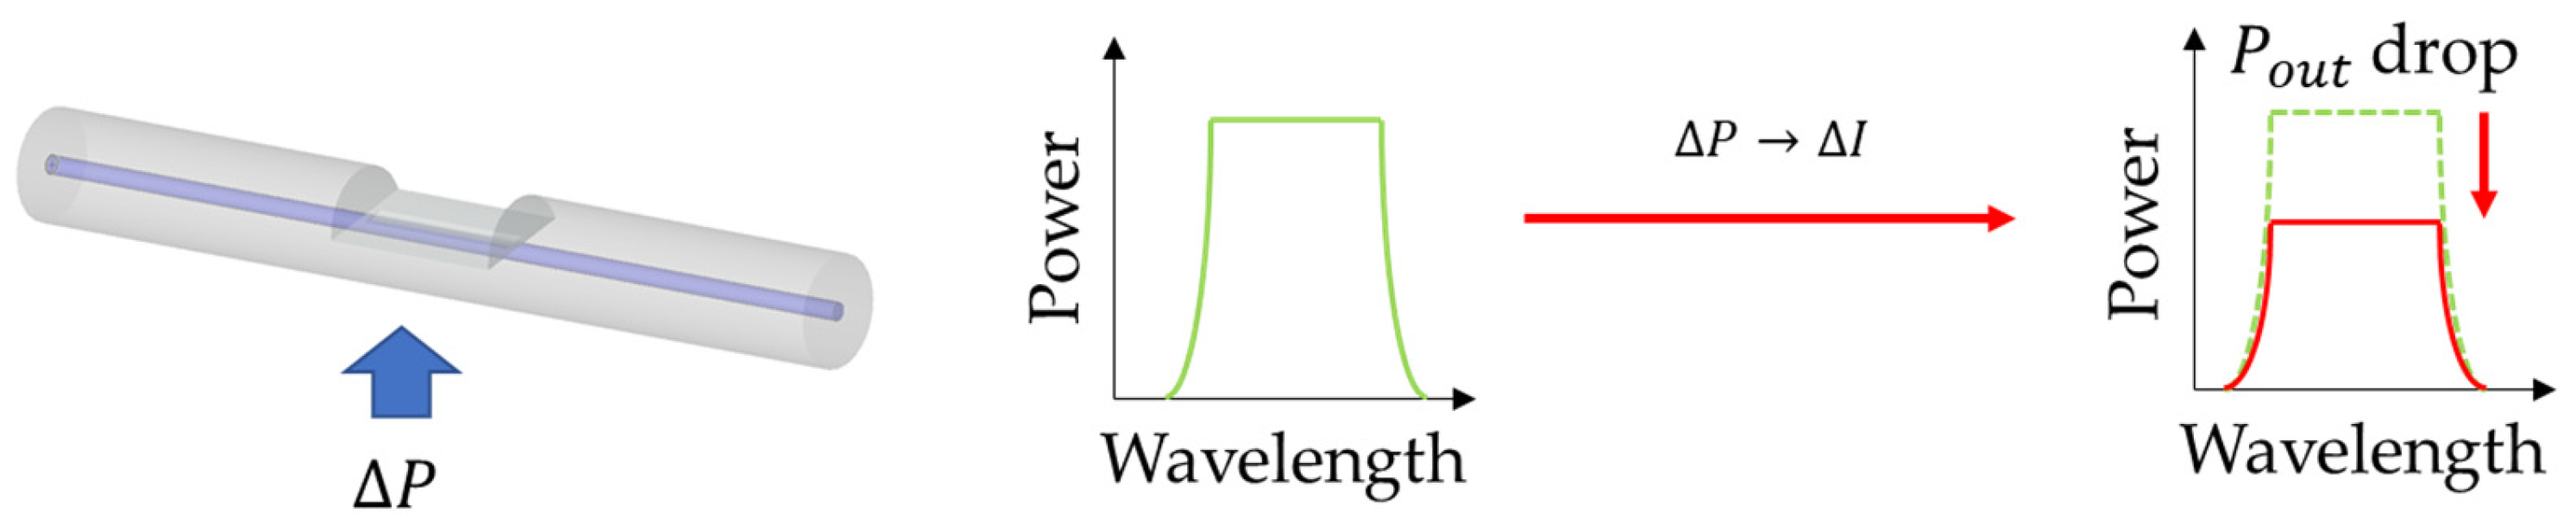
2.5. Cladding-Removed Fiber Sensors

A cladding-removed fiber (CRF) sensor operates on a similar working principle as a bent fiber sensor. Part of the cladding of the fiber is removed via micromachining or etching techniques, making the evanescent wave along that interface sensitive to the external disturbances. A common example of a CRF sensor is the D-shaped fiber sensor (Figure 5). With part of the cladding removed, the exposed region possesses a different light propagating condition. Physical deformation can alter the light-propagating conditions of the region, leading to output power attenuation. The sensitivity of this sensor often depends on the surface roughness of the medium and other light scattering conditions [62]. Additionally, the cladding-removed region has low mechanical strength, raising concerns about its use in wearable sensors. Nonetheless, it serves as a cost-effective alternative for pulse waveform sensing.

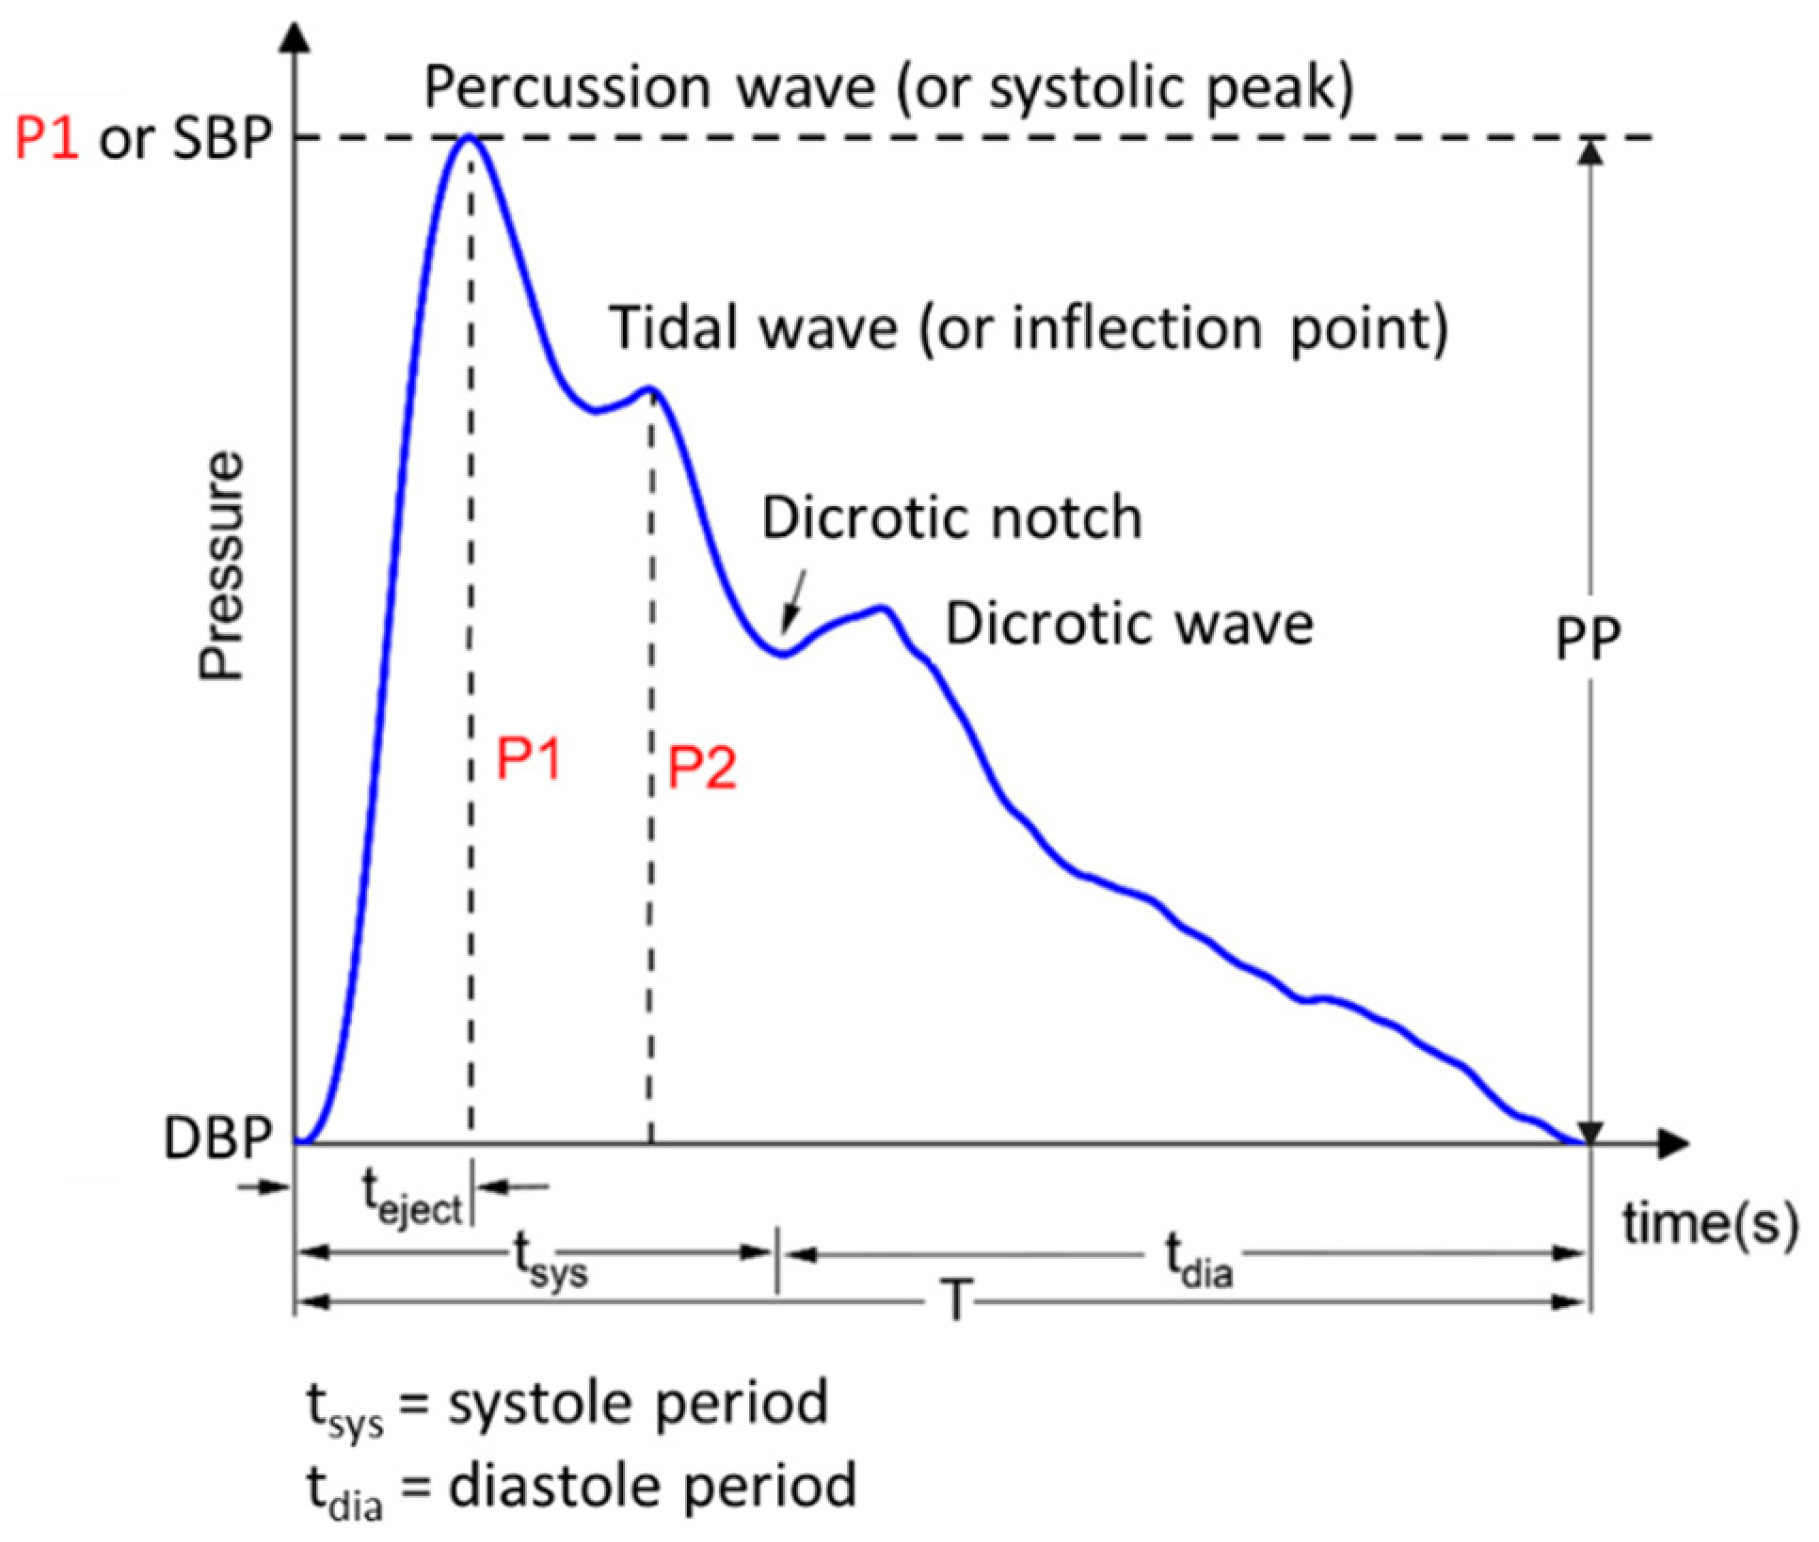
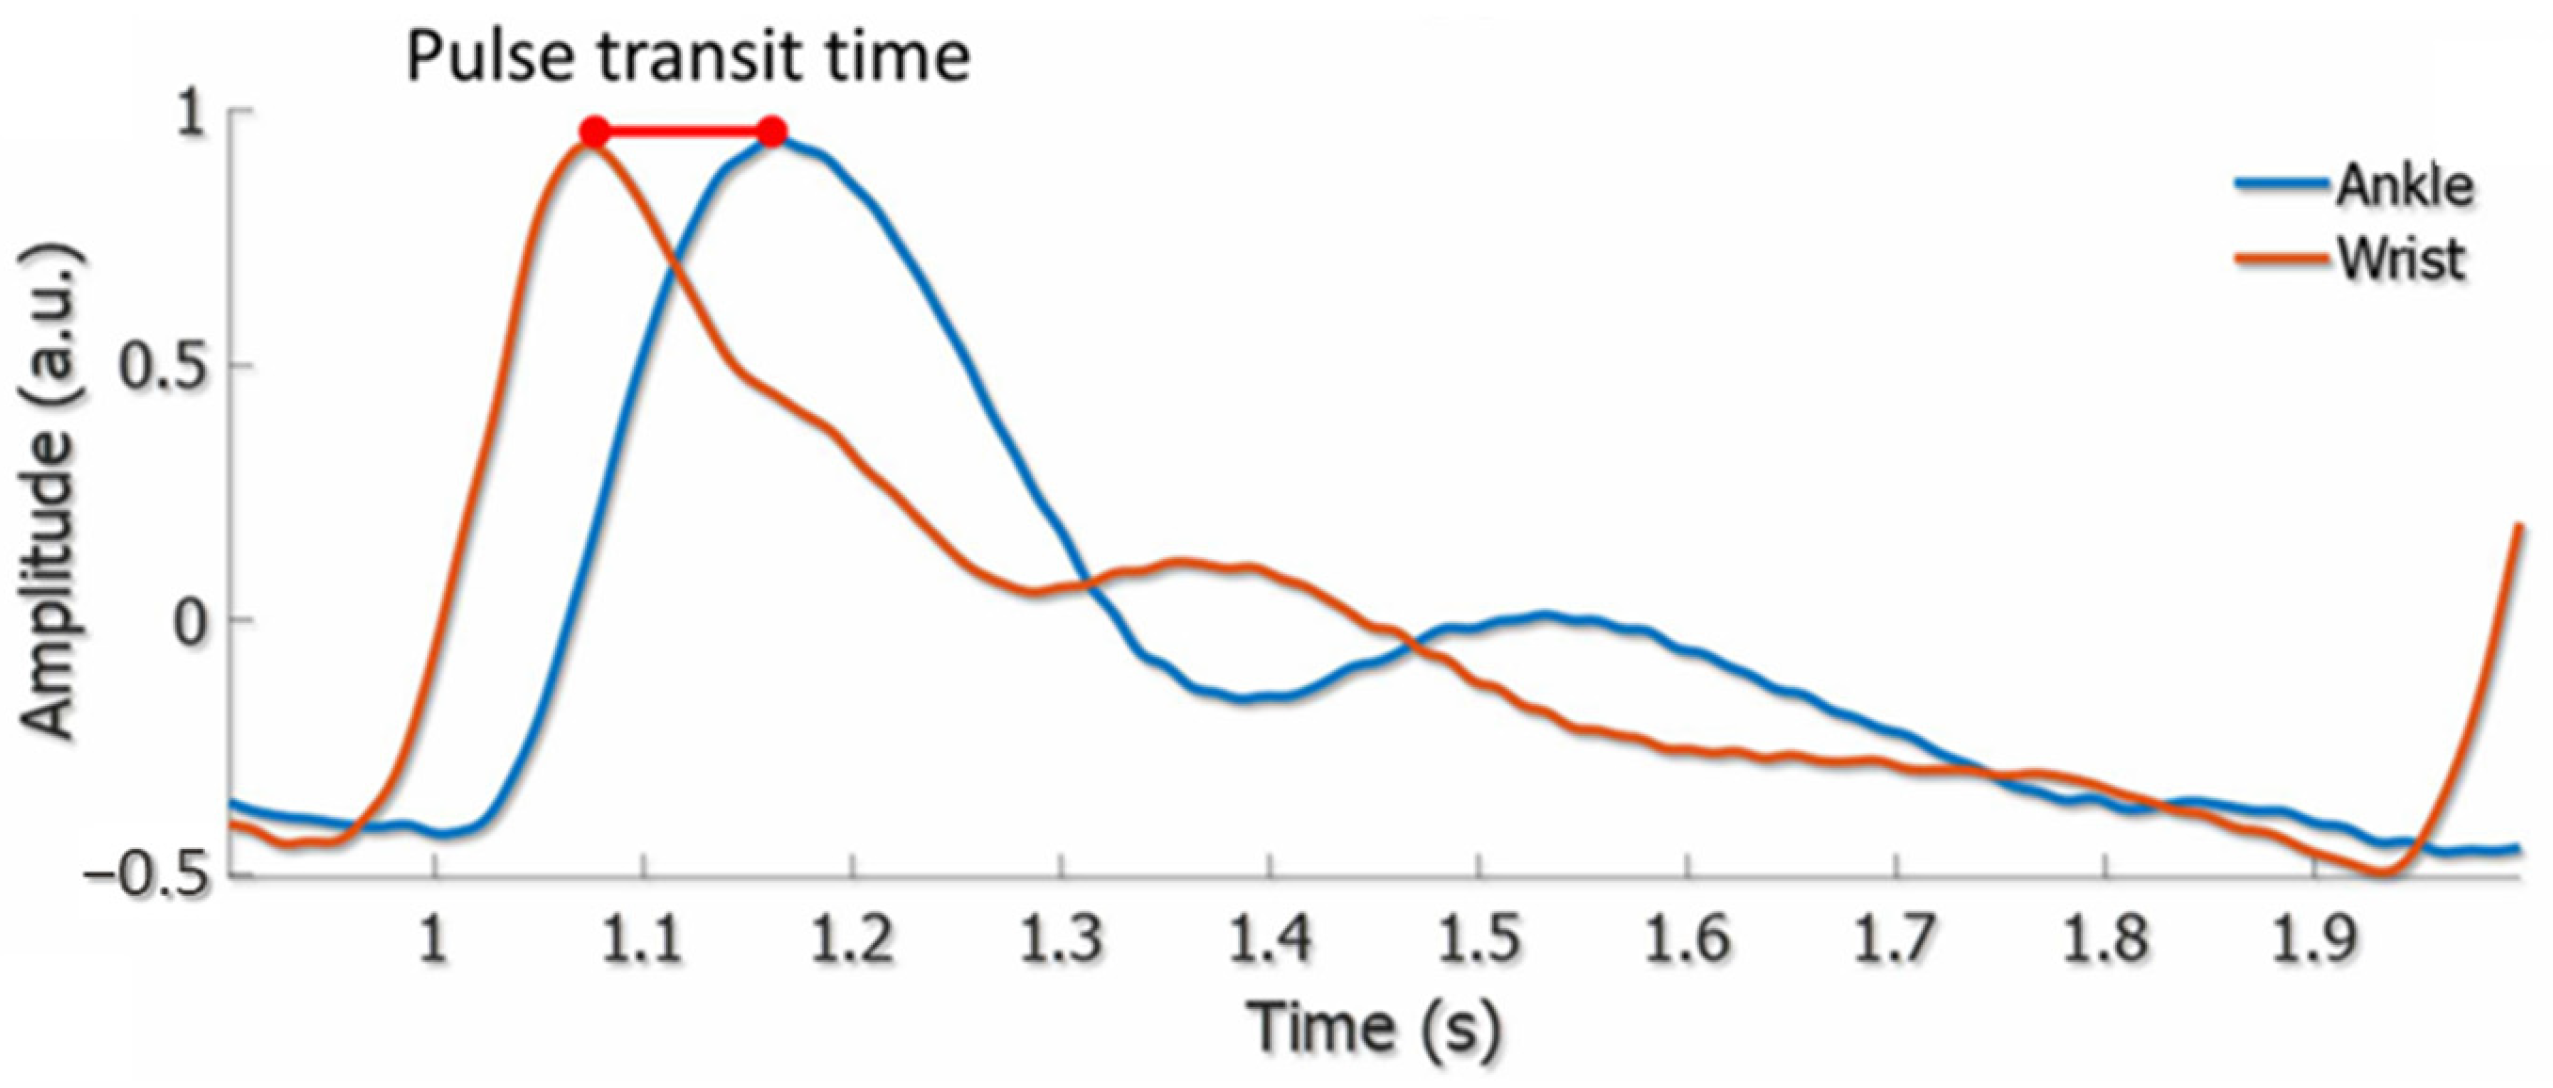
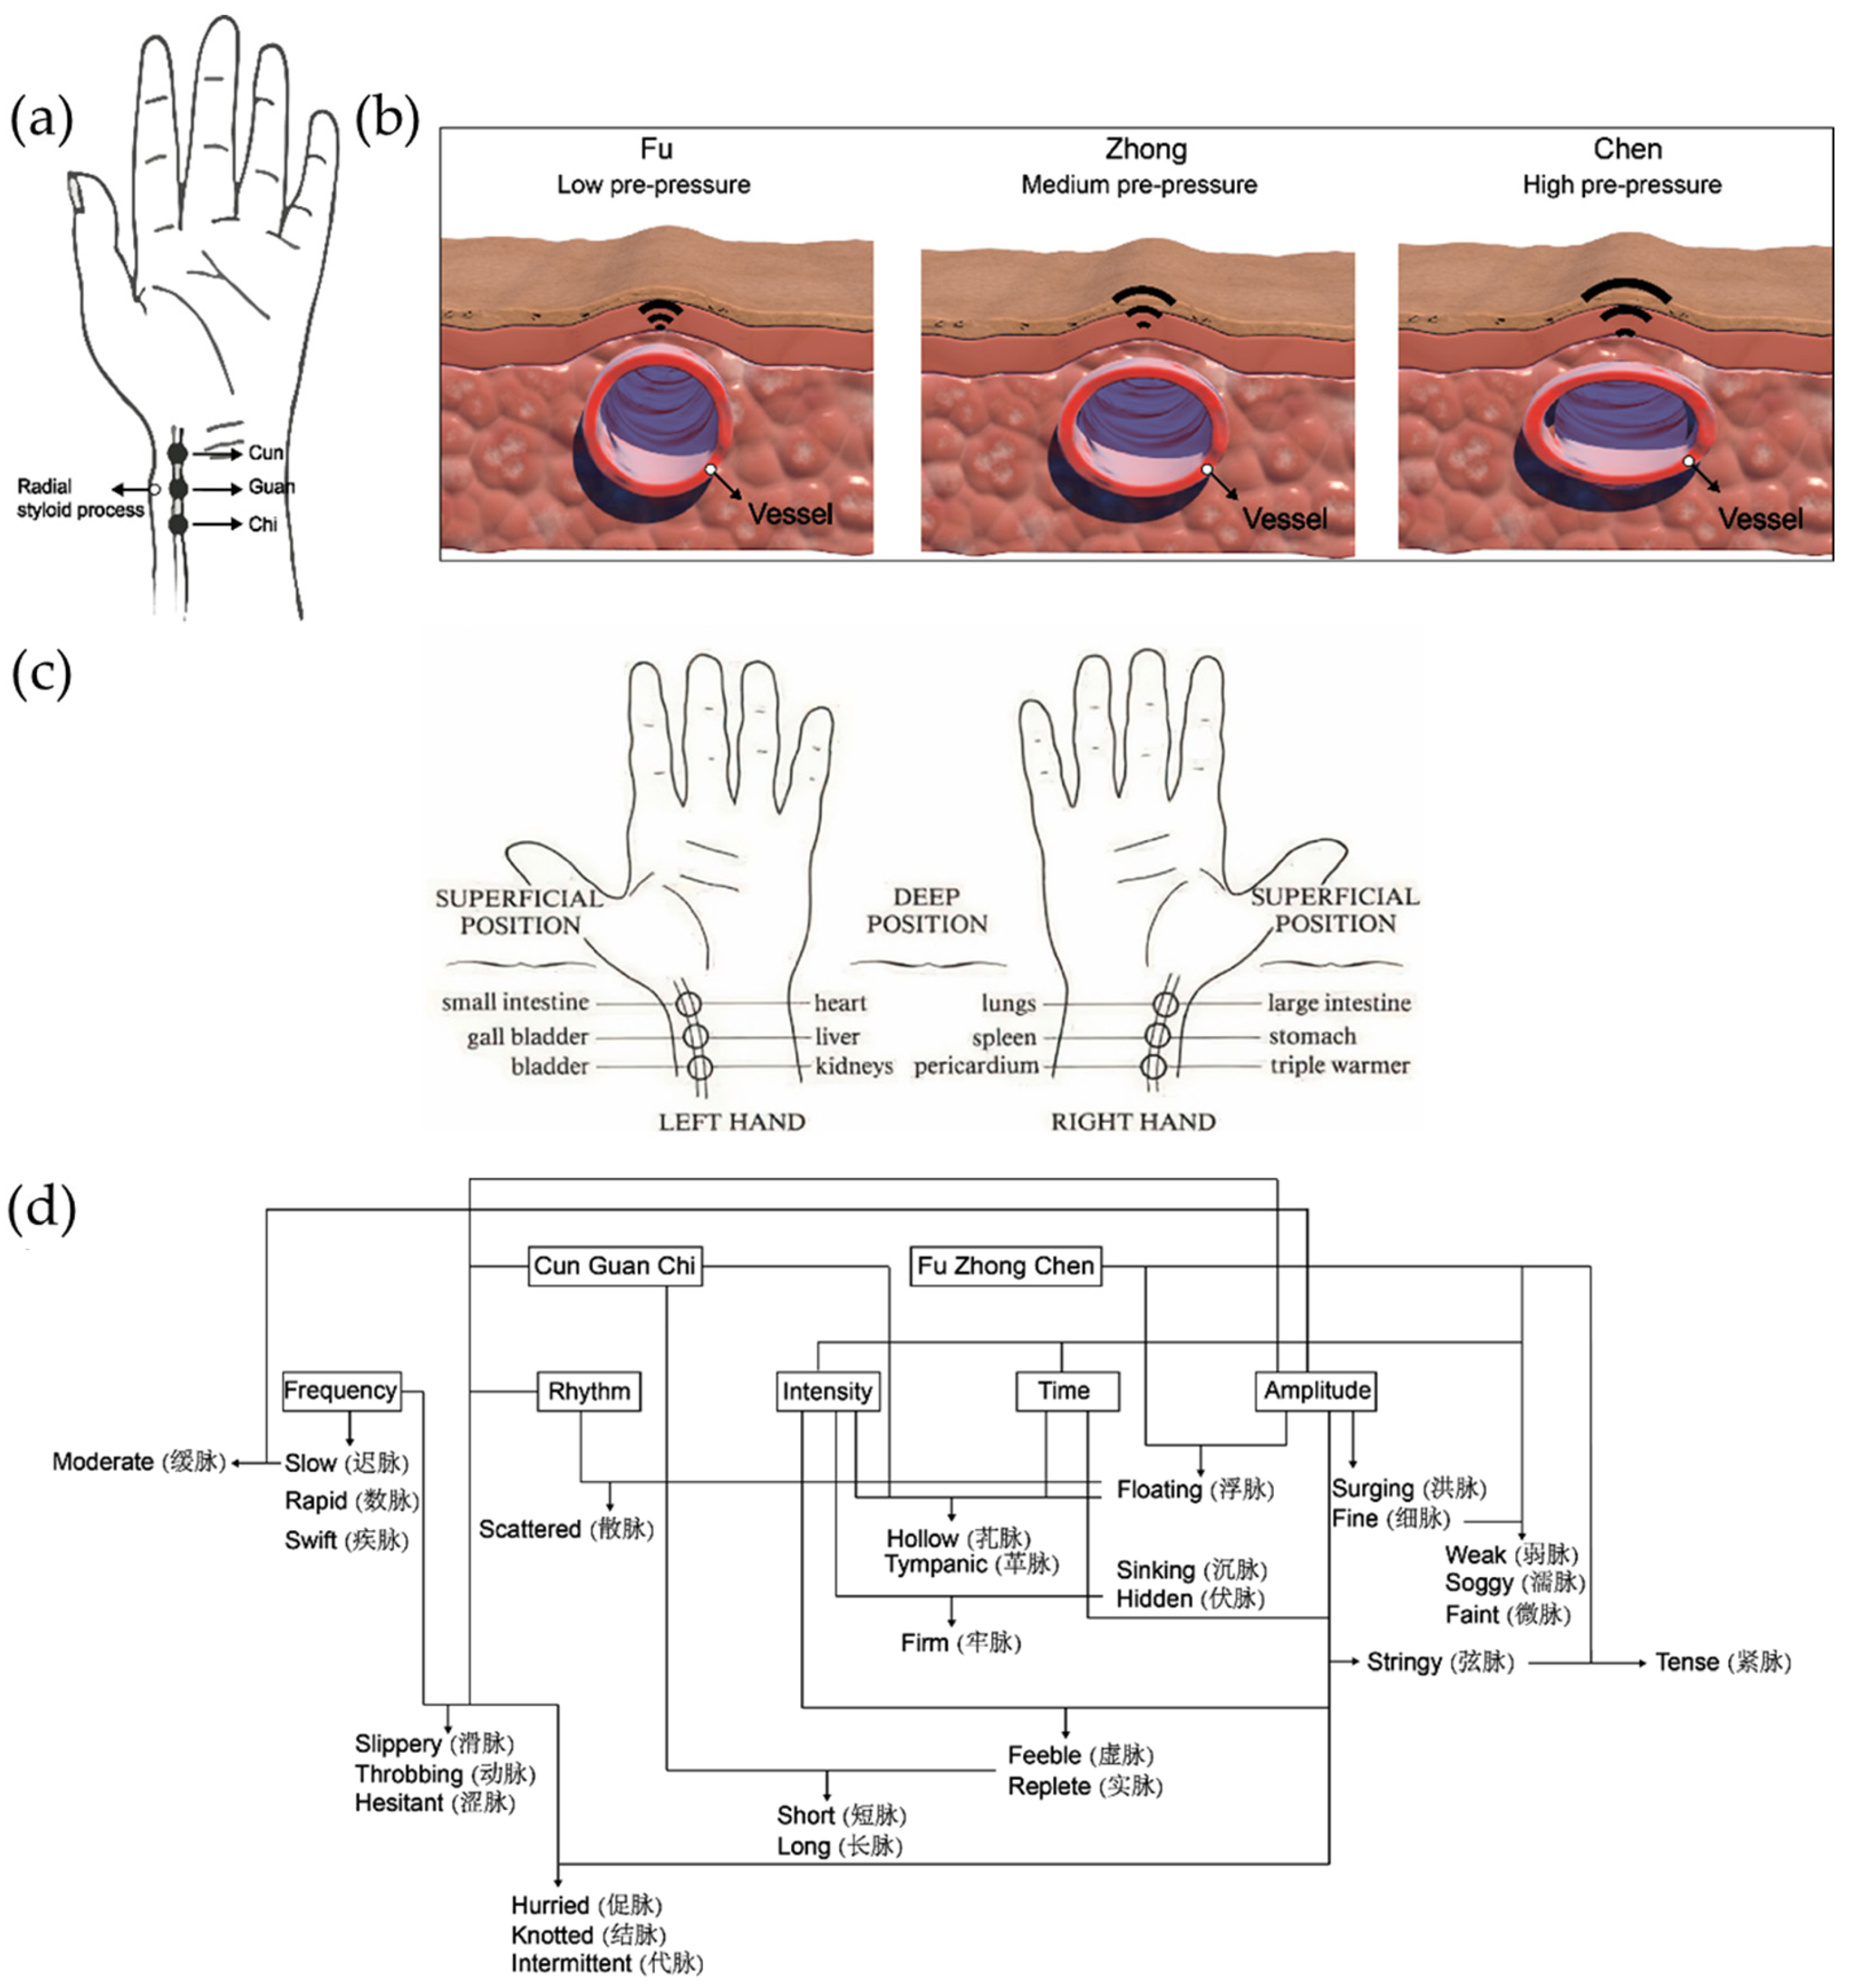
3. Arterial Pulse Wave and Pulse Waveform Analysis

Pulse waves can be detected at various locations where arteries are located close to the surface of the skin. Common arteries with strong pulse wave signals include carotid, brachial, radial, and femoral arteries, which are situated at or around the area of the neck, the cubital fossa, the wrist, and the femoral triangle, respectively. Rhythmic arterial pulses are generated when the left ventricles eject blood into the aorta, sending it to the body’s arteries. This phase of the cardiac cycle is known as systole. During this time, BP increases rapidly to a maximum point at the systolic peak, known as systolic blood pressure (SBP), as shown in Figure 6. The BP reduces gradually as the heart begins to retract. When blood collides with the arterial walls, the back-reflected wave combines with the flushing blood, creating an inflection point or a tidal wave [4]. This inflection point depends on arterial stiffness [63]. The aortic valve then closes and creates a dicrotic notch. This closure of the aortic valve creates a brief pressure increase, called the dicrotic wave, as the elastic rebound of the aorta and arterial tree reflects blood forward [64]. Subsequently, BP decreases to its minimum at the end-diastolic stage, measured as diastolic blood pressure (DBP). PWA uses this information to evaluate cardiovascular health. For example, pulse amplitude, determined by the difference between SBP and DBP, is referred to as pulse pressure (PP). The average blood pressure or mean arterial pressure ( P m ) is evaluated by the mean area under the pulse wave, as shown in Equation (7) [31]:
P m = 1 T 0 T P ( t ) d t ,
where P ( t ) and T are the BP and duration of a cardiac cycle, respectively, as shown in Figure 6.
Additionally, the information from the tidal wave provides insight into arterial stiffness through a measure known as the augmentation index ( A I x ), which is expressed as
A I x = P 2 P 1 S B P D B P ,
where P 1 and P 2 are the pressures of percussion and tidal wave, respectively, as shown in Figure 6. Positive A I x values indicate stiffer arteries, while negative AIx values suggest more elastic arteries [11,65]. Furthermore, certain cardiovascular diseases, such as atherosclerosis, can be predicted from the peripheral vascular resistance, which can be determined from the K -value in Equation (9) [66,67]:
K = P m D B P S B P D B P ,
Some studies also analyze the first and second derivatives of the pulse waveform to further assess heart and arterial health, but these analyses are beyond the scope of this paper [10,51,68].
Figure 6. General illustration of arterial pulse waveform characteristics in PWA. Reproduced from [69]; published by MDPI, 2021.
Photonics 12 00662 g006
However, there are limitations when measuring and analyzing the pulse waveform from just one specific artery. Some studies suggest that the AIx value might not be the best way to assess arterial stiffness [70,71]. The assessment of arterial stiffness is important as it is the pathogenic factor in the development of hypertension. A proposed solution is to take information from two arterial sites instead of just one. As blood propagates from the heart to other parts of the body, pulse waves experience a temporal delay at different locations, known as pulse transit time (PTT). Figure 7 illustrates the PTT of pulse waves from wrist and ankle arteries [72]. The pulse wave closer to the heart is detected before the further one. In an individual with high BP, blood travels at a faster velocity through the arteries, leading to shorter PTT over the same distance compared to a person with low BP [73]. The pulse wave velocity (PWV) is related to the distance between arterial sites ( L ) and PTT, as shown in Equation (10):
P W V = L P T T ,
By combining the relationship of PWV and blood pressure P as described by Bramwell-Hill, Moens-Korteweg, and Hughes, the PWV can be rewritten as
P W V = V Δ P ρ Δ V = E 0 e γ P h 2 ρ r ,
where V , ρ , Δ V , and Δ P are the volume, density, change in volume, and change in blood pressure, respectively; E 0 is the arterial elastic modulus at 0 mmHg of pressure; and γ , h , and r represent the coefficient, thickness, and radius of the vessel, respectively [4]. The thin diameter of the fiber enables high spatial resolution measurement of pulse waveforms, capturing features smaller than 100 µm. This allows for the detection of subtle variations in the pulse waveform, which may offer valuable insights into heart and vessel conditions, in addition to blood pressure. Several mathematical models derived from Equation (10) have been developed to fit empirical pressure data, which is discussed in [8,9,73,74]. As signals obtained from OFSs reflect relative changes associated with the pulse, converting these measurements to absolute BP values in mmHg requires correlating waveform features with an estimation model. Algorithms such as linear and nonlinear regression models are used to relate PTT to BP. The simplest and most widely used linear regression model is given in Equation (12):
B P = a · P T T + b ,
where a and b are the regression parameters. While this model can estimate SBP with high accuracy, it is less effective for DBP. According to the Association for the Advancement of Medical Instrumentation (AAMI) guidelines, the mean error (ME) and standard deviation (STD) of the BP estimation should not be greater than 5 mmHg and 8 mmHg, respectively. Attempts to improve accuracy by incorporating additional parameters, such as heart rate and body mass index, into the linear regression model have not yielded significant improvements [8,73]. In contrast, nonlinear regression models have shown better BP estimation performance, meeting the AAMI criteria. For example, Dai et al. used Equations (13) and (14) to achieve low ME and STD for their BP estimation [74]:
S B P = a 1 · l n   P T T + b 1 1 P T T 2 + c 1 ,
D B P = a 2 · l n   P T T + b 2 1 P T T 2 + c 2 ,
where a 1 , b 1 , c 1 , a 2 , b 2 , and c 2 are the regression coefficients.
Recently, machine learning models have gained popularity for BP prediction. Researchers train these models to estimate BP using either regression or feature extraction methods. Regression-based models such as support vector regression (SVR) and regression tree are good at finding the best line (or hyperplane) for nonlinear data, thus minimizing ME and STD in BP estimation. Both Pang et al. [5] and Xiong et al. [75] utilized SVR in predicting BP, with Pang et al. achieving low ME ± STD values of (−0.12 ± 1.66) mmHg for SBP and (0.06 ± 1.54) mmHg for DBP [5].
In addition, feature-extraction-based models are used to identify relevant features in the pulse waveform, simplifying the dataset and improving prediction accuracy and efficiency. This process extracts informative data while filtering out noise. Common models for feature extraction in BP prediction using OFSs include convolutional neural networks (CNNs), long short-term memory (LSTM) networks, and residual neural networks (ResNet) [6,47,76]. For example, Li et al. used a hybrid model of CNNs and LSTM to perform feature extraction from a pulse waveform followed by using regression head and backpropagation neural networks to reduce overfitting, achieving SBP and DBP estimation accuracies of (0.04 ± 2.44) mmHg and (0.05 ± 2.52) mmHg, respectively [76]. We believe that machine learning models represent a promising future approach for correlating optical signals from OFSs with an absolute BP scale.
In TCM, pulse diagnosis is often taken from the radial arteries at three specific locations called Cun, Guan, and Chi, using the practitioner’s fingers as shown in Figure 8a. Practitioners apply three levels of pressing pressures (see Table 2 and Figure 8b) for different diagnostic purposes, as depicted in Figure 8c. Essentially, TCM practitioners use their fingers as the pressure sensors to “feel” an arterial pulse based on characteristics such as frequency, rhythm, and intensity to identify 28 pulse conditions, as shown in Figure 8d [21]. Tang et al. visually represented all TCM pulse conditions using their barometer-based pressure sensor prototype on a commercial palpation training machine [77]. Some miniature sensors have been developed to mimic TCM practitioners methods of obtaining pulse signals [69,78]. Inspired by TCM pulse diagnosis, researchers have begun exploring pulse conditions between healthy and unhealthy subjects. Lin et al. investigated the characteristics of pathological data in pulse waveforms to detect chronic diseases using computational modeling. For instance, they found that subjects with pancreatitis and appendicitis exhibit a three-peak structure in the diastolic period [13,63]. Zhang et al. used PWA to differentiate diseases such as diabetes, nephropathy, and hyperlipidemia [79]. The emergence of computational methods and machine learning has significantly advanced pulse diagnosis for disease identification [14].
The discussion underscores the importance of PWA in both clinical and personal health monitoring. Advances in computational methods have made it possible to predict chronic diseases. High-fidelity pulse waveforms are necessary for accurate monitoring and body condition prediction. OFSs play an important role in this context, as they can provide pulse waveform data with high spatial resolution and allow for long-term health monitoring applications.

4. OFSs for Pulse Waveform Sensing

This section discusses the use of OFSs in measuring arterial pulse waveforms, with a focus on their sensing principles, fiber structures, and their sensing performances. Most reported OFSs typically work in sampling rates between 100 Hz and 1 kHz, which are considered sufficient for capturing arterial pulse waveform data [80]. The performance of each recently developed OFS is summarized in a table within each subsection for comparison.

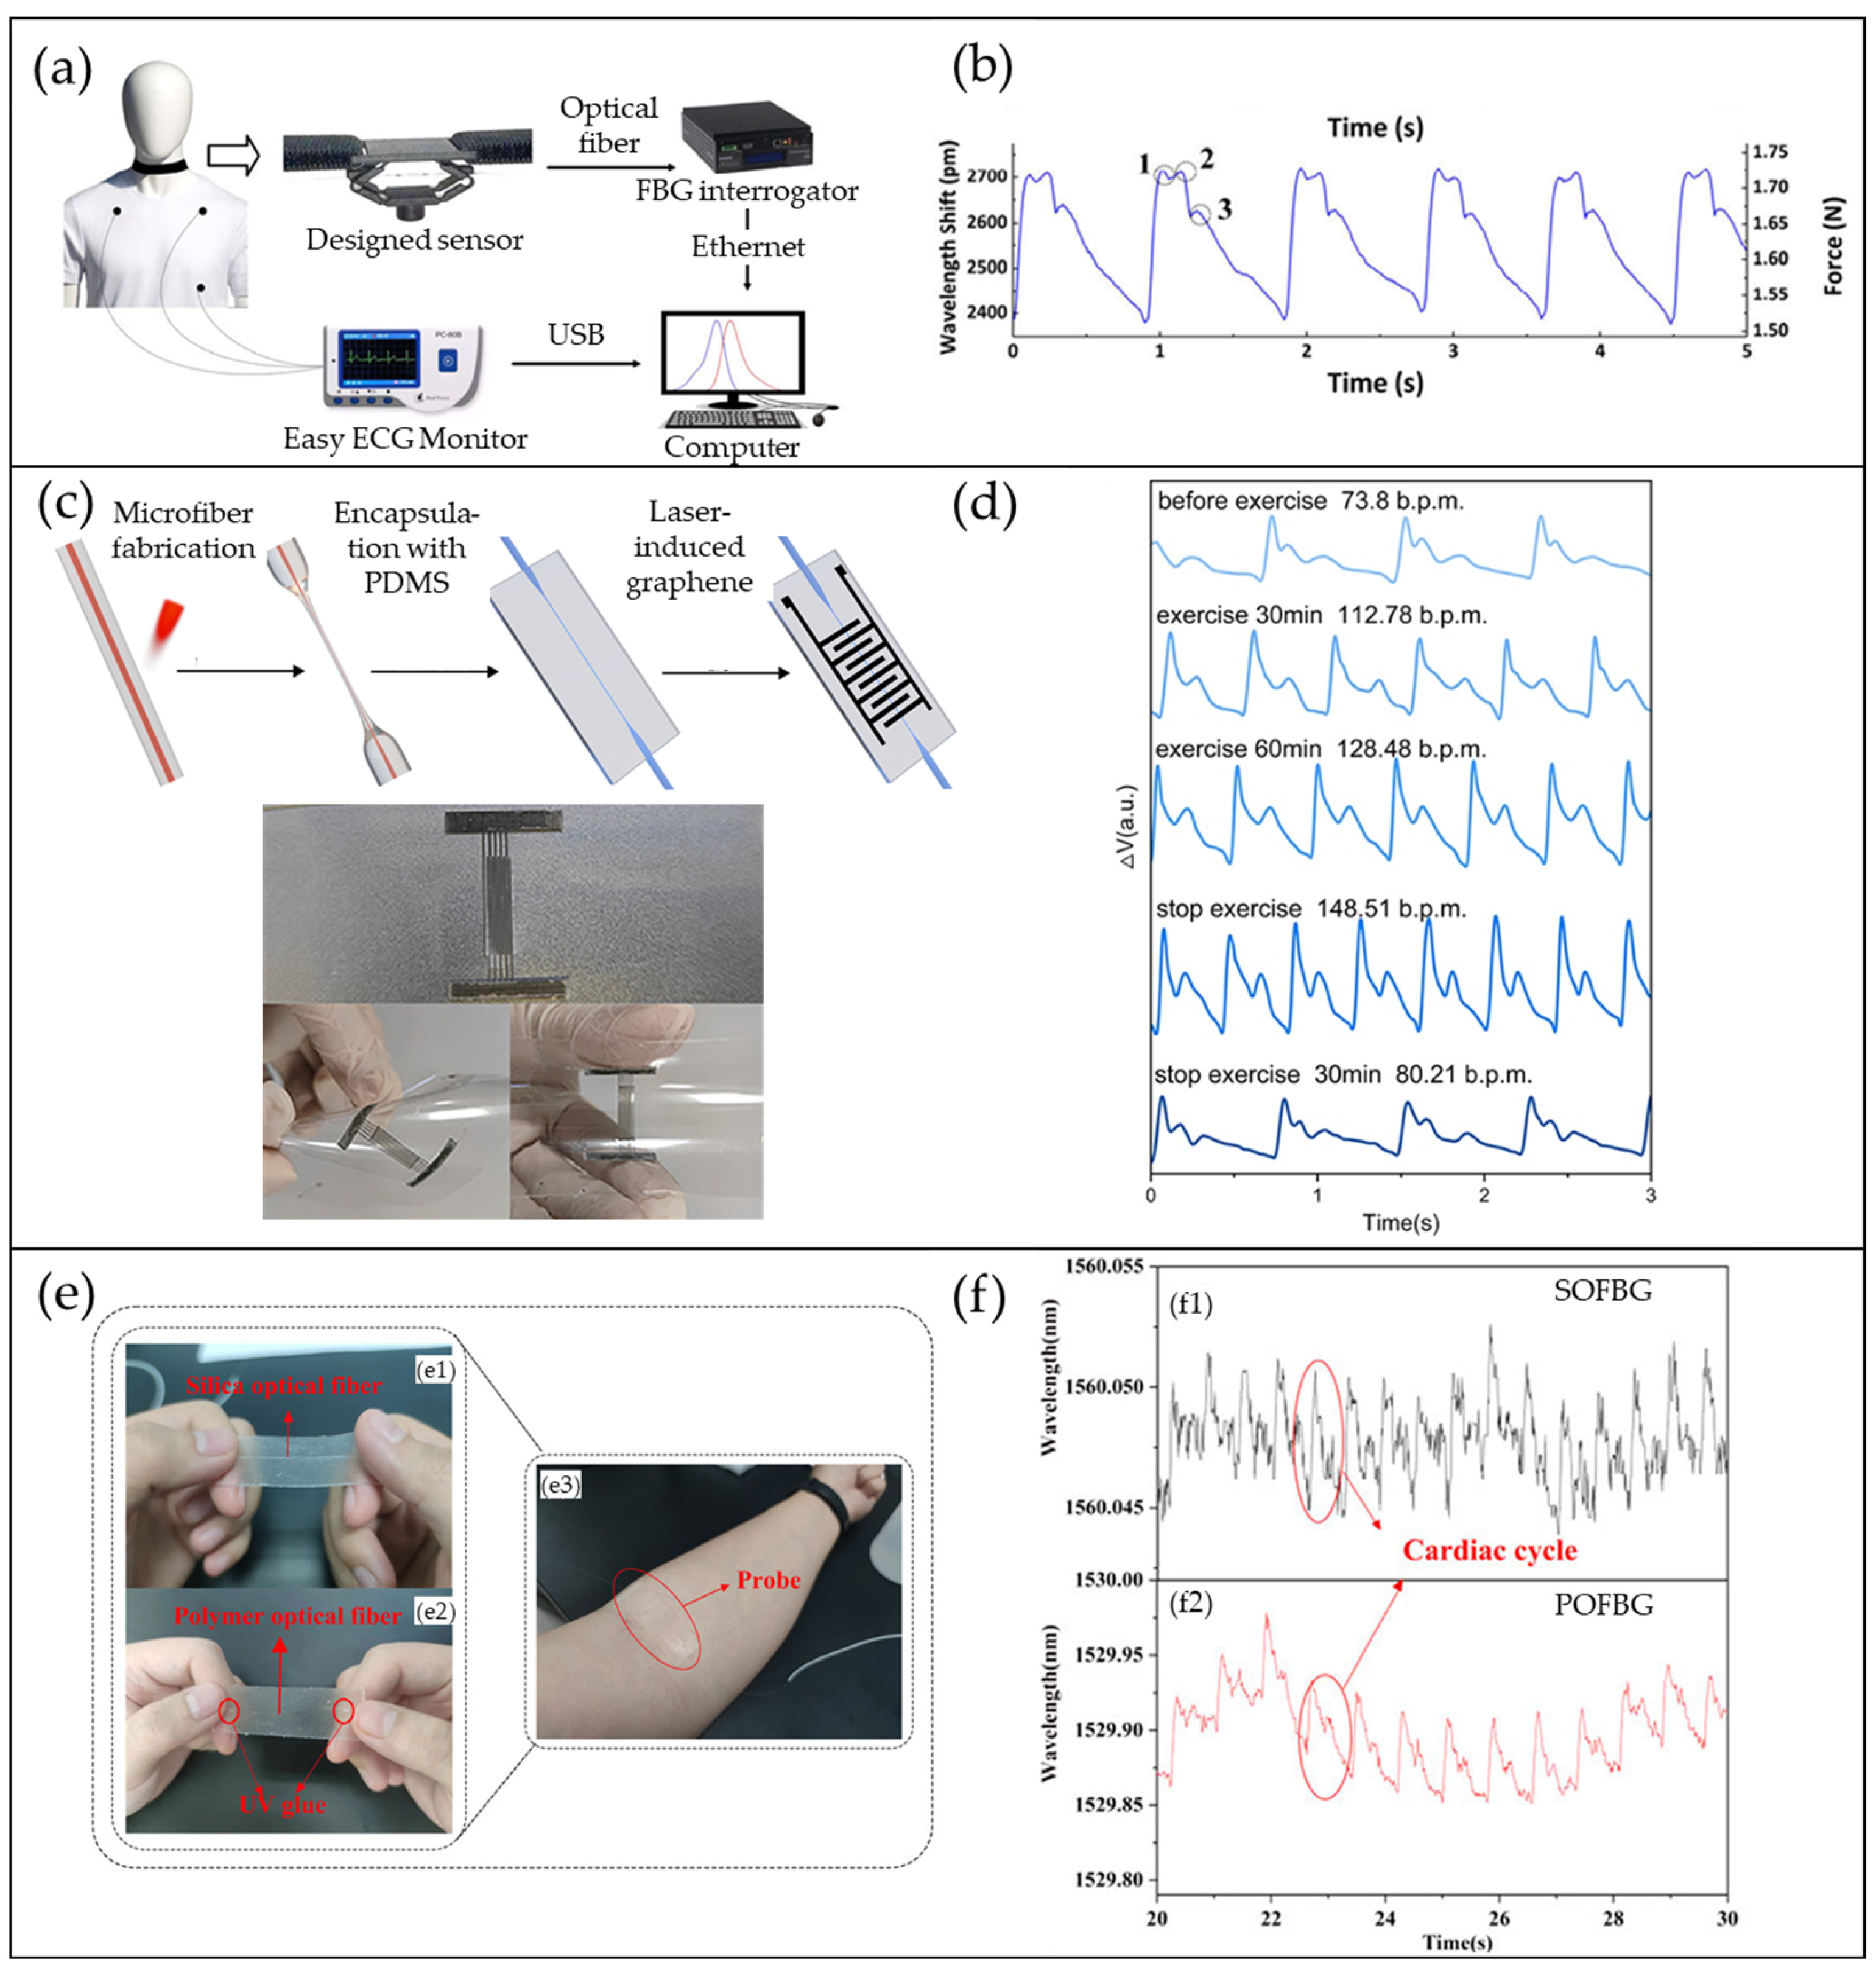
4.1. FBG-Based Pulse Waveform Sensors

FBG sensors obtain an arterial pulse signal based on the change in strain of the sensing part, caused by the rhythmic pulsation from the skin. The commercial FBG is the silica optical FBG (SOFBG), with a strain sensitivity of 1.2 pm/µε [10,40]. It is not satisfactory in detecting a weak arterial pulse signal from the skin. The change in wavelength of SOFBG during the pulse measurement is generally <5 pm [81,82], resulting in noisy signals. Investigations have been carried out to either increase the sensitivity of the SOFBG or find alternative fiber materials. Examples of the solution include the development of unconventional architectures or mechanics to amplify the pulsation signal; the modification of the fiber structure to improve the strain sensitivity; and the use of softer optical fiber material, such as polymer. Shi et al. designed a force-sensitive flexure with a suspended FBG in it for carotid arterial pulse waveform measurement, as demonstrated in Figure 9a [83]. The flexure develops from a six-bar parallel mechanism based on the rigid-body replacement method to achieve a compact architecture. The FBG is suspended horizontally on the flexure to sense its motion. The optimized prototype achieved an experimental sensitivity of 1547.3 pm/N, which greatly enhanced the wavelength shift of the FBG sensor to 340 pm, as depicted in Figure 9b. Consequently, the SNR of the carotid pulse signal was sufficiently high for PWA. They also developed a handheld sensor using the same technology, which is suitable for clinical applications. Additionally, Tang et al. proposed an arterial pulse sensor based on suspended FBG on a force-sensitive orthogonal planar spring structure [84]. The force sensitivity was as high as 2143.7 pm/N, allowing the detection of the radial artery pulse at a high resolution.
The second method to increase the strain sensitivity is through the modification of the fiber structure. Instead of using the common single-mode FBG with a diameter of 125 µm, Li et al. prepared a graphene-functionalized LPG on a ~8 µm microfiber, referred to as a laser-induced graphene-microfiber long-period grating (LIG-mLPG) sensor [48]. This sensor was embedded in polydimethylsiloxane (PDMS), making it flexible and wearable, as shown in Figure 9c. The advantages of such a functionalized sensor are in its provision of multiparameter monitoring, which not only measures human pulse signals but also the glucose level from sweat. The sensitivity of LIG-mLPG was 2.06 nm/kPa over a wide external pressure range from 0.1 to 9 kPa. As shown in Figure 9d, the percussion, tidal, and dicrotic waves were visible with a high resolution. The sensor works well during exercise, making it suitable for long-term wearable pulse waveform monitoring. Additionally, Zhu et al. proposed a microfiber FBG sensor (µFBG) in a skin-like patch for heart rate and blood pressure monitoring purposes [46]. Protected by PDMS thin film, the µFBG achieved a high linear sensitivity of 5.26 nm/N for stress below 50 mN and a non-linear sensitivity of 2.86 nm/N for stress between 0.05 N and 0.45 N. Furthermore, the pulse signals at different arterial locations were measured to evaluate the blood pressure using PWA. The authors claim that this cuff-less µFBG opens up new possibilities in clinical medical diagnosis and daily health management.
In addition to SOFBG, several studies have explored the use of polymer optical fiber FBGs (POFBGs) for pulse waveform monitoring OFSs. POFs exhibit benefits such as their low Young’s modulus, high flexibility, high fracture toughness, and good biocompatibility, which provide a better alternative to SOFBGs [41,49]. Qu et al. compared the performance between the SOFBG and POFBG sensors in pulse waveform measurement [82]. Both sensors use the same grating inscription and encapsulation process to minimize experimental variables, as shown in Figure 9e. Figure 9f shows the comparison of the performance of the sensors. The SNR of the POFBG sensor was clearly higher than that of the SOFBG. Moreover, the change in pulse signal amplitude of the POFBG sensor reached as high as 50 pm, which was approximately 10 times higher than that of the SOFBG sensor. This shows that the mechanical properties of a POFBG enhance the capability of the OFS in producing a pulse waveform with higher resolution. Similar works are reported by Koyama et al., in which they obtained pulse signals from the fingertips of volunteers using a POFBG sensor [50]. The resolution was relatively low compared to the works in [82]. This might be due to the weaker skin pulsation at the fingertip. Nevertheless, these works provide evidence on the improvement of pulse waveform fidelity compared to that provided by SOFBG sensors. Table 3 summarizes the recent progress of FBG sensors for tabletop and wearable health monitoring applications.

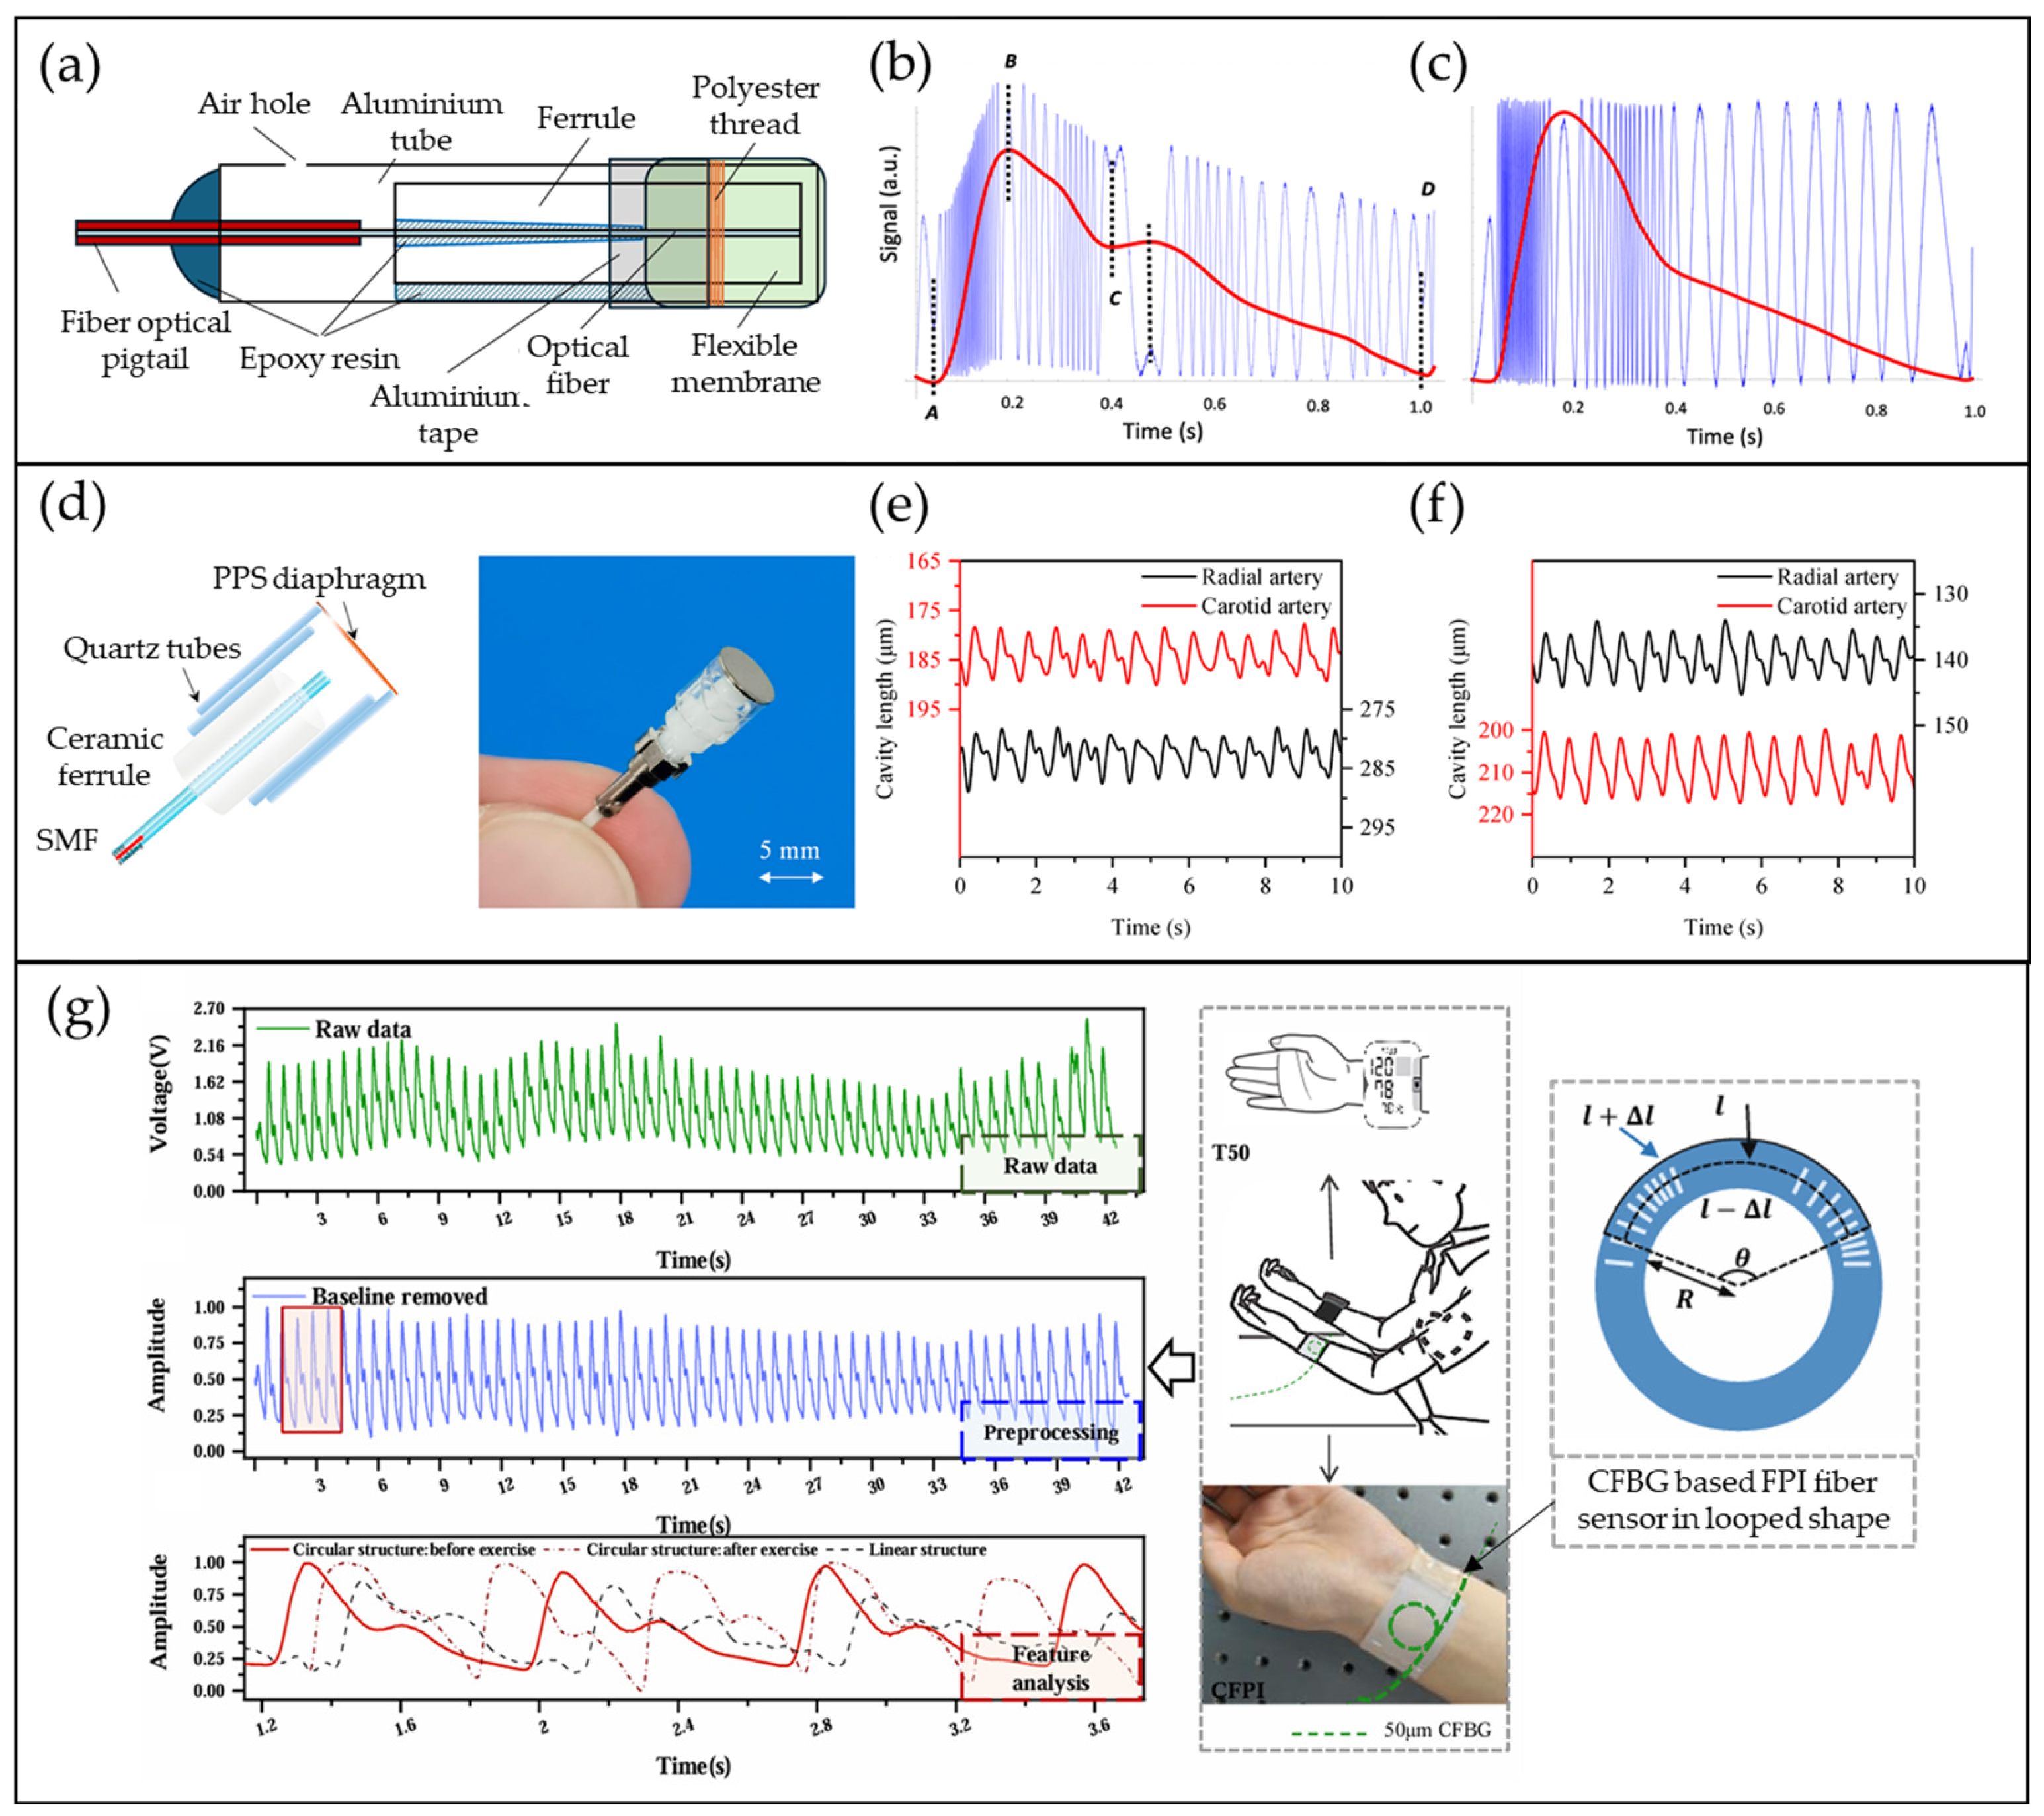
4.2. FPI-Based Pulse Waveform Sensors

To realize an FPI sensor with high resolution, several fabrication methods have been proposed. Generally, two configurations are commonly used: the probe-like FPI sensors [52,95,96] and the all-fiber-based FPI sensors [47,67]. Both configurations have their own advantages for clinical or personal pulse monitoring applications, as long as the OFSs can provide sufficient information from the pulse waveform. Martincek et al. demonstrated a probe-like FPI fiber sensor composed of an optical fiber ferrule, an aluminium tube, and a flexible membrane for arterial pulse measurement at different body locations, as illustrated in Figure 10a [52]. The OFS is placed on a volunteer’s radial artery, in which the membrane will vibrate due to pulsation and alter the interference signals (blue signals in Figure 10b,c) collected by the photodiode. Further analysis produces the pulse waveform signal as shown in the red curves in Figure 10b,c. The authors show the high performance of their OFS in detecting pulses from radial, femoral, posterior tibial, and carotid pulse locations, indicating its suitability for health monitoring purposes. Xu et al. designed the diaphragm of their probe-like FPI fiber sensor by coating a nickel layer on a flexible polyphenylene sulphide (PPS) membrane, as depicted in Figure 10d [95]. The high reflectivity diaphragm enables effective coupling with arterial pulsations at the radial and carotid arteries, as shown in Figure 10e,f. These probe-like FPI sensor designs are easy to use with a sufficient resolution, which is suitable for clinical and benchtop applications. However, they are physically less robust due to the small assemblies on the probe. Next, Liu et al. presented an example of an all-fiber-based FPI sensor [47]. They produced their FPI sensor by inscribing two chirped FBGs, which acted as the two reflecting components, in the optical fiber. They found that the FPI sensor that was embedded in PDMS in a loop structure, as shown as the green dashed line in Figure 10g, was able to measure the radial arterial pulse waveform at higher resolution. Using PWA, SBP and DBP were evaluated with the measurement errors of −0.122 ± 2.781 mmHg and 0.051 ± 1.711 mmHg, respectively, both of which meet the AAMI criteria. This shows the feasibility of a simple, flexible FPI sensor for a highly accurate real-time medical wearable device. Table 4 summarizes the recent progress of the FPI sensor in arterial pulse monitoring applications.

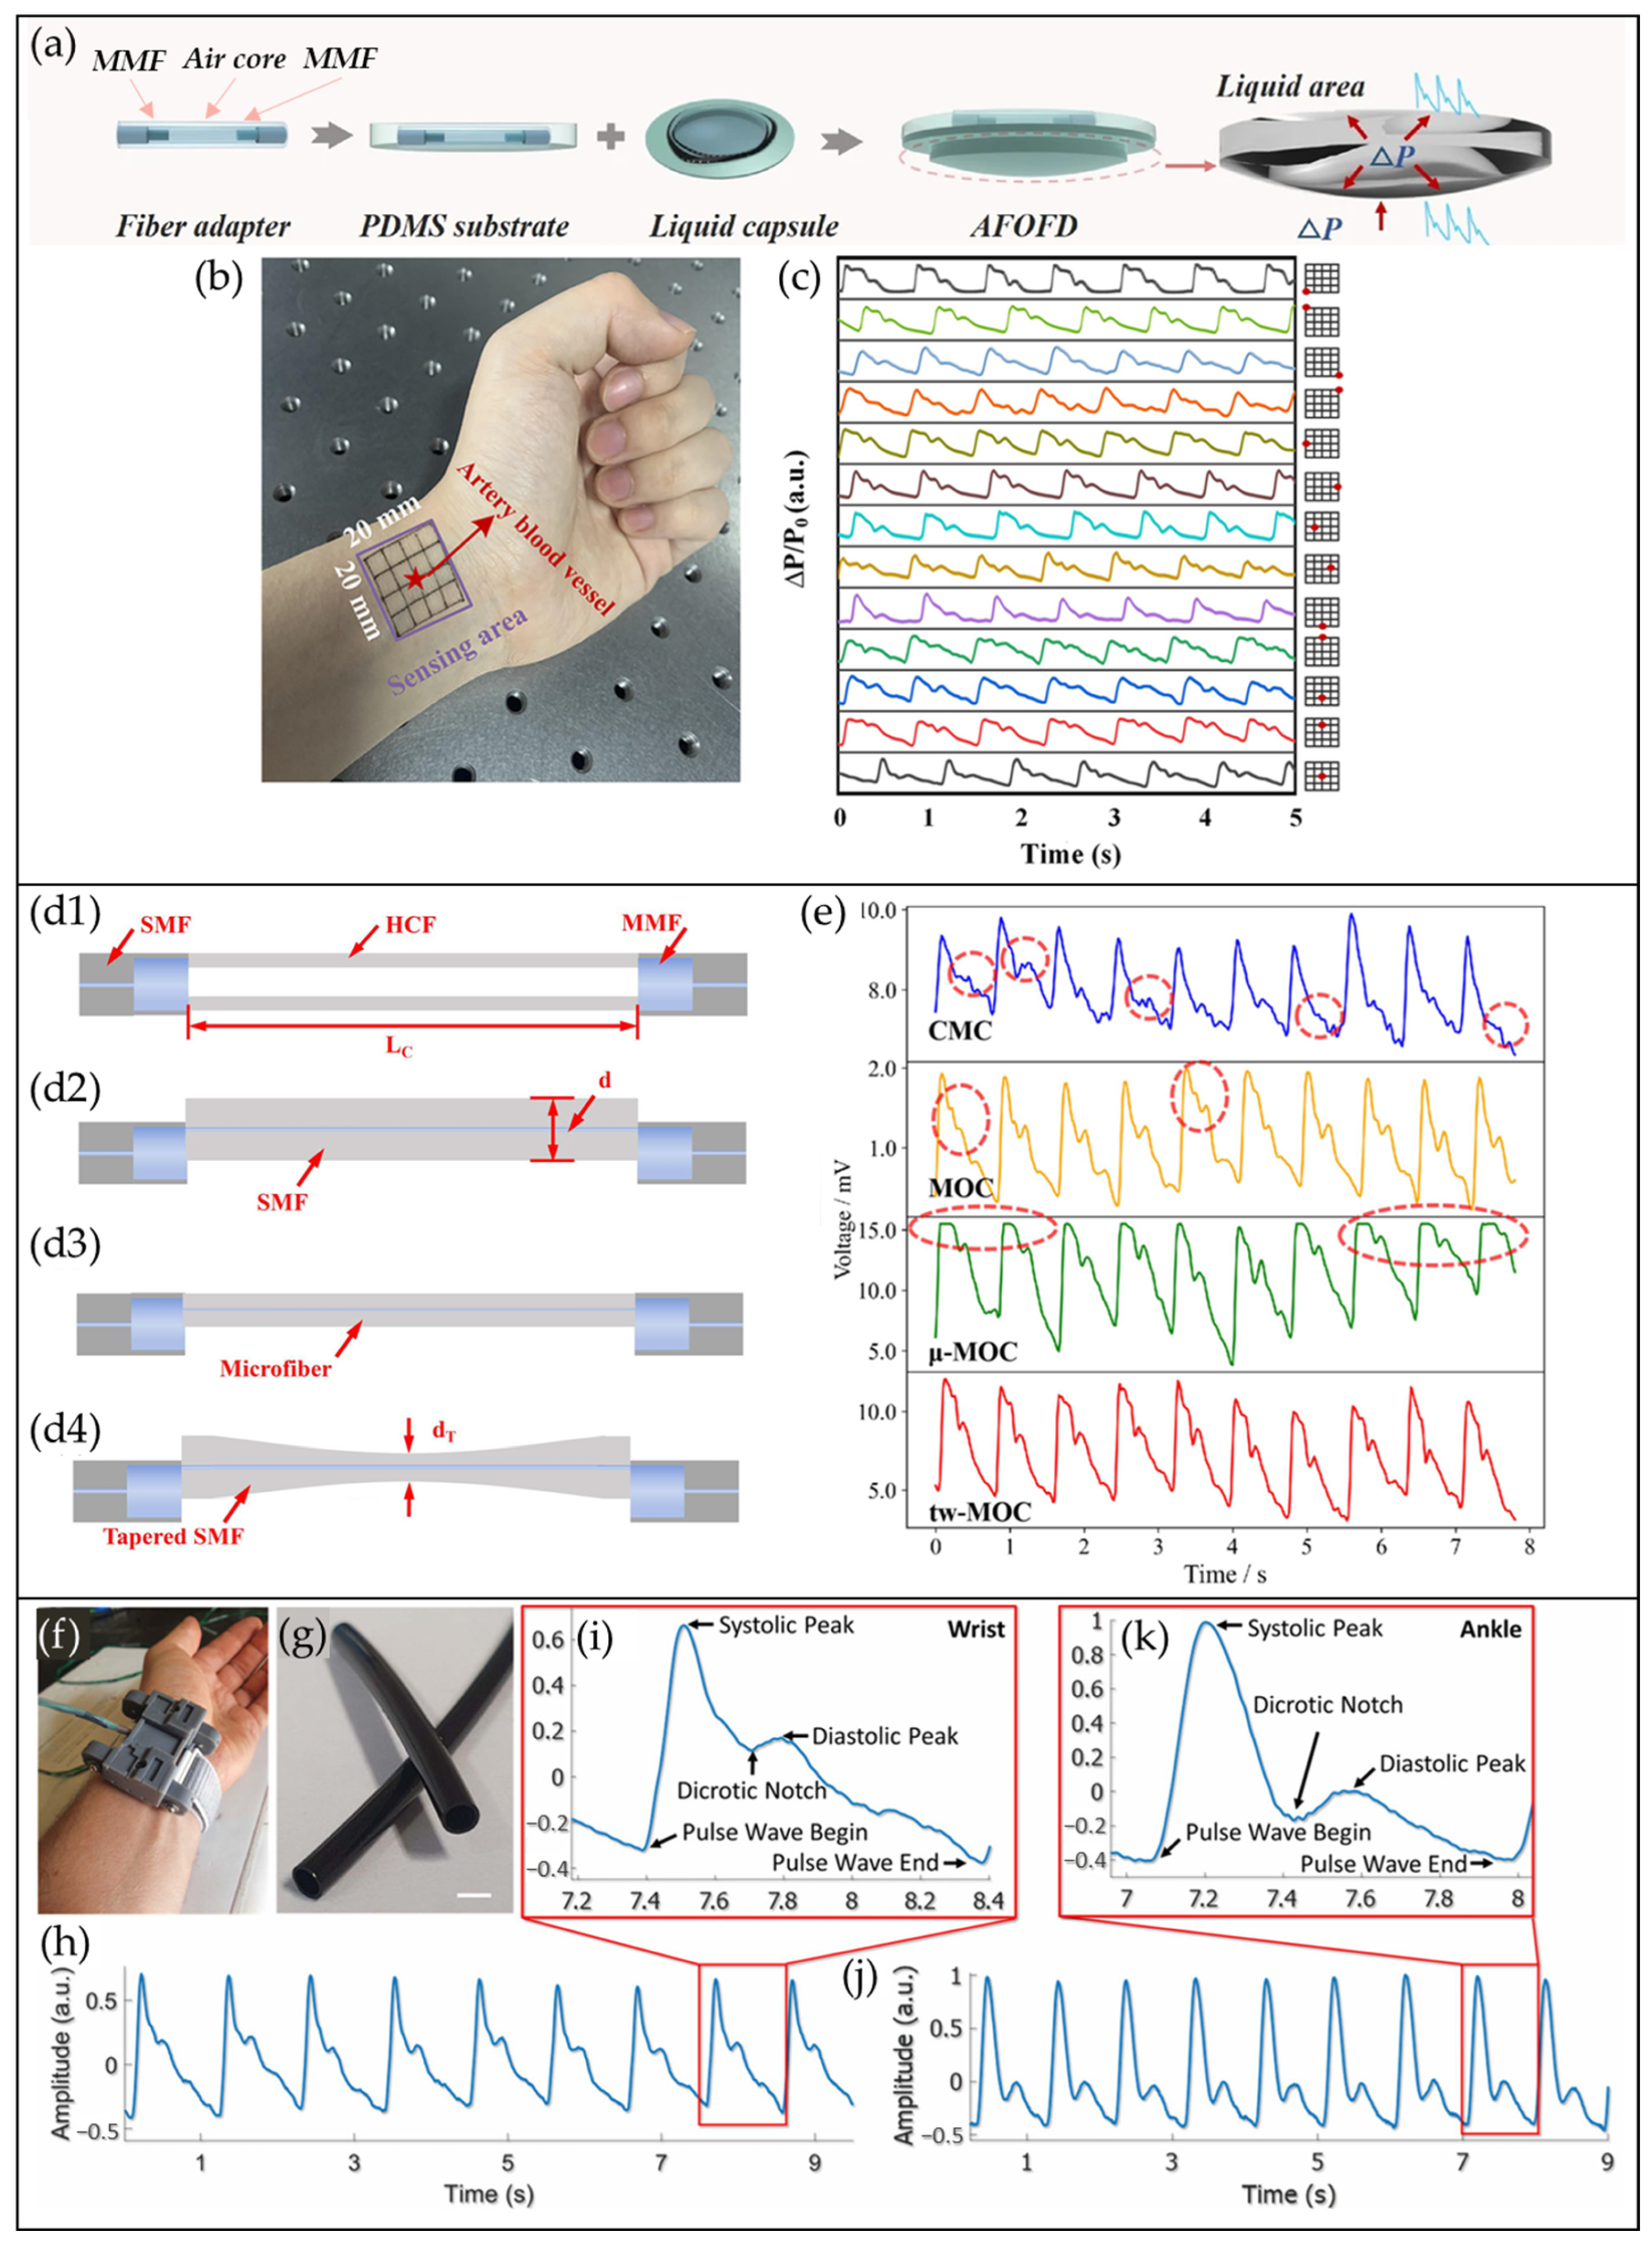
4.3. COF-Based Pulse Waveform Sensors

The investigation of COF sensors for arterial pulse measurement is intriguing. Various studies have focused on optimizing the type, length, or shape of the sensing optical fibers to enhance their sensitivities as well as their resolutions in response to physical bending caused by arterial pulsation. Li et al. presented a COF sensor that comprises an air-core fiber spliced between two MMFs for a sensitive pulse signal sensor [7]. This sensor is protected by a polyethylene (PE) tube and PDMS thin film to make it physically robust. To improve the detection of the arterial pulse signal, they attached the COF sensor on a liquid capsule, which has a diameter of 20 mm, as depicted in Figure 11a. The large-diameter liquid capsule makes the sensor alignment-free and spatial-insensitive due to Pascal’s principle. The evidence is shown in Figure 11b,c. Their proposed sensor was placed at different places in the wrist region. No distortion of pulse waveform signals caused by position drift could be observed. Thus, it was integrated into a wearable smartwatch for continuous BP monitoring. Apart from air-core fiber, Yang’s group investigated the performance of four different types of sensing fiber structures to detect human pulse signals [76], as shown in Figure 11d1 to 11d4. The four sensors were named, according to their fiber structures, closed-microcavity (CMC), micro-open-cavity (MOC), microfiber-assisted microcavity (µ-MOC), and tapered-waveguide assisted microcavity (tw-MOC) structures, which are illustrated in Figure 11d1, 11d2, 11d3, and 11d4, respectively. Figure 11e shows the pulse signal response of these sensors. The µ-MOC showed the largest pulse signal amplitude that could be achieved with a distorted waveform, which may affect the PWA. Among them, the tw-MOC showed the best performance in terms of waveform fidelity and sensitivity. With the aid of algorithm, their sensor achieved low error margin of 0.04 ± 2.44 mmHg and 0.05 ± 2.52 mmHg for SBP and DBP, respectively, adhering to the criteria set by AAMI. However, the ability of such a COF fabrication to maintain a similar tapered shape is still a concern in spite of its sensing performance. While most of the research works on the telecommunication wavelength window, Stefani et al. utilized an air-core polyurethane (PU) optical fiber that works on the visible light wavelength window [72]. The sensing fiber was colored black (Figure 11g) to absorb stray light that enters or was scattered into the air-core. In addition, they managed to integrate a red light source, PU optical fiber, and detector into a 3-D-printed frame, as shown in Figure 11f, realizing a wearable pulse sensor. By measuring the variation of power due to pulsation, pulse signals from the wrist and ankle were obtained with relatively high sensitivities, as shown in Figure 11h,k, respectively. This work opens an opportunity to build an OFS using components that work in the visible wavelength range. Table 5 summarizes the recent progress of COF sensors in acquiring an arterial pulse signal.

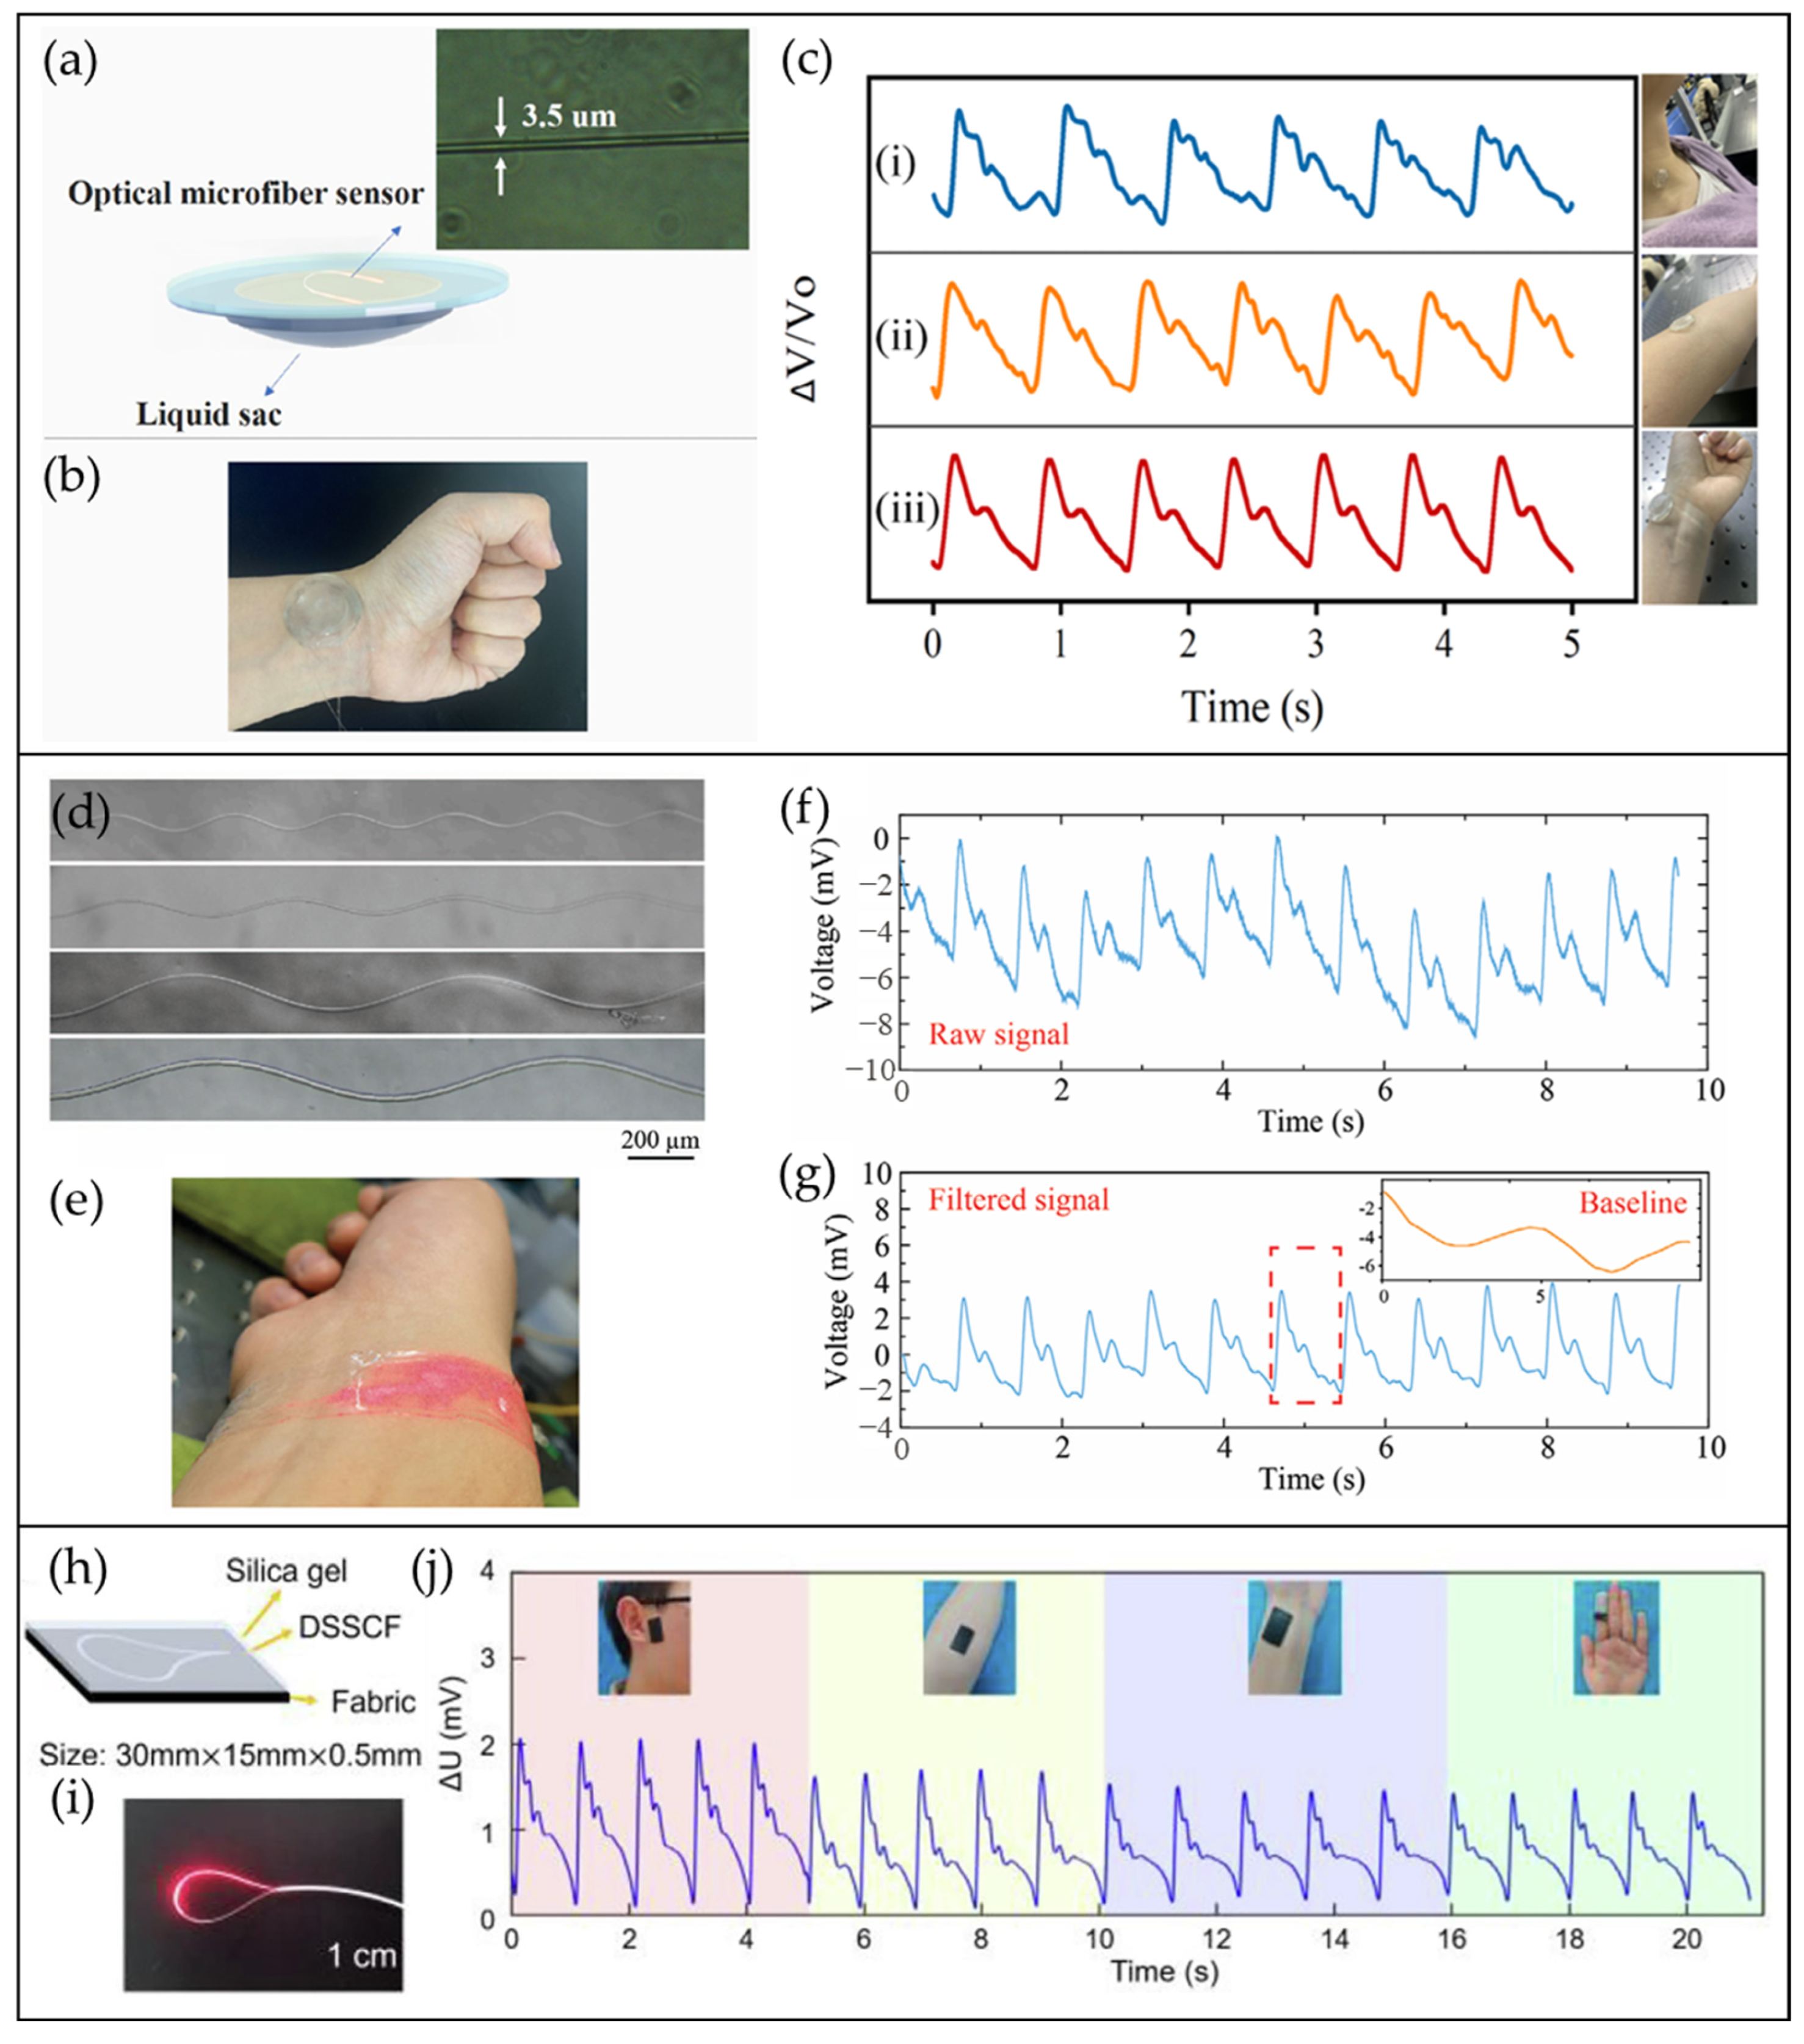
4.4. MBF/µBF-Based Pulse Waveform Sensors

In this section, we discuss bent fiber sensors based on three different structures: U-shaped, wavy, and loop structures. In 2022, Li et al. proposed a wearable alignment-free MBF sensor using a U-shaped microfiber structure, as shown in Figure 12a [30]. They, firstly, embed the U-shaped microfiber in PDMS. Afterwards, it was placed on a PDMS liquid sac filled with a non-toxic glycerol solution. This liquid sac can transfer the pulsation from the skin to the fiber based on Pascal’s principle, achieving an alignment-free sensor. This sensor can be placed on the wrist easily to measure the radial artery pulse, as shown in Figure 12b. Furthermore, this sensor can achieve a fast response time of 12 ms with a high sensitivity of −0.22 kPa−1 for pressures between 0 and 2 kPa. Figure 12c shows the utilization of the sensor for arterial pulse measurement at the carotid, brachial, and radial artery sites. The graphs show its capability in producing a high-fidelity pulse waveform, which is favorable for further PWA. For example, they showed that the K -value had a linear increment relationship with the age of the volunteer. This indicates that the elderly shows a larger degree of vascular sclerosis compared to young adults. Next, Zhu et al. demonstrated a method to fabricate a self-assembled wavy optical microfiber on PDMS for stretchable wearable OFSs [29]. A microfiber was glued on a pre-stretched PDMS thin film. By releasing the PDMS, the microfiber deformed into a wavy structure, as seen in Figure 12d. Then, the wavy microfiber was embedded by brushing a thin layer of PDMS, forming a wearable, wavy µBF sensor (Figure 12e). It can obtain a high-resolution pulse signal from the radial artery, as shown in Figure 12f,g, which allows continuous monitoring of the blood pressure of a volunteer for 3 days. The final structure to discuss is an MBF sensor with a loop structure. A small core fiber with a diameter of 56.5 µm is sandwiched between a silica gel thin film and fabric, as shown in Figure 12h. Figure 12i shows the image of an MBF with a loop structure guiding a 650 nm optical signal. This sensor is highly flexible and sensitive to external pressure. For example, it exhibits a high sensitivity of 2.2 kPa−1 at pressures below 200 Pa [99]. Figure 12j shows the high-resolution pulse waveform measured at different arterial locations. In addition, the authors studied the performance of their sensor by placing it on five fingertips. The results showed that it was sensitive enough to measure the pulse signals at every fingertip as well. Table 6 summarizes the recent arterial pulse waveform measurement using MBF and µBF sensors.

4.5. CRF-Based Pulse Waveform Sensors

Research into CRF-based arterial pulse sensors remains limited, with only a small number of studies exploring this application to date. Recently, Zhang et al. demonstrated a polymer-based CRF combined with a micro-bent structure to produce an OFS which is sensitive to external force [61]. As illustrated in Figure 13a, a structural grating was formed by removing the cladding of a PMMA fiber using a CO2 laser. This fiber was bent into a U-shaped structure with a polyvinyl chloride (PVC) hollow elastic tube as a support. After encapsulating this assembly with a thermoplastic tube, it was woven onto polyester yarns to yield a final sensing product with a size of 15 cm × 10 cm. Figure 13b shows the radial artery signal measured by the OFS. Three pulse wavelets, i.e., percussion, tidal, and dicrotic waves, were clearly discernible, which is suitable for daily health monitoring applications. Besides, the performance of a D-shaped fiber in acquiring an arterial pulse signal was also investigated. Figure 13c shows the schematic diagram of a D-shaped fiber sensor, which is sensitive to changes in curvature [62]. To protect the fragile CRF, it was embedded in PDMS thin film, as shown in Figure 13d,e. This sensor was strapped onto a wristband for pulse waveform measurement, as shown in Figure 13f,g. Figure 13h shows the obtained pulse data from the wrist of a volunteer. The filtered data have moderate resolutions, and can be used for PWA. Table 7 shows the summary of recent progress of CRF sensors for pulse waveform monitoring applications.

4.6. Other Types of OFS for Pulse Waveform Monitoring

In addition to the OFSs mentioned above, other innovative methods have been developed to measure the arterial pulse signals using different working mechanisms. These mechanisms include coupled mode theory [101], the self-mixing interference technique [102], upconversion luminescence [103], and speckle analysis [104]. This section provides an overview of their respective principles and outcomes.
Wang’s group fabricated a PDMS-embedded microfiber coupler, as shown in Figure 14a1 [101]. This OFS with a size of 20 mm × 50 mm × 0.25 mm was highly sensitive to the external strain that was applied to it. The external strain changed the coupling ratio of the OFS. The coupling ratio, denoted as CR, is defined as the ratio of optical power P3 to the total output power P3 and P4, as shown in Figure 14a1. The value of CR could be measured according to the coupled mode theory. The rhythmic vibration from the artery alters the coupling coefficient and coupling length of the coupler, thereby changing the CR. The pulse signals at various arterial locations can be reconstructed by evaluating the value of CR, as shown in Figure 14a2. Furthermore, the authors showed the ability of their sensor in monitoring the arterial pulse and human voice signals simultaneously. This proposed sensor can be an alternative for personal health monitoring. In another work, instead of fabricating a microfiber coupler, Liang et al. proposed a simple microfiber structure for monitoring pulse signals, as shown in Figure 14b1 [102]. The microfiber was embedded in the PDMS, which was affixed to the wrist. This setup was integrated with an FP benchtop laser source with a built-in photodiode, data acquisition card, and computer for signal processing. As light travels in the optical fiber, Fresnel reflection occurs at the fiber tip. The pulse vibration changes the phase of the reflected (or feedback) light, and self-mixing interference will happen when the light propagates back into the laser cavity. The output power of the laser varies with the phase of the reflected light, which allows the measurement of the pulse signal, as shown in Figure 14b2. The errors obtained for SBP and DBP were (−0.222 ± 2.636) mmHg and (−1.056 ± 2.198) mmHg, respectively, both of which comply with the AAMI standard. However, the disadvantage of this method is that only a limited laser source with a built-in photodetector can utilize this process to measure the pulse wave.
In 2025, Guo et al. demonstrated a multi-functional photonic sensor that measures vital signs such as heart rate, respiration rate, temperature, and sweat pH [103]. The sensor is a highly flexible hydrogel-coated PDMS optical fiber (HPOF) with its core doped with lanthanide-based upconversion nanoparticles (UCNPs), as illustrated in Figure 14c1. The UCNP comprises a luminescent core of NaYF4:Yb,Er surrounded by an inert shell of NaYF4, while the hydrogel cladding is doped with a fluorescent dye named pHrodo Red. Essentially, these UCNPs generated visible light at wavelengths of 525 nm, 545 nm, and 655 nm when they are excited by 980 nm light. Meanwhile, the red dye absorbed the wavelength between 500 nm and 600 nm. Upon 980 nm excitation, the UCNPs generated upconversion luminescence that propagates in both forward and backward directions along the HPOF, as shown in Figure 14c2. The backward emissions were absorbed by the dye molecules in the cladding, causing emission attenuation detected at the front end. The interaction length of the backward emission with the dye molecules increased when the fiber was stretched, resulting in enlarged absorption, as shown in Figure 14c3. By evaluating the ratio of intensity of 545 nm light to 655 nm light, the pulsation from arteries could be determined, as shown in Figure 14c4. As a proof-of-concept demonstration, this HPOF sensor was able to obtain a pulse signal from human skin by detecting intensity variation, but the pulse waveform resolution may be an issue for PWA applications. Nevertheless, the authors showed a different method to obtain multiple vital signs simultaneously using a single OFS.
Lastly, Kuang et al. used a simple experimental setup which consists of a 650 nm laser, a flexible PMMA MMF sewn on a wristband, an industrial camera, and a computer for the measurement and analysis, as shown in Figure 14d1–d4 [104]. A speckle pattern was observed at the output end of the MMF, appearing as a granular pattern (or specklegram) generated by the interference between modes in the fiber, as depicted in Figure 14d4. A 30-s video was taken with the camera. Due to the arterial pulsation, variations in the mode coupling in the fiber occurred, varying the distribution of the speckle field. By analyzing the speckle pattern, a pulse signal over 30 s could be reconstructed, as shown in Figure 14d5. However, for accurate speckle analysis, an effective algorithm is needed. This indicates that the analysis is time consuming. In fact, the signal processing the 30-s video may take up to 100 s [104]. This speckle analysis method can be a low-cost pulse monitoring alternative, given that the time delay in reconstructing the pulse signal is not a concern.

5. Challenges and Opportunities

This section provides a comprehensive summary of the recent use of OFSs in pulse waveform monitoring categorized by their working mechanisms, device structures, and type of measurements. OFSs offer advantages in terms of high accuracy and resistance to electromagnetic interference, making them an ideal choice for specific scenarios such as sensing during magnetic resonance imaging in hospitals. For example, OFSs such as FBG and bent fiber sensors can capture pulse wave signals with high sensitivity. In terms of fabrication repeatability, FBG and bent fiber sensors are superior to other OFSs such as FPI or COF sensors, which require more stringent fabrication control to maintain the cavity length. From an engineering standpoint, FBG sensors excel in robustness as the sensing region does not involve modifications of the physical structures, such as splicing or removing the cladding region, which would weaken the mechanical strength of the sensors. In addition, OFSs based on FBG, COF, bent fiber, and CRF working principles can be integrated into wearable devices, highlighting their potential for everyday personal health monitoring. The next subsections discuss some general challenges and opportunities for OFSs and their sensing systems in medical applications. There are certain areas where the design of OFSs and the sensing systems can be improved to enhance their effectiveness as clinical or personal tools.

5.1. Environmental Robustness and Signal Integrity

Although OFSs can detect pulse signals with high fidelity, they are vulnerable to motion artefacts (such as those from exercise or daily activities) and instability in skin contact, which can lead to signal distortion and false peaks in pulse waveforms. Additionally, temperature fluctuations can lead to baseline drift in the signals. Current solutions often involve algorithm-based or artificial-intelligence-driven noise suppression, which increases the power requirements for wearable applications, although this is not an issue for benchtop OFS use in clinical settings. Emerging photonic engineering may offer promising alternatives, such as strain-engineered FBG with decoupled thermal response coefficients, to reduce the cross-interference effect in OFSs. Furthermore, bioinspired self-adhering architectures or microstructures can enhance skin attachment, which may mitigate signal distortion due to motion artefacts [105].

5.2. Wearability

Although a flexible substrate such as PDMS is often used to protect fragile OFS and offer a skin contact option, its breathability remains a concern for long-term user comfort. Epidermal sweat can cause frequent motion-induced displacement during prolonged wear, which in turn degrades signal quality. Integrating OFSs with flexible textile or microstructure elastomeric matrices could address this issue, as these materials ensure breathability while maintaining contact between the OFS and the skin [61].

5.3. Miniaturization and Power Efficiency

Bulky and power-intensive optical source and interrogation systems remain major obstacles to scalability. Transitioning from benchtop setups to a chip-based configuration can address these challenges. Silicon photonics presents a viable approach, as compact arrayed waveguide gratings with monolithically integrated vertical-cavity surface-emitting lasers can deliver comparable resolutions with reduced power consumption [106,107]. This approach allows the system to be battery-powered, facilitating miniaturization.

5.4. Toward Multimodal Diagnostics and Clinical Adoption

Pulse waveform monitoring provides features that can effectively indicate straightforward health conditions such as BP, but it may not provide sufficient information for complex conditions. Designing or developing OFSs for multifunctional sensing presents an opportunity for clinical adoption. Achieving this requires close multidisciplinary collaboration with clinicians and material scientists to identify application needs and innovation opportunities. Furthermore, ensuring that the device is user-friendly is essential so that all users can operate the OFSs easily and safely.

5.5. Self-Calibration Measures

The lack of standardization protocols undermines sensor-to-sensor reproducibility, particularly when comparing data across different institutions. To address this issue, self-referencing techniques should be utilized to enable drift compensation without relying on external calibrators. Self-calibration is essential for ensuring measurement consistency and accuracy when OFSs are commercialized for personal or clinical uses.
In summary, we have discussed the challenges and opportunities for OFSs in personal and clinical applications from our perspective. Key issues to consider for maintaining signal integrity include motion artefacts or motion-induced displacement of the sensor. As the development of OFSs for wearables or domestic use gains momentum, it is important to focus on the miniaturization of their sources and demodulators, as well as enhancing their self-calibration capabilities. We believe that OFSs hold great potential as high-resolution health monitoring devices to overcome certain global health problems.

6. Conclusions

In this review, we systematically summarized the recent advancements in optical fiber sensing technologies based on various approaches such as FBG, FPI, COF, bent fiber, and CRF for applications in personalized or clinical medicine. Optical sensing has garnered increasing attention in pulse waveform monitoring, particularly in the PWA and BP measurement, which reflect the health of a person’s arteries. These advancements have been driven by improvements in optical fiber fabrication and enhanced manufacturing platforms. We discussed and tabulated the sensors’ sensitivities, waveform resolutions, sizes, and deployment types in Section 4. For example, FBG and bent fiber sensors excel in waveform resolution and fabrication repeatability, while bent fiber and CRF sensors demonstrate relatively higher sensitivity compared to other OFSs. We hope that this comprehensive review provides guidance and inspiration for developing new OFSs that offer high resolution, ease of use, and long-term stability.
Translating OFS technology from a laboratory environment to a commercially viable product demands a holistic evaluation of technical, operational, and market-oriented factors. From an engineering perspective, ensuring device robustness is critical, as commercial applications often involve harsher environmental conditions (e.g., temperature fluctuations, mechanical stress, or electromagnetic interference) compared to controlled lab settings. Concurrently, signal integrity must be rigorously maintained to guarantee accurate data acquisition and transmission over extended periods, which is vital for applications in fields such as continuous health monitoring or industrial safety systems.
Algorithm-based signal processing plays a pivotal role in mitigating noise and preserving data quality, but this approach must be carefully optimized. For instance, while advanced machine learning algorithms can enhance signal clarity, their computation demands may conflict with the need for low power consumption in portable or wearable devices. Striking this balance is essential to enable miniaturization, as reduced energy requirements allow for smaller battery designs, thereby supporting long-term, untethered operation in real-world scenarios.
In addition, advancements in affordable optoelectronic components, such as compact semiconductor lasers, energy-efficient electronics, and miniaturized microcontrollers, are revolutionizing OFS design. These innovations not only shrink the physical footprint of optical sources and signal integration systems but also lower production costs, making the technology accessible for broader applications. Collaboration with clinicians is crucial to identify real-world application needs, rather than focusing solely on sensor performance. Therefore, extensive investigations and validations will be necessary for successful commercialization and clinical adoption. Ultimately, OFSs have the potential to become widely used health assessment devices in both hospital and home settings.

Author Contributions

Conceptualization, J.W.C. and J.C.; writing—original draft preparation, J.W.C.; writing—review and editing, S.X.G., J.C. and W.D.C.; supervision, H.-Y.T. and S.T.C. All authors have read and agreed to the published version of the manuscript.

Funding

This research was funded by The Hong Kong Polytechnic University (UGC 1-CDJ0), Hong Kong Baptist University (H-ZL26), and the Department of Science and Technology of Guangdong Province (K-ZGAR).

Institutional Review Board Statement

Not applicable.

Informed Consent Statement

Not applicable.

Data Availability Statement

Data sharing is not applicable to this article.

Conflicts of Interest

The authors declare no conflicts of interest.

References

  1. World Health Organization. Global Report on Hypertension: The Race Against a Silent Killer; World Health Organization: Geneva, Switzerland, 2023. [Google Scholar]
  2. Zhou, B.; Perel, P.; Mensah, G.A.; Ezzati, M. Global epidemiology, health burden and effective interventions for elevated blood pressure and hypertension. Nat. Rev. Cardiol. 2021, 18, 785–802. [Google Scholar] [CrossRef] [PubMed]
  3. Scardulla, F.; Cosoli, G.; Spinsante, S.; Poli, A.; Iadarola, G.; Pernice, R.; Busacca, A.; Pasta, S.; Scalise, L.; D’Acquisto, L. Photoplethysmograhic sensors, potential and limitations: Is it time for regulation? A comprehensive review. Measurement 2023, 218, 113150. [Google Scholar] [CrossRef]
  4. Samartkit, P.; Pullteap, S. Non-invasive continuous blood pressure sensors in biomedical engineering research: A review. Sens. Actuators A Phys. 2024, 367, 115084. [Google Scholar] [CrossRef]
  5. Pang, Y.-N.; Liu, B.; Liu, J.; Wan, S.-P.; Wu, T.; Yuan, J.; Xin, X.; He, X.-D.; Wu, Q. Singlemode-multimode-singlemode optical fiber sensor for accurate blood pressure monitoring. J. Light. Technol. 2022, 40, 4443–4450. [Google Scholar] [CrossRef]
  6. Chen, J.; Zhang, Y.; Liu, B.; Liu, J.; Yang, H.; Hu, Y.; Fu, Y.; Wu, Q. Optical microfiber intelligent watchband for cuffless blood pressure monitoring. Sens. Actuators A Phys. 2025, 386, 116325. [Google Scholar] [CrossRef]
  7. Li, L.; Sheng, S.; Liu, Y.; Wen, J.; Song, C.; Chen, Z.; Xu, W.; Zhang, Z.; Fan, W.; Chen, C. Automatic and continuous blood pressure monitoring via an optical-fiber-sensor-assisted smartwatch. PhotoniX 2023, 4, 21. [Google Scholar] [CrossRef]
  8. Ding, X.; Zhang, Y.-T. Pulse transit time technique for cuffless unobtrusive blood pressure measurement: From theory to algorithm. Biomed. Eng. Lett. 2019, 9, 37–52. [Google Scholar] [CrossRef]
  9. Sharma, M.; Barbosa, K.; Ho, V.; Griggs, D.; Ghirmai, T.; Krishnan, S.K.; Hsiai, T.K.; Chiao, J.-C.; Cao, H. Cuff-less and continuous blood pressure monitoring: A methodological review. Technologies 2017, 5, 21. [Google Scholar] [CrossRef]
  10. Pant, S.; Umesh, S.; Asokan, S. A novel approach to acquire the arterial pulse by finger plethysmography using fiber Bragg grating sensor. IEEE Sens. J. 2020, 20, 5921–5928. [Google Scholar] [CrossRef]
  11. Leitão, C.S.J.; da Costa Antunes, P.F.; Bastos, J.A.; Pinto, J.; de Brito André, P.S. Plastic optical fiber sensor for noninvasive arterial pulse waveform monitoring. IEEE Sens. J. 2014, 15, 14–18. [Google Scholar] [CrossRef]
  12. Chen, Y.; Zhang, L.; Zhang, D.; Zhang, D. Wrist pulse signal diagnosis using modified Gaussian models and Fuzzy C-Means classification. Med. Eng. Phys. 2009, 31, 1283–1289. [Google Scholar] [CrossRef]
  13. Fan, L.; Zhang, J.C.; Wang, Z.; Zhang, X.; Yao, R.; Li, Y. Application research of pulse signal physiology and pathology feature mining in the field of disease diagnosis. Comput. Methods Biomech. Biomed. Eng. 2022, 25, 1111–1124. [Google Scholar] [CrossRef]
  14. Zhang, Q.; Zhou, J.; Zhang, B. Computational traditional Chinese medicine diagnosis: A literature survey. Comput. Biol. Med. 2021, 133, 104358. [Google Scholar] [CrossRef]
  15. World Health Organization. WHO International Standard Terminologies on Traditional Chinese Medicine; World Health Organization: Geneva, Switzerland, 2022; pp. 83–93. [Google Scholar]
  16. Maciocia, G. The Foundations of Chinese Medicine: A Comprehensive Text; Elsevier Health Sciences: Amsterdam, The Netherlands, 2015; pp. 373–396. [Google Scholar]
  17. Bing, Z.; Hongcai, W. Diagnostics of Traditional Chinese Medicine; Singing Dragon: London, UK, 2010; pp. 89–112. [Google Scholar]
  18. Choong, C.L.; Shim, M.B.; Lee, B.S.; Jeon, S.; Ko, D.S.; Kang, T.H.; Bae, J.; Lee, S.H.; Byun, K.E.; Im, J. Highly stretchable resistive pressure sensors using a conductive elastomeric composite on a micropyramid array. Adv. Mater. 2014, 26, 3451–3458. [Google Scholar] [CrossRef]
  19. Chen, J.; Zhang, J.; Hu, J.; Luo, N.; Sun, F.; Venkatesan, H.; Zhao, N.; Zhang, Y. Ultrafast-response/recovery flexible piezoresistive sensors with DNA-like double helix yarns for epidermal pulse monitoring. Adv. Mater. 2022, 34, 2104313. [Google Scholar] [CrossRef]
  20. Schwartz, G.; Tee, B.C.-K.; Mei, J.; Appleton, A.L.; Kim, D.H.; Wang, H.; Bao, Z. Flexible polymer transistors with high pressure sensitivity for application in electronic skin and health monitoring. Nat. Commun. 2013, 4, 1859. [Google Scholar] [CrossRef]
  21. Qu, X.; Zhang, S.; Zhu, Z.; Han, Z.; Li, J.; Deng, L.; Zhou, Z.; Zhang, T.; Guan, M.; Wang, H. Low modulus coupling circuits: A feasible strategy for achieving highly sensitive linear pressure sensing in fiber crossbars. Adv. Funct. Mater. 2024, 34, 2405099. [Google Scholar] [CrossRef]
  22. Lin, Q.; Huang, J.; Yang, J.; Huang, Y.; Zhang, Y.; Wang, Y.; Zhang, J.; Wang, Y.; Yuan, L.; Cai, M. Highly sensitive flexible iontronic pressure sensor for fingertip pulse monitoring. Adv. Healthc. Mater. 2020, 9, 2001023. [Google Scholar] [CrossRef]
  23. Chu, Y.; Zhong, J.; Liu, H.; Ma, Y.; Liu, N.; Song, Y.; Liang, J.; Shao, Z.; Sun, Y.; Dong, Y. Human pulse diagnosis for medical assessments using a wearable piezoelectret sensing system. Adv. Funct. Mater. 2018, 28, 1803413. [Google Scholar] [CrossRef]
  24. Nie, J.; Zhang, L.; Liu, J.; Wang, Y. Pulse taking by a piezoelectric film sensor via mode energy ratio analysis helps identify pregnancy status. IEEE J. Biomed. Health Inform. 2021, 26, 2116–2123. [Google Scholar] [CrossRef]
  25. Dagdeviren, C.; Su, Y.; Joe, P.; Yona, R.; Liu, Y.; Kim, Y.-S.; Huang, Y.; Damadoran, A.R.; Xia, J.; Martin, L.W. Conformable amplified lead zirconate titanate sensors with enhanced piezoelectric response for cutaneous pressure monitoring. Nat. Commun. 2014, 5, 4496. [Google Scholar] [CrossRef]
  26. Wang, X.; Yang, J.; Meng, K.; He, Q.; Zhang, G.; Zhou, Z.; Tan, X.; Feng, Z.; Sun, C.; Yang, J. Enabling the unconstrained epidermal pulse wave monitoring via finger-touching. Adv. Funct. Mater. 2021, 31, 2102378. [Google Scholar] [CrossRef]
  27. Kim, J.; Salvatore, G.A.; Araki, H.; Chiarelli, A.M.; Xie, Z.; Banks, A.; Sheng, X.; Liu, Y.; Lee, J.W.; Jang, K.-I. Battery-free, stretchable optoelectronic systems for wireless optical characterization of the skin. Sci. Adv. 2016, 2, e1600418. [Google Scholar] [CrossRef]
  28. Zhou, Y.; Zhao, X.; Xu, J.; Fang, Y.; Chen, G.; Song, Y.; Li, S.; Chen, J. Giant magnetoelastic effect in soft systems for bioelectronics. Nat. Mater. 2021, 20, 1670–1676. [Google Scholar] [CrossRef]
  29. Zhu, H.T.; Zhan, L.W.; Dai, Q.; Xu, B.; Chen, Y.; Lu, Y.Q.; Xu, F. Self-assembled wavy optical microfiber for stretchable wearable sensor. Adv. Opt. Mater. 2021, 9, 2002206. [Google Scholar] [CrossRef]
  30. Li, L.; Liu, Y.; Song, C.; Sheng, S.; Yang, L.; Yan, Z.; Hu, D.J.J.; Sun, Q. Wearable alignment-free microfiber-based sensor chip for precise vital signs monitoring and cardiovascular assessment. Adv. Fiber Mater. 2022, 4, 475–486. [Google Scholar] [CrossRef]
  31. Wang, J.; Liu, K.; Sun, Q.; Ni, X.; Ai, F.; Wang, S.; Yan, Z.; Liu, D. Diaphragm-based optical fiber sensor for pulse wave monitoring and cardiovascular diseases diagnosis. J. Biophotonics 2019, 12, e201900084. [Google Scholar] [CrossRef]
  32. Meng, K.; Xiao, X.; Wei, W.; Chen, G.; Nashalian, A.; Shen, S.; Xiao, X.; Chen, J. Wearable pressure sensors for pulse wave monitoring. Adv. Mater. 2022, 34, 2109357. [Google Scholar] [CrossRef]
  33. Nedoma, J.; Fajkus, M.; Novak, M.; Strbikova, N.; Vasinek, V.; Nazeran, H.; Vanus, J.; Perecar, F.; Martinek, R. Validation of a novel fiber-optic sensor system for monitoring cardiorespiratory activities during mri examinations. Adv. Electr. Electron. Eng. 2017, 15, 536. [Google Scholar] [CrossRef]
  34. Silva, A.; Carmo, J.; Mendes, P.; Correia, J. Simultaneous cardiac and respiratory frequency measurement based on a single fiber Bragg grating sensor. Meas. Sci. Technol. 2011, 22, 075801. [Google Scholar] [CrossRef]
  35. Lu, L.; Cui, J.; Nawarathne, D.D.; Tam, H.-Y. Magnetic field sensing with magnetic shape memory alloy and fiber Bragg grating on silica and polymer optical fibers. IEEE Trans. Instrum. Meas. 2025, 74, 7007008. [Google Scholar] [CrossRef]
  36. Yu, Q.; Zhang, Y.n.; Jiang, L.; Li, L.; Li, X.; Zhao, J. Flexible optical fiber sensor for non-invasive continuous monitoring of human physiological signals. Small Methods 2025, 9, 2401368. [Google Scholar] [CrossRef]
  37. Zhao, J.; Zhang, S.; Sun, Y.; Zhou, N.; Yu, H.; Zhang, H.; Jia, D. Wearable optical sensing in the medical internet of things (MIoT) for pervasive medicine: Opportunities and challenges. ACS Photonics 2022, 9, 2579–2599. [Google Scholar] [CrossRef]
  38. Jia, D.; Chao, J.; Li, S.; Zhang, H.; Yan, Y.; Liu, T.; Sun, Y. A fiber Bragg grating sensor for radial artery pulse waveform measurement. IEEE Trans. Biomed. Eng. 2017, 65, 839–846. [Google Scholar] [CrossRef]
  39. Lo Presti, D.; Santucci, F.; Massaroni, C.; Formica, D.; Setola, R.; Schena, E. A multi-point heart rate monitoring using a soft wearable system based on fiber optic technology. Sci. Rep. 2021, 11, 21162. [Google Scholar] [CrossRef]
  40. Ferraro, D.; D’Alesio, G.; Camboni, D.; Zinno, C.; Costi, L.; Haberbusch, M.; Aigner, P.; Maw, M.; Schlöglhofer, T.; Unger, E. Implantable fiber Bragg grating sensor for continuous heart activity monitoring: Ex-vivo and in-vivo validation. IEEE Sens. J. 2021, 21, 14051–14059. [Google Scholar] [CrossRef]
  41. Wang, Z.; Chen, Z.; Ma, L.; Wang, Q.; Wang, H.; Leal-Junior, A.; Li, X.; Marques, C.; Min, R. Optical microfiber intelligent sensor: Wearable cardiorespiratory and behavior monitoring with a flexible wave-shaped polymer optical microfiber. ACS Appl. Mater. Interfaces 2024, 16, 8333–8345. [Google Scholar] [CrossRef]
  42. Bonefacino, J.; Tam, H.-Y.; Glen, T.S.; Cheng, X.; Pun, C.-F.J.; Wang, J.; Lee, P.-H.; Tse, M.-L.V.; Boles, S.T. Ultra-fast polymer optical fibre Bragg grating inscription for medical devices. Light Sci. Appl. 2018, 7, 17161. [Google Scholar] [CrossRef]
  43. Leal-Junior, A.G.; Marques, C. Diaphragm-embedded optical fiber sensors: A review and tutorial. IEEE Sens. J. 2020, 21, 12719–12733. [Google Scholar] [CrossRef]
  44. Liu, Y.; Wang, H.; Zhao, W.; Zhang, M.; Qin, H.; Xie, Y. Flexible, stretchable sensors for wearable health monitoring: Sensing mechanisms, materials, fabrication strategies and features. Sensors 2018, 18, 645. [Google Scholar] [CrossRef]
  45. Peng, N.; Meng, W.; Wei, Q.; Ai, Q.; Liu, Q.; Xie, S. Wearable optical fiber sensors for biomechanical measurement in medical rehabilitation: A review. IEEE Sens. J. 2023, 23, 12455–12469. [Google Scholar] [CrossRef]
  46. Zhu, H.; Luo, J.; Dai, Q.; Zhu, S.; Yang, H.; Zhou, K.; Zhan, L.; Xu, B.; Chen, Y.; Lu, Y. Spatiotemporal hemodynamic monitoring via configurable skin-like microfiber Bragg grating group. Opto-Electron. Adv. 2023, 6, 230018. [Google Scholar] [CrossRef]
  47. Liu, C.; Liu, Z.; Wang, P.; Peng, D.; Liu, Z. Flexible pressure sensor realized by a chirped fiber Bragg grating pair for vital signs monitoring. J. Light. Technol. 2025, 43, 4778–4786. [Google Scholar] [CrossRef]
  48. Li, Z.; Sun, L.P.; Tan, Y.; Wang, Z.; Yang, X.; Huang, T.; Li, J.; Zhang, Y.; Guan, B.O. Flexible optoelectronic hybrid microfiber long-period grating multimodal sensor. Adv. Sci. 2025, 12, 2501352. [Google Scholar] [CrossRef]
  49. Cheng, X.; Gunawardena, D.S.; Pun, C.-F.J.; Bonefacino, J.; Tam, H.-Y. Single nanosecond-pulse production of polymeric fiber Bragg gratings for biomedical applications. Opt. Express 2020, 28, 33573–33583. [Google Scholar] [CrossRef]
  50. Koyama, S.; Haseda, Y.; Ishizawa, H.; Okazaki, F.; Bonefacino, J.; Tam, H.-Y. Measurement of pulsation strain at the fingertip using a plastic FBG sensor. IEEE Sens. J. 2021, 21, 21537–21545. [Google Scholar] [CrossRef]
  51. Haseda, Y.; Bonefacino, J.; Tam, H.-Y.; Chino, S.; Koyama, S.; Ishizawa, H. Measurement of pulse wave signals and blood pressure by a plastic optical fiber FBG sensor. Sensors 2019, 19, 5088. [Google Scholar] [CrossRef]
  52. Martincek, I.; Tarjanyiova, G. Optical fiber Fabry-Perot interferometer for arterial pulse waveform measurement. IEEE Sens. J. 2024, 24, 25742–25747. [Google Scholar] [CrossRef]
  53. Wang, J.; Ai, F.; Sun, Q.; Liu, T.; Li, H.; Yan, Z.; Liu, D. Diaphragm-based optical fiber sensor array for multipoint acoustic detection. Opt. Express 2018, 26, 25293–25304. [Google Scholar] [CrossRef]
  54. Ma, J.; Xuan, H.; Ho, H.L.; Jin, W.; Yang, Y.; Fan, S. Fiber-optic Fabry–Pérot acoustic sensor with multilayer graphene diaphragm. IEEE Photonics Technol. Lett. 2013, 25, 932–935. [Google Scholar] [CrossRef]
  55. Guo, Y.; Wang, W.; Shi, G.; Wu, J.; Sun, D.; Ma, J. Optical smart wearable sensor: Pulse waveform and pulse rate monitoring with a flexible loop optic-microfiber. J. Light. Technol. 2024, 43, 1462–1468. [Google Scholar] [CrossRef]
  56. Jay, J.A. An overview of macrobending and microbending of optical fibers. White Pap. Corning 2010, WP1212, 17792593. [Google Scholar]
  57. Leal-Junior, A.G.; Diaz, C.R.; Jimenez, M.F.; Leitão, C.; Marques, C.; Pontes, M.J.; Frizera, A. Polymer optical fiber-based sensor system for smart walker instrumentation and health assessment. IEEE Sens. J. 2018, 19, 567–574. [Google Scholar] [CrossRef]
  58. Hu, H.-F.; Sun, S.-J.; Lv, R.-Q.; Zhao, Y. Design and experiment of an optical fiber micro bend sensor for respiration monitoring. Sens. Actuators A Phys. 2016, 251, 126–133. [Google Scholar] [CrossRef]
  59. Pollock, C.R. Fundamentals of Optoelectronics; Irwin Publishers: Burr Ridge, IL, USA, 1995; pp. 36–38. [Google Scholar]
  60. Punjabi, N.; Satija, J.; Mukherji, S. Evanescent Wave Absorption Based Fiber-Optic Sensor-Cascading of Bend and Tapered Geometry for Enhanced Sensitivity. In Sensing Technology: Current Status and Future Trends III; Mason, A., Mukhopadhyay, S.C., Jayasundera, K.P., Eds.; Springer: Cham, Switzerland, 2015; pp. 25–45. [Google Scholar]
  61. Zhang, C.; Gao, T.; Wen, X.; Li, Y.; Zhang, M.; Xu, J.; Li, H.; Su, H.; Sun, J. Force-sensitive optical fiber fabric based on hollow elastic tube and structural grating. Opt. Laser Technol. 2025, 187, 112792. [Google Scholar] [CrossRef]
  62. Li, J.; Liu, B.; Liu, J.; Shi, J.-L.; He, X.-D.; Yuan, J.; Wu, Q. Low-cost wearable device based D-shaped single mode fiber curvature sensor for vital signs monitoring. Sens. Actuators A Phys. 2022, 337, 113429. [Google Scholar] [CrossRef]
  63. Lin, F.; Zhang, J.; Wang, Z.; Zhang, X.; Yao, R.; Li, Y. Research on feature mining algorithm and disease diagnosis of pulse signal based on piezoelectric sensor. Inform. Med. Unlocked 2021, 26, 100717. [Google Scholar] [CrossRef]
  64. Boron, W.F.; Boulpaep, E.L. Medical Physiology E-Book; Elsevier Health Sciences: Amsterdam, The Netherlands, 2016; pp. 509–513. [Google Scholar]
  65. Murgo, J.P.; Westerhof, N.; Giolma, J.P.; Altobelli, S.A. Aortic input impedance in normal man: Relationship to pressure wave forms. Circulation 1980, 62, 105–116. [Google Scholar] [CrossRef]
  66. Yang, T.; Jiang, X.; Zhong, Y.; Zhao, X.; Lin, S.; Li, J.; Li, X.; Xu, J.; Li, Z.; Zhu, H. A wearable and highly sensitive graphene strain sensor for precise home-based pulse wave monitoring. ACS Sens. 2017, 2, 967–974. [Google Scholar] [CrossRef]
  67. Xie, T.; Chen, H.; Xu, Z.; Huang, W.; Fu, H. High precision strain sensing system based on optoelectronic oscillator for human pulse monitoring. IEEE Sens. J. 2025, 25, 6355–6362. [Google Scholar] [CrossRef]
  68. Park, J.; Seok, H.S.; Kim, S.-S.; Shin, H. Photoplethysmogram analysis and applications: An integrative review. Front. Physiol. 2022, 12, 808451. [Google Scholar] [CrossRef] [PubMed]
  69. Chen, J.; Sun, K.; Zheng, R.; Sun, Y.; Yang, H.; Zhong, Y.; Li, X. Three-dimensional arterial pulse signal acquisition in time domain using flexible pressure-sensor dense arrays. Micromachines 2021, 12, 569. [Google Scholar] [CrossRef] [PubMed]
  70. Mitchell, G.F.; Conlin, P.R.; Dunlap, M.E.; Lacourcière, Y.; Arnold, J.M.O.; Ogilvie, R.I.; Neutel, J.; Izzo, J.L., Jr.; Pfeffer, M.A. Aortic diameter, wall stiffness, and wave reflection in systolic hypertension. Hypertension 2008, 51, 105–111. [Google Scholar] [CrossRef] [PubMed]
  71. Gurovich, A.N.; Braith, R.W. Pulse wave analysis and pulse wave velocity techniques: Are they ready for the clinic? Hypertens. Res. 2011, 34, 166–169. [Google Scholar] [CrossRef]
  72. Stefani, A.; Rukhlenko, I.D.; Runge, A.F.; Large, M.C.; Fleming, S.C. Wearable conformal fiber sensor for high fidelity physiological measurements. IEEE J. Sel. Top. Quantum Electron. 2023, 30, 1–9. [Google Scholar] [CrossRef]
  73. Zhou, Z.-B.; Cui, T.-R.; Li, D.; Jian, J.-M.; Li, Z.; Ji, S.-R.; Li, X.; Xu, J.-D.; Liu, H.-F.; Yang, Y. Wearable continuous blood pressure monitoring devices based on pulse wave transit time and pulse arrival time: A review. Materials 2023, 16, 2133. [Google Scholar] [CrossRef]
  74. Dai, P.; Cong, Z.; Sun, Y.; Yan, W.; Chen, P.; Wang, X.; Jiang, C. Bio-inspired flexible optical microfiber sensor with nanohemisphere array microstructure for ultra-sensitive detection of skin signals. Measurement 2024, 235, 114874. [Google Scholar] [CrossRef]
  75. Xiong, L.; Zhong, H.; Wan, S.; Yu, J. Single-point curved fiber optic pulse sensor for physiological signal prediction based on the genetic algorithm-support vector regression model. Opt. Fiber Technol. 2024, 82, 103583. [Google Scholar] [CrossRef]
  76. Li, J.; Zhang, H.; Zhang, Z.; Zhang, H.; Yang, X.; Yang, J. All-fiber wearable continues blood pressure monitoring via tapered waveguide and machine-learning assistance. IEEE Trans. Instrum. Meas. 2025, 74, 7004212. [Google Scholar] [CrossRef]
  77. Tang, Y.; Roberts, R.C.; Lam, C.H.M.; Wong, W.S.; Yang, M.; Lao, L.; Lee, W.-N. Design of a barometer-based pulse-taking device with in vivo validation against high-frequency ultrasound pulse wave imaging. IEEE Sens. J. 2022, 22, 7219–7230. [Google Scholar] [CrossRef]
  78. Wei, M.; Chen, Z.; Chen, G.; Huang, X.; Jin, Y.; Lao, K.; Li, Z.; Li, S.; Zhong, F.; Liang, H. A portable three-channel data collector for Chinese medicine pulses. Sens. Actuators A Phys. 2021, 323, 112669. [Google Scholar] [CrossRef]
  79. Zhang, Q.; Zhou, J.; Zhang, B. Graph based multichannel feature fusion for wrist pulse diagnosis. IEEE J. Biomed. Health Inform. 2020, 25, 3732–3743. [Google Scholar] [CrossRef] [PubMed]
  80. Nandi, M.; Venton, J.; Aston, P.J. A novel method to quantify arterial pulse waveform morphology: Attractor reconstruction for physiologists and clinicians. Physiol. Meas. 2018, 39, 104008. [Google Scholar] [CrossRef] [PubMed]
  81. Gowda, R.B.; Sharan, P.; Saara, K.; Braim, M.; Alodhayb, A.N. An FBG-based optical pressure sensor for the measurement of radial artery pulse pressure. J. Biophotonics 2024, 17, e202400083. [Google Scholar] [CrossRef]
  82. Qu, H.; Liang, W.; Cheng, X.; Tam, H.-Y.; Min, R.; Li, P.; Hu, X. Embedded POFBG for respiratory and heart rate measurement. IEEE Sens. J. 2024, 25, 4612–4619. [Google Scholar] [CrossRef]
  83. Shi, C.; Zhang, H.; Ni, X.; Wang, K. An FBG-based sensor with both wearable and handheld forms for carotid arterial pulse waveform measurement. IEEE Trans. Instrum. Meas. 2023, 72, 7506610. [Google Scholar] [CrossRef]
  84. Tang, Z.; Wang, S.; Shi, C. Development of a hybrid force-displacement sensor based on fiber Bragg grating for radial artery pulse waveform measurement. IEEE Sens. J. 2021, 21, 20045–20054. [Google Scholar] [CrossRef]
  85. Li, T.; Zhao, Z.; Li, X.; Tan, Y.; Zhou, Z. RSM-based data-driven optimized design of a 3-D-printed building block-type FBG tactile sensor for nursing robots. IEEE Trans. Instrum. Meas. 2023, 72, 4006513. [Google Scholar] [CrossRef]
  86. Shi, C.; Tang, Z.; Zhang, H.; Liu, Y. Development of an FBG-based wearable sensor for simultaneous respiration and heartbeat measurement. IEEE Trans. Instrum. Meas. 2022, 72, 1–9. [Google Scholar]
  87. Guo, J.; Wang, W.; Zhang, J.; Chen, H.; Chen, R.; Zhao, B.; Chen, D. Fiber cladding waveguide phase-shifted FBG encapsulated in flexible material for estimating human blood pressure. J. Light. Technol. 2024, 43, 3261–3268. [Google Scholar] [CrossRef]
  88. Guo, J.; Zhang, J.; Dong, L.; Du, Y.; Guo, Z.; Chen, H.; Chen, D.; Wang, W. Parallel waveguide fiber Bragg gratings–Used for detecting human respiratory rate, trunk status, and pulse. Opt. Laser Technol. 2025, 181, 111960. [Google Scholar] [CrossRef]
  89. Kumar, N.V.; Pant, S.; Sridhar, S.; Marulasiddappa, V.; Srivatzen, S.; Asokan, S. Fiber Bragg grating-based pulse monitoring device for real-time non-invasive blood pressure measurement—A feasibility study. IEEE Sens. J. 2021, 21, 9179–9185. [Google Scholar] [CrossRef]
  90. Taoping, S.; Zhichao, L. Design of pulse and respiration monitoring system based on fiber optic sensing and VMD-FPR processing algorithm. Opt. Fiber Technol. 2022, 73, 103033. [Google Scholar] [CrossRef]
  91. Koyama, S.; Yoda, T.; Yamamoto, M.; Shiokawa, S.; Kane, K.; Martinka, M. Verification of optimal installation point of FBG sensor for pulsation strain measurement. IEEE Sens. J. 2023, 23, 18183–18192. [Google Scholar] [CrossRef]
  92. Wang, J.; Wang, Z.; Zhang, Z.; Li, P.; Pan, H.; Ren, Y.; Hou, T.; Wang, C.; Kwong, C.-F.; Zhang, B. Simultaneous Measurement of Local Pulse Wave Velocities in Radial Arteries Using a Soft Sensor Based on the Fiber Bragg Grating Technique. Micromachines 2024, 15, 507. [Google Scholar] [CrossRef]
  93. Wang, Y.-J.; Wang, L. Blood pressure and heart rate measurements using fiber Bragg grating sensor with optical power detection scheme. Sensors 2025, 25, 2007. [Google Scholar] [CrossRef]
  94. Zhao, K.; Ma, G.; Wu, Z.; Wang, Q.; Zhong, S.; Chen, K.P. High resolution wearable FBG-based sensing device for cardiac rate and blood pressure monitoring. In Proceedings of the Optical Fibers and Sensors for Medical Diagnostics, Treatment, and Environmental Applications XXV, San Francisco, CA, USA, 20 March 2025; pp. 158–160. [Google Scholar]
  95. Xu, Y.; Gao, L.; Qian, C.; Wang, Y.; Liu, W.; Cai, X.; Liu, Q. Multi-channel sparse-frequency-scanning white-light interferometry with adaptive mode locking for pulse wave velocity measurement. Photonics 2025, 12, 316. [Google Scholar] [CrossRef]
  96. Ratanapanya, N.; Pullteap, S. A blood pressure measurement system using fiber optic-based Fabry-Perot interferometer. Opt. Lasers Eng. 2025, 184, 108667. [Google Scholar] [CrossRef]
  97. Takayama, R.; Nishiyama, M.; Koyama, Y. Wearable Textile Sensor Using Hetero-Core Optical Fiber for Blood Pressure Measurement. In Proceedings of the 2024 IEEE SENSORS, Kobe, Japan, 20–23 October 2024; pp. 1–4. [Google Scholar]
  98. Koyama, Y.; Kamada, H.; Watanabe, K.; Nishiyama, M. Cuff-less blood pressure estimation using hetero-core optical fibers. Electron. Commun. Jpn. 2024, 107, e12438. [Google Scholar] [CrossRef]
  99. Li, Z.; Tang, X.; Zhao, T.; Chen, K.; Zhang, T. Highly sensitive skin-like wearable optical sensor for human physiological signals monitoring. Opt. Fiber Technol. 2024, 82, 103652. [Google Scholar] [CrossRef]
  100. Mishra, P.; Sahu, P.K.; Kumar, H.; Jha, R. Human pulse and respiration monitoring: Reconfigurable and scalable balloon-shaped fiber wearables. Adv. Mater. Technol. 2023, 8, 2300429. [Google Scholar] [CrossRef]
  101. Wang, X.; Zhou, H.; Chen, M.; He, Y.; Zhang, Z.; Gan, J.; Yang, Z. Highly sensitive strain sensor based on microfiber coupler for wearable photonics healthcare. Adv. Intell. Syst. 2023, 5, 2200344. [Google Scholar] [CrossRef]
  102. Liang, H.; Wang, Y.; Kan, L.; Xu, K.; Dong, T.; Wang, W.; Gao, B.; Jiang, C. Wearable and multifunctional self-mixing microfiber sensor for human health monitoring. IEEE Sens. J. 2022, 23, 2122–2127. [Google Scholar] [CrossRef]
  103. Guo, J.; Tuo, J.; Sun, J.; Li, Z.; Guo, X.; Chen, Y.; Cai, R.; Zhong, J.; Xu, L. Stretchable multimodal photonic sensor for wearable multiparameter health monitoring. Adv. Mater. 2025, 37, 2412322. [Google Scholar] [CrossRef]
  104. Kuang, R.; Wang, Z.; Ma, L.; Wang, H.; Chen, Q.; Junior, A.L.; Kumar, S.; Li, X.; Marques, C.; Min, R. Smart photonic wristband for pulse wave monitoring. Opto-Electron. Sci. 2024, 3, 240009-1–240009-16. [Google Scholar] [CrossRef]
  105. Gunwant, D. Interfacial strengthening in bio-inspired materials: A review. Compos. Interfaces 2025, 32, 509–585. [Google Scholar] [CrossRef]
  106. Yang, B.; Zhu, Y.; Jiao, Y.; Yang, L.; Sheng, Z.; He, S.; Dai, D. Compact arrayed waveguide grating devices based on small SU-8 strip waveguides. J. Light. Technol. 2011, 29, 2009–2014. [Google Scholar] [CrossRef]
  107. Sahoo, H.K.; Ansbæk, T.; Ottaviano, L.; Semenova, E.; Zubov, F.; Hansen, O.; Yvind, K. Tunable MEMS VCSEL on silicon substrate. IEEE J. Sel. Top. Quantum Electron. 2019, 25, 1700707. [Google Scholar] [CrossRef]
Figure 1. The working principle of an FBG sensor.
Photonics 12 00662 g001
Figure 2. The working principle of FPI fiber sensors.
Photonics 12 00662 g002
Figure 3. The working principle of COF sensors.
Photonics 12 00662 g003
Figure 4. The working principle of µBF and MBF sensors.
Photonics 12 00662 g004
Figure 5. The working principle of CRF sensors.
Photonics 12 00662 g005
Figure 7. Pulse waveforms obtained from wrist and ankle arteries, with PTT labelled in the graph. Reproduced with permission from [72]. Copyright 2023 IEEE.
Photonics 12 00662 g007
Figure 8. (a) Positions of Cun, Guan, and Chi. (b) Illustration of the three levels of feeling, i.e., floating, medium, and deep [21]. (c) Pulse diagnosis at different positions with their corresponding physiological information based on the theory of TCM. (c) Reproduced with permission from [63]; published by Elsevier Ltd., 2021. (d) The types and main characteristics of 28 pulse conditions. (a,b,d) Reproduced with permission from [21]. Copyright 2024 Wiley-VCH GmbH.
Photonics 12 00662 g008
Figure 9. FBG sensors for pulse waveform monitoring. (a) Experimental setup of the wearable flexure sensor. (b) Obtained carotid pulse waveform of a volunteer with high waveform fidelity. (a,b) Reproduced with permission from [83]. Copyright 2023 IEEE. (c) Schematic diagram of the fabrication process and the image of the of the LIG-mLPG sensor. (d) Pulse waveform measurement on the wrist of a volunteer during exercise. (c,d) Reproduced from [48]; published by Wiley-VCH GmbH, 2025. (e) Images of the SOFBG and POFBG sensors and the measurement location near the brachial artery at the cubital fossa. (f) Obtained pulse signal from the respective sensors. (e,f) Reproduced with permission from [82]. Copyright 2024 IEEE.
Photonics 12 00662 g009
Figure 10. FPI sensors for pulse waveform measurement. (a) Sketch of the design layout of the FPI sensor. The respective interference (blue curve) and pulse signals (red curve) measured at (b) the radial and (c) the femoral pulse sites. (ac) Reproduced with permission from [52]. Copyright 2024 IEEE. (d) Sketch of the structural layout of the FPI sensor by Xu et al. [95]. The pulse measurement results of two volunteers: (e) a 26-year-old male and (f) a 24-year-old female, using their FPI sensors. (df) Reproduced from [95]; published by MDPI, 2025. (g) Pulse data are measured via the chirped FBG-based FPI sensor. (g) Reproduced with permission from [47]. Copyright 2025 IEEE.
Photonics 12 00662 g010
Figure 11. COF sensors for arterial pulse waveform monitoring. (a) Schematic diagram of the fabrication of the sensor. (b) The sensing area with 16 grids on the wrist. (c) Arterial pulse signals from different sites. (ac) Reproduced from [7]; published by Springer Nature, 2023. Four COF structures are (d1) CMC, (d2) MOC, (d3) µ-MOC, and (d4) tw-MOC. (e) Pulse signal recorded from the four COF sensors. (d1d4) and (e) Reproduced with permission from [76]. Copyright 2025 IEEE. (f) Photograph of the PU fiber wearable for measurement of the pulse. (g) Photograph of the black PU air-core fiber used. (h) Pulses acquired at the wrist. (i) Detail of a single pulse at the wrist. (j) Pulses obtained at the ankle. (k) Detail of a single pulse at the ankle. (f,k) Adapted with permission from [72]. Copyright 2023 IEEE.
Photonics 12 00662 g011
Figure 12. Bent fiber sensors in acquiring pulse signals. (a) Schematic diagram of the U-shaped MBF on a flexible liquid sac (Inset: Optical micrograph of the MBF). (b) Photograph of the alignment-free MBF sensor. (c) The signal output of different arterial locations at (i) carotid, (ii) brachial, and (iii) radial arteries. (ac) Reproduced with permission from [30]. Copyright 2022 Donghua University, Shanghai, China. (d) Photographs of the wavy structure of the microfiber. (e) Photograph of the µBF sensor on the wrist. (f) Raw pulse waveform from a volunteer. (g) Filtered pulse waveform and baseline waveform. (dg) Reproduced with permission from [29]. Copyright 2021 Wiley-VCH GmbH. (h) Schematic illustration of the MBF sensor. (i) Image of the loop-shaped MBF sensor guiding a 650 nm optical signal. (j) Pulse signal monitoring of a volunteer at the temporal, brachial, radial, and fingertip arteries. (hj) Reproduced with permission from [99]. Copyright 2024 Elsevier Inc.
Photonics 12 00662 g012
Figure 13. CRF in measuring the pulse signal. (a) Preparation process of the force-sensitive cladding-removed fiber. (b) Radial artery pulse signal from two volunteers. (a,b) Reproduced with permission from [61]. Copyright 2025 Elsevier Ltd. (c) Schematic diagram of the encapsulated sensor. (d) Glass mold for encapsulating the D-shaped fiber curvature sensor. (e) Encapsulated sensor in PDMS. (f) The OFS with both ends strapped to a wristband. (g) Wristbands with OFS worn around the wrist. (h) Processing of the wrist pulse signal. (ch) Reproduced with permission from [62]. Copyright 2022 Elsevier B.V.
Photonics 12 00662 g013
Figure 14. Other sensing methods that involve optical fibers based on (a) coupled mode theory, (b) the self-mixing interference technique, (c) upconversion luminescence, and (d) speckle analysis. (a1) Preparation of the flexible microfiber coupler. (a2) Pulse signals monitoring using the microfiber coupler at the neck, wrist, finger, and ankle sites. (a1,a2) Reproduced from [101]; published by Wiley-VCH GmbH, 2023. (b1) Schematic diagram of a BP sensing device using microfiber based on the self-mixing interference technique. (b2) Time domain signal of pulse waveform. (b1,b2) Reproduced with permission from [102]. Copyright 2022 IEEE. (c1) Illustration of the multi-functional sensor attached to skin in monitoring vital signs such as strain, temperature, and pH. The inset shows the sensor structure. (c2) Working principle of the sensor for strain sensing. (c3) Photographs of the doped-PDMS fiber under relaxed and stretched states. (c4) Wrist pulse signals obtained from the sensor. (c1c4) Reproduced with permission from [103]. Copyright 2024 Wiley-VCH GmbH. (d1) Schematic diagram of the POF sensor. (d2) Photograph of the wristband POF sensor. (d3) Photograph of the internal structure of the sensor. (d4) The monitoring system, which includes the experimental setup, data processing, pulse rate computation, cloud terminal, and an artificial intelligence processor. (d5) Reconstructed pulse signal from analysis over 30 s and 8 s. (d1d5) Reproduced from [104]; published by Institute of Optics and Electronics, Chinese Academy of Sciences, 2024.
Photonics 12 00662 g014
Table 1. Working principles of pulse waveform sensors with their advantages and disadvantages.
Type of SensorWorking PrincipleAdvantagesDisadvantages
PiezoresistiveConvert Δ P into a change in resistance ( Δ R )Low costLow sensitivity
Δ P Δ R Large response rangeLarge hysteresis
CapacitiveConvert Δ P into a change in capacitance ( Δ C )Good dynamic responseHigh parasitic capacitance effect
Δ P Δ C High sensitivity at low Δ P
PiezoelectricConvert Δ P into a change in voltage ( Δ V )Simple fabricationLow sensitivity at high ΔP
Δ P Δ V High signal-to-noise ratio
TriboelectricConvert Δ P into a change in electrical charge ( Δ q )High dynamic responseLow sensitivity at high ΔP
Δ P Δ q High sensitivity at low Δ P
MagnetoelasticConvert Δ P into a change in magnetic flux density ( Δ B )High stretchabilityMagnetic field interference
Δ P Δ B Intrinsic waterproofness
Optical fiberConvert Δ P into a change in light intensity ( Δ I or wavelength ( Δ λ )High spatial resolutionBulky detection system
Δ P Δ I   o r   Δ λ Anti-electromagnetic interference
Table 2. Description of the three levels of feeling (or pressing pressures) by TCM practitioners.
English Term Defined by WHO [15]Description of Level of FeelingAlternative Term
FloatingLight pressureFu, superficial pressure
MediumModerate pressureZhong, medium pressure
DeepDeep pressureChen, heavy pressure
Table 3. Recent progress of FBG sensors for pulse waveform monitoring applications.
Ref.Device ConfigurationDiagnostic TypeSensitivitySizeWaveform ResolutionDeployment Type
[83]SOFBG suspended on a rigid-body flexurePulse waveform, HR1547.3 pm/N35 mm × 29 mm × 20 mm
(75 mm for handheld)
HighWearable, handheld
[84]SOFBG suspended on an orthogonal–planar spring structurePulse waveform, HR2143.7 pm/N57 mm (length)
30 mm (diameter)
HighTabletop
[85]SOFBG suspended in a 3-D printed bellows elastomerPulse waveform, HR225.04 pm/N8 mm × 8 mm × 22.28 mmHighTabletop
[86]SOFBG in silicone membrane on an arc-shaped curved structurePulse waveform, HR, RR *748.86 pm/N (simulation)106 mm × 45 mm × 15 mmHighWearable
[40]SOFBG in Dragon Skin 30 with housingHR, RR, BP1.21 pm/µε41 mm × 3 mm × 15 mmHighImplantable
[48]Laser-induced graphene-microfiber LPG in PDMSPulse waveform, HR, glucose2.06 nm/kPaNot reportedHighWearable
[46]Microfiber FBG in PDMSPulse waveform, HR, RR, BP2.86 nm/N for stress 0.05–0.45 NNot reportedHighWearable
[87]Parallel waveguide SOFBG in PDMSPulse waveform, BP1.33 nm/m−140 mm × 10 mm × 0.6 mmHighWearable
[88]Parallel waveguide SOFBG in PDMSPulse waveform, RR, trunk bendingNot reported50 mm × 20 mm × 2 mmHighWearable
[10]SOFBG on silicone diaphragm, finger plethysmograph sensorPulse waveform1.20 pm/µε25 mm (length)
16 mm (slit width)
ModerateWearable
[89]SOFBGs on a neoprene rubber sheetPulse waveform, BP1.20 pm/µε30 mm × 140 mm × 5 mmModerateTable-top
[90]FBG in nylon bandagePulse waveform, HR, RRNot reportedNot reportedHighWearable
[91]SOFBG arrays on bubble wrap cushioningPulse waveform, HRNot reportedNot reportedHighWearable
[92]FBG arrays on PDMSPulse waveformNot reportedNot reportedModerateWearable
[81]SOFBG on a 3-D-printed flat platformPulse waveformNot reportedNot reportedLowHandheld
[93]FBGs in silicone sheetPulse waveform, BPNot reported3 mm (thickness)HighWearable
[94]SOFBG array in medical tapePulse waveform, BPNot reportedNot reportedHighWearable
[82]POFBG in PDMSPulse waveform, HR, RRNot reported70 mm × 20 mm × 1 mmHighWearable
[50]POFBG on gel sheet on a 3-D-printed platformHRNot reported40 mm × 50 mm × 10 mmModerateTabletop
* RR = respiration rate, Unknown type of material of optical fiber.
Table 4. Recent progress of FPI sensors for pulse waveform monitoring applications.
Ref.Device ConfigurationDiagnostic TypeSensitivitySizeWaveform ResolutionDeployment Type
[52]Probe-like, flexible condom membranePulse waveformNot reportedSensing diameter 3 cmHighHandheld
[95]Probe-like, nickel-coated PPS membranePulse waveform, HRNot reportedSensing diameter 5 mmModerateHandheld
[96]Probe-like, aluminum-coated latex membranePulse waveform, HR, and BP56.88 nm/mmHgSensing diameter 10 mmLowHandheld
[47]All-fiber-based, chirped FBGs as mirrors Pulse waveform, BP0.612 nm/N
(loop structure)
30 mm × 20 mm × 1 mmHighWearable
[67]All-fiber based, COF with capillary fiber as cavityPulse waveform, HR47.96 Hz/µεNot reportedHighWearable
Table 5. Recent progress of COF sensors for pulse waveform monitoring applications.
Ref.Device configurationDiagnostic typeSensitivitySizeWaveform ResolutionDeployment Type
[7]MMF-capillary-MMF sealed in a PE tube, embedded in PDMS, on a liquid capsulePulse waveform, BP−213 µW/kPa25 mm diameter of the liquid capsuleHighWearable
[76]Tapered-waveguide assisted microcavity structure in PDMSPulse waveform, BP264.97 µW/kPa50 mm × 10 mm × 3 mmHighWearable
[72]PU capillary fiber coupled between two PMMA optical waveguidesPulse waveform, HR, RRNot reportedNot reportedHighWearable
[5]SM-MM-SM fiber in PDMS, on an elastic beltPulse waveform, BPNot reported3 mm thickness (PDMS), 2 mm thickness (belt)HighWearable
[55]SM-microfiber-SM fiber in PDMS, loop shapePulse waveform, HR5.85 V/kPa500 µm thickness (PDMS)LowWearable
[97]5-µm core SMF spliced with common SMFs in textile, assisted by PU rodPulse waveform, BPNot reported70 mm × 60 mm × 6 mmLowWearable
[98]5-µm core SMF spliced with common SMFs in PU, assisted by a PU rodPulse waveform, BPNot reported50 mm × 50 mm × 1 mmModerateWearable
Table 6. Recent arterial pulse waveform measurement using MBF and µBF sensors.
Ref.Device ConfigurationDiagnostic TypeSensitivitySizeWaveform ResolutionDeployment Type
[30]U-shaped microfiber in PDMS on liquid sac #Pulse waveform, HR−0.22 kPa−1 (for 0–2 kPa), −0.02 kPa−1 (for 2–10 kPa)3 mm thickness,
20 mm diameter
HighWearable
[75]U-shaped SMF in silicone #Pulse waveform, BPNot reported15 mm × 10 mm × 10 mmHighWearable
[29]Wavy microfiber in PDMS film Pulse waveform, BP257 (gauge factor) or 85.7 mm−1≈21 mm sensing lengthHighWearable
[74]Microfiber fiber in nano-hemispherical microstructure PDMS Pulse waveform, HR, BP0.0138 mV/kPa20 mm × 20 mm × 0.15 mmModerateWearable
[41]Wavy polymer optical
microfiber in PDMS
RR, HR, behaviour detectionNot reported15 mm × 50 mm × 0.20 mmLowWearable
[99]Loop structure small core fiber in silica gel #Pulse waveform, HR2.2 kPa−1 (for <200 Pa), 0.91 kPa−1 (for 200–600 Pa)30 mm × 15 mm × 0.5 mmHighWearable
[100]Loop structure SMF in PDMS #Pulse waveform, HR, RR27.4 pm/µm (longitudinal), 11.6 pm/µm (lateral)500 µm (thickness of PDMS)HighWearable
[6]Loop structure microfiber in silicone #Pulse waveform, BPNot reported25 mm × 30 mm × 35 mmHighWearable
# MBF, µBF.
Table 7. Summary of recent progress of CRF sensors for pulse waveform monitoring applications.
Ref.Device ConfigurationDiagnostic TypeSensitivitySizeWaveform ResolutionDeployment Type
[61]Cladding removed grating PMMA fiber in U-shaped structure, supported by a PVC hollow tubePulse waveform, hand motion detection50.294 N−1
(0.201 kPa−1)
15 cm × 10 cm, with 20 mm × 2 mm force-sensitive areaHighWearable
[62]D-shaped fiber in PDMSPulse waveform, HR, RR7.208%/m−140 mm × 5 mm × 2 mmModerateWearable
Disclaimer/Publisher’s Note: The statements, opinions and data contained in all publications are solely those of the individual author(s) and contributor(s) and not of MDPI and/or the editor(s). MDPI and/or the editor(s) disclaim responsibility for any injury to people or property resulting from any ideas, methods, instructions or products referred to in the content.

