Abstract
A wavelet-transform-based highlight suppression method is presented, aiming at suppressing the highlights of single image with complex texture. The strategy involves the rough extraction of specular information, followed by extracting the high-frequency information in specular information based on multi-level wavelet transform to enhance the texture information in the original images by fusion strategy, and fusing with the same-level specular information to achieve the highlight suppression image. The experimental results demonstrate that the proposed method effectively removed large-area highlights while preserving texture details, and demonstrated the authenticity of the highlight estimation and the ‘lights off’ effect in the highlight-suppressed images. Overall, the method offers a feasibility for addressing the challenges of highlight suppression for visual detection image with rich texture and large-area highlights.
1. Introduction
In optical inspection systems, extreme external illumination can cause specular reflection on highly reflective surfaces like metal parts and smooth plastics, leading to overexposure and highlight regions that obscure the original target information [1], and it can further lead to causing a decrease in image quality and reducing the reliability of detection. Highlight suppression is critical for improving the quality of images captured in optical inspection systems. By effectively suppressing or eliminating highlights, it is possible to reveal the true texture and features of the inspected targets. This leads to more accurate defect detection and better-quality control. So, the suppression of highlights is particularly important in industries such as manufacture, medical equipment, and robots, where precision and reliability are paramount. Numerous methods have been proposed over the years to tackle this challenge.
The Dichromatic Reflection Model (DRM) describes reflected light as linear combinations of diffuse and specular reflection, where the diffuse reflection reflects the targets’ texture information, and the specular reflection reflects the external lighting information, which masks the target texture and color features [2]. Based on the DRM, Klinker et al. [3] found that the diffuse and specular reflection components of the RGB channel in the image have a T-shaped distribution; they treated the dark channel of the image as approximately specular highlight information, and the color vectors of the diffuse and light sources were fitted by conducting principal component analysis on the diffuse and specular reflection regions, so the maximum a posteriori probability (MAP) method was used to obtain highlight removal images by calculating the probability distribution of the initial specular reflection components.
Moreover, several researchers have built upon these foundational concepts. Chen et al. [4] used a skin color model instead of a camera color calibration method to improve the removal effect of highlights. The maximum fraction of the diffuse color component in diffuse local patches is in smooth distribution [5]; based on this observation, Yang et al. regarded the specular component as image noise, so that the bilateral filter is employed to smooth the maximum fraction of the color components of the image to suppress the specular component; however, the method relies on the estimation of the maximum diffuse reflection. Zhao et al. [6] proposed a highlight separation method based on the local structure and chromaticity joint compensation (LSCJC) characteristic of an object, removed texture distortion in the estimated diffuse reflection component using the diffuse component gradient-magnitude similarity map, and compensated for the chromaticity in specular reflection region based on local chromaticity correlation. Subsequently, the model continued to expand, achieving effective separation of diffuse reflection components and specular reflection components [7].
Additionally, the sparse representation techniques can be applied to the separation of diffuse and specular components, enhancing the precision of highlight suppression. Akashi et al. [8], based on a modified version of sparse non-negative matrix factorization, and spatial prior, accurately separated the body colors and specular components, but this method may easily cause some pixels with zero value in strong highlight areas, so texture distortion is inevitable. Fu et al. [9] employed a linear combination of a few basis colors with sparse encoding coefficients to suppress the highlights with a small area, the main limitation of this method is may fail to restore the subtle textures from large specular highlight regions.
Most existing highlight suppression methods are mainly based on color images, analyzing the chromaticity or polarization of lighting to recover lost information. However, there are many grayscale images that exist in practice detection. The absence of color information can easily distort image intensity during highlight suppression, posing a significant challenge.
Ragheb et al. [10] proposed a MAP method for estimating the proportions of Lambertian and specular reflection components, accurately obtained the proportion of specular reflection, and realized a good surface normal reconstruction in the proximity of specular highlights, but the iterative conditional model in this method has local convergence and cannot obtain the global optimal solution, which can easily cause some residual highlights. Ma et al. [11] calculated the MAP of each reflection composition under simulated annealing based on the surface normal, and implemented image highlight detection and highlight removal, combined with the assumption of curvature continuity, but it does not take the impact of visual geometric features and edge smoothing on specular reflection regions into account, which can easily lead to excessive smoothness of the color and steep boundary brightness in specular reflection region. To address this issue, Yin et al. [12] established a model of diffuse and specular reflection components, then calculated the MAP to detect and recover the specular reflection region based on a Bayesian formula and BSCB (Bertalmio, Sapiro, Caselles, Ballester) model [13]; however, this method easily causes significant distortion when encountering specular reflection region.
The research mentioned above demonstrated that the specular reflection information can be removed. Direct separation of the specular component in the spatial domain is challenging, but it can be effectively achieved in the frequency domain by exploiting the gradient properties of highlight pixels. Chen et al. [14] proposed a method for removing specular highlights in natural scene images, whereby based on frequency domain analysis, they decomposed the input image into reflectance and illumination components, and estimated the specular reflection coefficient based on smooth features and chromaticity space, subtracting the specular component to achieve highlight removal. However, the method may not accurately recover information damaged by highlights. Zou et al. [15] used the spatial-frequency image enhancement and region growing algorithm to realize the tile surface defects. The median filtering and local histogram equalization were used to implement it, followed by frequency domain enhancement using 2-D Gabor filter, and then use the region growing algorithm to realize the automatic segmentation of defect regions. But the method may cause lower accuracy for pockmark and chromatic aberration defects based on the observation that the maximum fraction of the diffuse color component changes smoothly in local patches.
These studies collectively demonstrate the diversity and effectiveness for image highlight suppression, for spatial domain methods, while intuitive and straightforward, often struggle with grayscale images where color information is absent, leading to potential distortions in image intensity. On the other hand, frequency domain methods can provide more robust suppression of highlights without significantly affecting the underlying texture. However, among the currently published methods, they may still face challenges in accurately extracting highlights and restoring textures, especially in regions with intricate textures. The processed highlight regions, usually with weak texture features, lack the highlight suppression for strong texture features, so there are still some limitations in image highlight removal for targets with a complex texture, while the sources commonly cause strong highlight regions in visual detection systems [16], which blocks the texture information. The highlights extracted by existing highlight suppression methods may easily contains much texture information, which may cause texture distortion when directly eliminating this highlight component.
Therefore, to solve this problem, this paper presents an image highlight suppression method based on wavelet transform to realize the image highlight suppression and texture restoration, and MATLAB (Version R2019a) is employed to implement the algorithm. First, the specular information is preliminarily separated based on a specular-free image, due to the complex texture, the extracted specular information still contains some residual texture information. So, the multi-stage wavelet transform is used to separate the low-frequency and high-frequency information of the extracted specular information and original image respectively. Finally, the low- and high-frequency information is processed by setting filters and a gain strategy, and the inverse wavelet transform is used to reconstruct image, so the highlight removal image and specular information can be obtained, where the concealed texture information in specular information is extracted to restore the texture.
2. Image Highlight Suppression Strategy
2.1. Rough Extraction of Specular Information
The reflected lights can be decomposed into diffuse and specular components [3], with the diffuse components reflecting the texture information of target, and the specular components reflecting the specular information [17,18].
The obtained image of size can be reshaped into an array () of length . The discrimination threshold for the diffuse reflection component is then calculated from , as follows,
where represents the average value, represents the standard deviation, and represents the intensity threshold of the specular information, which can be adjusted according to the actual situation of the image to obtain the specular information of different areas. When is less than , the corresponding pixels can be seen as the diffuse information. Take the stripe-projection image as an example, the intensity threshold , which determines the area of extracted highlights, is set to 1.05, and the discrimination threshold, , is equal to 196.77. Thus, the geometric factor of the specular information can be calculated as follows,
is a one-dimensional array of length , and can be seen as the proximity between pixels and specular information. Large proximity implies that the pixels’ value is close to the specular pixels. Conversely, a low proximity value suggests that the pixels are highly likely not specular information. Then, the obtained can be reorganized into to represent the roughly extracted highlight pixels, which is normalized and then binarized to obtain the specular pixels, then according to the area of specular pixels, extract the largest connected area , which is a logical matrix. Extracting the largest area can enhance the robustness and accuracy by avoiding noise in small specular areas, reducing computational load, ensuring representative specular features, preventing overprocessing for natural visuals, and providing a stable intensity recovery. Here, the dilatation algorithm is employed to process the to obtain the , which comprises pixels in the largest specular area and its surrounding diffuse reflection pixels. Then, perform the difference operation, and take the absolute value to obtain , which is the diffuse information near maximum specular region, as follows,
Then, the is transformed into a logical matrix , where the non-zero elements in were converted to a logical value of 1 (true), and zeros were converted to a logical value of 0 (false). Then, use and as indexes to extract the corresponding pixels and from respectively, which represents the intensity of the specular region and its nearby diffuse region. Using the and as indexes to extract and from , where the is the specular information of the specular region, and is the specular information of the nearby diffuse region. Variable denotes the indices of elements in arrays , , , and . Thus, based on the principle of smooth transition, we have,
where is a scale factor used to adjust the intensity of specular information, which makes the diffuse information smooth and natural in image. The , , , and are the mean intensities of , , , and , respectively. Then, the value of pixels of the specular information can be calculated by , which is expressed as,
For the stripe-projection image, according to Equations (2)–(4), is 1.44. After the separation, the specular information is reorganized into a matrix . Figure 1 shows a solved example of stripe-projection image, different determines the extracted highlight areas, and further determines the extent of the subsequent highlight reduction. It can be seen from Figure 1 that there is much concealed texture information in the rough-extraction specular information , and direct difference operations on the image will eliminate both specular and texture information, which is unsuitable. Since the gradient variation in pixels in the specular region is much smaller than that of texture information, there is a significant difference in frequency domain [19]. In this paper, a frequency domain method is presented to improve the image highlight suppression.

Figure 1.
Rough-extraction specular information under different intensity thresholds of : (a) original image ; (b) ; (c) ; (d) .
2.2. First Fusion Strategy
Wavelet transform [20,21] is more suitable for the target image with complex features compared with Fourier transform, because the orthogonal wavelet reconstruction has better stability, and the symmetric wavelet bases can eliminate phase distortion, which can better reconstruct the decomposed images. Furthermore, wavelet bases with strong compact support have a higher attenuation speed so that can better detect fine features in images, and good smoothness can make it more beneficial for improving the frequency resolution during image decomposition and reducing distortion during image reconstruction.
In this paper, the 2-D discrete wavelet transform (2-D DWT) is used to perform multi-level decomposition of the images along the row, column, and diagonal directions. In a 2-D DWT, an image is divided into four sub-images because the process involves applying wavelet filters in both horizontal and vertical directions. (1) Horizontal filtering: The image is initially filtered along the rows (horizontal direction) using low-pass and high-pass wavelet filters, and then downsampled to create two sets of coefficients: low-frequency and high-frequency. (2) Vertical filtering: These coefficients are then filtered and downsampled along the columns (Vertical direction) using the low-pass and high-pass wavelet filters. The composite filtering produces four sub-bands: (1) Low-Low pass filtering: Results from low-pass filtering in both directions, obtaining the approximation of the image (or the lowpass filtered image). (2) Low-High pass filtering: Results from low-pass filtering horizontally and high-pass filtering vertically, obtaining horizontal edge details. (3) High-Low pass filtering: Results from high-pass filtering horizontally and low-pass filtering vertically, obtaining vertical edge details. (4) High-High pass filtering: Results from high-pass filtering in both directions, obtaining diagonal edge details.
For multi-level 2-D DWT, the object of each decomposition is the low-frequency information after the previous level 2-D DWT, as Figure 2 shows,
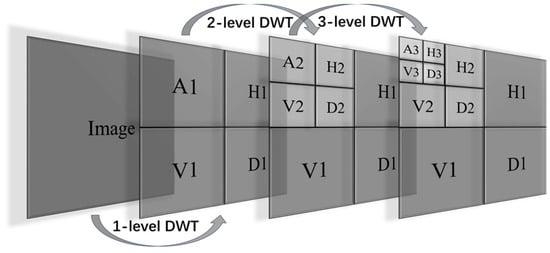
Figure 2.
The 3-level decomposition of image by 2-D DWT.
Thus, the combination of these horizontal and vertical filtering steps generates four sub-images, each highlighting different frequency components and spatial characteristics of the original image. In this paper, a Symlet wavelet is employed to suppress the highlights based on single-image, two-fusion strategies are employed to restore the texture in highlight areas and suppress the specular information, respectively. The first fusion combines high-frequency information from imgs with imgt to enhance texture details, it is crucial for improving the visibility of fine details obscured by highlights. The second fusion, on the other hand, focuses on integrating the texture restoration image from first fusion back with the low-frequency information of , this ensures that the specular information can be removed while the texture of the image is preserved. Describing both fusions separately is essential because they serve different purposes within the highlight suppression framework and contribute uniquely to the final outcome.
Firstly, in order to extract the concealed texture information in to enhance the texture feature of original image , a multi-level DWT employed to decompose the low-frequency and high-frequency information of and respectively, the next-level decomposition object is the low-frequency information of previous-level decomposition. The technical route is as Figure 3 shows.

Figure 3.
Technical route of enhancement for original image .
In Figure 3, denotes the low-frequency information of at different levels, while , , and denote the horizontal, vertical, and diagonal components of high-frequency information at different levels. Similarly, denotes the low-frequency information of at different levels, where the “A” denotes the “Approximation”, it means the low-frequency information, , , denote the horizontal, vertical, and diagonal components of high-frequency information at different levels, where the “H” denotes the “Horizontal direction”, “V” denotes the “Vertical direction”, “D” denotes the “Diagonal direction”, and the subscript “1” denotes the first 2-D DWT and fusion strategy.
After the multi-level DWT operation to the and respectively, the low-frequency information (, ) and the high-frequency information at different levels (, , , , , ) are obtained. The decomposition results and reconstruction images are shown in Figure 4.
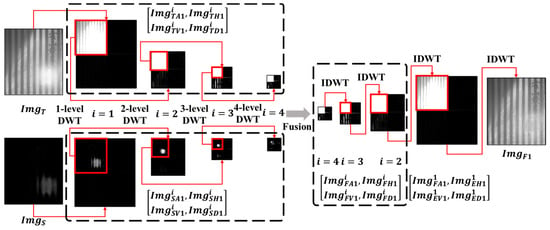
Figure 4.
The decomposition results of and and reconstruction images at different levels.
Figure 4 illustrates that a single wavelet decomposition of ImgS does not completely separate low- and high-frequency information. The high-frequency information is not visually obvious due to weak texture features in . However, after deeper wavelet decomposition, the high-frequency information becomes clearer, with stripes gradually becoming apparent, while residual texture features in low-frequency information are gradually eliminated. The texture features are fully eliminated in , accurately reflecting the specular information. For , its low and high frequency information are effectively separated by DWT, where the low-frequency information still contains the texture information, but interestingly, from the beginning of 2-level decomposition, the high-frequency features in are removed effectively, and the subsequent decompositions further separate the fine features, which proves the difference between highlight information and texture information in the frequency domain. After extracting the concealed texture information from by multi-level DWT, the original images are first processed to obtain texture restoration images .
The high-frequency information in is extracted to enhance the high-frequency information in . Then, the information sets and are subjected to hierarchical gain and fusion. The fusion strategies are expressed as follows,
where , , , and , respectively, represent the low-frequency and high-frequency information at different levels of fusion image . The , , , , , , , and , respectively, represent the gain coefficients at different levels of the first wavelet decomposition information. Then, the low-frequency information of fusion image can be obtained by inverse discrete wavelet transform, as follows,
where represents the inverse discrete wavelet transform (IDWT) operation, through the IDWT, and the information set is reconstructed into the low-frequency information up one level.
Since the high-frequency information reflects the residual texture information in , it needs to be retained, for , the high-frequency information reflects the real texture information, here, an autocorrelation-function-based algorithm is used to calculate the gain coefficients of high-frequency information, as follows,
where and are the variables, are the size of each high-frequency information, is the reward factor, is an indicator to indicate whether the calculation condition is met, and are the displacements in the and direction, respectively, which determine which two pixels in the image are used for comparison, and is the variable of offset, where is the size of a rectangular window. It means the computation between each pixel within a window and the pixel that is displaced by and in the and direction, respectively. represents the high-frequency information of and . Taking the stripe-projection image as an example, in the fusion for constructing , the gain coefficient is , is , is , is , and the , , and were equal to 1 due to the preserve texture principle. After multi-level reconstruction by IDWT, the first-level information set is obtained, then a high-pass filter with convolution kernel is employed to extract the edge information of residual texture in , as follows,
where the is negative number, together with positive number form the convolution kernel, in order to ensure that the extracted edge information does not destroy the overall texture of the original image due to excessive enhancement; here, a reference value is provided, where is −1, and is 0.7. , , and denote the horizontal, vertical, and diagonal component high-frequency information in first level after edge enhancement, the operator “” denotes the convolution operation. The filter results are added to the first-level high-frequency information set for enhancement. Then, the obtained , , and are used to replace the corresponding high-frequency information , , and , IDWT is used to reconstruct them, as follows,
From Figure 4, texture information of all levels is enhanced compared with original image after wavelet decomposition. a is a texture restoration image, and on this basis, the highlight suppression images are obtained by removing the low-frequency information of .
2.3. Second Fusion Strategy
needs to be decomposed by multi-level wavelet transform and fused with low-frequency information of , and the technical route is as shown in Figure 5.

Figure 5.
Technical route of highlight suppression for texture restoration image .
In Figure 5, denotes the low-frequency information of at different levels, , , , denote the horizontal, vertical, and diagonal components of high-frequency information at different levels. Similarly, denotes the low-frequency information of at different levels, , , and , denote the horizontal, vertical, and diagonal components of high-frequency information at different levels, and the subscript “2” denotes the second 2-D DWT and fusion strategy. As Figure 6 shows, in order to suppress the concealed specular information, and retain the texture details, the highest-level low-frequency information of is selected to fuse with the same-level low-frequency information of . The decomposition results and reconstruction images at different levels, as well as the fusion strategy, are as follows,
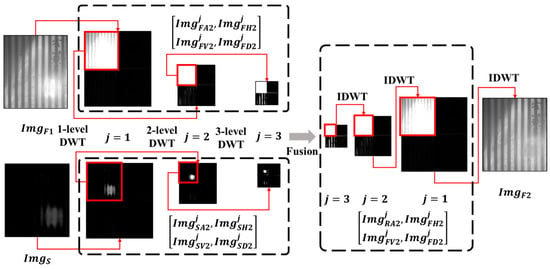
Figure 6.
The decomposition results of and and reconstruction images at different levels.
Since the low-frequency information will be replaced by higher-level decomposition information during wavelet reconstruction, based on the principle of highlight suppression, and considering that highest-level specular information is recalculated twice ( and ), the gain coefficient should therefore be at least equal to .
Next, fuse it with information set , as shown in Figure 6. The calculated is used to replace the and then reconstructed by IDWT to obtain the highlight suppression image , as follows,
3. Results and Analysis
Figure 7 depicts some solved examples, which are respectively the stripe-projection image, the steel plate with diagonal stripes and the internal threads of the metal pipeline. Since they are grayscale images, they exclusively encompass intensity information. The targets mentioned above contain rich texture features and obvious image highlights, where the image highlights are mainly focused on the areas with rich textures, and it should be noted that large-area highlights exist in the images of steel plate with diagonal stripes and the internal threads of the metal pipeline.
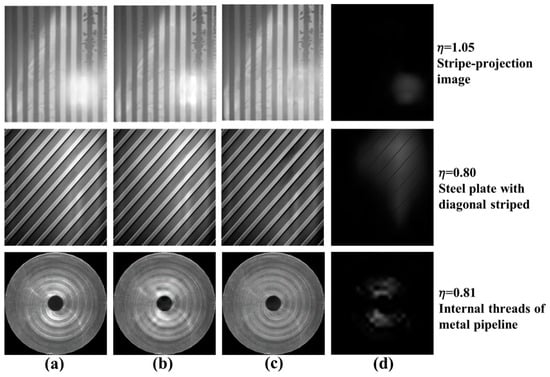
Figure 7.
Solved examples. (a) Original image ; (b) texture restoration image ; (c) highlight suppression image ; (d) extracted highlights .
This algorithm is inevitably sensitive to the intensity threshold , whereby different input images often have a different optimal threshold , which can be adjusted according to the area and intensity of highlights. Figure 7c clearly shows that the highlight suppression image can significantly improves the original images . This is evident in the suppression of the main specular information without significant distortion in edge and intensity information, and it means that the restorations of texture information are natural and smooth, and display a good visual effect, which effectively validates the proposed method. The proposed method performs well in processing the highlights with strong texture features, as the texture and intensity in highlight regions are reasonably well restored, bringing clear stripes, reasonable intensity of diagonal striped, and relatively comprehensive thread information. Figure 7d depicts the highlight extraction images , which are obtained by the difference operation between and . do not contain obvious residual texture information, and while they accurately reflect the distribution and intensity of specular information, when preserving the original texture features of the target, the highlight-suppressed image obtained after removing specular information exhibits a ‘lights off’ effect. Image histograms are calculated to objectively describe the highlight suppression performance, Figure 8 depicts the histogram comparisons of and , and Table 1 shows the comparison of the highlight pixels’ number of and .

Figure 8.
Histogram comparisons of and . (a) Stripe-projection image; (b) steel plate with diagonal stripes; (c) internal threads of metal pipeline.

Table 1.
Comparison of the number of highlight pixels.
Due to the different area and intensity of image highlights, three different thresholds for highlight pixels are given in Table 1, which are 225, 190, and 191 respectively. The highlight pixels are mainly distributed in the range with high intensity, and it can be observed from Figure 8 and Table 1 that, compared with original images, the number of highlight pixels in three highlight suppression images are obviously decreased, and the removed highlight pixels have moved to lower intensity ranges. In order to further validate the proposed method, four classical methods (MSF method [17,18], Arnold’s method [22], Fu’s method [9], and Akashi’s method [8]) are used for comparison. Figure 9 shows the highlights extracted by five different methods.
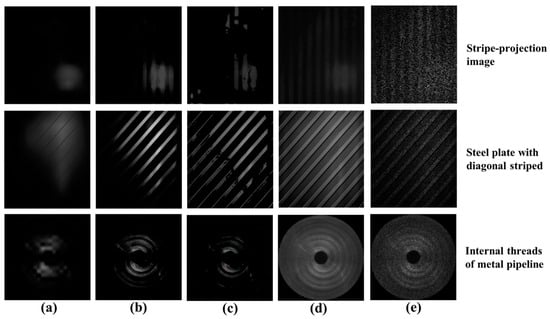
Figure 9.
The extracted highlights. (a) Proposed method; (b) MSF method [17,18]; (c) Arnold’s method [22]; (d) Fu’s method [9]; (e) Akashi’s method [8].
Figure 9 shows that, compared to classical methods, the highlights extracted by the proposed method do not exhibit significant edge information, and therefore does not include the texture information, thereby reducing image distortion after removing highlights, while the highlights extracted by classical methods both contain much texture features, which may cause the loss of edge information and distortion of intensity information. From an ocular perception standpoint, the highlights extracted by the proposed method provide a more authentic estimation of highlights, reflecting the specular information generated by the target’s intrinsic high-reflectance properties and illumination. Figure 10 depicts the comparison of highlight suppression image.
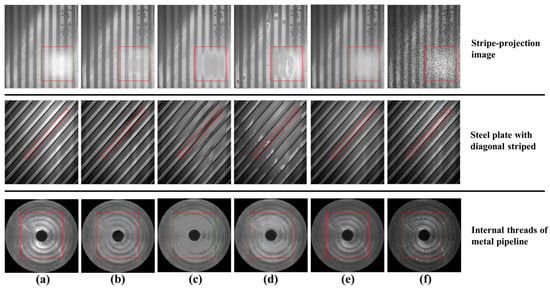
Figure 10.
Highlights suppression images. (a) Original images; (b) proposed method; (c) MSF method [17,18]; (d) Arnold’s method [22]; (e) Fu’s method [9]; (f) Akashi’s method [8].
In Figure 10, the main highlight region is marked in red boxes; in order to compare the texture information in the highlight region, the restoration results of different methods are displayed for images. Figure 11 depicts the intensity spatial display of Figure 10.
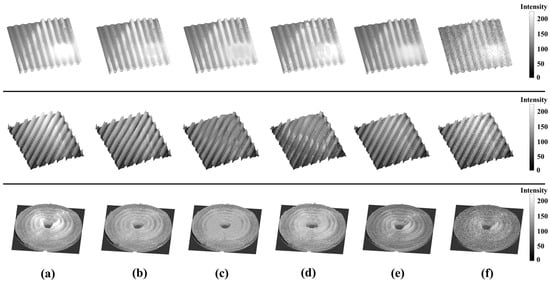
Figure 11.
Intensity spatial display of Figure 10. (a) Original images; (b) proposed method; (c) MSF method [17,18]; (d) Arnold’s method [22]; (e) Fu’s method [9]; (f) Akashi’s method [8].
From Figure 10 and Figure 11, a false feature occurred in Figure 11c,d. For the MSF method [17,18], the highlights suppression image of stripe-projection and internal threads of the metal pipeline have obvious losses of texture information; the stripes and the threads in the highlight regions have almost disappeared, while there is some intensity distortion in the image of a steel plate with diagonal stripes, and the pixel intensity in the highlight regions have significant differences from other regions. For Arnold’s method [22], the highlight areas are filled proportionally using Gaussian smoothing with the original image, which may cause the poor edge preservation, so it brings obvious losses of texture information in the image of internal threads of the metal pipeline, or even false texture information and intensity in the image of stripe-projection and the steel plate with diagonal stripes. Fu’s method [9] shows a better performance in texture distortion compared with Figure 11c,d, but it still has significant residual highlights and loses some texture details, due to the smoothness balance issue between the diffuse layers and the highlight layers. Compared with the methods mentioned above, the proposed method has a significant improvement in the restoration of texture and intensity information in highlight regions. The effect of image highlight suppression by Akashi’s method [8] seems limited due to the lack of color information and because the image exhibits a significant decrease in quality, and it is also prone to noise when processing grayscale images.
4. Discussion
Since the concealed texture information extracted from highlight areas is used in the texture restoration of the original images, the restoration results achieved by the proposed method are therefore comparatively more authentic. The results obtained demonstrate the efficacy of the proposed wavelet transform and fusion strategy in suppressing highlights for single texture-rich images. Arnold’s method [22] and the BSCB method [13] focused on generating pixel information to restore the texture, and as the BSCB method [13] is a pure texture restoration algorithm, it needs to combine highlight extraction algorithms to achieve the suppression of highlights, it is more suitable for texture restoration with small area.
Other previous methods, such as the MSF Method [17,18] and those based on the DRM, have shown effectiveness in separating diffuse and specular reflection components in color images. However, these methods may struggle with grayscale images where color information is absent, leading to potential distortions in image intensity and changes in signal-to-noise ratio, like Akashi’s method [8] and Fu’s method [9]. The local structure and chromaticity joint compensation (LSCJC) [6] method has been successful in separating diffuse and specular components by leveraging local chromaticity correlations, but this method is limited when applied to single-channel grayscale images, where chromaticity information is not available. In contrast, the proposed method’s reliance on frequency domain analysis rather than spatial domain chromaticity features allows it to overcome this limitation, providing a more versatile solution for various imaging scenarios. This represents a significant advancement in highlight suppression technology, particularly for industrial applications where grayscale imaging is prevalent. The multi-level decomposition of the image into low-frequency and high-frequency information through wavelet transform allows for precise manipulation of the images’ frequency content. This capability enables the suppression of highlights while preserving essential texture details, which is a notable improvement over methods that may inadvertently smooth out these details. For instance, the method by Yang et al. [5], which employs edge-preserving low-pass filtering, effectively removes specular highlights but can sometimes over-smooth the image, losing critical texture information. The proposed method mitigates this issue by targeting only the high-frequency components associated with highlights. Furthermore, the fusion strategy employed in our method is critical for combining the processed high-frequency and low-frequency components to reconstruct a highlight-suppressed image. Thus, this method ensures that the texture details are preserved and enhanced, leading to a more visually coherent and accurate representation of the inspected surface. This is particularly beneficial when dealing with images of metal parts or smooth plastics, where surface texture is crucial for quality assessment.
However, since the texture restoration relies on the weak texture concealed in highlight regions, the proposed method may cause some limitations in texture restoration when the pixel intensity reaches 255. Furthermore, the number of decomposition levels is not a constant for every case. The texture of images can affect the level of wavelet decomposition. Certainly, for highlight suppression of general images in optical inspection, the level of wavelet decomposition will not be too high; in this paper, the wavelet decomposition levels of several solved examples are all within 5. For different information in images, such as specular information, a solution to this problem is to first set a high wavelet decomposition level, then calculate the gain coefficient of specular information for each level; if the value is close to 0, its impact on the results will also tend toward nonexistent. Future research could explore the possibilities for improving the automation level of this method, analyzing the impact of image resolution and wavelet filters on the decomposition level, and breaking the limitation and the integration of this method with other image processing techniques, such as machine learning algorithms, to further enhance its robustness and adaptability. Additionally, testing the method across a broader range of materials and surface conditions would help in fine-tuning the algorithm for specific industrial applications.
5. Conclusions
The targets with high reflectance properties may bring the image highlights, which is detrimental to subsequent detection tasks, and if there exist complex texture features in highlight regions, the highlights extracted by traditional highlight suppression methods may contain a significant amount of texture features, which results in a loss of substantial target information after removing the highlight components. The main difficulty in processing these images lies in effectively suppressing highlights while restoring complex texture features. This paper introduces a highlight suppression method that utilizes wavelet transform and a fusion strategy to effectively suppress highlights in single images. The experimental results show that the real specular information is eliminated effectively, while the texture information is reasonably restored. Compared with classical methods, the proposed method does not exhibit significant texture information in extracted highlights, it provides more authentic estimation of highlights, and it effectively processes the images with rich texture and large-area highlights, with the obtained highlight-suppressed images after specular information removal exhibiting a ‘lights off’ effect. This method can lead to more reliable optical inspections, and can be integrated directly into vision inspection/measurement (e.g., fringe projection profilometry), medical imaging, and video processing. Due to its simplicity and hardware-free nature, it attracts a lower cost in improving existing visual equipment, and it can enhance image quality, improve object detection and recognition, facilitate accurate diagnosis, and optimize the viewing experience by reducing glare and overexposure.
Author Contributions
Conceptualization, X.S. and L.K.; methodology, X.S.; software, X.S.; validation, X.W. and X.P.; formal analysis, X.W. and G.D.; investigation, X.S. and L.K.; resources, X.S. and L.K.; data curation, X.W.; writing—original draft preparation, X.S. and L.K.; writing—review and editing, X.S. and L.K.; visualization, X.S.; supervision, L.K.; project administration, X.S. and L.K.; funding acquisition, X.S. and L.K. All authors have read and agreed to the published version of the manuscript.
Funding
This research was funded by Natural Science Foundation of Jiangxi Province (20224BAB214053), Shanghai Science and Technology Innovation Program (23ZR1404200), National Key R&D Program (2022YFB3403404), and Science and Technology Research Project of Education Department of Jiangxi Province (GJJ210668).
Institutional Review Board Statement
Not applicable.
Informed Consent Statement
Not applicable.
Data Availability Statement
Data underlying the results presented in this paper are not publicly available at this time but may be obtained from the authors upon reasonable request.
Conflicts of Interest
The authors declare no conflicts of interest.
References
- Chen, H.H.; Luo, L.J.; Guo, C.S.; Ying, N.; Ye, X.Y. Specular Highlight Removal Using a Divide-and-Conquer Multi-Resolution Deep Network. Multimed. Tools Appl. 2023, 82, 36885–36907. [Google Scholar] [CrossRef]
- Feng, W.; Li, X.H.; Cheng, X.H.; Wang, H.H.; Xiong, Z.; Zhai, Z.S. Specular Highlight Removal of Light Field Based on Dichromatic Reflection and Total Variation Optimizations. Opt. Lasers Eng. 2021, 151, 106939. [Google Scholar] [CrossRef]
- Klinker, G.J.; Shafer, S.A.; Kanade, T. The Measurement of Highlights in Color Images. Int. J. Comput. Vis. 1988, 2, 7–32. [Google Scholar] [CrossRef]
- Chen, L.; Lin, S.; Zhou, K.; Ikeuchi, K. Specular Highlight Removal in Facial Images. In Proceedings of the IEEE Conference on Computer Vision and Pattern Recognition, Honolulu, HI, USA, 21–26 July 2017; pp. 2780–2789. [Google Scholar]
- Yang, Q.X.; Tang, J.H.; Ahuja, N. Efficient and Robust Specular Highlight Removal. IEEE Trans. Pattern Anal. Mach. Intell. 2015, 37, 1304–1311. [Google Scholar] [CrossRef] [PubMed]
- Zhao, Y.Q.; Peng, Q.N.; Xue, J.Z.; Kong, S. Specular Reflection Removal Using Local Structural Similarity and Chromaticity Consistency. In Proceedings of the IEEE International Conference on Image Processing, Quebec City, QC, Canada, 27–30 September 2015. [Google Scholar]
- Suo, J.L.; An, D.S.; Ji, X.Y.; Wang, H.Q.; Dai, Q.H. Fast and High-Quality Highlight Removal from a Single Image. IEEE Trans. Image Process. 2016, 25, 5441–5454. [Google Scholar] [CrossRef] [PubMed]
- Akashi, Y.; Okatani, T. Separation of reflection components by sparse non-negative matrix factorization. In Proceedings of the Asian Conference on Computer Vision, Singapore, 1–5 November 2014; pp. 611–625. [Google Scholar]
- Fu, G.; Zhang, Q.; Song, C.F.; Lin, Q.F.; Xiao, C.X. Specular Highlight Removal for Real-world Images. Comput. Graph. Forum J. Eur. Assoc. Comput. Graph. 2019, 38, 253–263. [Google Scholar] [CrossRef]
- Ragheb, H.; Hancock, E.R. A Probabilistic Framework for Specular Shape-From-Shading. Pattern Recognit. 2003, 36, 407–427. [Google Scholar] [CrossRef]
- Ma, J.Q.; Kong, F.H.; Zhao, P.; Gong, B. A Specular Shape-From-Shading Method with Constrained Inpainting. Appl. Mech. Mater. 2014, 530–531, 377–381. [Google Scholar] [CrossRef]
- Yin, F.; Chen, T.; Wu, R.; Fu, Z.; Yu, X. Specular Detection and Removal for a Grayscale Image Based on the Markov Random Field. In Proceedings of the International Conference of Young Computer Scientists, Engineers and Educators, Harbin, China, 19–22 August 2016; pp. 641–649. [Google Scholar]
- Bertalmio, M.; Sapiro, G.; Caselles, V. Image inpainting. In Proceedings of the Special Interest Group on Computer Graphics and Interactive Techniques, New Orleans, LA, USA, 23–28 July 2000; pp. 417–424. [Google Scholar]
- Chen, H.; Hou, C.G.; Duan, M.H.; Tan, X.; Jin, Y.; Lv, P.L.; Qin, S.Q. Single Image Specular Highlight Removal on Natural Scenes. In Proceedings of the Chinese Conference on Pattern Recognition and Computer Vision, Zhuhai, China, 29 October–1 November 2021; pp. 78–91. [Google Scholar]
- Zou, G.F.; Li, T.T.; Li, G.Y.; Peng, X.; Fu, G.X. A Visual Detection Method of Tile Surface Defects based on Spatial-Frequency Domain Image Enhancement and Region Growing. In Proceedings of the Chinese Automation Congress, Hangzhou, China, 22–24 November 2019; pp. 1631–1636. [Google Scholar]
- Sun, X.; Liu, Y.; Yu, X.Y.; Wu, H.B.; Zhang, N. Three-Dimensional Measurement for Specular Reflection Surface Based on Reflection Component Separation and Priority Region Filling Theory. Sensors 2017, 17, 215. [Google Scholar] [CrossRef] [PubMed]
- Shen, H.L.; Zheng, Z.H. Real-Time Highlight Removal Using Intensity Ratio. Appl. Opt. 2013, 52, 4483–4493. [Google Scholar] [CrossRef] [PubMed]
- Ren, W.H.; Tian, J.D.; Tang, Y.D. Specular Reflection Separation with Color-Lines Constraint. IEEE Trans. Image Process. 2017, 26, 2327–2337. [Google Scholar] [CrossRef] [PubMed]
- Cai, J.R.; Gu, S.H.; Zhang, L. Learning a Deep Single Image Contrast Enhancer from Multi-Exposure Images. IEEE Trans. Image Process. 2018, 27, 2049–2062. [Google Scholar] [CrossRef] [PubMed]
- Donoho, D.L. De-Noising by Soft-Thresholding. IEEE Trans. Inf. Theory 1995, 41, 613–627. [Google Scholar] [CrossRef]
- Makbol, N.M.; Khoo, B.E.; Rassem, T.H. Block-Based Discrete Wavelet Transform-Singular Value Decomposition Image Watermarking Scheme using Human Visual System Characteristics. IET Image Process. 2016, 10, 34–52. [Google Scholar] [CrossRef]
- Arnold, M.; Ghosh, A.; Ameling, S.; Lacey, G. Automatic Segmentation and Inpainting of Specular Highlights for Endoscopic Imaging. EURASIP J. Image Video Process. 2010, 2010, 814319. [Google Scholar] [CrossRef]
Disclaimer/Publisher’s Note: The statements, opinions and data contained in all publications are solely those of the individual author(s) and contributor(s) and not of MDPI and/or the editor(s). MDPI and/or the editor(s) disclaim responsibility for any injury to people or property resulting from any ideas, methods, instructions or products referred to in the content. |
© 2024 by the authors. Licensee MDPI, Basel, Switzerland. This article is an open access article distributed under the terms and conditions of the Creative Commons Attribution (CC BY) license (https://creativecommons.org/licenses/by/4.0/).
