Abstract
In order to improve the data productivity of a wind tunnel test, the model under investigation in the wind tunnel is moved continuously with a predetermined constant angular speed in the so-called pitch–traverse mode. Alternatively, the wind tunnel model can be moved in the so-called pitch–pause mode, in which it keeps its position for a certain (measurement) time at a fixed pitch position, after which it is moved to the next pitch position. The latter procedure is more time-consuming, so, for the same time interval, the number of measured data points taken in the pitch–pause mode is less than that for the pitch–traverse mode. Since wind tunnel test time can be quite expensive, in most wind tunnel tests where only conventional forces and pressures are recorded with conventional measuring systems, the wind tunnel model is moved in the pitch–traverse mode in order to obtain as much aerodynamic data as possible during the tunnel runtime. The application of the Pressure-Sensitive Paint (PSP) technique has been widely used in wind tunnel testing for the purpose of providing pressure data on wind tunnel models with high spatial resolution. The lifetime-based PSP method has several advantages over the intensity-based method since it often has higher accuracy. Up until now, the lifetime-based PSP technique has mainly been used for wind tunnel testing, where the test model has been moved to the pitch–pause mode. The traditional lifetime method using on-chip accumulation requires multiple (~1000) excitation light pulses to accumulate enough luminescence (fluorescence or phosphorescence) photons on the camera sensor to provide acceptable signal-to-noise ratios and, therefore, it may seem to be not compatible with a continuously moving wind tunnel model. Nevertheless, the present study verifies the application of lifetime-based PSP utilizing on-chip accumulation with a continuously moving wind tunnel model which would make the entire PSP data acquisition compatible with that of the conventional measurements (forces and pressures), as mentioned above. In this paper, the applicability of the lifetime-based PSP technique to a continuously moving wind tunnel model (in pitch–traverse mode) is investigated with the help of measurements in the transonic wind tunnel in Göttingen (TWG). For this investigation, PSP was applied on the delta-wing model DLR-F22, which is to be tested in TWG. The pressure distribution on the wind tunnel model was measured using the PSP lifetime method for both model movement modes (pitch–pause and pitch–traverse mode) so that the corresponding PSP results could be directly compared with each other. In addition, an error analysis of the PSP results was carried out and compared with the conventional pressure measurement results, hence providing an assessment of the accuracy of the PSP results; finally, a recommendation for future PSP measurements could be given.
1. Introduction
Pressure-Sensitive Paint (PSP) is an optical pressure measurement technique widely used in wind tunnel testing [1,2,3]; it enables the acquisition of pressure distributions on a model surface from one set of images without the need to drill pressure tap holes and to connect tubes inside the investigated wind tunnel model. Thus, it is an excellent measurement system for investigating wind tunnel models having a number of different configurations which are to be examined successively, as is the case for the DLR-F22 delta-wing model [4] in the transonic wind tunnel in Göttingen (TWG). A great advantage of the PSP technique is that a surface pressure distribution over the whole model surface can be obtained quantitatively and with high spatial resolution. Two different measurement methods using PSP (the intensity [3] and lifetime-based [3,5] methods) have already been applied to testing in various wind tunnels. The lifetime-based method makes use of the dependence of PSP luminescent lifetime on the pressure. Two types of lifetime-based methods have so far been used; one uses pulsed excitation, whereas the other uses continuously modulated excitation [3]. In this study, we focus on a two-gate method using pulsed excitation. In the two-gate method, two luminescent images are acquired at different times relative to the excitation pulse so that images are available at different times on the luminescence excitation and decay curve. To achieve this, a pulsed excitation light source and a fast-shutter camera are required. Two different measurement strategies for the two-gate lifetime-based PSP have been reported in the literature so far: (a) if both gate images are acquired from a single excitation pulse, the method is referred to as the “single-shot lifetime technique” [6]; (b) with the “on-chip accumulation” method [7], the camera shutter is opened with a constant time delay after every excitation light pulse so that with multiple excitation pulses the resulting PSP luminescence images can be accumulated on the camera-sensor chip itself.
A major advantage of the lifetime-based method is that the relationship between the ratio of the two gated images and pressure is independent of the excitation light intensity distribution. Since both gate images are acquired only at wind-on conditions, problems arising from model deformation or displacement due to wind-on/wind-off differences do not occur. Nevertheless, in many cases of practical applications, spatial gate ratio variations (non-uniform lifetime patterns) have been observed [8]. This spatial variation causes critical errors in the final pressure calculation. Therefore, one single gate ratio obtained also under wind-off conditions is required to correct for these non-uniform lifetime patterns [9]. In recent years, groups at both universities and research establishments have made great progress in the development of different PSP lifetime measurement methods for wind tunnel testing, single-shot lifetime PSP, and on-chip accumulation lifetime PSP [9,10,11,12,13,14,15,16,17,18].
In 2016, Mébarki and Benmeddour reported [19] a successful measurement using the PSP lifetime method in the NRC transonic (blowdown) wind tunnel on a so-called GBU-38 wind tunnel model, where the model was moved continuously (in pitch–traverse mode) at 3°/s, 6°/s or 9°/s. In their work, they used pulsed UV-LED systems in combination with CMOS-camera technology, with which PSP image acquisition rates of 49 Hz could be achieved for the single-shot lifetime method. In their work, they state [19] (p. 2) that “the traditional lifetime method using on-chip accumulation … is not compatible with a continuously moving model”. The implications of this statement must be evaluated with due consideration paid to the chosen pitch–traverse rates (angular speeds). Furthermore, the model pitch–traverse rate chosen for a wind tunnel measurement also depends on the operating mode of the wind tunnel itself. For example, model traverse rates of just 0.1 °/sec are used in continuously operating transonic wind tunnels such as TWG [20] or the European Transonic Windtunnel (ETW) [21]. This low model traverse rate is one order of magnitude smaller than that mentioned by Mébarki and Benmeddour in their intermittently operating blowdown wind tunnel. At significantly smaller model traverse rates compared to those reported by Mébarki and Benmeddour, the possibility of using the traditional PSP lifetime method using on-chip accumulation for measurements with a continuously moving wind tunnel model should, therefore, be examined.
The traditional PSP lifetime method with on-chip accumulation has typically made use of CCD-sensor technology; CMOS-based cameras do not have this feature up to now. In 2015, the Sony Corporation (the top seller of CCD image sensors in 2014) announced the cessation of their CCD image sensor manufacturing by the end of March 2017, with the last shipments of their finished product being in March 2020 [22]. Therefore, CCD-sensor technology, in the long term, will no longer be available for PSP measurements. Nevertheless, many universities and research establishments still have in use many such CCD cameras with on-chip accumulation technology. From the authors’ point of view, the investigation carried out here for the first time using CCD-camera technology with continuously moving wind tunnel models is still of scientific and industrial importance since this camera technology is still currently being used for wind tunnel measurements.
In this paper, the current status of the lifetime-based PSP method with on-chip accumulation using CCD-sensor technology on a continuously moving wind tunnel model is reported. The main topics of this work are (i) the optimization of the camera and LED excitation source settings for high-quality PSP data generation whilst the wind tunnel model is moving in pitch–traverse or pitch–pause mode; (ii) the automation of data acquisition for high data productivity; and (iii) the achievement of accuracy and precision of the lifetime-based PSP method for the pitch–traverse and pitch–pause modes.
This current work reviews the first wind tunnel test campaign of the generic triple-delta wing model DLR-F22 in TWG and reveals the possibilities of using the lifetime-based PSP method for a continuously moving wind tunnel model in pitch–traverse mode.
2. Lifetime-Based PSP-Technique
The principle behind the pressure measurement by the lifetime-based PSP method is based on a photo-physical phenomenon of luminophores, which is known as oxygen quenching of the luminescence: higher concentrations of oxygen result in shorter lifetimes of photoluminescence, while, conversely, lower oxygen concentrations result in longer photoluminescence lifetimes. According to Henry’s law, the concentration of oxygen in the paint layer is proportional to the partial pressure of oxygen of the gas above the surface. When the oxygen concentration in the gas is constant (as in ambient air), gas pressure can be related to the luminescent lifetime of the PSP luminophore [3].
2.1. Pressure Calculation
In the two-gate method, two luminescent images (IGate1 and IGate2) are acquired at different times of the luminescence decay. Theoretically, using the two-gated lifetime method, the image ratio Ron taken at wind-on conditions can be directly related to surface pressure P as described in Equation (1).
where ai are Stern–Volmer calibration coefficients and IGate1 and IGate2 represent the luminescence image intensity at each gate. The two-gate lifetime system requires a pulsed excitation light source and a fast-shutter camera. The advantage of the lifetime-based method is that the relationship between the ratio of the two gated images and pressure is, in principle, independent of the excitation light intensity distribution. However, in many cases of practical application, spatial gate ratio variations have been observed that are not related to varying surface pressures [8,17]. This can occur especially on large, coated surfaces where gate ratios show differences of several percent on different areas of the surface, but where pressures are the same. This spatial gate ratio (lifetime) variation causes critical errors in the final pressure calculation. Therefore, one single gate ratio obtained under wind-off condition Roff is also required to correct for these non-uniform, non-flow-related lifetime patterns. This calculation, a so-called “ratio-of-ratios” [9], can be described as in Equation (2).
where bi are calibration coefficients. By using the ratio-of-ratios calculation, the effect of local lifetime variations can either be corrected for or at least their effect reduced.
2.2. Paint Composition
A typical composition of PSP which is used at DLR is described here: Platinum meso-tetra (pentafluorophenyl)porphine (PtTFPP) [23] is used as the sensor dye. This dye has a lifetime decay time of 50 µs (1/e time decay) under vacuum conditions and also a high luminescent intensity. The same polymer, poly(4-tert-butyl styrene), is used in both the active layer and the base coat to prevent any unfavorable interactions between the layers. In the base coat, Boron Nitride (BN) is mixed in as white particles to further enhance the PSP signal [24]. The mean diameter of these particles is less than 0.5 µm. The thickness of each layer is approximately 10 µm, and the surface roughness of the active layer coating is less than 1 µm in Ra. A commercially available white screen layer, based on epoxy resin, was sprayed directly onto the wind tunnel model with a thickness of about 60 µm in order to generate a homogeneous background for the succeeding layers. Figure 1 shows the different coating layers applied to the wind tunnel model surface and their corresponding paint-layer thicknesses. It should be noted at this point that the use of a separate white screen layer can be dispensed with if the wind tunnel model to be examined has a very uniform surface finish. However, if the wind tunnel model has either filled screw holes or consists of different model materials, the use of a white screen layer has been found to be highly beneficial.

Figure 1.
PSP coating layers.
2.3. Hardware
As PSP excitation light sources, UV LEDs (IL-106, HARDsoft) with a 385ET75 nm optical band-pass filter were used. The emission peak of each UV-LED system was at 390 nm. The LEDs were operated in pulsed mode, where the rise and fall times of the pulse excitation were less than 1 µs. The PSP luminescence signal was acquired using a 14-bit CCD camera (pco.2000, PCO, Kelheim, Germany), which was equipped with a 650ET100 nm optical band-pass filter. The camera was operated in on-chip accumulation mode (which is also referred to as modulation mode in the literature) to obtain an image with a high signal-to-noise ratio (SNR). In this mode, the camera shutter is opened many times (~1000) with a constant time delay relative to each LED light pulse so that PSP luminescence images are accumulated on the CCD chip via multiple exposures. During pitch–pause data acquisition, the camera was operated using one analog-to-digital converter (ADC), whereas for the pitch–traverse data acquisition, the readout speed of the camera was enhanced by using two ADCs. The camera readout speed for both data acquisition modes was set to 10 Mpx/s. For these camera settings, the expected 14-bit dynamic range of the camera could be fully used, and a camera frame rate of 3 Hz could be achieved. A faster readout of 40 Mpx/s is available for this camera but the dynamic range of the camera is then limited to 10,000 counts, see Appendix A. The gate settings for Gate1 and Gate2 of the camera are shown in Figure 2a. LED and camera timing settings employed in this test are summarized as follows: LED pulse length: 12 µs; LED pulse frequency: 5 kHz; Camera shutter width: 30 µs; Camera Gate1 start: −28.5 µs; Camera Gate2 start: +1.5 µs; t = 0 is defined by the end of the excitation (LED off). It is noted that the numbers of LED pulses and camera accumulations are adjusted for each test condition to obtain almost the same PSP signal level in both gated images. In Figure 2a, the luminescence lifetime excitation and decay curves for different pressures at T = 30 °C are shown, taken with the settings described above. The obtained signal intensity of Gate1 is almost two times that of Gate2 (at P = 60 kPa). Therefore, the number of LED pulses in Gate1 has been set to about half that in Gate2 in order to obtain about the same PSP signals in Gate1 and Gate2 images.
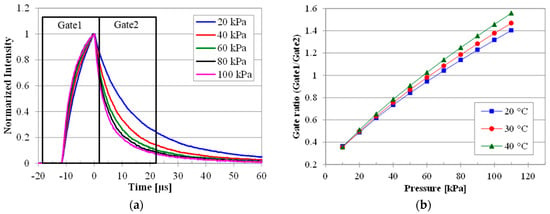
Figure 2.
(a) Luminescence lifetime decay curves for different pressure levels at T = 30 °C and camera gate settings. (b) Pressure sensitivity curves for different temperatures of the lifetime-based method.
3. Application to Wind Tunnel Testing
3.1. Experimental Setup
Evaluation tests of the lifetime-based PSP were conducted in the perforated wall test section of the Transonic Wind Tunnel in Göttingen (TWG); it has a cross-section of 1 m × 1 m, and the corresponding operating range of the wind tunnel with this test section provides Mach numbers in the range M = 0.3 to 1.2 and total pressures from P = 30 kPa to 150 kPa [25].
Optical access is possible through glass windows from the top and from each side of the test section. In order to have sufficient excitation light available to acquire images with good SNR, three UV-LED systems were used as excitation light sources: one was located on the top wall, and two others on the starboard side of the wind tunnel model (looking in the flow direction). In Figure 3, the geometry of the model (a) and a photo of the wind tunnel model inside the test section (b) are shown. The locations of the camera and the three LEDs behind the windows of the wind tunnel wall are also shown. The photo (b) was taken with the LEDs switched on so that the model area illuminated by the LEDs can be recognized as the magenta-colored (the “color” of the luminescence) area on the wind tunnel model. The model forebody area was not illuminated with the LEDs installed here; see Section 4 later.
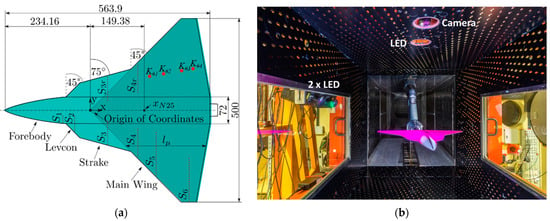
Figure 3.
(a) Geometry of DLR-F22 model [4]. (b) Photo of the installed DLR-F22 model in the perforated wall test section of TWG. The area illuminated by the LEDs on the wind tunnel model is shown in magenta color.
For image acquisition, the pco.2000 camera was installed on the top wall of the wind tunnel test section. The lens with a focal length of 20 mm allowed capturing the wing part of the model with a spatial resolution of approx. 3 pixels/mm.
The model is a generic triple-delta wing with a flat-plate wing and a sharp leading edge (DLR-F22) with four Kulite® sensors K#1, K#2, K#3, and K#4 (Kulite, Leonia, NJ, USA) for unsteady pressure measurements, as shown in Figure 3a on the suction-side model surface. The configuration tested here is named DLR-internally as “LS1”, see Figure 3a, and was designed and manufactured with a 45° “levcon” (leading edge vortex controller), a 75° strake, a 45° main wing, and a forebody. The DLR-F22 model is described in greater detail elsewhere [4]. The test conditions are summarized in Table 1 for both data acquisition cases. For the pitch–traverse case, the model was moved with a constant pitch speed of 0.1°/s.

Table 1.
Test conditions investigated in the measurement campaign.
The suction side of the model was coated with PSP using a spray gun for the different layers, as described in Section 2.2. The coating was performed after the DLR-F22 model had been fully mounted onto the wind tunnel support system and after all model-related instrumentation—temperature sensors and pressure taps—had been prepared for operation. For this purpose, a portable painting booth (commercially purchasable under the name “paintTrotter”, LAGOS, Bergondo, Le Coruña, Spain) was installed; this allows safe handling of the PSP coating materials and guarantees a clean environment for the coating procedure. With this approach, the PSP coating is the final step of model preparation and thus reduces the risk of damage to the PSP coating during handling and model installation. A photo of the wind tunnel model inside the painting booth during the coating process is shown in Figure 4.
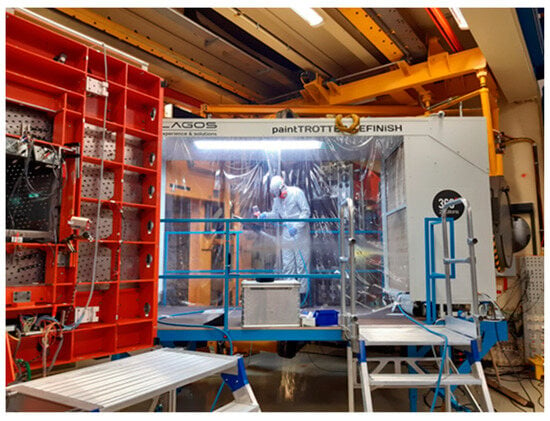
Figure 4.
Model coating inside the portable painting booth.
3.2. Data Acquisition and Automation
The internal pressure in TWG can be varied so that before starting wind tunnel operation, one so-called wind-off (reference) data point without flow could be acquired to allow for the correction of inhomogeneous lifetime distributions, as has been mentioned before. To be able to make allowance for temperature differences between wind-off and wind-on conditions, one wind-off data point was also acquired after each wind tunnel run. The wind-off pressure was set near the static pressure under wind-on conditions [26].
3.2.1. Pitch–Pause Mode
Each series of data points consists of a set of different angles-of-attack or yaw angles at a constant Mach number.
The acquisition of one data point follows the procedure that was presented for the first time in [17]; a sequence of PSP image acquisition is shown in Figure 5a. The first two images are acquired with LEDs switched off to obtain dark images, followed by five times alternating acquisition of the Gate1 and Gate2 images. The alternating gate acquisition allows for taking Gate1 data before and after Gate2 data and thus compensates for possible changes related to temperature in time. Acquired images are transferred to a computer while the image acquisition sequence is in progress. At the end of the sequence, one additional dark image is acquired. In this test, five image sets of Gate1 and Gate2 images were taken and the obtained images for each gate were then averaged to obtain the final pressure image. The duration for the acquisition of one (Gate) image is approximately one second, resulting in a total measurement time for one test point of 13 seconds. Figure 5b displays an illustration of a pitch–pause run with three data points at α = 16, 20, 24°. The image acquisition sequence is carried out automatically using a measurement program developed at DLR; it is described in more detail in [26]. All measured data (PSP images, wind tunnel data, pressure tap data, etc.) are stored in a common folder during the data acquisition. After completion of each data acquisition sequence, they are then transferred to corresponding folders automatically for final storage.

Figure 5.
PSP image acquisition sequences in pitch–pause mode. (a) At one test point (e.g., at one angle-of-attack α), it takes 13 s to acquire the one pressure image. (b) Example of a pitch–pause run at three different α = 16, 20, 24°.
3.2.2. Pitch–Traverse Mode
The test procedure for the pitch–traverse case (continuously moving model) can be described as follows: once the Mach number in the wind tunnel has been established and the starting position of the wind tunnel model for the pitch–traverse sweep has been reached, the acquisition procedure for the PSP images is started. Initially, dark images (with LEDs switched off) are acquired for Gate1 and Gate2 while the wind tunnel model is still kept in its start position, i.e., without starting the pitch–traverse sweep. Then, the pitch–traverse sweep for the wind tunnel model is started, see Figure 6a, and is synchronized in time with the start of alternating Gate1 and Gate2 image acquisition with a camera frequency of 3 Hz, resulting in a pressure measurement frequency (IGate1/IGate2 ratios) for this lifetime-based image acquisition of 1.5 Hz, as shown in Figure 6b. Taking the pitch–traverse speed of 0.1°/s into account, one can obtain lifetime-based pressure images with an angular resolution better than 0.1°. For the given (see Table 1) angle-of-attack sweeps of α = 15→25°, approximately 300 (gated) images corresponding to 150 pressure images were acquired. Since the camera timing signal was also recorded by the wind tunnel control system while the model moved through its pitch–traverse sweep, the exact wind tunnel model position for each of the PSP pressure images could be determined.

Figure 6.
(a) Example of a pitch–traverse sweep from α = 15°→25°, the total time for pitch–traverse was 100 s. Zoom shows the image acquisition in the first two seconds. (b) Image acquisition sequence during a pitch–traverse sweep.
3.2.3. Data Processing
Image processing starts with dark image subtraction. A gate ratio image was then calculated as ratios R of IGate1 to IGate2 (R = IGate1/IGate2). To cancel out the inhomogeneous lifetime distribution mentioned before, a ratio-of-ratios image was calculated as the ratio of Ron to Roff. Image alignment was applied between Ron and Roff to correct for model movement between wind-on and wind-off conditions. The processed PSP image was mapped onto a three-dimensional model grid by using marker positions in the images and mapping them to the coordinates of the model grid. The mapping process takes account of 11 independent parameters: translation (3), rotation (3), perspective (3), scaling (1) and lens correction (1). The value for every grid point is calculated by linearly interpolating adjacent pixels. Pressure values were calculated from the ratio images by using data from a priori calibration, which had been obtained in a special calibration chamber, where temperature and pressure can be set individually. Details on the setup and properties of the chamber can be found in [27]. A small PSP calibration coupon (an aluminum plate) with dimensions of 30 mm by 30 mm is coated at the same time as the model to ensure that the PSP coating has the same paint composition and thickness. For temperatures ranging from 20 °C to 40 °C and pressures ranging from 10 kPa to 110 kPa, the luminescent intensity is captured with a CCD camera, and the signal is averaged over an area of 40 by 40 pixels (about 10 mm × 10 mm). CCD camera, gate settings, excitation wavelength, and optical filters are the same as in the wind tunnel setup. The gate ratio values for the given pressure and temperature range are presented in Figure 2b. For the given gate settings, the PSP coating used here has a pressure sensitivity of SP = 0.77%/kPa and a temperature sensitivity ST = 0.37 at P = 70 kPa. A flow chart of the PSP data processing is shown in Figure 7.
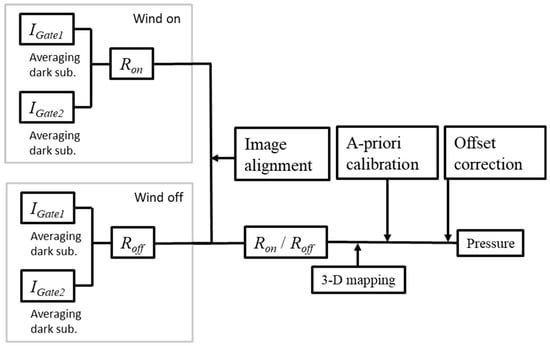
Figure 7.
Flow chart of the PSP data processing.
Finally, PSP data and corresponding pressure tap and Kulite® data were compared and an “offset” correction was determined and applied to the PSP data to correct for mean differences between the two data sets. This difference is caused mainly by a temperature change between wind-on and wind-off conditions [3]. All PSP data processing was performed by the DLR in-house developed software ToPas version 6.1.0 [28].
4. Results from the Wind Tunnel Experiment
In the following images, the flow is from left to right. The same color map is used for all presented pressure distribution (pressure coefficient Cp) figures in this chapter. In all the presented images, the blue areas indicate low pressure, whereas the red areas indicate a higher pressure. Areas presented in black color could either not be acquired with the installed optical setup from the camera (forebody) or were not sufficiently excited by UV light from the installed LED systems (on the port side) to obtain usable luminescence images. The colormap applied to show the PSP results are also shown in each Figure.
By means of PSP, the shape and position of leading-edge vortices can be measured easily since the induced suction of vortical flow imprints characteristic pressure signatures (footprints) onto the wind tunnel models’ surface. Some accompanying phenomena, e.g., vortex breakdown, secondary vortex structures, and vortex–shock interaction, can also be detected when PSP is applied. Thus, PSP provides valuable insights into the aforementioned phenomena and their evolution throughout a large angle-of-attack and Mach number range. The general flow structure that develops at the DLR-F22 model remains qualitatively similar for a large range of angles-of-attack and Mach numbers. For one case, M = 0.85, α = 16°, and β = 0°, the pressure distribution measured by means of PSP is shown in Figure 8, and the herewith measured footprints of the flow field will be discussed. The flow structure is dominated by three primary vortices that originate along the leading edges of the forebody, the strake, and the main wing. These vortices are named as inboard vortex, mid-board vortex, and outboard vortex, respectively. The positions and spatial locations of the aforementioned vortices are shown in Figure 8 as a black dotted line (inboard vortex), a black dashed line (mid-board vortex), and a black long-dashed line (outboard vortex). Additionally, shocks from above the strake and main wing can clearly be recognized from the PSP image. A first shock is visible behind the kink from the levcon to the strake, and the second shock is located further downstream on the main wing. Their spatial locations are highlighted as white dash–dot lines in Figure 8. Interaction of shocks with the vortices causes shock-induced vortex breakdown that can also be easily detected from the PSP image. More details regarding the basic flow structure of the DLR-F22 model can be found in [4].
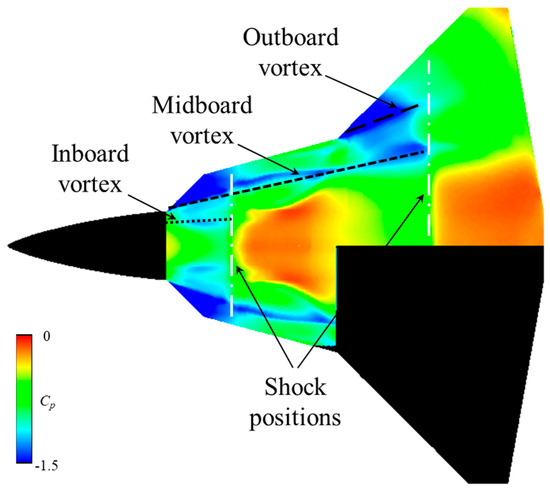
Figure 8.
Pressure distribution measured by means of lifetime PSP in pitch–pause mode on the DLR-F22 model, M = 0.85, α = 16°, β = 0° with vortex (black) and shock (white) positions indicated by dashed/dotted lines.
There are already copious pressure data available from wind tunnel experiments using the DLR-F22 model; here, continuous lifetime PSP data acquisition by means of the on-chip accumulation technique during the pitch–traverse sweep has been carried out for the first time. As already mentioned, 150 pressure images were measured in 100 s during a pitch–traverse sweep from α = 15→25°; however, only a small selection of these 150 PSP result images will be shown and discussed here. The PSP results using the pitch–traverse mode are compared here to those that were measured in pitch–pause mode. For an image-based comparison of the measured flow topologies, PSP result images were selected for Mach numbers M = 0.85, 0.95, and 1.1 with an angle-of-attack of α = 16° and a yaw angle of β = 0°.
Figure 9 shows PSP result images for M = 0.85, with (a) showing the PSP result image using the pitch–pause mode (same as in Figure 8) and (b) the PSP result image obtained during the pitch–traverse mode. The three primary vortices (in-, mid-, and outboard vortex) are clearly visible in (a) and (b), and the shock positions can also be clearly seen in both images. In all the following discussed PSP result images, the in-, mid-, and outboard vortices, as well as the shock positions, are shown using the same assignment of black or white lines, as first introduced in Figure 8. For a better comparison of the flow topology in the PSP result images, the black and white lines for the PSP result image obtained in pitch–pause mode are copied into the PSP result image for pitch–traverse mode. This makes it possible to see immediately whether the vortex axes and shock positions have been measured at identical positions. Looking at the result images in Figure 9a,b, it is noticeable that the vortex axes of the three primary vortices and the upstream shock in the area of the levcon correspond very well locally. However, the downstream shock position in Figure 9b has slightly been shifted upstream.
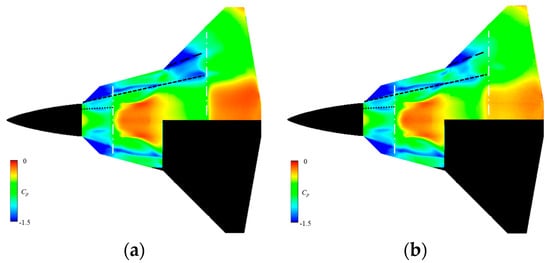
Figure 9.
PSP result images obtained in pitch–pause (a) or pitch–traverse mode (b) for M = 0.85, α = 16°, β = 0°; black and white lines showing vortex and shock locations in (a) have been transposed directly into (b) to facilitate comparison.
For a better comparison of the results shown in Figure 9a,b and to determine differences arising from the two different data acquisition modes, Figure 10a shows the Cp-difference image (ΔCp = Cp, pitch–pause − Cp, pitch–traverse) obtained by subtraction of the two images, and also includes the black and white lines for orientation, as explained before. As is to be expected for a vortex- and vortex-shock-dominated unsteady flow field, pressure differences can be seen in this difference image. Maximum differences of ΔCp = ±0.2 can be seen in the area of the shocks above the main wing and in the area of the (outboard) vortex-shock interaction. However, outside this area on the strake, levcon, and the main wing, the essential physical flow characteristics, their local position, and also the measured pressure distributions match very well. The resulting image shown in Figure 9a has been averaged from 5 individual image pairs (Ron = IGate1/IGate2); see Section 3.2.1. Averaging of 5 image pairs allows the calculation of the root mean square (RMS) value. Here, the RMS value is calculated for those images with the highest pressure sensitivity, which are the Gate2 images, according to Equation (3).
where <IGate2> is the mean value of the five individual IGate2 images.
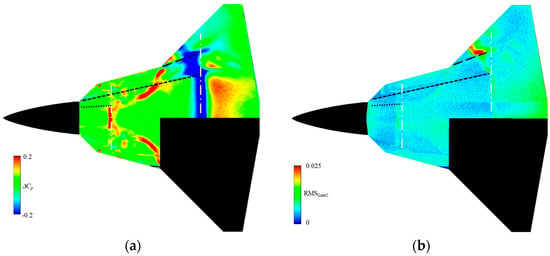
Figure 10.
Cp-difference image (a) and RMSGate2-result image (b) for M = 0.85, α = 16°, β = 0° (see text).
These RMS values are the largest in the region of transient or unsteady flow during the measurement acquisition time of 10 s. Figure 10b shows the RMSGate2 result of the PSP result image shown in Figure 9a. The largest RMSGate2 values have been measured for the outboard vortex in the area of vortex breakdown (vortex–shock interaction). Large fluctuations can also be seen in the area of the shock positions over the main wing and the levcon. The largest differences in the Cp difference image (Figure 10a) thus correlate very well with the areas of large RMSGate2 values in Figure 10b.
Now, the obtained PSP results for the higher transonic Mach number of M = 0.95 will be compared. First of all, Figure 11 shows the individual PSP results for the different data acquisition modes: (a) shows the PSP result image for the pitch–pause mode, and (b) shows the PSP result image for the pitch–traverse mode. In both PSP result images, the mid- and outboard vortex structures are clearly visible. In contrast, the inboard vortex is only very weakly visible in both cases. The shock positions and the associated shock-vortex interactions, which lead to vortex breakdown, are also clearly visible in both result images. Compared to the results shown for M = 0.85 in Figure 9, it is noticeable for the M = 0.95 results that the measured suction peaks of the in-, mid-, and outboard vortices are weaker (lighter blue color in the result images). For this higher Mach number M = 0.95, the Cp-difference image has also been calculated, and this result is shown in Figure 11c. For this M = 0.95, the differences in results between both data acquisition modes are less pronounced than for M = 0.85. There are, again, local differences in the vicinity of the shock positions and the vortex breakdowns, but the spatial extent of these differences is significantly smaller for M = 0.95 compared to M = 0.85. There are also some differences very close to the trailing edge of the model, but these can be explained by impurities (oil) on the lower of the model.

Figure 11.
PSP result images obtained in pitch–pause (a) or pitch–traverse mode (b). (c) Cp-difference image for M = 0.95, α = 16°, β = 0°.
Finally, in Figure 12, also the individual PSP results for the supersonic Mach number M = 1.1 with α = 16°, β = 0°are presented for the two different data-acquisition modes: (a) shows the PSP result image for the pitch–pause mode and (b) shows that for the pitch–traverse case. The pressure signature of mid- and outboard vortices is clearly visible in both presented PSP results, whereas an inboard vortex cannot be seen (at least not with the chosen colormap) in the PSP results. Pressure signatures of mid- and outboard vortices are visible up to the trailing edge of the main wing. Compared to the previously discussed PSP results for the transonic Mach number, it is obvious that for the supersonic Mach number, the vortex breakdown does not occur above the main wing, and furthermore, only one shock position has been detected. Compared to the results shown for M = 0.85 and 0.95 in Figure 9 and Figure 11, it is noticeable for the supersonic M = 1.1 PSP results that the measured suction peaks of the mid and outboard vortices are much weaker. For the highest tested Mach number M = 1.1, the Cp-difference image has also been calculated, and this ΔCp result is shown in Figure 12c. Overall, there is very good agreement between the results shown for both data acquisition modes (a) and (b). Only in the area of the shock are there again significant pressure differences, but these are again locally very limited and restricted to the area of unsteady flow phenomena.

Figure 12.
PSP result images obtained in pitch–pause (a) or pitch–traverse mode (b) for M = 1.1, α = 16°, β = 0°. (c) Cp-difference image—see text.
Error Analysis
The wind tunnel model has been equipped with conventional pressure taps for steady pressure readings and Kulite® sensors for unsteady pressure measurements, see Figure 3a. For the measurements presented here, only the Kulite® sensors for unsteady pressure measurements have been recorded during the continuous sweep of the wind tunnel model using the Dewetron® system of the wind tunnel data-acquisition system. Data acquisition using the conventional pressure taps did not take place in the measurement campaign presented here. However, since the PSP data acquisition system for the conventional pitch–pause method is identical to that presented in [17] and [26], a standard error in ΔP of 600 Pa is also to be expected here for the trans- and supersonic results presented in Figure 8, Figure 9a, Figure 11a and Figure 12a.
To specify the uncertainty of the PSP results during the continuous movement of the wind tunnel model (pitch–traverse mode), the pressure distribution measured by means of PSP is considered in the local area around all the Kulite® sensors. This is possible because all PSP results are mapped onto the surface grid of the wind tunnel model, and therefore, the exact local area around the Kulite® sensors can be considered.
By way of example, error analysis has been carried out and is shown here for the case M = 0.85; see Figure 13a: for all 150 data points acquired with PSP (15 ≤ α ≤ 25°, β = 0°), the PSP pressure values (in kPa) are shown on the abscissa and the corresponding Kulite® results (also in kPa) on the ordinate. The various angles of attack can be identified with the help of the symbol color map in the figure, where low to high α is coded as ranging from blue- to red-colored symbols, respectively. Fortunately, the relationship is linear over the entire measured angle-of-attack range, indicating that there is no particularly problematic angle-of-attack range that needs to be considered separately in the error analysis. The error can, therefore, be specified covering the entire data series of measurements. For this purpose, the pressure difference (PSP-to-Kulite®) has been plotted in Figure 13b as a function of the angle of attack. One can see some outliers in the range 16° ≤ α ≤ 17°, where larger errors of up to ±4 kPa can be seen. This may be related to the fact that the mid-board vortex, which for this angle-of-attack range propagates approximately in the direction of the Kulite® sensor locations (see Figure 9b), produces locally strong transient/unsteady pressure differences in the area of these Kulite® sensors. Statistically, this leads to a measurement error of ΔP = 790 Pa. It must be emphasized here that the PSP results can be compared with only the four available Kulite® sensors so that the statistical sample size is not particularly large. Interestingly, the result of the error analysis obtained for the pitch–traverse mode is of the same size as for the pitch–pause mode, so with some confidence, the value given here can be considered plausible.
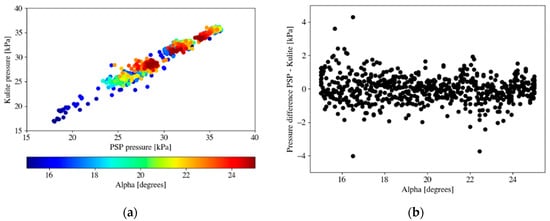
Figure 13.
Error analysis for all 150 data points measured with PSP for M = 0.85 in pitch–traverse mode. (a) Comparison of PSP pressure values and the corresponding Kulite® results, (b) pressure difference (PSP-to-Kulite®).
5. Conclusions and Outlook
Lifetime-based pressure measurements by means of PSP using on-chip accumulation on the DLR-F22 triple-delta wing model have been performed in the transonic wind tunnel TWG for trans- and supersonic Mach numbers. PSP images were acquired when the wind tunnel model was moved in pitch–pause mode (standard approach) and, alternatively and for the first time, in pitch–traverse mode. The data acquisition strategies for both modes have been presented and the applied data reduction was shown. The pressure distributions obtained by PSP for the different data-acquisition approaches were shown for trans- and supersonic Mach number cases and some selected angles-of-attack and yaw angles. In general, the results for both data-acquisition modes agree very well and primary vortices and shock positions could be easily detected. When comparing the corresponding data points for the two different data acquisition modes individually, one can see small differences, for example, in locations and extent of vortex breakdown, shock position, or shock–vortex interaction. Since these measurements were performed on a model configuration at high angles-of-attack and at trans- and supersonic flow conditions, noticeable unsteady flow is to be expected and was, in fact, indeed observed in the pitch–pause pressure data, which allows RMS analysis of the pressure and thus provided an insight into the unsteadiness of the flow. By application of the PSP lifetime technique in combination with the pitch–traverse sweep of the wind tunnel model, the productivity of the data acquisition (in terms of measurement per unit time) could be increased to ≥1.5 Hz compared to <0.1 Hz for the standard pitch–pause mode, viz. an increase by a factor of 15. The accuracy of ΔP = 790 Pa achieved for PSP data acquisition in pitch–traverse mode is similar to that of pitch–pause mode (ΔP = 600 Pa). In summary, the lifetime-based PSP data acquisition technique using on-chip accumulation was applied successfully in a wind tunnel test whilst the model was moving in pitch–traverse mode during the measurement.
For future PSP tests where many model configurations need to be investigated or when a wind tunnel model is to be investigated for the first time in a wind tunnel, the application of the lifetime-based PSP measurement technique presented here in combination with continuous model movement (pitch–traverse sweep) can be recommended to enable more efficient use of tunnel runtime to be made.
Author Contributions
Conceptualization, C.K. and D.Y.; methodology, D.Y.; software, D.Y. and U.H.; validation, D.Y., U.H. and C.K.; formal analysis, C.K.; investigation, D.Y.; resources, C.K.; data curation, C.K.; writing—original draft preparation, C.K.; writing—review and editing, D.Y. and U.H.; visualization, D.Y.; supervision, C.K.; project administration, C.K.; funding acquisition, C.K. All authors have read and agreed to the published version of the manuscript.
Funding
The experiments were conducted within the framework of the DLR projects HIGHFLY and DIABOLO, which provided financial and organizational support for this research.
Institutional Review Board Statement
Not applicable.
Informed Consent Statement
Not applicable.
Data Availability Statement
All data that support the findings of this study are included within this article.
Acknowledgments
The authors would like to thank Carsten Fuchs and Tobias Kleindienst (DLR) for their support during hardware installation; Janos Agocs (DLR) for taking photos for the measurement documentation; Martin Rein, Michael Werner, and Andreas Schütte (DLR) for their support in using the DLR-F22 model and to help further improve the DLR PSP measurement technique, and also for helpful discussions and advice regarding the DLR-F22 model. Additionally, we would like to thank the TWG wind tunnel crew for their support during the measurements. We dedicate this article to our previous colleague from ETW, Martin C.N. Wright, who passed away in 2023 and who was very committed to the industrial use of PSP under cryogenic conditions in ETW. Martin would certainly have been very happy about the method for continuous measurement using lifetime PSP described in this article and would have encouraged us to possibly apply it in the ETW as well.
Conflicts of Interest
The authors declare no conflicts of interest.
Appendix A
For the sake of completeness, we would like to add a result that was not discussed in the previous results section but was also measured according to conditions given in Table 1.
PSP results for M = 0.5 were measured successfully in the pitch–pause mode only. PSP measurements during the pitch–traverse mode were also performed for M = 0.5, but the readout speed for the camera was set to 40 Mpx/s for these series and image saturation was reached at 10,000 counts already. Therefore, the expected 14-bit dynamic range of the camera could not be used and the PSP images are unusable. The results presented in Section 4 were acquired with a camera readout speed of 10 Mpx/s for which the expected 14-bit dynamic range could be fully used.
Nevertheless, the measured PSP results in pitch–pause mode can be shown here; see Figure A1. It has to be noted that the colormap for the M = 0.5 case is different than that for the other Mach numbers.
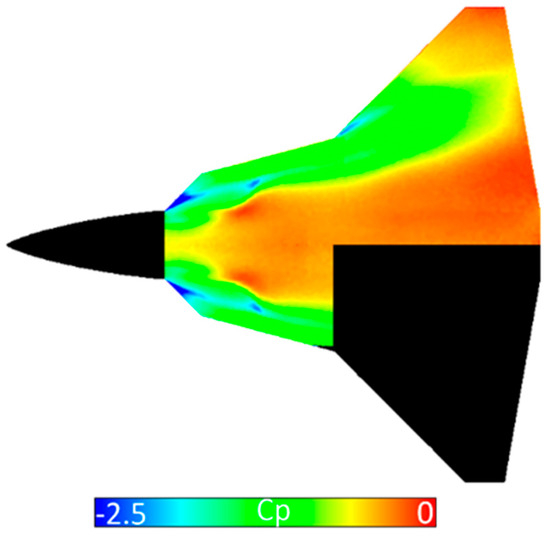
Figure A1.
Pressure distribution for M = 0.5, α = 16°, β = 0° measured in pitch–pause mode.
References
- Engler, R.H.; Hartmann, K.; Schultze, B. Aerodynamic assessment of an optical pressure measurement system (OPMS) by comparison with conventional pressure measurements in a high speed wind tunnel. In Proceedings of the ICIASF’91 Record, 14th International Congress on Instrumentation in Aerospace Simulation Facilities, Institute of Electrical and Electronics Engineers, Rockville, MD, USA, 27–31 October 1991; pp. 17–24. [Google Scholar] [CrossRef]
- Bell, J.H.; Schairer, E.T.; Hand, L.A.; Mehta, R.D. Surface pressure measurements using luminescent coatings. Annu. Rev. Fluid Mech. 2001, 33, 155–206. [Google Scholar] [CrossRef]
- Liu, T.; Sullivan, J.P.; Asia, K.; Klein, C.; Egami, Y. Pressure and Temperature Sensitive Paints, 2nd ed.; Springer: Cham, Switzerland, 2021; ISBN 978-3-030-68055-8. [Google Scholar] [CrossRef]
- Werner, M.; Rein, M.; Richter, K.; Weiss, S. Experimental and Numerical Analysis of the Aerodynamics and Vortex Interactions on Multi-Swept Delta Wings. CEAS Aeronaut. J. 2023, 14, 927–938. [Google Scholar] [CrossRef]
- Holmes, J.W. Analysis of radiometric, lifetime and fluorescent lifetime imaging for pressure sensitive paint. Aeronaut. J. 1998, 102, 189–194. [Google Scholar] [CrossRef]
- Juliano, T.J.; Kumar, P.; Peng, D.; Gregory, J.W.; Crafton, J.; Fonov, S. Single-shot, lifetime-based pressure-sensitive paint for rotating blades. Meas. Sci. Technol. 2011, 22, 085403. [Google Scholar] [CrossRef]
- Holst, G.; Kohls, O.; Klimant, I.; König, B.; Kühl, M.; Richter, T. A modular luminescence lifetime imaging system for mapping oxygen distribution in biological samples. Sens. Actuators B Chem. 1998, 51, 163–170. [Google Scholar] [CrossRef]
- Ruyten, W.; Sellers, M.E.; Baker, W.M. Spatially Nonuniform Self-Quenching of the Pressure-Sensitive Paint PtTFPP/FIB. In Proceedings of the 47th AIAA Aerospace Sciences Meeting Including the New Horizons Forum and Aerospace Exposition, Orlando, FL, USA, 5–8 January 2009. [Google Scholar] [CrossRef]
- Bell, J.H.; Sellers, M.E. Pressure Sensitive Paint Measurements on a Space Shuttle Model with the Luminescent Lifetime Technique. In Proceedings of the 21st International Congress on Instrumentation in Aerospace Simulation Facilities, Institute of Electrical and Electronics Engineers, Sendai, Japan, 29 August–1 September 2005; pp. 195–206. [Google Scholar] [CrossRef]
- Ruyten, W.; Sellers, M.E. Improved Data Processing for Pressure-Sensitive Paint Measurements in an Industrial Facility. In Proceedings of the 44th AIAA Aerospace Sciences Meeting and Exhibit, Reno, NV, USA, 9–12 January 2006. [Google Scholar] [CrossRef]
- Mitsuo, K.; Asai, K.; Takahashi, A.; Mizushima, H. Advanced Lifetime PSP Imaging System for Simultaneous Pressure and Temperature Measurements. In Proceedings of the 24th AIAA Aerodynamic Measurement Technology and Ground Testing Conference, Portland, Oregon, USA, 28 June–1 July 2004. [Google Scholar] [CrossRef]
- Watkins, A.N.; Jordan, J.D.; Leighty, B.D. Development of Next Generation Lifetime PSP Imaging System. In Proceedings of the 20th International Congress on Instrumentation in Aerospace Simulation Facilities, Göttingen, Germany, 25–29 August 2003; pp. 372–382. [Google Scholar] [CrossRef]
- Sugioka, Y.; Sato, H.; Nakakita, K.; Nakajima, T.; Nonomura, T.; Asia, K. In-flight visualization of shock wave on a jet aircraft wing using lifetime-based Pressure-Sensitive Paint Technique. In Proceedings of the AIAA Scitech Forum, San Diego, CA, USA, 7–11 January 2019. [Google Scholar] [CrossRef]
- Yorita, D.; Weiss, A.; Geisler, R.; Henne, U.; Klein, C. Comparison of LED and LASER based Lifetime Pressure-Sensitive Paint Measurement Techniques. In Proceedings of the 2018 AIAA Aerospace Sciences Meeting, Kissimmee, FL, USA, 8–12 January 2018. [Google Scholar] [CrossRef]
- Weiss, A.; Geisler, R.; Schwermer, T.; Yorita, D.; Henne, U.; Klein, C.; Raffel, M. Single-shot pressure-sensitive paint lifetime measurements on fast rotating blades using an optimized double-shutter technique. Exp. Fluids 2017, 58, 120. [Google Scholar] [CrossRef]
- Yorita, D.; Klein, C.; Henne, U.; Ondrus, V.; Beifuß, U.; Bruse, M. Improvement of PtTFPP-based PSP for Lifetime-based Measurement and Application to Transonic Wind Tunnel Test. In Proceedings of the 16th International Symposium on Flow Visualization—ISFV16, Okinawa, Japan, 24–28 June 2014. [Google Scholar]
- Yorita, D.; Henne, U.; Klein, C. Improvement of Lifetime-based PSP Technique for Industrial Wind Tunnel Tests. In Proceedings of the 55th AIAA Aerospace Sciences Meeting, Grapevine, TX, USA, 9–13 January 2017. [Google Scholar] [CrossRef]
- Roberts, D. Progress at ARA’s transonic wind tunnel in application of PSP for industrial testing. In Proceedings of the PSP-Workshop, AIAA SCITECH Forum, Orlando, FL, USA, 8–12 January 2024. [Google Scholar]
- Mébarki, Y.; Benmeddour, A. Pressure-Sensitive Paint Measurements on a Moving Store in the NRC 1.5 m Blowdown Wind Tunnel. In Proceedings of the 32nd AIAA Aerodynamic Measurement Technology and Ground Testing Conference, Washington, DC, USA, 13–17 June 2016. [Google Scholar] [CrossRef]
- Bruse, M.; (DNW—The German Dutch Wind-Tunnels, Göttingen, Germany). Personal communication, 2021.
- Schulz, M.; (ETW—European Transonic Windtunnel, Cologne, Germany). Personal communication, 2023.
- Ueda, Y. Notice of Discontinuation of Sony Semiconductor Corporation’s Kagoshima Wafer Production Line (CCD 200 mm Line). Available online: www.electronicspecifier.com/news/analysis/ccd-200mm-wafer-line-to-be-discontinued (accessed on 6 June 2024).
- Puklin, E.; Carlson, B.; Gouin, S.; Costin, C.; Green, E.; Ponomarev, S.; Tanji, H.; Goutermann, M. Ideality of Pressure-Sensitive Paint. I. Platinum tetra(pentafluorophenyl)porphine in fluoreacrylic polymer. J. Appl. Polym. Sci. 2000, 77, 2795–2804. [Google Scholar] [CrossRef]
- Egami, Y.; Fujii, K.; Takagi, T.; Matsuda, Y.; Yamaguchi, H.; Niimi, T. Reduction of Temperature Effects in Pressure Sensitive Paint Measurements. AIAA J. 2013, 51, 1779–1783. [Google Scholar] [CrossRef]
- The Transonic Wind Tunnel in Göttingen (TWG). Available online: www.dnw.aero/wind-tunnels/twg/ (accessed on 7 May 2024).
- Henne, U.; Yorita, D.; Klein, C. Application of Lifetime-Based Pressure-Sensitive Paint for Transonic Tests on a Generic Delta Wing Planform. In New Results in Numerical and Experimental Fluid Mechanics XII; Dillmann, A., Ed.; Springer: Cham, Switzerland, 2020; Volume 142, pp. 287–296. [Google Scholar] [CrossRef]
- Egami, Y.; Fey, U.; Klein, C.; Quest, J.; Ondrus, V.; Beifuss, U. Development of new two-component temperature-sensitive paint (TSP) for cryogenic testing. Meas. Sci. Technol. 2012, 23, 115301. [Google Scholar] [CrossRef]
- Klein, C.; Engler, R.H.; Henne, U.; Sachs, W.E. Application of pressure-sensitive paint for determination of the pressure field and calculation of the forces and moments of models in a wind tunnel. Exp. Fluids 2005, 39, 475–483. [Google Scholar] [CrossRef]
Disclaimer/Publisher’s Note: The statements, opinions and data contained in all publications are solely those of the individual author(s) and contributor(s) and not of MDPI and/or the editor(s). MDPI and/or the editor(s) disclaim responsibility for any injury to people or property resulting from any ideas, methods, instructions or products referred to in the content. |
© 2024 by the authors. Licensee MDPI, Basel, Switzerland. This article is an open access article distributed under the terms and conditions of the Creative Commons Attribution (CC BY) license (https://creativecommons.org/licenses/by/4.0/).