Article

Improving the Two-Color Temperature Sensing Using Machine Learning Approach: GdVO4:Sm3+ Prepared by Solution Combustion Synthesis (SCS)

1
Institute of Physics, University of Belgrade, Pregrevica 118, 11080 Belgrade, Serbia
2
AMI, d.o.o, 2250 Ptuj, Slovenia
3
Department of Condensed Matter Physics, University of Zaragoza, E-50009 Zaragoza, Spain
4
Instituto de Nanociencia y Materiales de Aragón, University of Zaragoza-CSIC, E-50018 Zaragoza, Spain
5
Laboratorio de Microscopías Avanzadas, Univervisity of Zaragoza, E-50018 Zaragoza, Spain
*
Authors to whom correspondence should be addressed.
Photonics 2024, 11(7), 642; https://doi.org/10.3390/photonics11070642
Submission received: 6 June 2024 / Revised: 2 July 2024 / Accepted: 3 July 2024 / Published: 6 July 2024
(This article belongs to the Special Issue Editorial Board Members’ Collection Series: Photonics Sensors)

Abstract

:
The gadolinium vanadate doped with samarium (GdVO4:Sm3+) nanopowder was prepared by the solution combustion synthesis (SCS) method. After synthesis, in order to achieve full crystallinity, the material was annealed in air atmosphere at 900 °C. Phase identification in the post-annealed powder samples was performed by X-ray diffraction, and morphology was investigated by high-resolution scanning electron microscope (SEM) and transmission electron microscope (TEM). Photoluminescence characterization of emission spectrum and time resolved analysis was performed using tunable laser optical parametric oscillator excitation and streak camera. In addition to samarium emission bands, a weak broad luminescence emission band of host VO43− was also observed by the detection system. In our earlier work, we analyzed the possibility of using the host luminescence for two-color temperature sensing, improving the method by introducing the temporal dependence in line intensity ratio measurements. Here, we showed that further improvements are possible by using the machine learning approach. To facilitate the initial data assessment, we incorporated Principal Component Analysis (PCA), t-Distributed Stochastic Neighbor Embedding (t-SNE) and Uniform Manifold Approximation and Projection (UMAP) clustering of GdVO4:Sm3+ spectra at various temperatures. Good predictions of temperature were obtained using deep neural networks. Performance of the deep learning network was enhanced by data augmentation technique.

1. Introduction

In this paper, we present the results of experimental investigation of Sm3+-doped GdVO4 nanopowders. Nanopowder GdVO4:Sm is an efficient orange-reddish light-emitting material [1]; light emission occurs due to a strong absorption of ultraviolet light by GdVO4 and efficient energy transfer from vanadate groups (VO43−) to dopants (Sm3+). It is a good candidate for phosphor thermometry [1,2] Here, it is prepared by the solution combustion synthesis (SCS) method [1]. Simplicity and low cost are the main characteristics of this process. Phase identification in the post-annealed powder samples is performed by X-ray diffraction, and morphology is investigated by high-resolution scanning electron microscope (SEM) and by transmission electron microscopy (TEM). The main aim of this study is time-resolved analysis of luminescence properties of GdVO4:Sm3+ nanopowders. The possibility for GdVO4:Sm3+ usage in phosphor thermometry was analyzed in ref. [2], where temperature determination of sensing calibration curves was based on luminescence intensity ratios of samarium lines. In ref. [1], we used the intensity ratio of the host luminescence emission and samarium line to obtain temperature-sensing calibration curves, as proposed in refs. [3,4,5,6]. Calculation of temperature by intensity ratio of two luminescence peaks of different colors is called two-color thermometry. In ref. [1], the method was improved by introducing temporal dependence in the ratio measurements, as proposed in ref. [7]. Here, we propose a different approach, based on machine learning (ML). ML techniques are more and more used in the analysis of luminescence, near-infrared, and other spectral data [8,9,10,11,12,13,14,15,16,17,18]. Our findings demonstrate that instead of the conventional approach of identifying spectral peaks and calculating intensity ratios, it is feasible to train computer software to recognize time-resolved spectra associated with different temperatures of the thermophosphor. Traditionally, luminescence thermometric methods rely on analyzing a single spectral characteristic parameter, selected based on the properties of the thermophosphor and the researcher’s intuition or experience. This approach leads to a partial utilization of spectral data, limiting measurement accuracy and thermal resolution. In contrast, the authors of [12] trained a deep learning artificial neural network to extract multiple temperature-dependent features for temperature estimation, fully utilizing temperature-dependent spectral data. However, the spectral data in ref. [12] did not include temporal information. In our research, we take a step further by incorporating time-resolved spectra into machine learning (ML)-based temperature estimation using a deep learning artificial neural network. This approach allows us incorporation of the thermophosphor’s lifetime dependence into our analysis. In ref. [18], our measurements were aimed to be used by ML. We performed 50 measurements for each temperature of the sample. Upon inspecting the measured spectra in ref. [18], we realized that they have very small intensity differences, as expected. The main differences between the spectra acquired at the same temperature were contents of random noise introduced by the photon-counting operation of streak camera. On the other hand, in this study, we analyze measurements which were not obtained specifically for ML; in other words, there was not a large enough training set of training data for ML. To overcome this difficulty. we used the data augmenting techniques; see [19] and references therein.

2. Materials and Methods

GdVO4 nanopowder doped with samarium ions was prepared by the solution combustion method, as described in ref. [1]. Stoichiometric quantities of starting chemicals Sm(NO3)3, Gd(NO3)3·6H2O, and NH4VO3 with the purity of 99.99% were chosen to obtain the Sm3+ concentration in GdVO4 of 1 at.% (Gd1-0.01Sm0.01VO4). All the chemicals and ammonium nitrate NH4NO3 were purchased from ABCR, and urea, (NH2)2CO, from Sigma-Aldrich Merck KGaA, Darmstadt, Germany. The dry mixture of 0.134 g (0.4 mmol) of Sm(NO3)3, 18.05 g (40 mmol) of Gd(NO3)3·6H2O, and 4.676 g (40 mmol) of NH4VO3 was combined with the mixture of 4.8 g (60 mmol) of ammonium nitrate and 3.003 g (50 mmol) of urea, which were used as organic fuels. The prepared starting reagents were combusted with aflame burner at approximately 500 °C, yielding a voluminous foamy powder in an intensive exothermic reaction. After the solution combustion synthesis, the nanopowder was annealed for 2 h, in air atmosphere, at 900 °C. Annealing has an effect on increasing the grain size of the nanopowders and it is widely used to achieve higher emission intensity.
The structure of the nanopowder was verified by X-ray diffraction analysis using a Diffractometer system: EMPYREAN, PANalytical. X-ray diffraction analysis (XRD) was performed using a X-ray Diffractometer PANalytical Empyrean, Malvern Panalytical, Malvern, United Kingdom with monochromatic CuK α radiation (γ = 0.15405980) at 45 kV and 40 mA. The diffraction data for the GdVO4-Sm nanopowder were collected over a 2θ range from 5 to 110° at a scan rate of 0.4° per minute.
The morphology of nanopowders and the size of crystallites were determined by a high-resolution scanning electron microscope (SEM) equipped with a high-brightness Schottky Field Emission gun FEGSEM, TESCAN Brno—Kohoutovice Czech Republic. The morphology of GdVO4-Sm nanopowder was also evaluated by transmission electron microscopy (TEM), FEI Tecnai F30 Hillsboro, Oregon, United States. Photoluminescence (PL) studies reported in this work were performed using the Optical Parametric Oscillator Vibrant OPO Carlsbad, California USA, as described in ref. [1]. The output of the OPO can be continuously tuned over a spectral range from 320 nm to 475 nm. Time-resolved streak images of the emission spectrum excited by the OPO system were collected using a spectrograph (SpectraPro 2300i), Teledyne Princeton Instruments, New Jersey USA and recorded with a Hamamatsu streak camera (model C4334), Hamamatsu City, Japan. All streak camera operations were controlled by HPD-TA 8.3.0 (High-Performance Digital Temporal Analyzer) software. For measurements presented here, we used a homemade temperature control system, similar to the one in ref. [20].
To perform the machine learning (ML) analysis of the data, we utilized the Solo + Mia software package (Version 9.1, Eigenvector Research Inc, Manson, Washington USA). Solo provides a user-friendly environment, making it usable to individuals without programming expertise.
The measured spectra were initially analyzed using Principal Component Analysis (PCA) and Uniform Manifold Approximation and Projection clustering (UMAP). PCA was originally introduced in ref. [21], and for further details, we refer the reader to [22] and the referenced sources therein. Efficient implementation of t-SNE is proposed in ref. [23].
UMAP, a novel clustering technique suitable for visualizing extensive datasets, was recently proposed in ref. [24]. Ultimately, after conducting preliminary visualization experiments, we employed a deep learning artificial neural network to estimate the temperature of the heated samples.

3. Results

3.1. TEM, XRD, and SEM Study

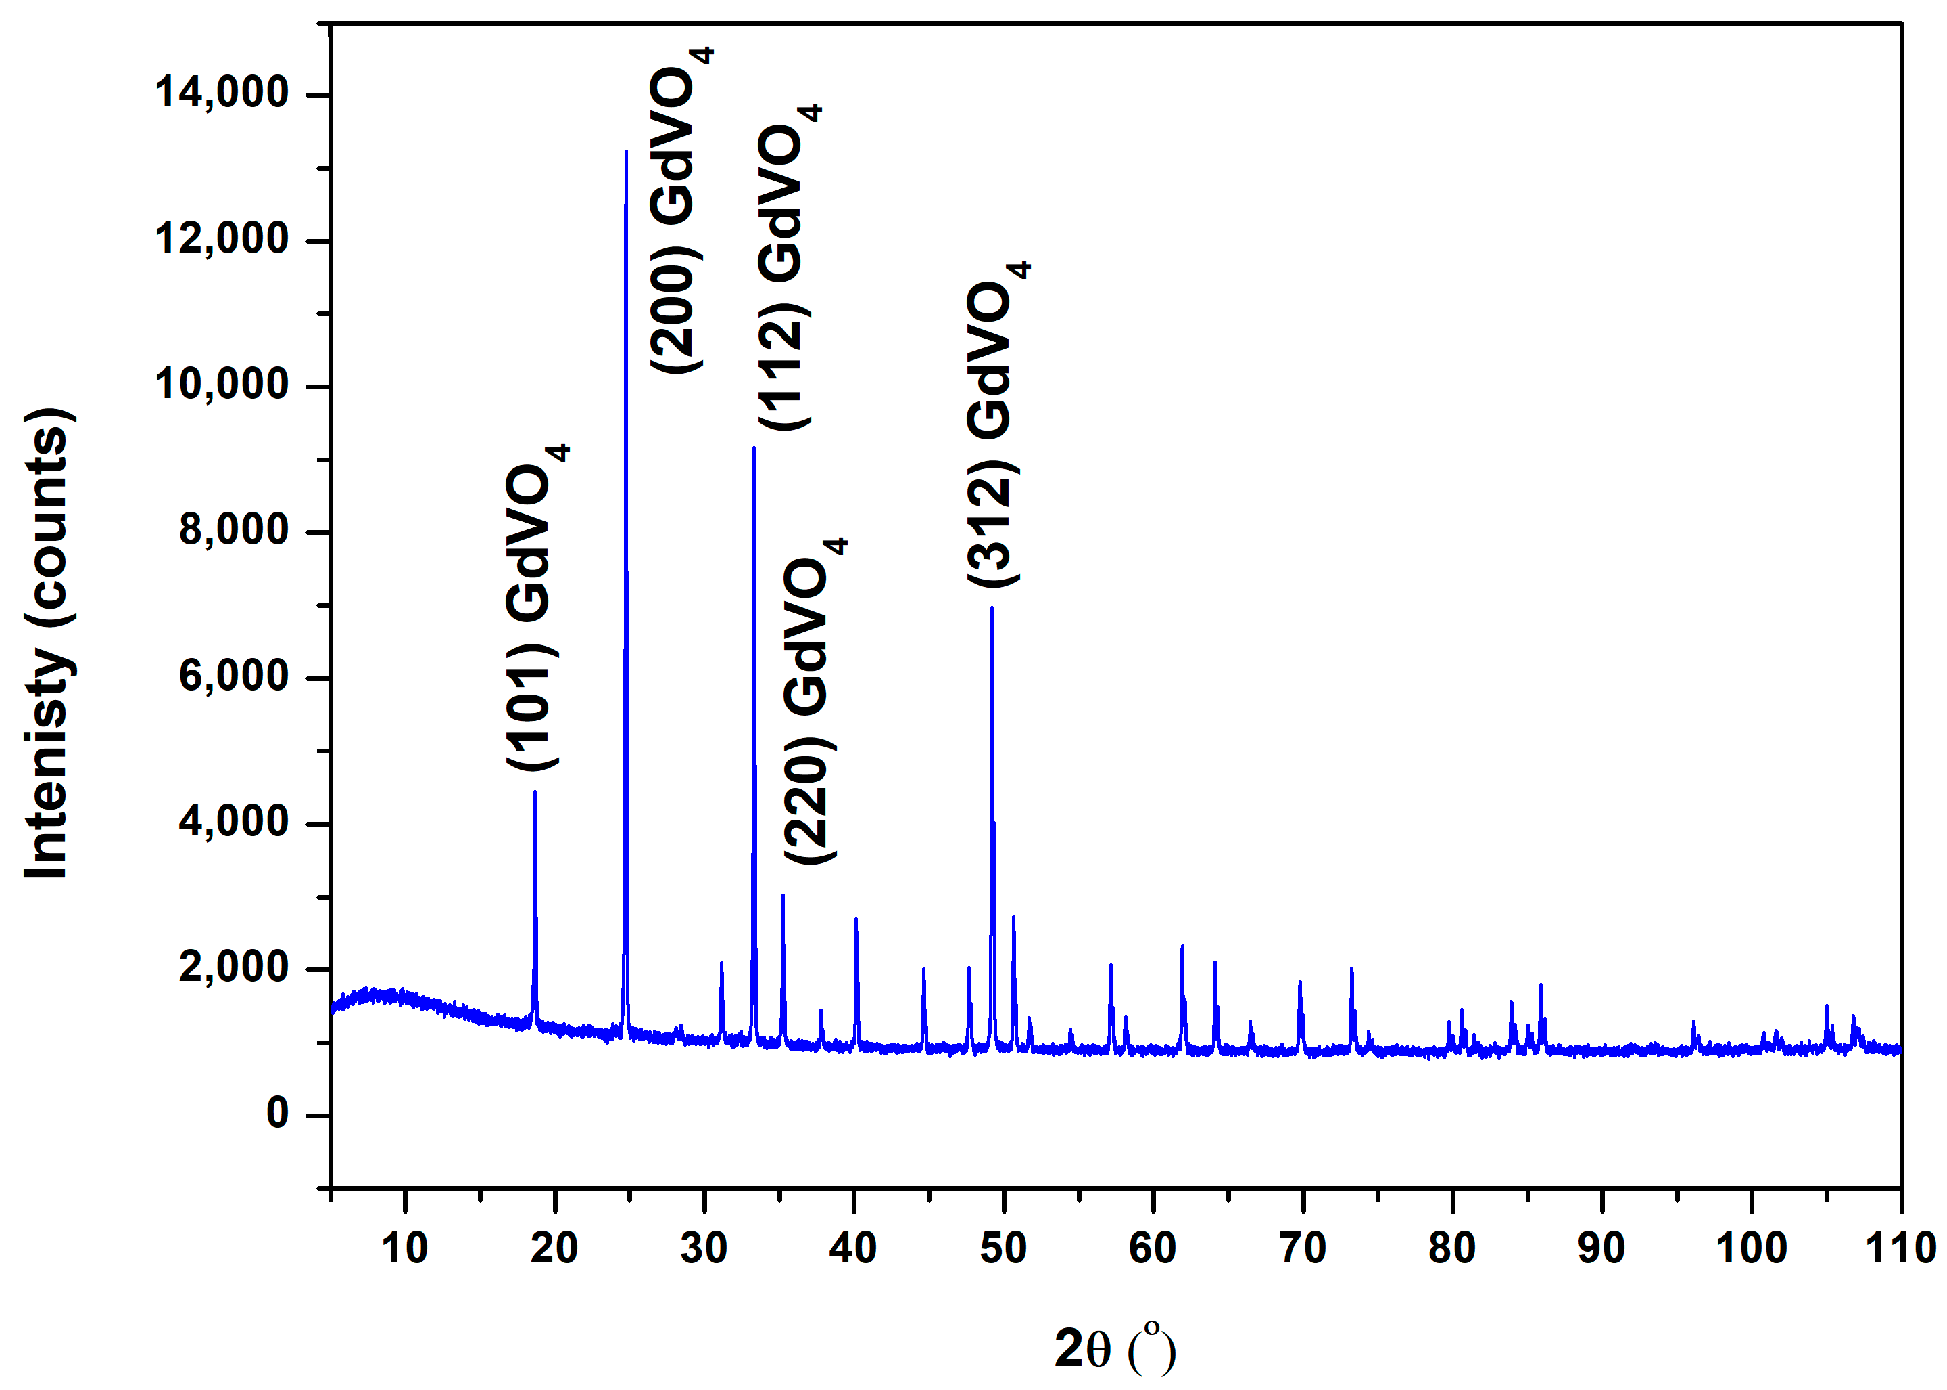
The morphology of GdVO4:Sm nanopowder was evaluated by transmission electron microscopy (TEM). TEM analysis shows the presence of slightly elongated particles formed by much smaller monocrystals as presented in Figure 1a. High-resolution TEM (HRTEM) shown in Figure 1b exposes their good crystallinity, clear lattice fringes, and the interplanar spacing of 4.77 Å, which might be associated with the (101) plane of the tetragonal GdVO4 phase. Selected area electron diffraction (SAED) and fast Fourier transform (FFT) analyses revealed d values of 4.77 Å, 3.61 Å, 2.69 Å, 2.55 Å, and 1.86 Å, which match well with the (101), (200), (112), (220), and (312) crystal planes of the tetragonal GdVO4 phase (JCPDS 00-017-0260). We confirmed the coexistence of a cubic Gd2O3 phase, specifically the (222) and (400) planes, with the corresponding d values of 3.11 Å and 2.70 Å (JCPDS 01-073-6280). In addition, the monophase composition of particles was identified by the presence of the above-mentioned crystal planes with d values corresponding well to those obtained through the X-ray diffraction (XRD) analysis of the sample presented in Figure 2.
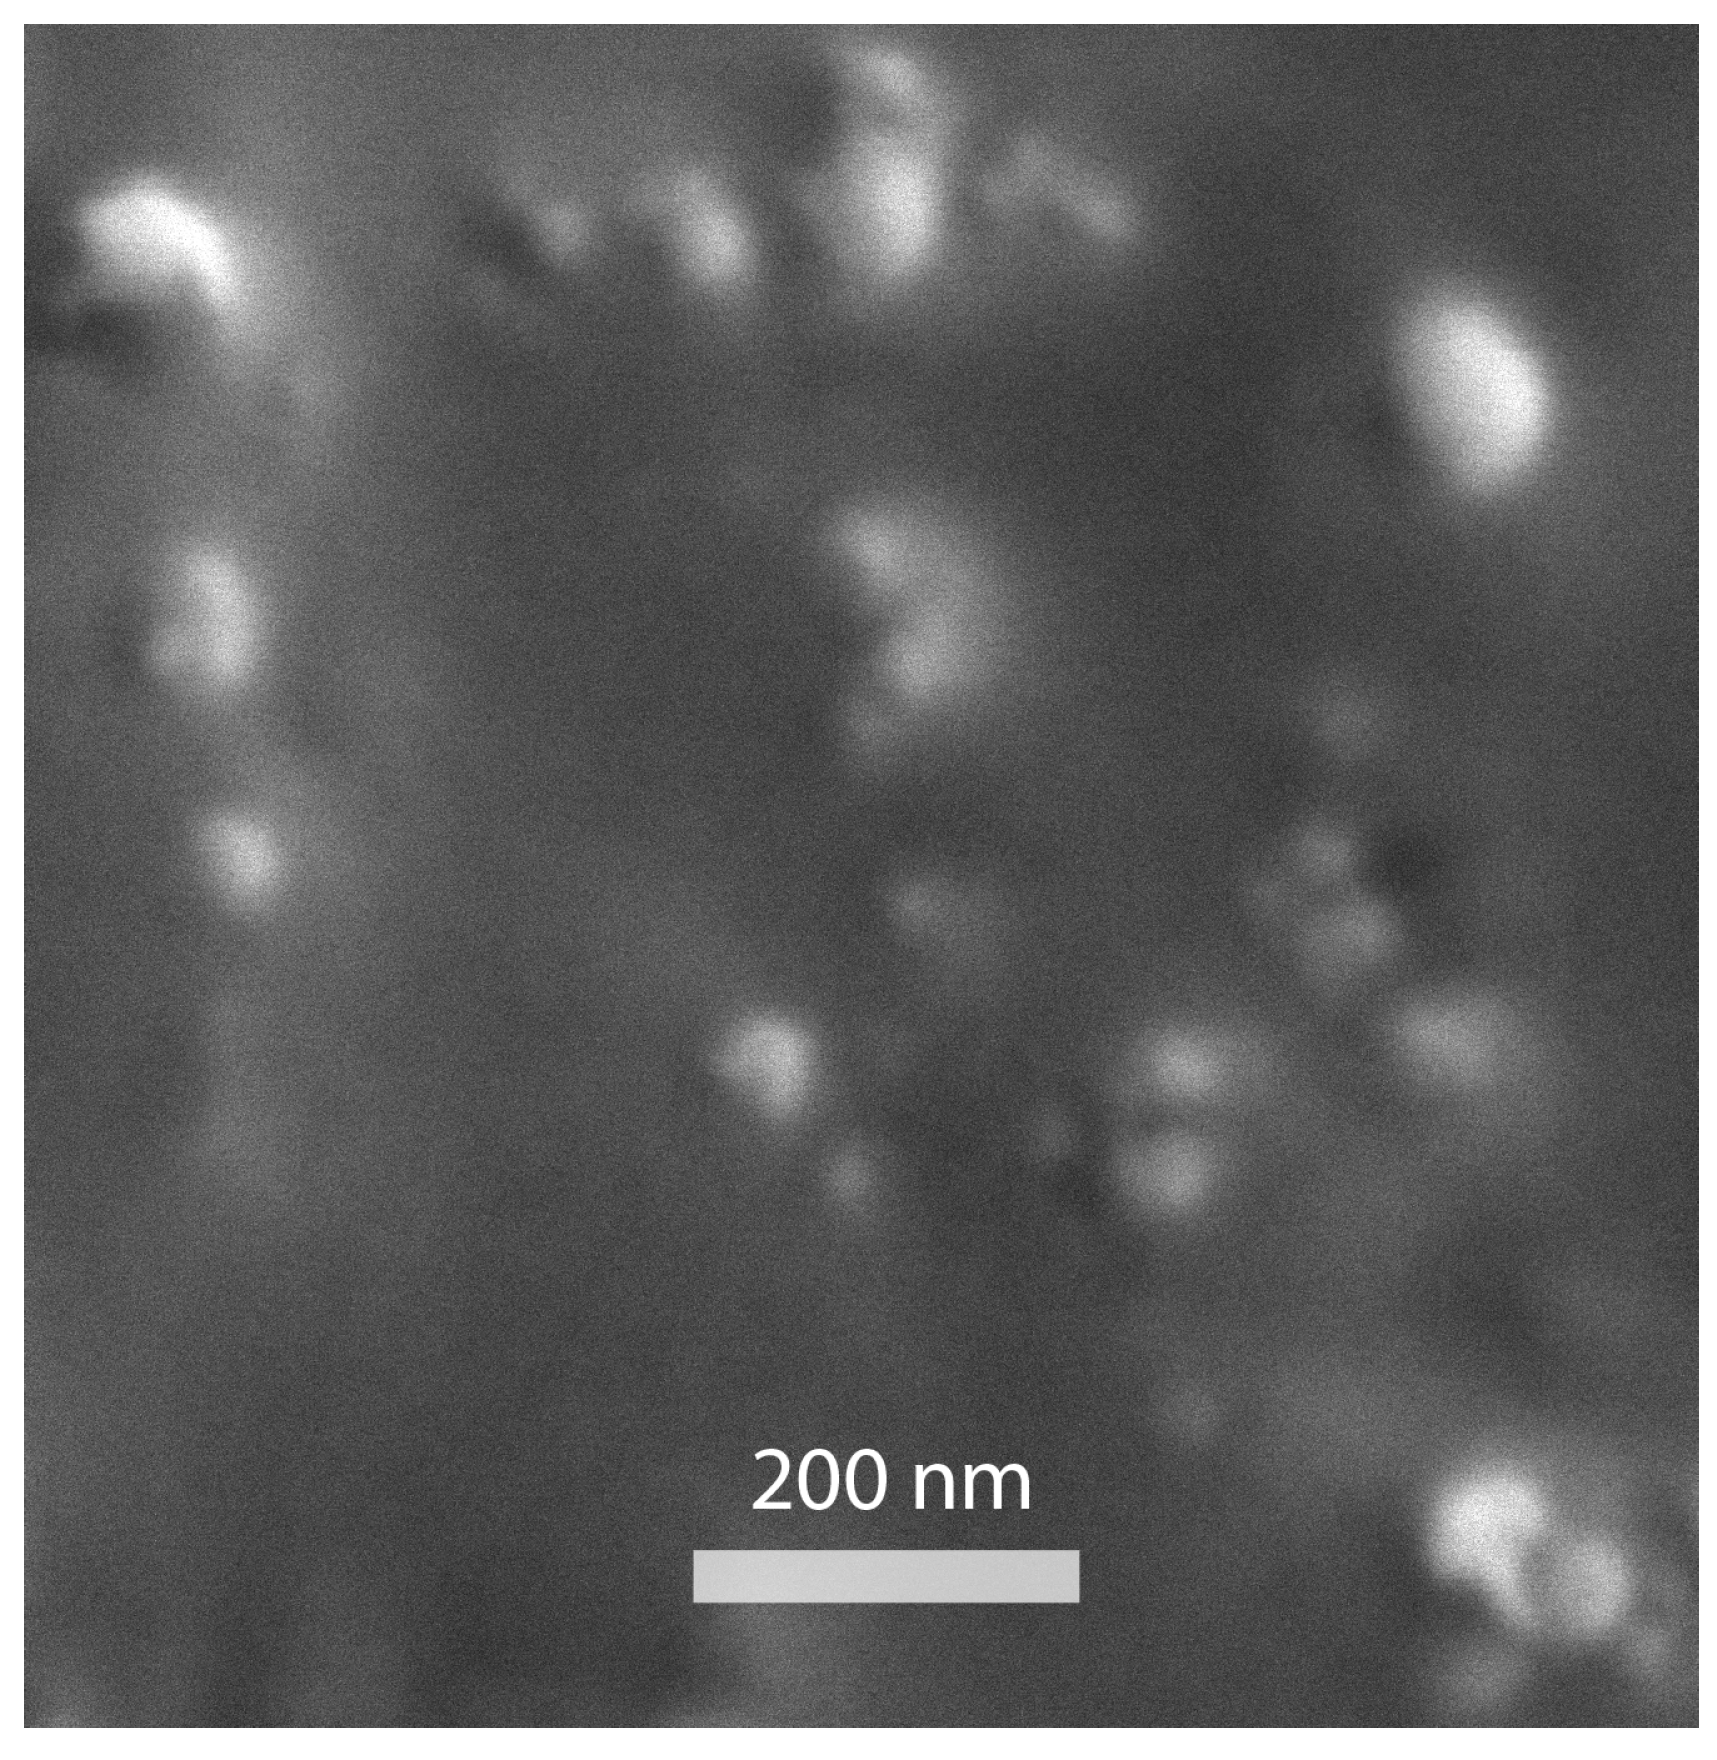
The particle size and morphology of the GdVO4:Sm nanopowders were characterized by SEM (Figure 3). Some particles were agglomerated as clusters; however, individual spherical shaped particles are also visible in Figure 3. The estimated average particle size was about 50 nm. Looking at the SEM image (Figure 3), it is likely that the sizes of individual particles of nanopowders were about from 30 nm and up to 100 nm.

3.2. Photoluminescence and Lifetime Analysis

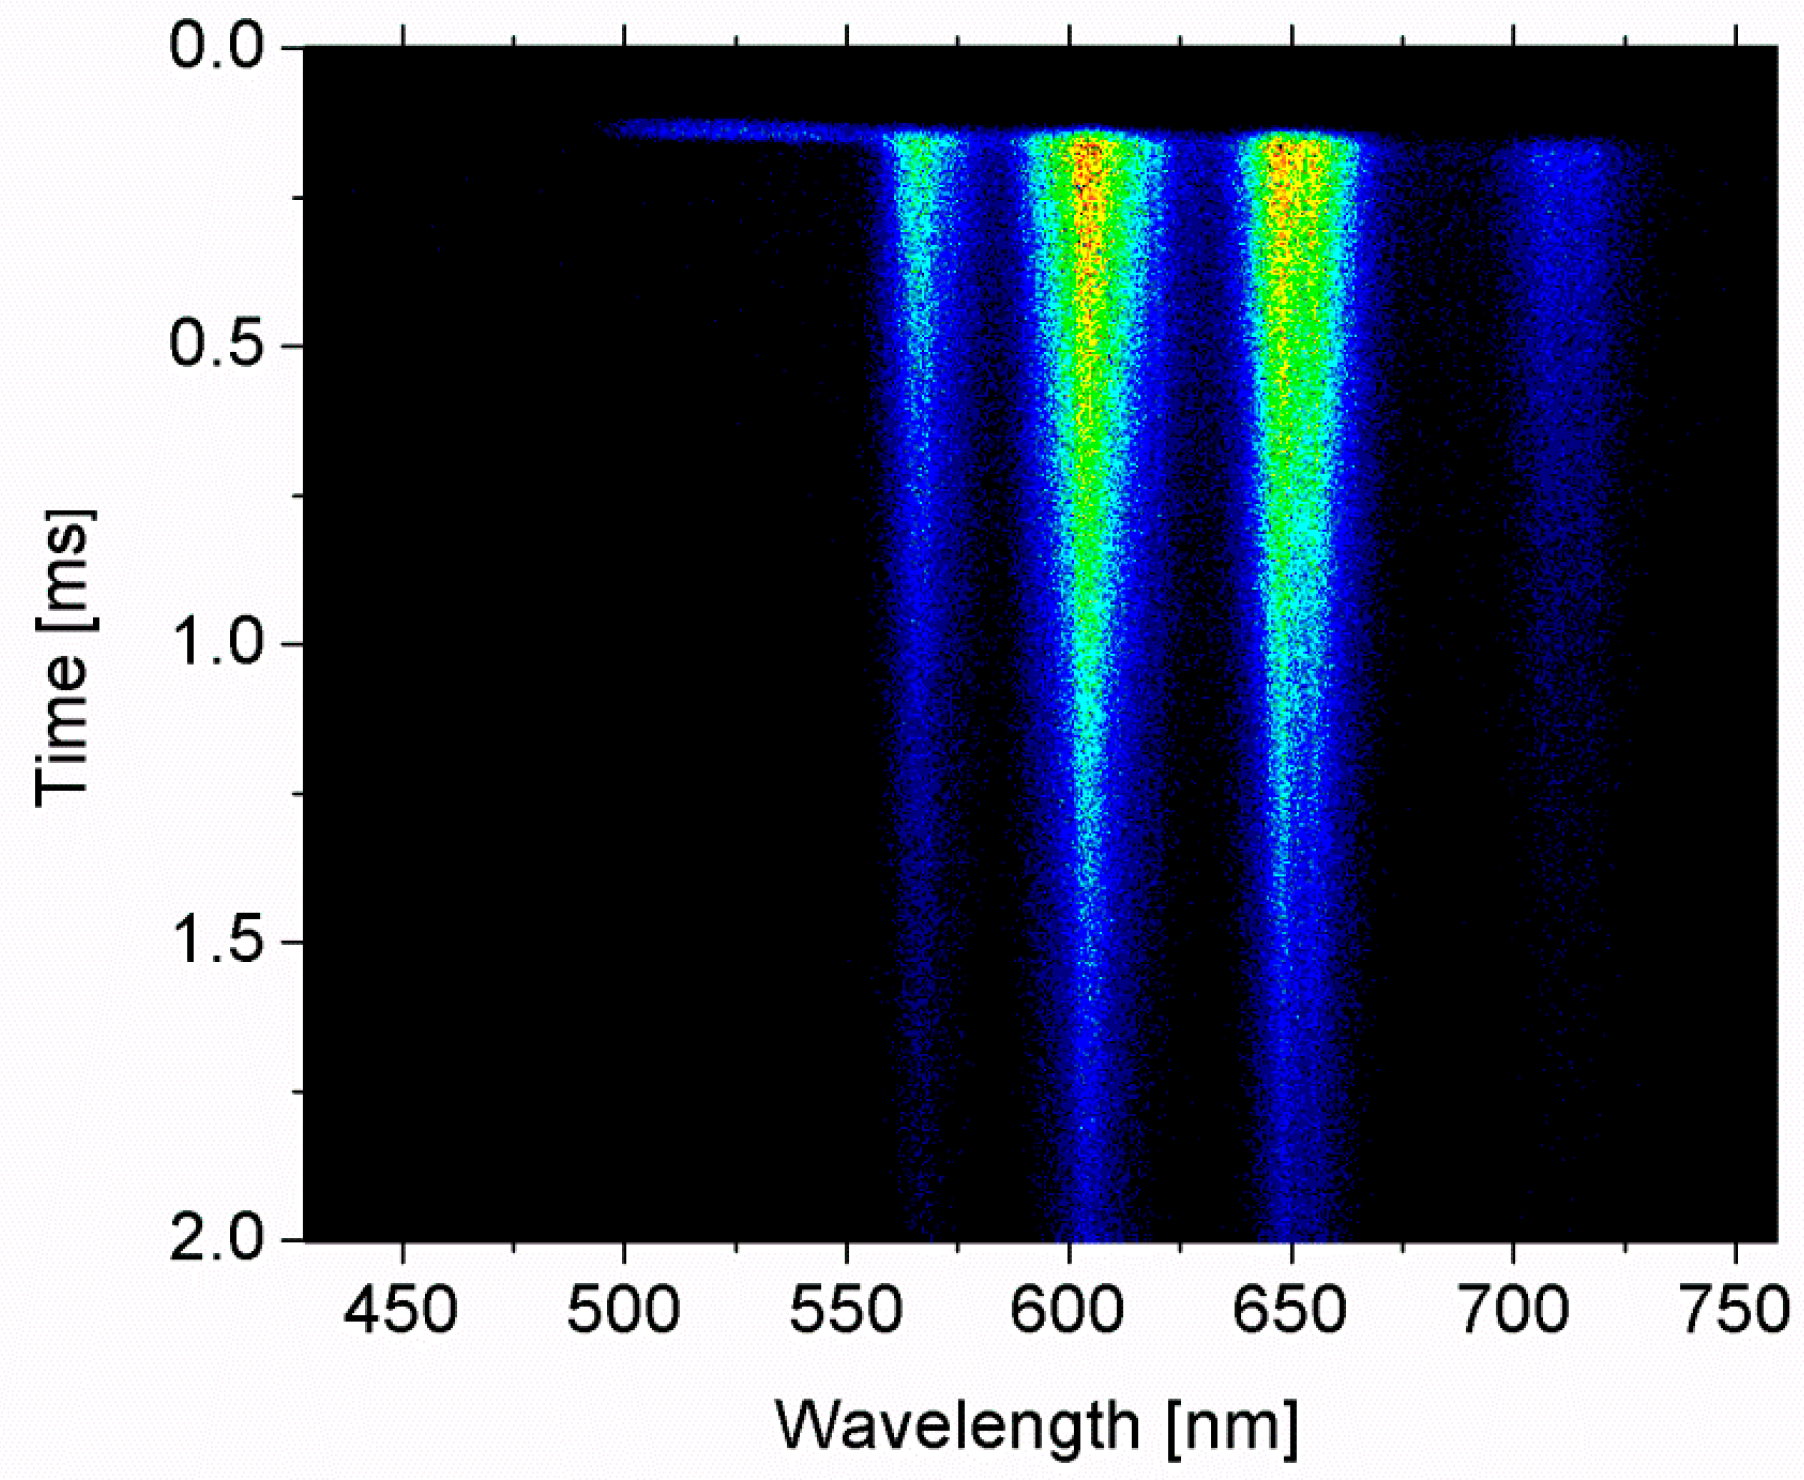
The streak image of the time-resolved photoluminescence spectrum of GdVO4:Sm3+ using the 330 nm excitation is presented in Figure 4. The horizontal scale of the streak image corresponds to wavelength and the vertical scale shows the development of spectra in time. Images are usually presented in pseudocolor, where different colors mean different optical intensities. Using camera software, it was determined that the estimated lifetime of the most prominent samarium optical emission from the 4G5/2 level is 0.78 ms at room temperature [1].

3.3. Photoluminescence and Lifetime Analysis Temperature Dependence of Photoluminescence

The new concept based on using the host luminescence for the luminescence intensity ratio method was introduced; for more details, see [4] and references therein. In our previous study [1], the method was improved by introducing temporal dependence in the intensity ratio measurements, as proposed in ref. [7]. Namely, it was possible to increase the sensitivity of the curve of intensity ratio between the host and samarium luminescence if the appropriately selected part of temporal evolution is used in calculation. This was our early attempt to improve the temperature estimation by introducing the temporal characteristics of luminescence emission, recorded by the streak camera. In ref. [25], we combined several methods for temperature measurements to obtain the best results.
The luminescence spectra of GdVO4:Sm nanopowder were measured at various temperatures using OPO excitation at 330 nm and streak camera. Figure 5 shows the luminescence emission of GdVO4:Sm nanopowder at two temperatures.
Figure 6, which provides analysis of temperature dependence at eight different temperatures, is used in other analyses in this manuscript. Figure 6a shows changes in intensity ratios of luminescence peaks. Figure 6b shows and summarizes changes in luminescence lifetimes.
It can be seen in Figure 5 and Figure 6 that intensity ratios between different peaks vary with changing the temperature of the sample. Moreover, lifetimes of luminescence emission decreases with the increase in temperature. So, it is intuitively clear that taking into account the intensity ratio and the lifetime of the luminescence emission provides better temperature estimation. The analysis will be further improved if the intensities of all prominent peaks are included into temperature estimation. The natural answer to the question of how to achieve all this is to use machine learning methods applied to streak images.
In this study, the spectra were measured at 640 wavelength points. The time axis of a streak image has 480 points. To alleviate the computational burden of machine learning computations, we selectively chose specific portions of the streak image that contained the majority of the spectral and time-resolved information. After some experimenting, for the ML analysis, we focused on 90 spectral points corresponding to bands between 558 nm and 568 nm, 592 nm and 612 nm, and 641 nm and 656 nm. The selected time frame consisted of 120 points. A total of 80 points were from a streak image with the time range of 100 µs, equivalent to approximately 80 × 100/480 = 16.66 µs, starting from 25 µs. Another 40 points dwere from a streak image (of the same sample at the same temperature) with the time range of 5 ms, equivalent to approximately 40 × 5000/480 = 416.66 µs, starting from 826 µs. In this way, there was sufficient information to highlight the intensity ratios and temporal decrease in luminescence. We see the omitted points as a computational burden, because in our earlier attempts, with larger ROIs, there were no increases in performance of the deep leaning network, just longer computational time.
To understand the following improvement of neural network performance, let us point out that the rows of the streak image correspond to the spectra of the image at a certain time, defined by the columns of the streak image. So, further improvement in performance was achieved when we replaced five rows of selected ROI with one row. In other words, each pixel of the new row was calculated as a mean value of five points of the same wavelength successive in time. Thus, we obtained an increased performance of the neural network (in a sense of root standard errors) because of the mean filtering of columns; moreover, we obtained calculations faster because of the reduced numbers of rows.
As a result, each sample used for ML analysis comprised 120/5 × 90 = 24 × 90 = 2160 data points. To generate the input vector of 2160 data points, the pixel rows of each of the selected spectral bands in the image were packed sequentially in time row by row. In SOLO software, we used also two preprocessing techniques on neural network input: data, normalization, and data smoothing.
In order to construct the temperature calibration curve presented in ref. [1], we conducted measurements on samples at regular intervals of about 50 degrees Celsius, ranging from 27 °C to 350 °C. Measurements for temperature estimation were performed at two time ranges, 100 µs and 5 ms. However, the number of measurements was obviously insufficient for ML training. To obtain the larger training data set, we decided to use image data augmenting techniques. A nice survey on image data augmentation for deep learning is presented in ref. [19].
As a clue to augmentation of our measured spectra, we used the experience from our earlier publication where measurements were carried out with the intention to be used for ML analysis, taking 50 streak images for each temperature. The visualization of these training data in ref. [18] by PCA and UMAP showed that the measured spectra at each temperature had similar characteristics. By looking at the spectral profiles, it could be seen that they were almost the same, differing only by random noise.
Here, we use the same spectra, measured in ref. [1]. In order to obtain augmented training set for ML analysis, we used the simple technique based on the properties of the acquired streak images. Keeping in mind that the luminescence lifetime of this material is about 0.78 ms, it is easy to see that translating the region of interest of a streak image by several rows results in almost negligible intensity change and a clear difference in random noise added by the photon counting mode. After selecting the region of interest for analysis, the shifting of the vertical offset of ROI was defined by a random number generator, serving the purpose of augmenting the training data set. The procedure was coded in the C language. We first used the training set consisting of 10 samples for each temperature. The training data for each temperature were added sequentially using batch processing to obtain a training data file readable by SOLO software.
To check the usefulness of constructed training set and the actual diversity of data, we used several visualization techniques.
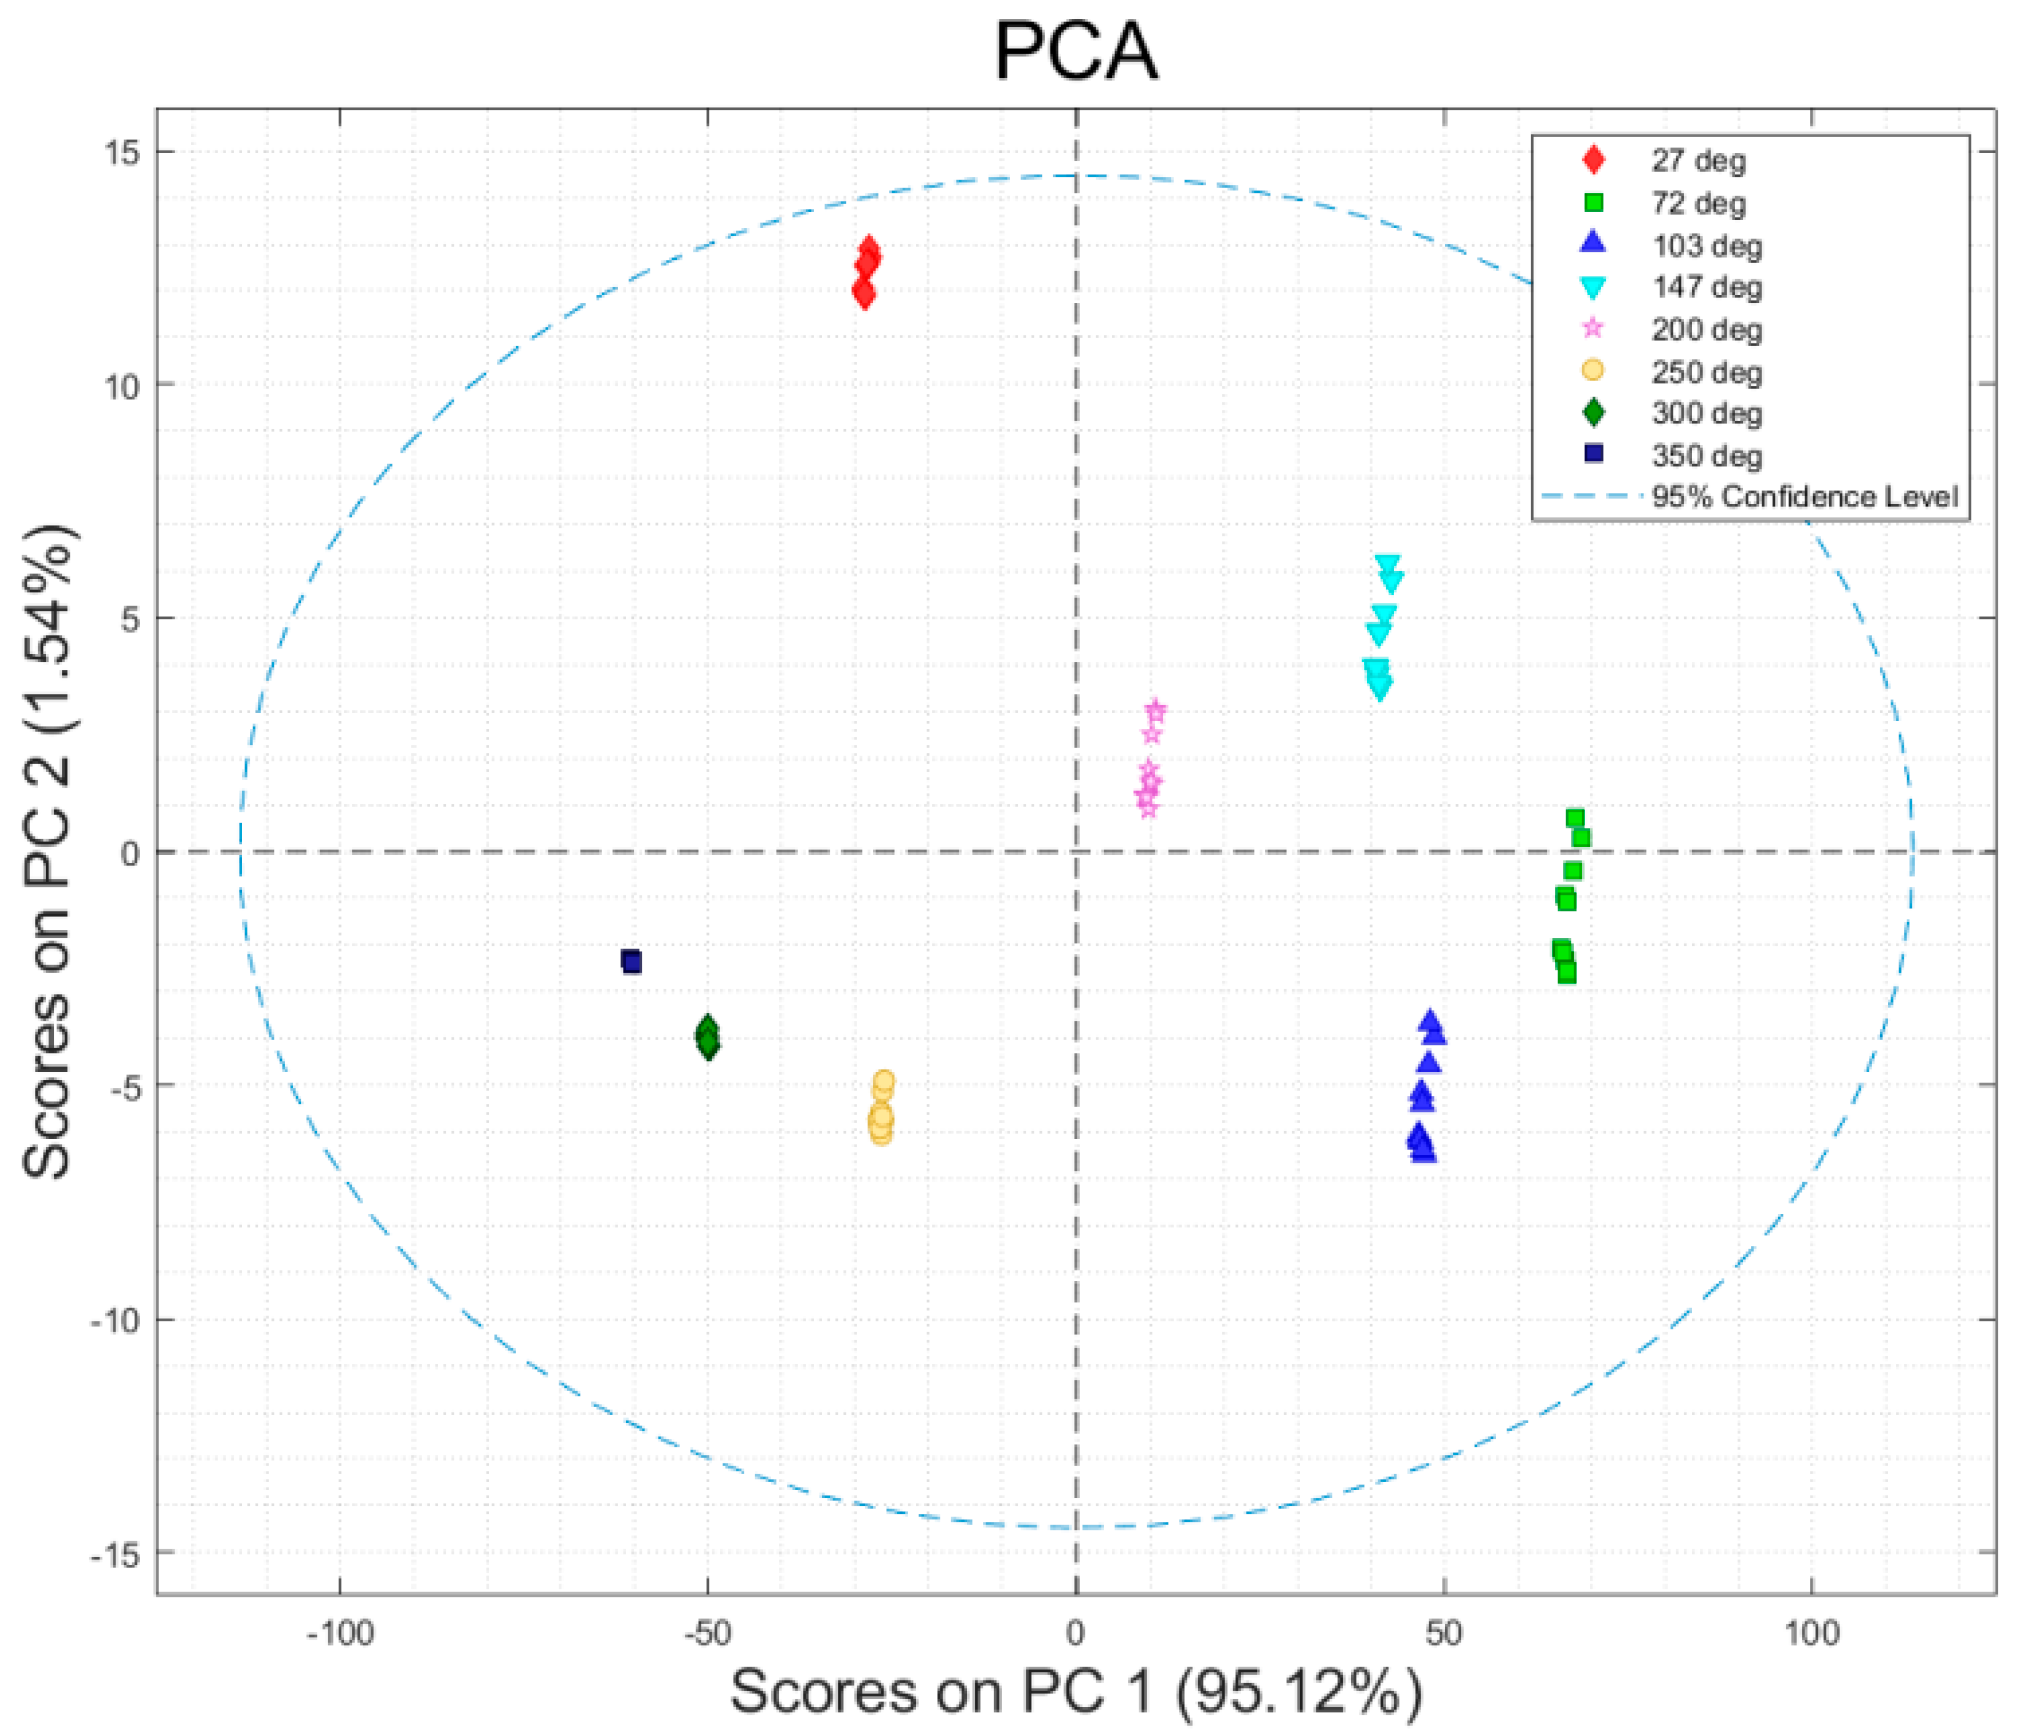
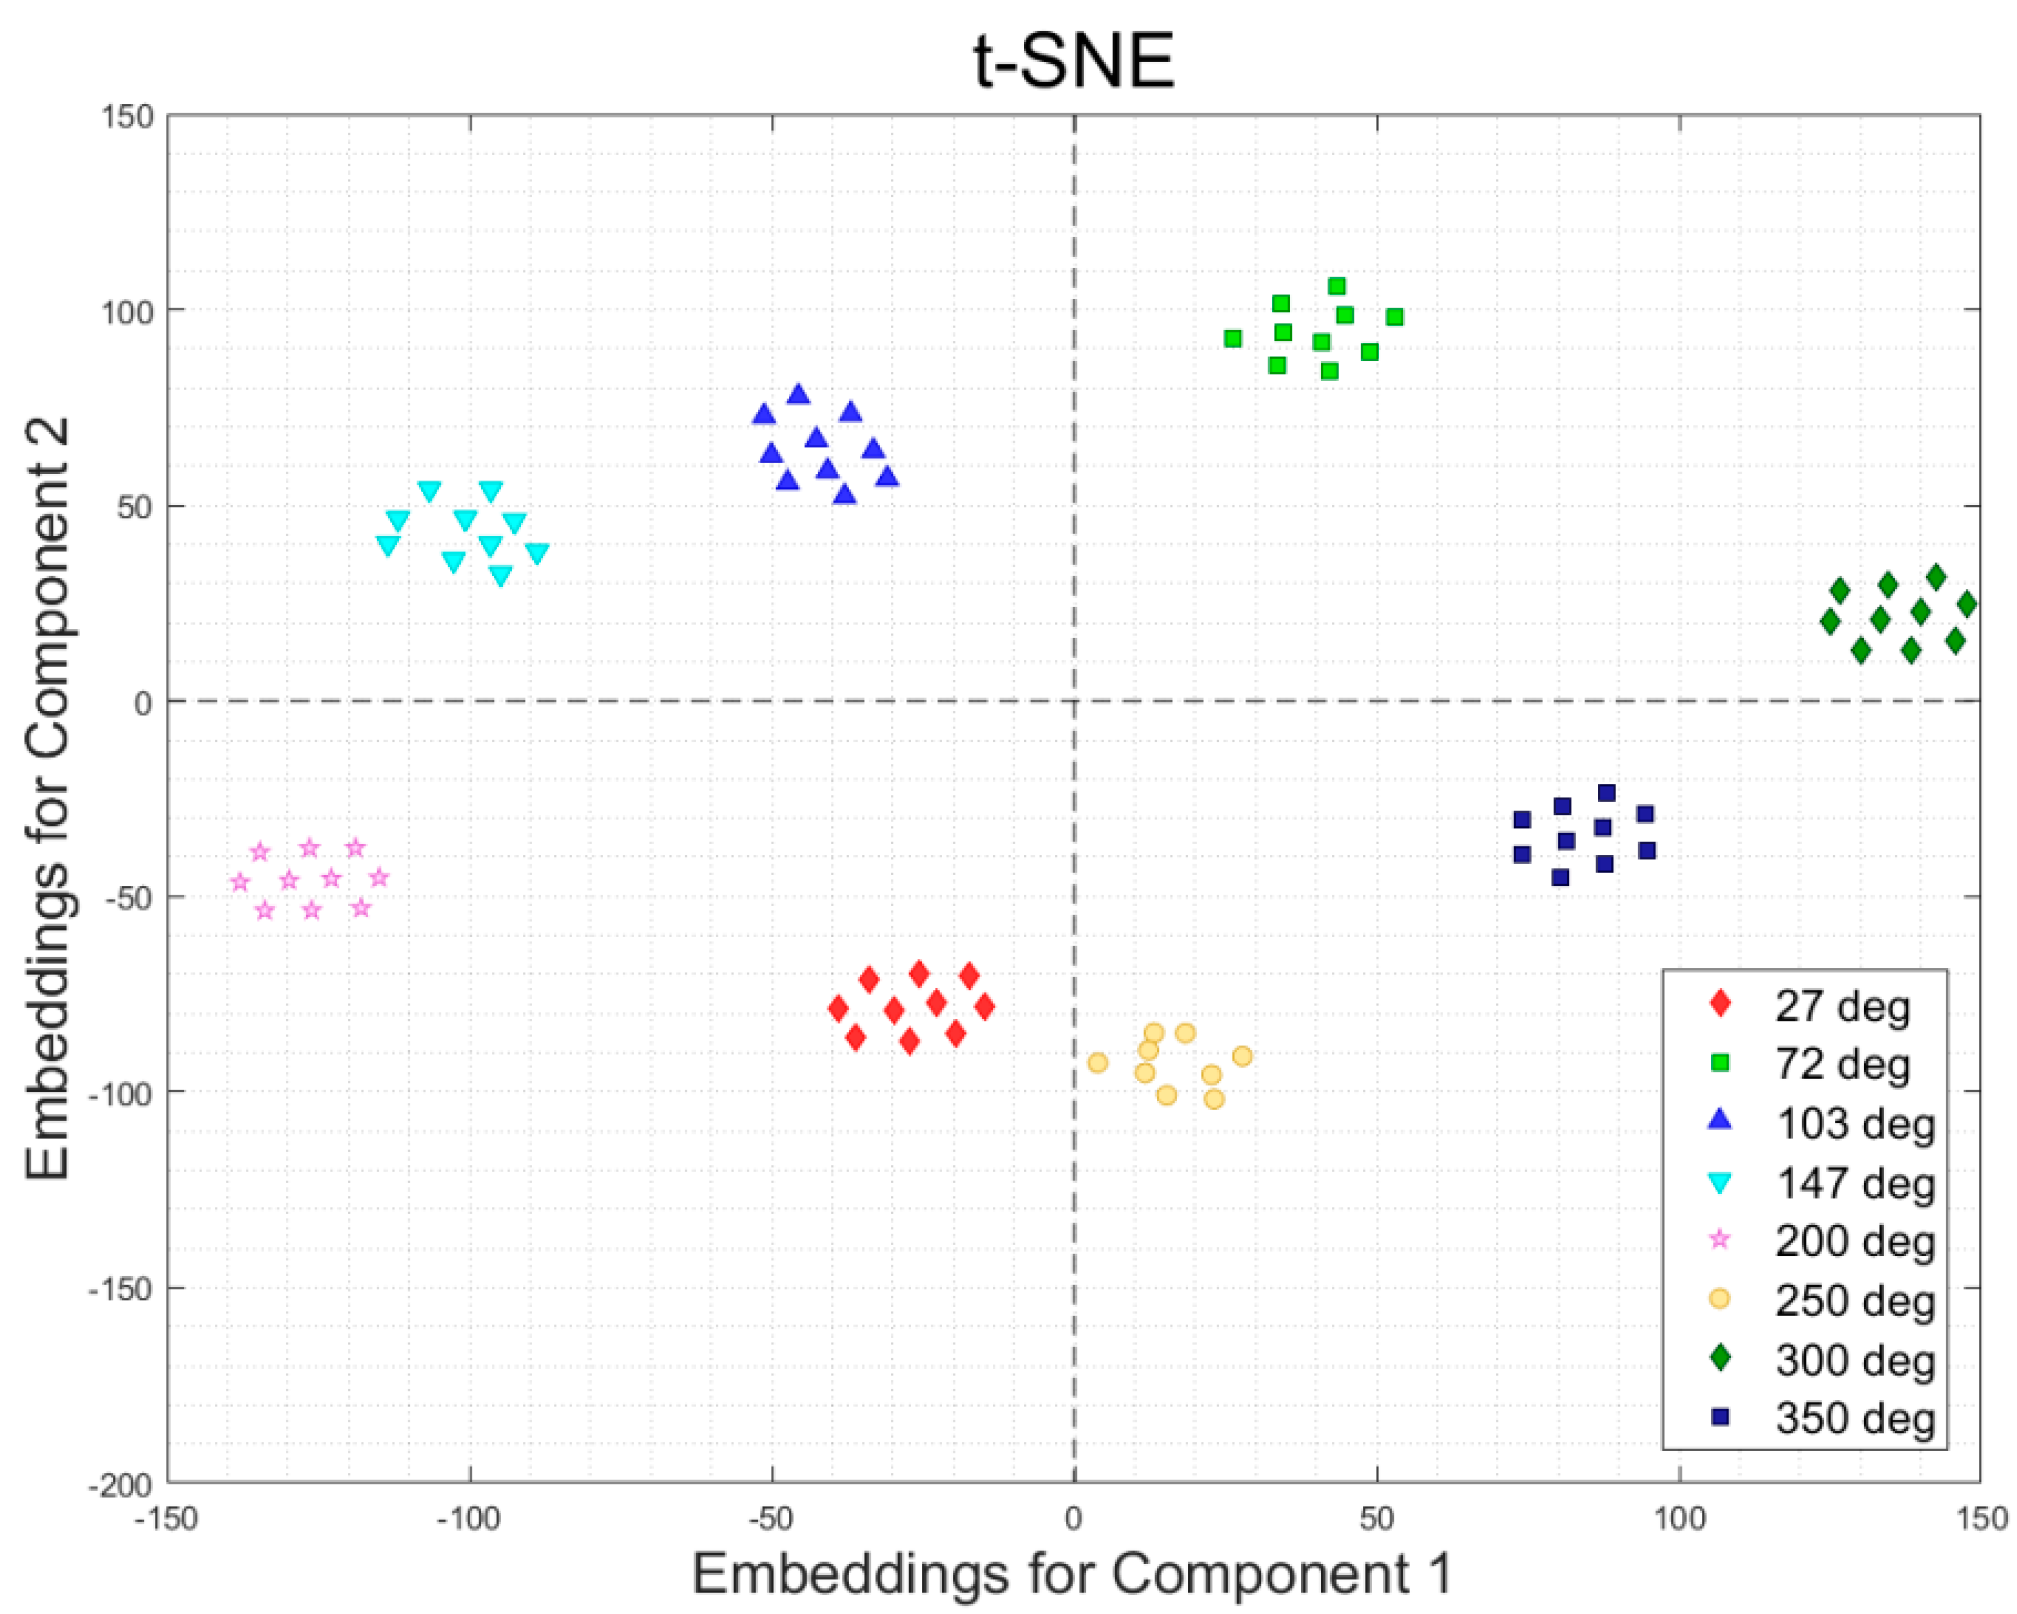
Principal Component Analysis (PCA) score plots serve as a valuable tool for initial data assessment and verification. In Figure 7, the scores on the first three principal components of GdVO4:Sm3+ spectra at different temperatures are displayed. It is noticeable that spectra obtained at similar temperatures tend to cluster together, although not perfectly. Consequently, to facilitate the initial data assessment, we incorporated t-Distributed Stochastic Neighbor Embedding (t-SNE) and Uniform Manifold Approximation and Projection (UMAP) clustering of GdVO4:Sm3+ spectra at various temperatures.
The t-SNE and UMAP clustering results of GdVO4:Sm3+ spectra at various temperatures are depicted in Figure 8 and Figure 9. It is obvious that the good groupings of classes are distinguishable.
The deep learning artificial neural network (ANNDL) implementation in SOLO can utilize either the SciKit or TensorFlow Python packages. In our case, we chose the TensorFlow Python package, which utilizes GPU acceleration for highly efficient computations.
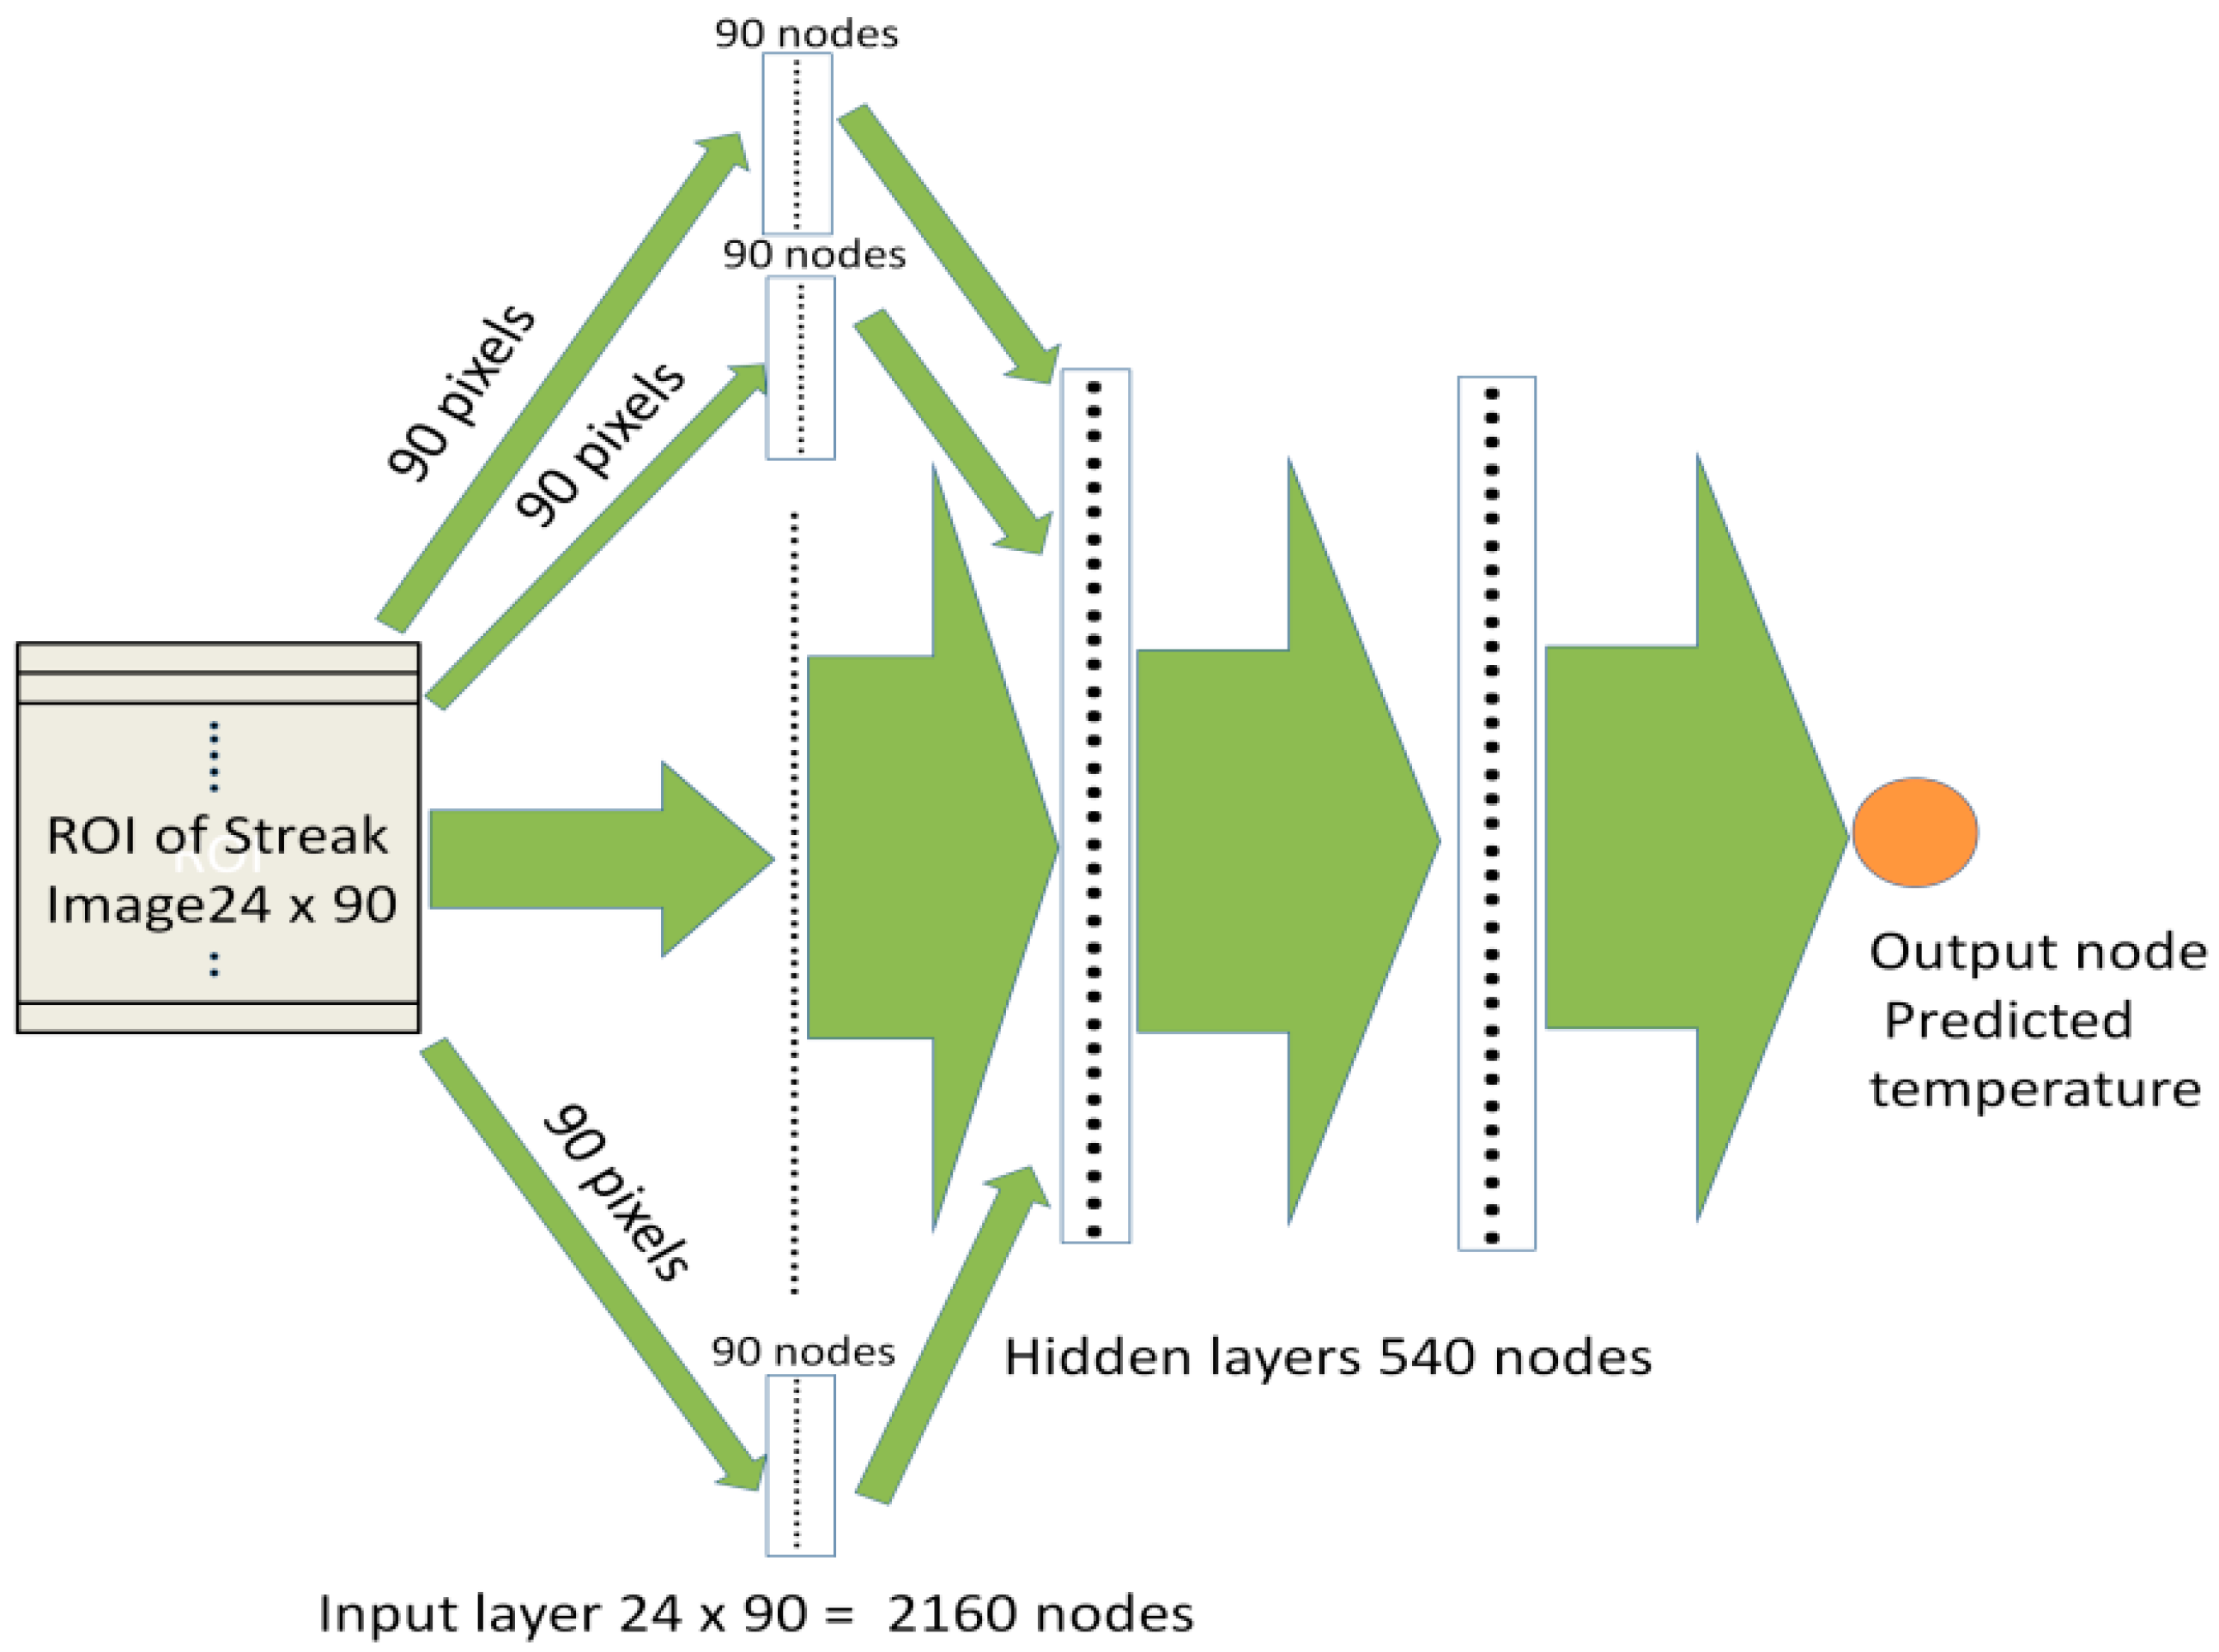
The primary concept behind temperature estimation of thermophosphors using ANNDL involves training the network with sample spectra that have corresponding temperature measurements. During the training phase, the network iteratively minimizes errors between the calculated and predicted temperatures. Since the region of interest in the streak image of GdVO4:Sm3+ consists of 2160 points, the input layer of the deep learning network has 2160 nodes. Considering that this network aims to approximate two types of exponential functions—one for intensity ratios and another for luminescence lifetime—we initially considered using two hidden layers. The initial default size of a hidden layer in SOLO software is 100. However, we experimented with different numbers and sizes of hidden layers. Based on our experience, we decided that 100 nodes do not provide optimal predictions, in a sense of root mean standard errors. We gradually increased the sizes of hidden layers until the increase in neural network performance became saturated. Ultimately, we determined that a neural network with two hidden layers, each containing 540 nodes, was the optimal solution. The optimal number of epochs was 600, the batch size was 50. The output layer consisted of a single node representing the predicted temperature. A schematic diagram illustrating the deep learning network used in this study is shown in Figure 10.
After conducting several experiments, we determined that the Adam optimizer outperformed other optimizers, and that the Relu activation function is optimal for our case. Adam optimizer utilizes a default learning rate of 0.001, but it can adaptively adjust the learning rate based on the characteristics of the data. For cross-validation, we employed the Venetian blind method with a data split of 10, meaning that in each sub-validation experiment, 90% of the data was used for training and 10% for validation.
In other words, this 10% of data was used as test data, not seen by the computer in sub-validation experiment where 90% of data was used for training. To be precise, such sub-validation experiments were repeated 10 times, making test data unnecessary. Moreover, it should be noted that validation computational time is much longer than the initial construction of the neural network.
Following further experimentation, we selected a batch size of 50. After some trial and error, we decided to set the number of epochs to 600. Before processing the data, we used normalization procedure 1-Norm (area = 1) on the dataset. Then, the data were smoothed using the Savitzky–Golay filter. The width of the filter was five, with a polynomial order of six and weighted tails. These preprocessing options are built in the SOLO software.
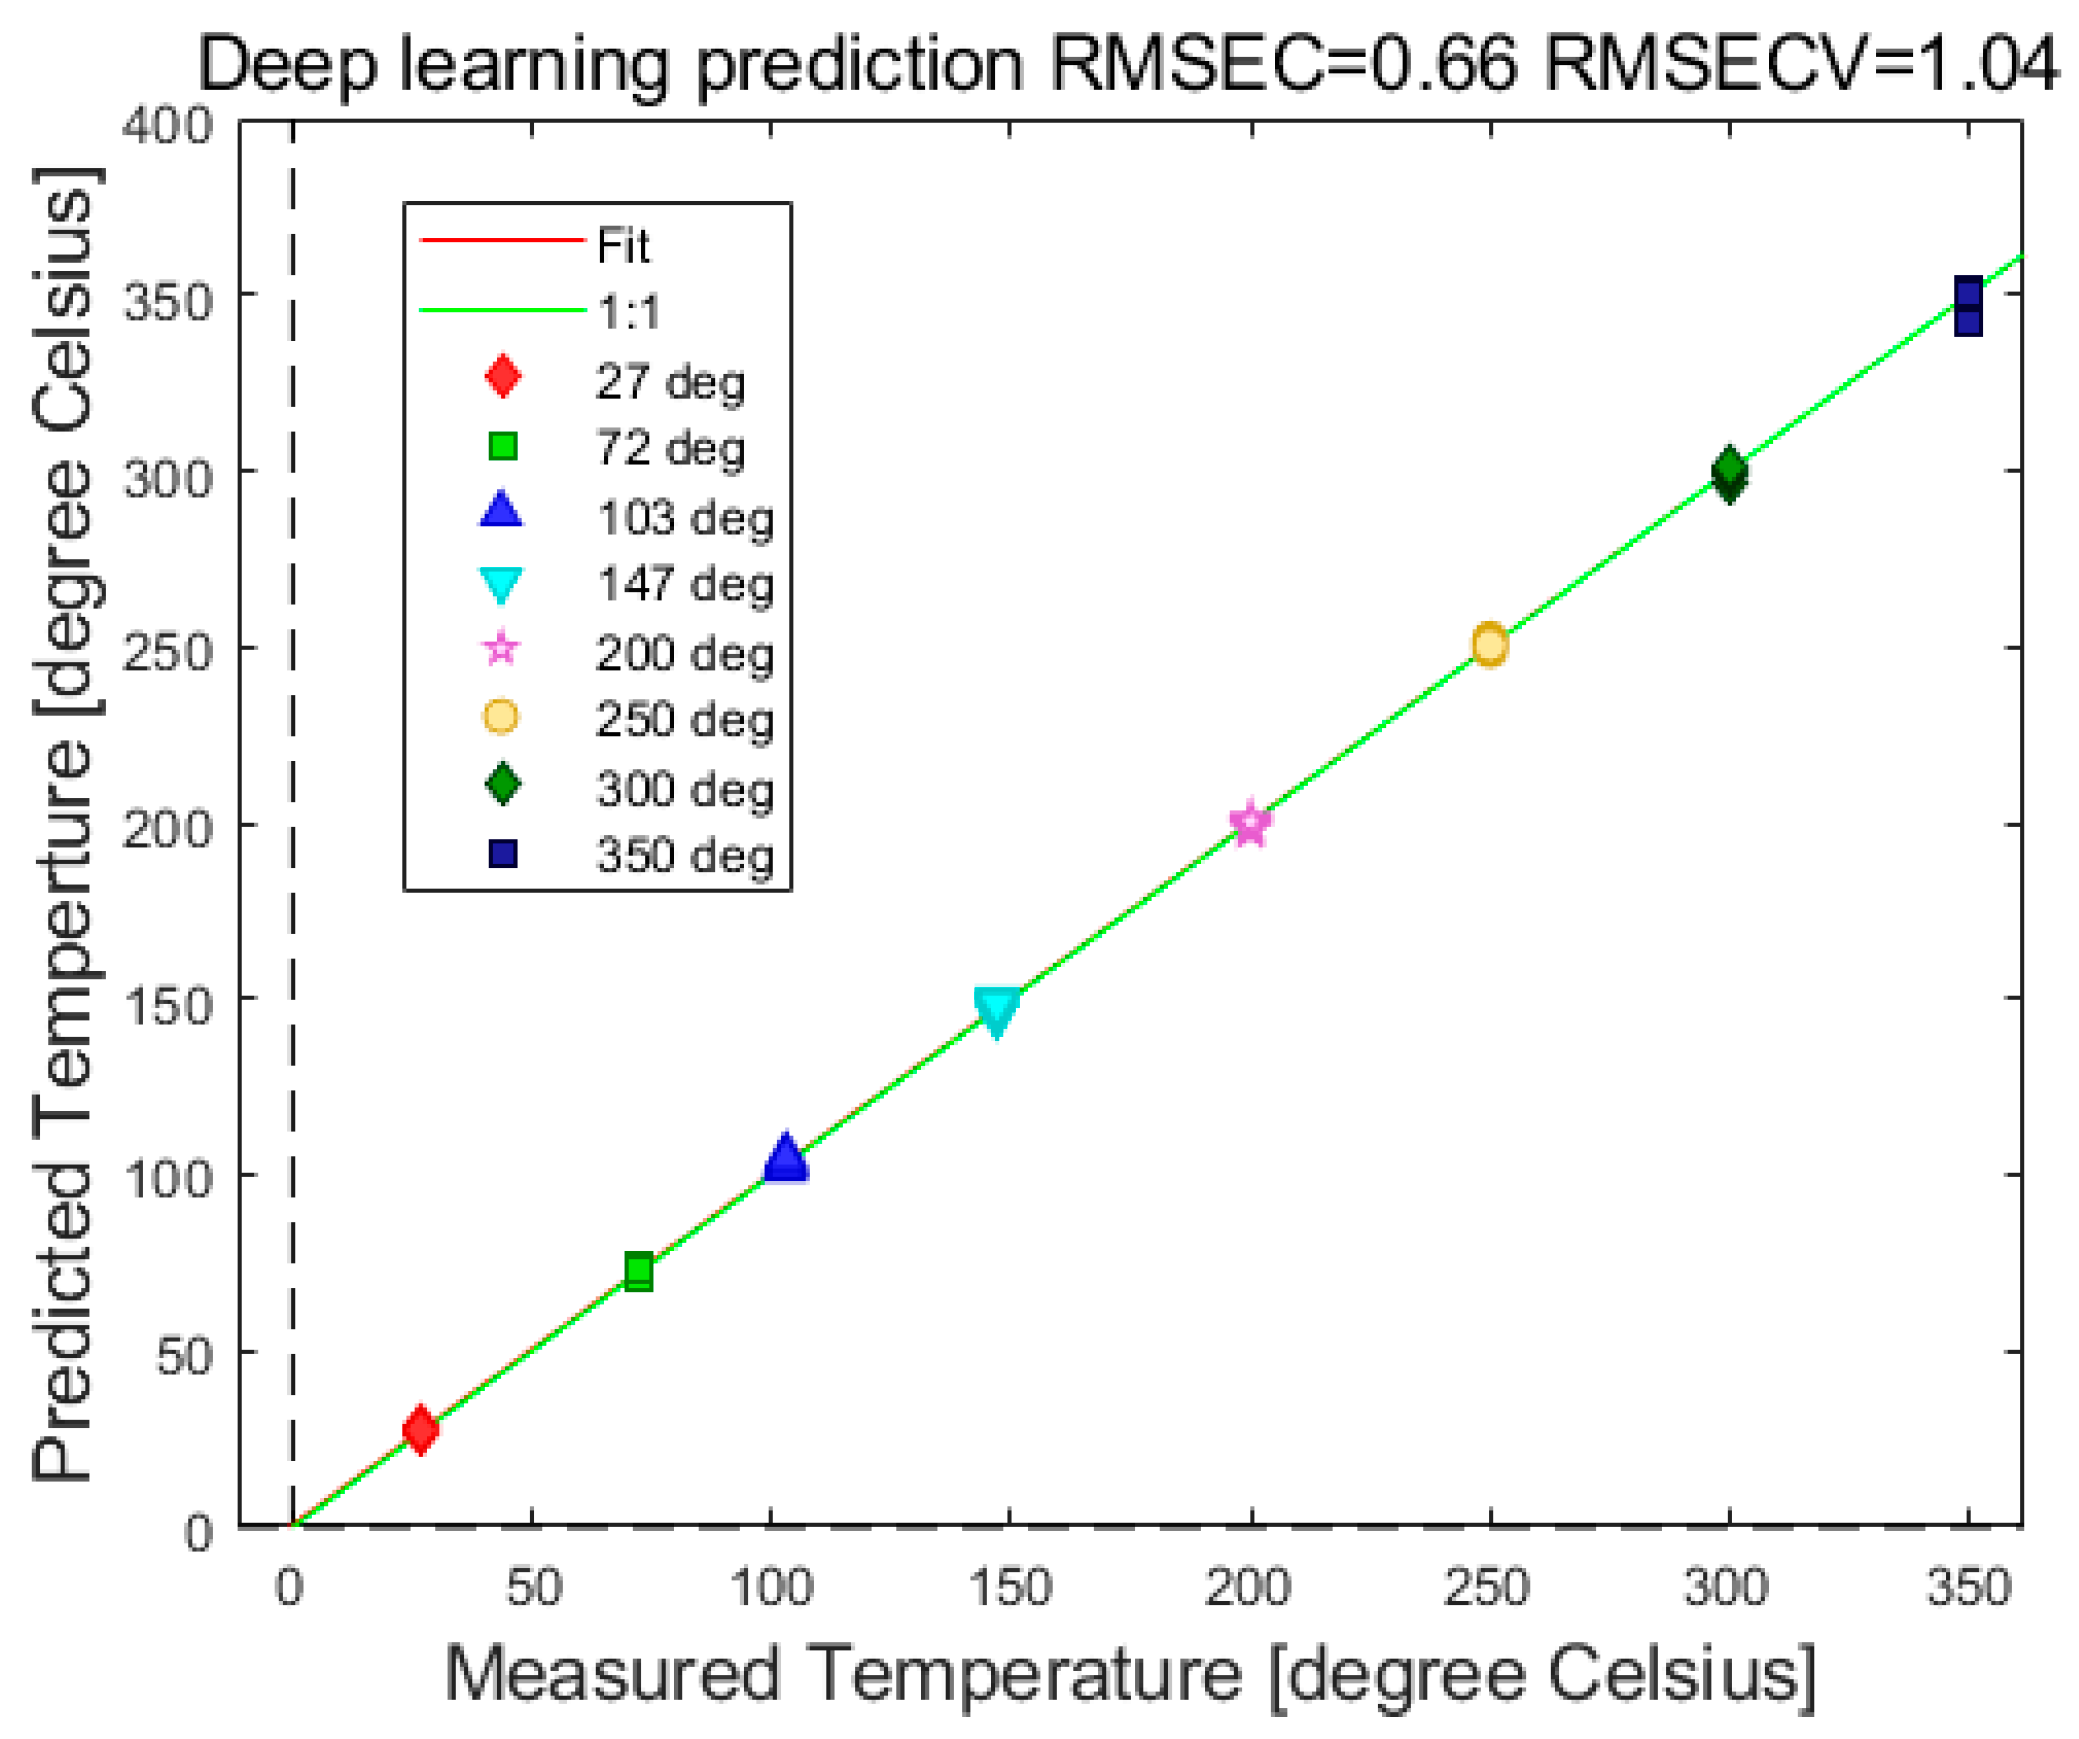
Figure 11 shows the results of deep learning predictions of the measured temperatures when the neural network is presented with part of the spectra not seen by the computer in that validation cycle. Notably, the errors for the samples within the training set are relatively small. Validation errors are comparably larger. In comparison to the results presented in ref. [18], we observed larger maximum errors.
Based on the idea that a larger training set reduces problems in neural networks, we augmented the training set to 50 samples. Figure 12 shows the results of deep learning predictions of measured temperatures when the augmented training set was used. Moreover, optimizing the structure of the neural network resulted in decreasing of the optimal number of epochs from 600 to 100, and the batch size decreased from 50 to 12. Errors were comparable to the results presented in ref. [18].

4. Discussion

In this study, the data not originally intended for ML were visualized using PCA, t-SNE, and UMAP, showing the good grouping of the data corresponding to the same temperature. Thus, in this paper, visualization techniques proved the possibility of using the original experimental data after appropriate augmentation.
In [18], for each temperature, a set of 50 spectra was measured, resulting in a total of 650 training spectra (13 temperatures multiplied by 50 spectra per temperature). Here, we analyzed the spectra corresponding to eight temperatures, and the training set initially comprised 80 (8 multiplied by 10) spectra. Using visualization techniques, we proved that the technique used for data augmentation was appropriate. However, subsequently using ANNDL to obtain temperature predictions with similar values of RMS as in ref. [18], we had to expand the training set up to 50 for each temperature. After that, the structure of ANNDL and computational times were similar to those in ref. [18]. It should be pointed out that structure (number of hidden layers and number of their nodes), number of epochs, and batch size decreased when ANNDL was trained with the training set of 50 for each sample.
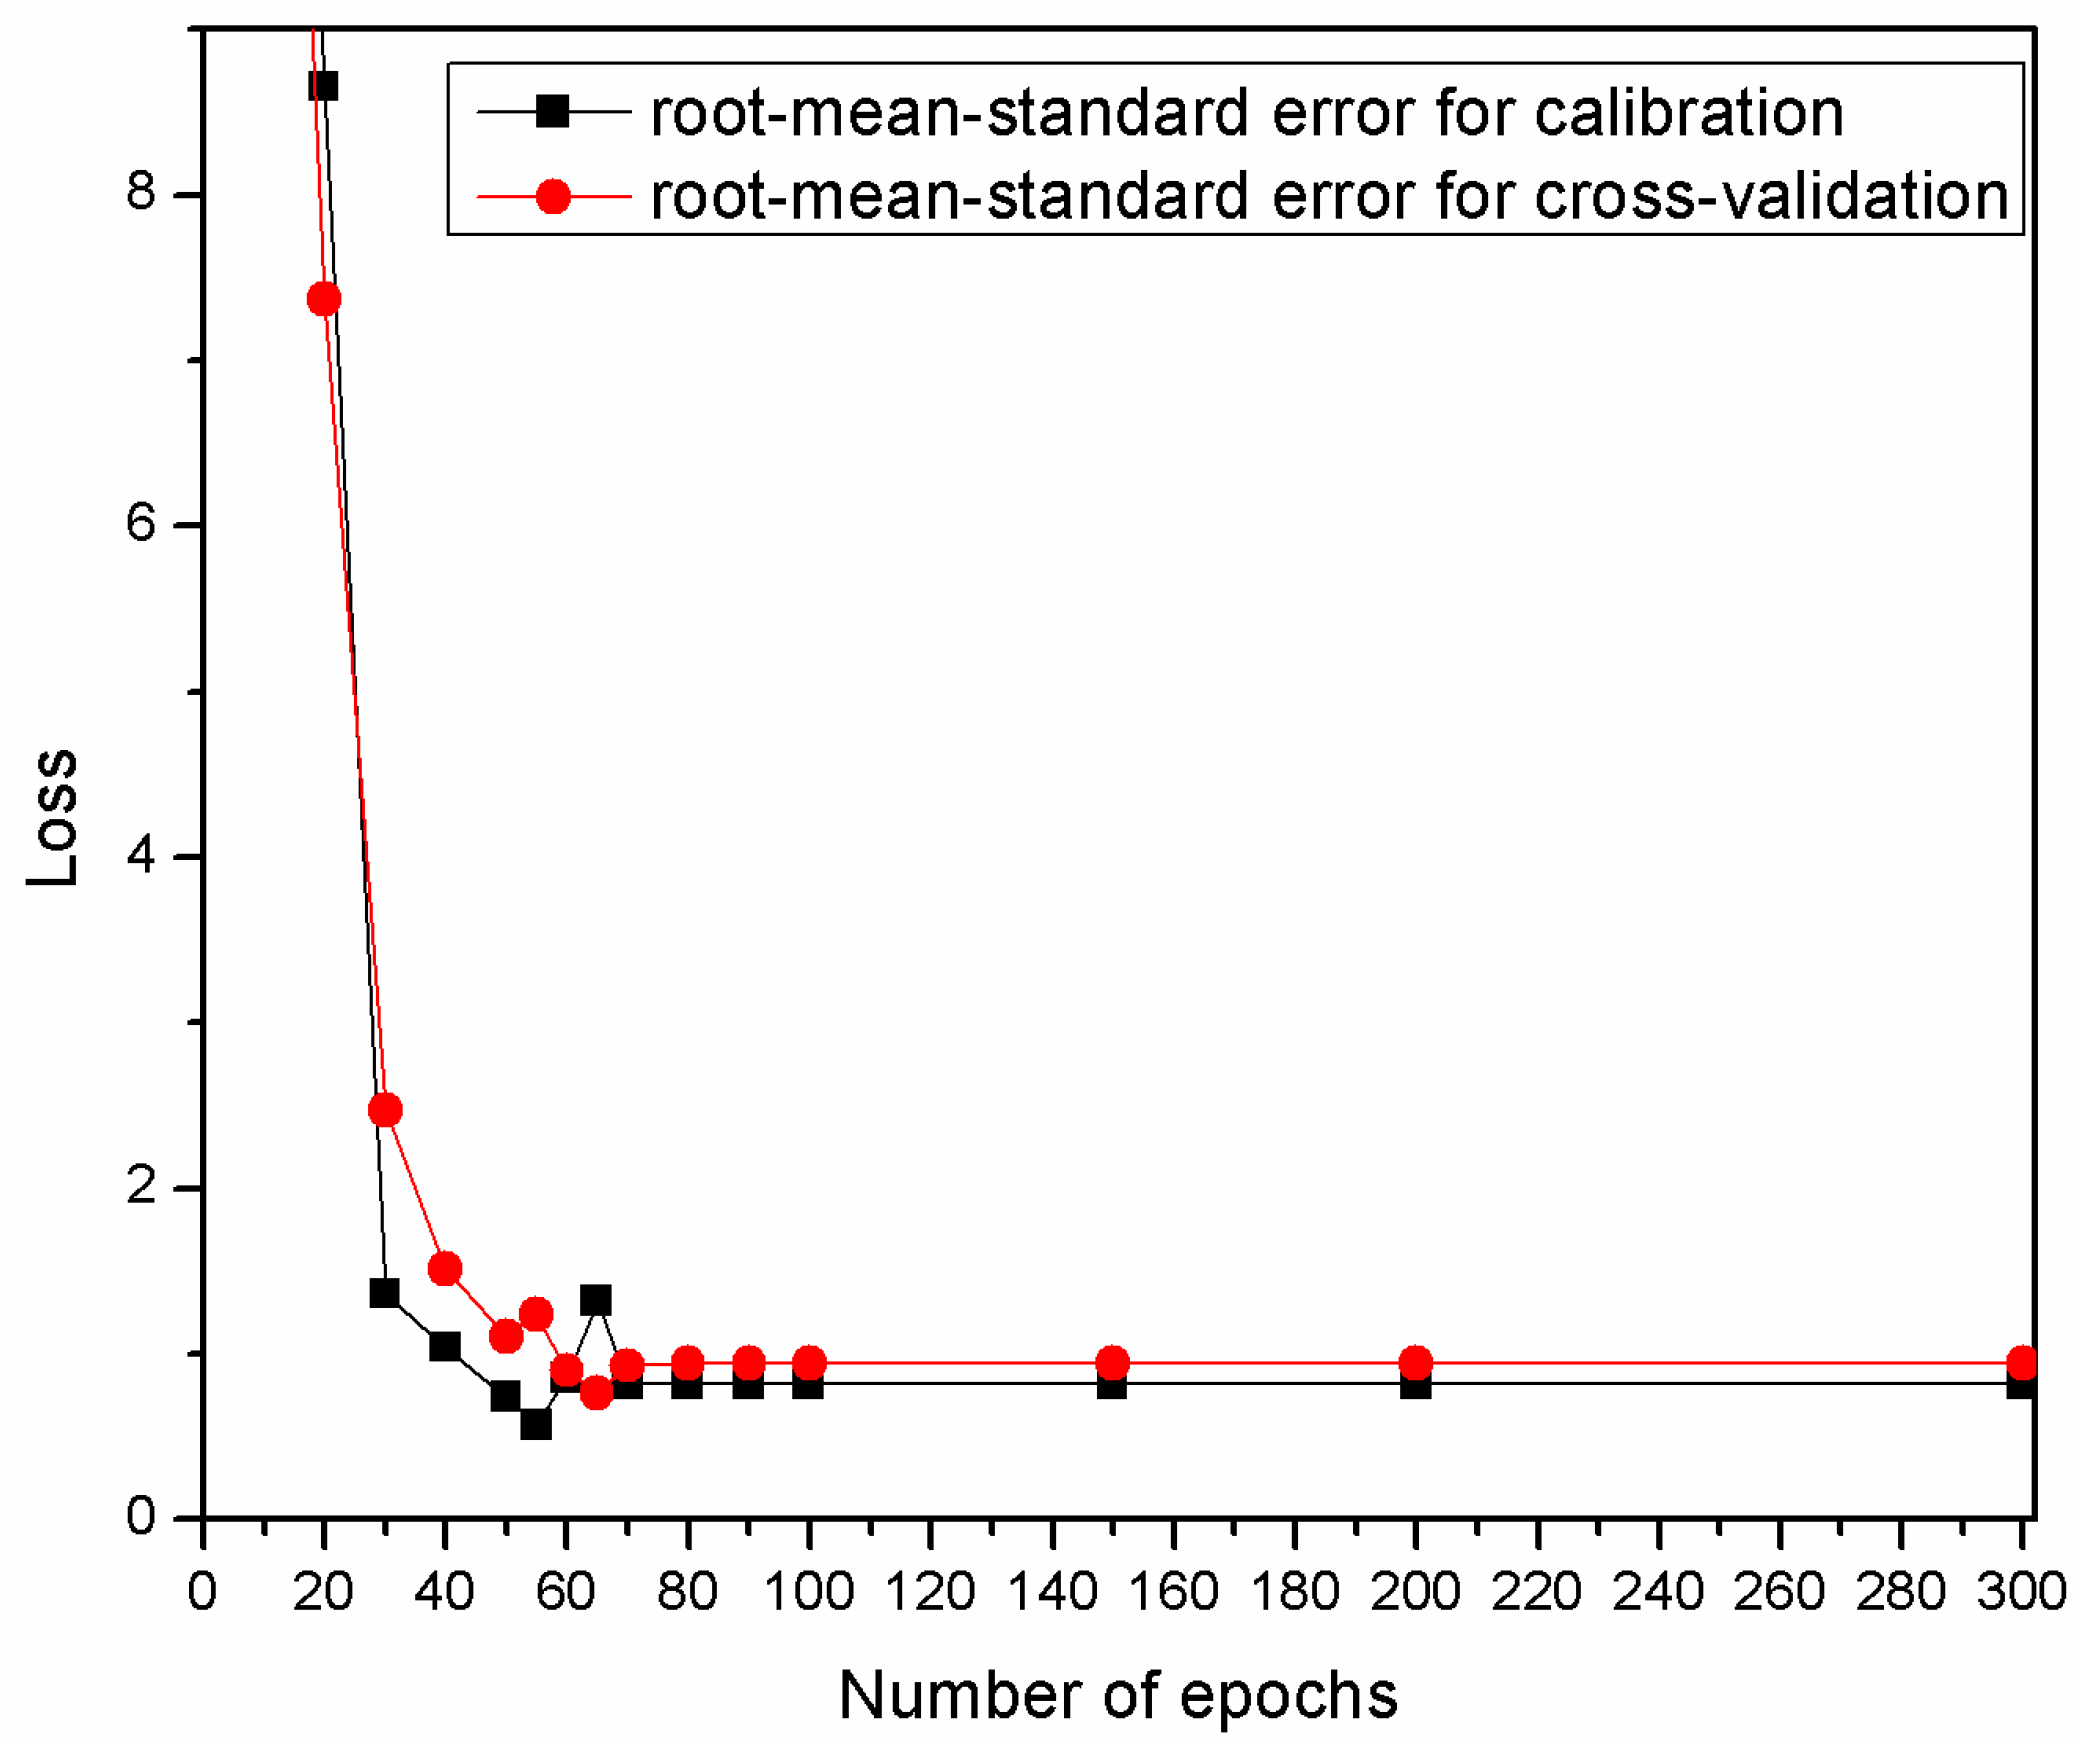
In the previous section, we presented the best results achieved through a trial-and-error process. Now, we validate this educated guess using the learning curves of the neural network. The learning curves illustrating the training progress of the ANNDL model are shown in Figure 13. The curves were generated by repeatedly running the deep neural network model with an increasing number of epochs. Based on the shapes of these curves, we decided to set the number of epochs for future experiments with these data to 100 as a precaution.
When comparing our results to those reported in ref. [26], our method yields slightly superior prediction errors. Notably, our deep neural network model achieves optimal performance after approximately 100 epochs, whereas the study in ref. [26] requires training the network for 6000 epochs.
In reference [13], the authors explore the use of linear transformations (Principal Component Analysis) and non-linear transformations (t-Distributed Stochastic Neighbor Embedding) on thermophosphor calibration datasets. Their findings show a clear advantage compared to our results when using PCA or UMAP. However, this was exactly why we chose to employ a deep learning neural network in our approach.
Compared to the results presented in ref. [12], we observed slightly larger maximum errors. We anticipated that incorporating the time development of luminescence spectra into our prediction model would enhance performance relative to the network described in ref. [12]. However, it is important to note that our temperature controller lacks manufacturer-specified resolution and accuracy. We estimate that its sporadic errors can reach up to two degrees Celsius, regardless of the temperature value. As a result, the relative error can be significant at lower temperatures. In contrast, the temperature controller used in ref. [12] has a specified temperature resolution of 0.01 degrees Celsius and a stability of ±0.05 degrees Celsius. Our main objective was to validate the concept of using the time evolution of luminescence spectra for remote temperature estimation, and the results presented here support this concept.

5. Conclusions

After phase identification and morphology of post-annealed powder samples GdVO4:Sm3+ using X-ray diffraction, the time-resolved analysis of this nanoposphor luminescence was conducted. The estimated lifetime of the most prominent samarium optical emission from the 4G5/2 level is 0.726 ms at room temperature. We employed machine learning techniques to analyze the optical spectra of GdVO4:Sm3+ thermophosphor in order to improve remote temperature measurements. Our approach deviates from the conventional method of identifying spectral peaks and calculating their intensity ratio. Instead, we trained a computer model to recognize the time-resolved spectra associated with different temperatures of the thermophosphors. This allowed us incorporation of not only the intensity ratios of all peaks but also the luminescence lifetime as an additional parameter. We showed that, for the analyzed GdVO4:Sm3+ material, the temperature sensing is useful up to 350 °C. We used the streak camera to prove the concept. The real application of this method will be based on using the gated CCD cameras and appropriate bandwidth filters for selecting the emission region of interest. To improve the performance of the deep learning network, we used the augmenting of the training data set. In summary, our analyses proved that it is possible to use a deep learning neural network for improved temperature sensing with Sm3+-doped GdVO4 nanopowder.

Author Contributions

Conceptualization, D.S., M.S.R. and M.G.N.; software, D.S.; formal analysis, A.D. and J.Z.J.; investigation, D.S., M.S.R. and M.D.R.; resources, J.K., M.H.A. and S.S.-S.; writing—original draft preparation, D.S. and M.S.R.; writing—review and editing, D.S., M.S.R. and M.D.R. All authors have read and agreed to the published version of the manuscript.

Funding

This work was financially supported by funding provided by the Institute of Physics Belgrade, through the grant by the Ministry of Science, Technological Development and Innovations of the Republic of Serbia and by European Commission through Marie Skłodowska-Curie Actions H2020 RISE with ULTIMATE-I (Grant No. 101007825). Authors would like to acknowledge the access of equipment of “Servicio General de Apoyo a la Investigación (SAI), Univesidad de Zaragoza”.

Data Availability Statement

The original contributions presented in the study are included in the article, further inquiries can be directed to the corresponding author/s.

Conflicts of Interest

The authors declare no conflicts of interest.

References

  1. Rabasovic, M.S.; Krizan, J.; Savic-Sevic, S.; Mitric, M.; Rabasovic, M.D.; Marinkovic, B.P.; Sevic, D. Orange-Reddish Light Emitting Phosphor GdVO4:Sm3+ Prepared by Solution Combustion Synthesis. J. Spectrosc. 2018, 2018, 1–8. [Google Scholar] [CrossRef]
  2. Nikolić, M.G.; Jovanović, D.J.; Đorđević, V.; Antić, Ž.; Krsmanović, R.M.; Dramićanin, M.D. Thermographic properties of Sm3+ -doped GdVO4 phosphor. Phys. Scr. 2012, T149, 014063. [Google Scholar] [CrossRef]
  3. Nikolić, M.G.; Antić, Ž.; Ćulubrk, S.; Nedeljković, J.M.; Dramićanin, M.D. Temperature sensing with Eu3+ doped TiO2 nanoparticles. Sens. Actuators B Chem. 2014, 201, 46–50. [Google Scholar] [CrossRef]
  4. Dramićanin, M.D.; Antić, Ž.; Ćulubrk, S.; Ahrenkiel, S.P.; Nedeljković, J.M. Self-referenced luminescence thermometry with Sm3+ doped TiO2 nanoparticles. Nanotechnology 2014, 25, 485501. [Google Scholar] [CrossRef] [PubMed]
  5. Lojpur, V.; Nikolić, M.G.; Jovanović, D.; Medić, M.; Antić, Ž.; Dramićanin, M.D. Luminescence thermometry with Zn2SiO4:Mn2+ powder. Appl. Phys. Lett. 2013, 103, 141912. [Google Scholar] [CrossRef]
  6. Lojpur, V.; Ćulubrk, S.; Dramićanin, M.D. Ratiometric luminescence thermometry with different combinations of emissions from Eu3+ doped Gd2Ti2O7 nanoparticles. J. Lumin. 2016, 169, 534–538. [Google Scholar] [CrossRef]
  7. Aldén, M.; Omrane, A.; Richter, M.; Särner, G. Thermographic phosphors for thermometry: A survey of combustion applications. Prog. Energy Combust. Sci. 2011, 37, 422–461. [Google Scholar] [CrossRef]
  8. Chatzidakis, M.; Botton, G.A. Towards calibration-invariant spectroscopy using deep learning. Sci. Rep. 2019, 9, 2126. [Google Scholar] [CrossRef]
  9. Dramićanin, T.; Zeković, I.; Periša, J.; Dramićanin, M.D. The Parallel Factor Analysis of Beer Fluorescence. J. Fluoresc. 2019, 29, 1103–1111. [Google Scholar] [CrossRef]
  10. Ranamukhaarachchi, S.A.; Peiris, R.H.; Moresoli, C. Fluorescence spectroscopy and principal component analysis of soy protein hydrolysate fractions and the potential to assess their antioxidant capacity characteristics. Food Chem. 2017, 217, 469–475. [Google Scholar] [CrossRef]
  11. Weng, S.; Yuan, H.; Zhang, X.; Li, P.; Zheng, L.; Zhao, J.; Huang, L. Deep learning networks for the recognition and quantitation of surface-enhanced Raman spectroscopy. Anal. 2020, 145, 4827–4835. [Google Scholar] [CrossRef]
  12. Cui, J.; Xu, W.; Yao, M.; Zheng, L.; Hu, C.; Zhang, Z.; Sun, Z. Convolutional neural networks open up horizons for luminescence thermometry. J. Lumin. 2023, 256, 119637. [Google Scholar] [CrossRef]
  13. Ximendes, E.; Marin, R.; Carlos, L.D.; Jaque, D. Less is more: Dimensionality reduction as a general strategy for more precise luminescence thermometry. Light Sci. Appl. 2022, 11, 237. [Google Scholar] [CrossRef]
  14. Barbon, S.; da Costa Barbon, A.P.A.; Mantovani, R.G.; Barbin, D.F. Machine Learning Applied to Near-Infrared Spectra for Chicken Meat Classification. J. Spectrosc. 2018, 2018, 1–12. [Google Scholar] [CrossRef]
  15. Geronimo, B.C.; Mastelini, S.M.; Carvalho, R.H.; Barbon Júnior, S.; Barbin, D.F.; Shimokomaki, M.; Ida, E.I. Computer vision system and near-infrared spectroscopy for identification and classification of chicken with wooden breast, and physicochemical and technological characterization. Infrared Phys. Technol. 2019, 96, 303–310. [Google Scholar] [CrossRef]
  16. Junior, S.B.; Mastelini, S.M.; Barbon, A.P.A.; Barbin, D.F.; Calvini, R.; Lopes, J.F.; Ulrici, A. Multi-target prediction of wheat flour quality parameters with near infrared spectroscopy. Inf. Process. Agric. 2020, 7, 342–354. [Google Scholar] [CrossRef]
  17. Nolasco Perez, I.M.; Badaró, A.T.; Barbon, S.; Barbon, A.P.A.; Pollonio, M.A.R.; Barbin, D.F. Classification of Chicken Parts Using a Portable Near-Infrared (NIR) Spectrophotometer and Machine Learning. Appl. Spectrosc. 2018, 72, 1774–1780. [Google Scholar] [CrossRef] [PubMed]
  18. Rabasovic, M.S.; Savic-Sevic, S.; Križan, J.; Matovic, B.; Nikolic, M.; Sevic, D. Time resolved study of temperature sensing using Gd 2 O 3:Er,Yb: Deep learning approach. Phys. Scr. 2023, 98, 116003. [Google Scholar] [CrossRef]
  19. Shorten, C.; Khoshgoftaar, T.M. A survey on Image Data Augmentation for Deep Learning. J. Big Data 2019, 6, 60. [Google Scholar] [CrossRef]
  20. Rabasović, M.D.; Murić, B.D.; Čelebonović, V.; Mitrić, M.; Jelenković, B.M.; Nikolić, M.G. Luminescence thermometry via the two-dopant intensity ratio of Y2O3:Er3+, Eu3+. J. Phys. D Appl. Phys. 2016, 49, 485104. [Google Scholar] [CrossRef]
  21. Hotelling, H. Analysis of a complex of statistical variables into principal components. J. Educ. Psychol. 1933, 24, 417–441. [Google Scholar] [CrossRef]
  22. Wise, B.M.; Gallagher, N.B.; Bro, R.; Shaver, J.M.; Windig, W.; Koch, R.S. Chemometrics Tutorial for PLS Toolbox and Solo; Eigenvector Research, Inc.: Wenatchee, WA, USA, 2006; ISBN 0-9761184-1-6. [Google Scholar]
  23. Van der Maaten, L.; Hinton, G. Visualizing data using t-SNE. J. Mach. Learn. Res. 2008, 9, 2579. [Google Scholar]
  24. McInnes, L.; Healy, J.; Saul, N.; Großberger, L. UMAP: Uniform Manifold Approximation and Projection. J. Open Source Softw. 2018, 3, 861. [Google Scholar] [CrossRef]
  25. Sevic, D.; Rabasovic, M.S.; Krizan, J.; Savic-Sevic, S.; Nikolic, M.G.; Marinkovic, B.P.; Rabasovic, M.D. YVO4:Eu3+ nanopowders: Multi-mode temperature sensing technique. J. Phys. D Appl. Phys. 2020, 53, 015106. [Google Scholar] [CrossRef]
  26. Lewis, C.; Erikson, J.W.; Sanchez, D.A.; McClure, C.E.; Nordin, G.P.; Munro, T.R.; Colton, J.S. Use of Machine Learning with Temporal Photoluminescence Signals from CdTe Quantum Dots for Temperature Measurement in Microfluidic Devices. ACS Appl. Nano Mater. 2020, 3, 4045–4053. [Google Scholar] [CrossRef]
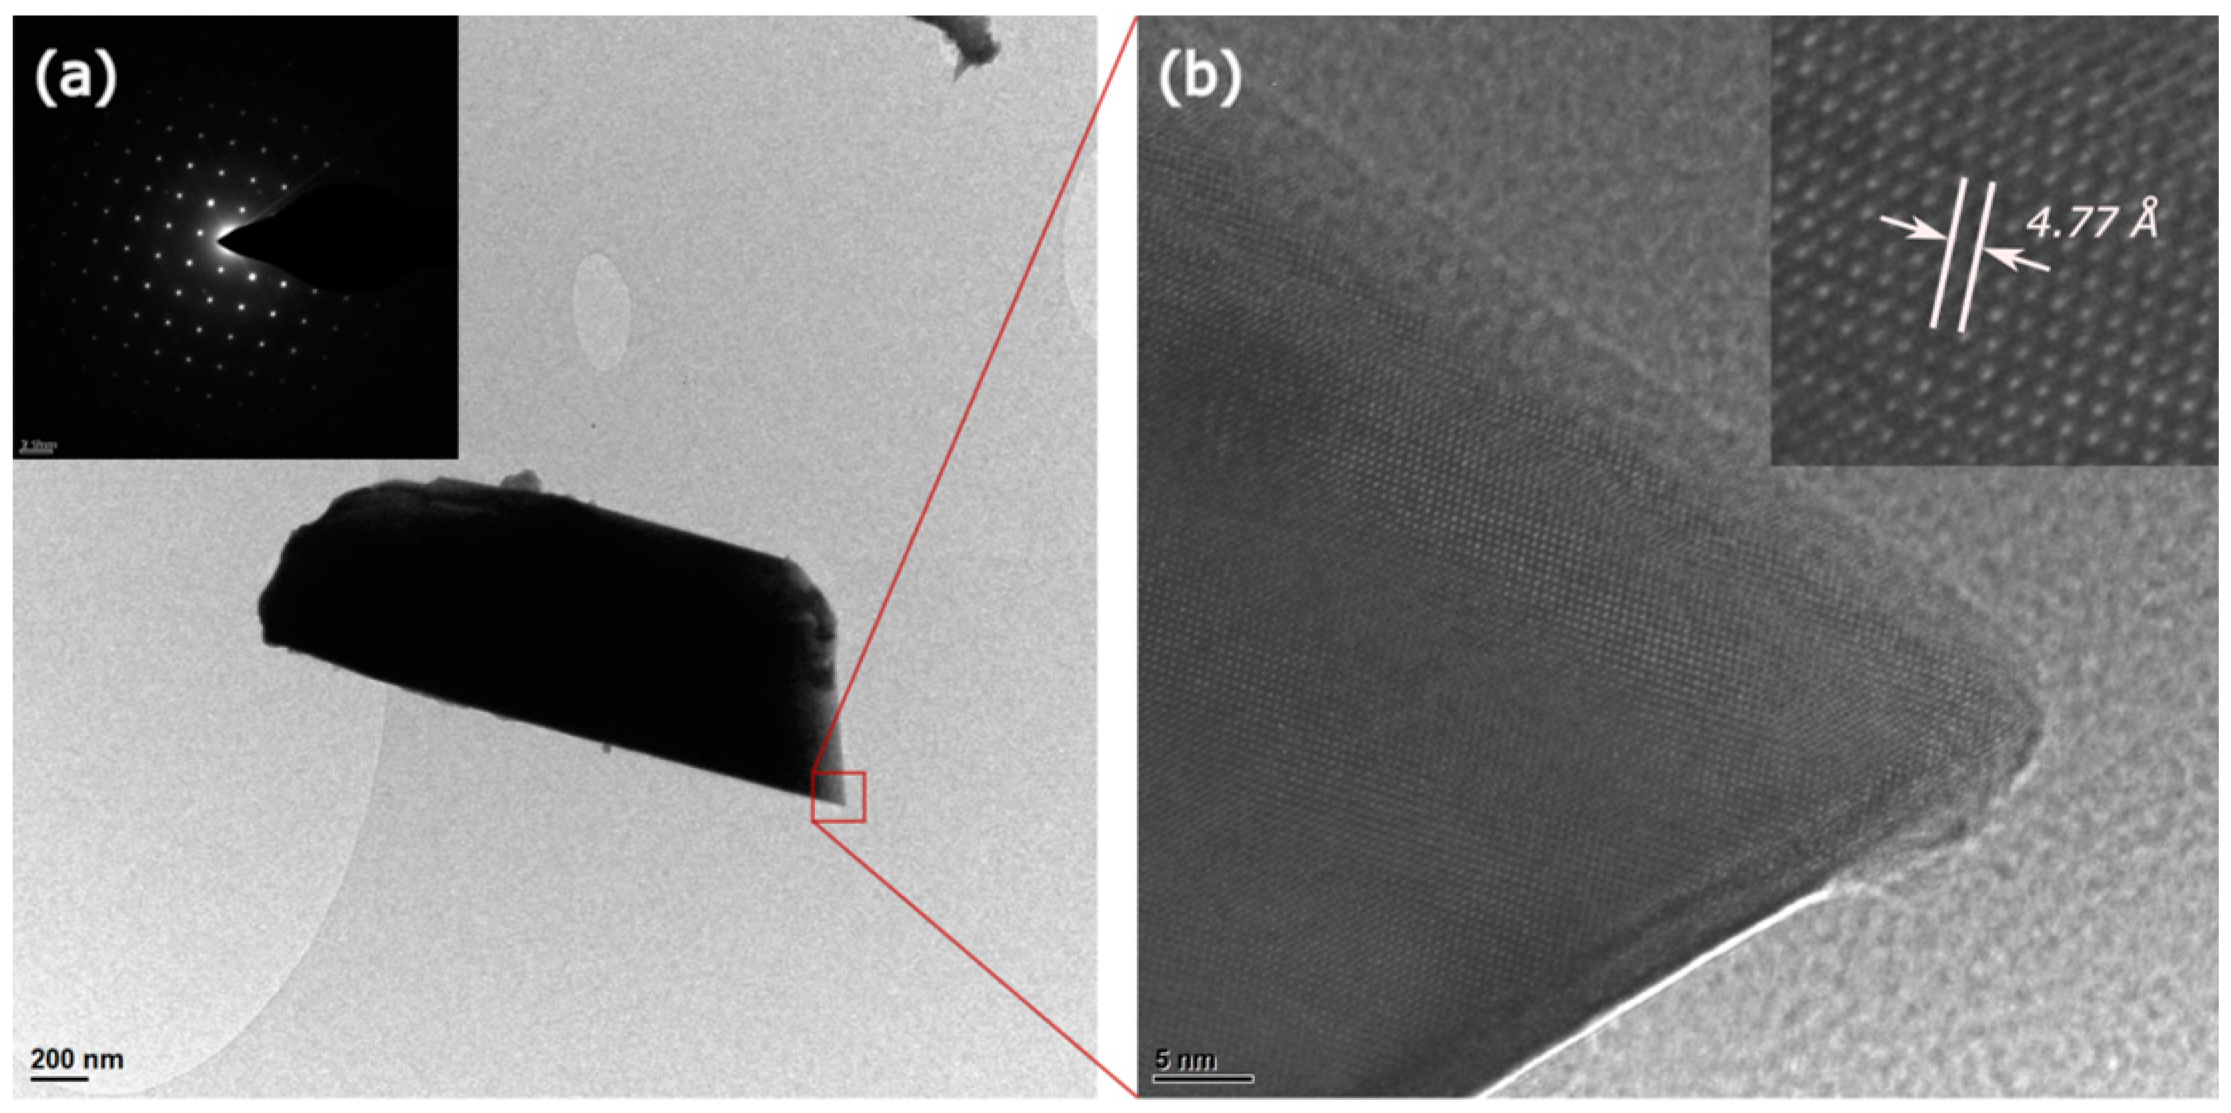
Figure 1. (a) TEM image of GdVO4-Sm nanoparticles with the inset showing the SAED pattern. (b) HRTEM image of a section of the nanoparticle highlighted in the red square in (a). The inset displays an interplanar distance of 4.77 Å, likely corresponding to the (101) lattice plane of tetragonal GdVO4.
Photonics 11 00642 g001
Figure 2. The XRD pattern of the GdVO4-Sm nanopowder with respective Miller indices.
Photonics 11 00642 g002
Figure 3. SEM image of GdVO4:Sm nanopowder.
Photonics 11 00642 g003
Figure 4. Streak image of the photoluminescence spectrum of GdVO4:Sm3+ nanophosphor (OPO excitation at 330 nm) at room temperature.
Photonics 11 00642 g004
Figure 5. Streak images of the photoluminescence spectrum of GdVO4:Sm3+ nanophosphor at two temperatures.
Photonics 11 00642 g005
Figure 6. Temperature dependence of intensity ratios of luminescence peaks (a). Temperature dependence of luminescence lifetimes (b).
Photonics 11 00642 g006
Figure 7. Scores on first two principal components of GdVO4:Sm3+ spectra at different temperatures.
Photonics 11 00642 g007
Figure 8. t-SNE component clustering of GdVO4:Sm3+ spectra at different temperatures.
Photonics 11 00642 g008
Figure 9. Uniform Manifold Approximation and Projection (UMAP) clustering of GdVO4:Sm3+ spectra at different temperatures.
Photonics 11 00642 g009
Figure 10. A schematic diagram illustrating the deep learning network used in this study. It is not possible to draw all arrows, and the shown arrows are merely symbolic. The pixel rows of the region of interest in the image are fed into the input layer as shown in the diagram.
Photonics 11 00642 g010
Figure 11. Plot of predicted temperatures using the training set of 10 samples for each temperature. RMSEC refers to the root mean standard error of calibration; RMSECV refers to the root mean standard error of cross-validation.
Photonics 11 00642 g011
Figure 12. Plot of predicted temperatures using the training set of 50 samples for each temperature. RMSEC refers to the root mean standard error of calibration; RMSECV refers to the root mean standard error of cross-validation.
Photonics 11 00642 g012
Figure 13. The learning curves depicting the training progress of the ANNDL model.
Photonics 11 00642 g013
Disclaimer/Publisher’s Note: The statements, opinions and data contained in all publications are solely those of the individual author(s) and contributor(s) and not of MDPI and/or the editor(s). MDPI and/or the editor(s) disclaim responsibility for any injury to people or property resulting from any ideas, methods, instructions or products referred to in the content.