1. Introduction
Organic-inorganic hybrid perovskite solar cells (PSCs) were first reported by Prof. Miyasaka and his team [
1]. Afterwards, PSCs have been intensively researched and developed worldwide to achieve a high efficiency of 26.1% [
2,
3]. Therefore, they are attracting attention as a next-generation solar cell alternative to silicon solar cells [
4]. However, the cost of materials for such high-efficiency PSCs is high because they use gold or silver for the back electrode and organic materials such as spiro-OMeTAD for the hole transport layer [
5]. Furthermore, these materials are unstable in atmospheric humidity and high temperatures, and the long-term stability of their performance remains inferior to that of silicon solar cells [
6].
To solve this problem, we have focused on fully-printable carbon-based multiporous-layered-electrode perovskite solar cells (MPLE-PSCs) using porous carbon as a material for the back electrode and hole transport layer [
7,
8,
9]. Compared with other hole transport layers, carbon is a promising material because of its high conductivity, low material cost, easy control of porosity, and excellent water resistance [
10,
11,
12]. Moreover, MPLE-PSCs can be manufactured at a much lower cost because all layers are deposited by spray pyrolysis for the compact TiO
2 layer, the screen printing method for porous electrodes, and drop casting for the (HOOC(CH
2)
4NH
3)
0.
05(CH
3NH
3)
0.
95PbI
3 perovskite crystal as completely non-vacuum manufacturing processes. Furthermore, MPLE-PSCs performed with high stability over a long period of time [
13,
14,
15,
16,
17]. In combination with the proper encapsulation process, we have shown durability equivalent to 20 years. This is as long as the lifetime of silicon solar cells [
18].
However, the efficiency of MPLE-PSCs is inferior to that of standard PSCs with a thin-film structure. This is because MPLE-PSCs are solar cells in which the perovskite precursor solution is permeated from the top of the mesoporous carbon layer by drop casting after the deposition of the multiporous-layered electrodes to obtain perovskite crystals (
Figure 1). Therefore, the filling property of perovskite crystals is determined by the solution permeability, which is strongly influenced by the morphology of mesoporous electrodes, such as pore size distribution. Hence, it is very important to study the effects of the porous morphology in detail on the development of MPLE-PSCs.
In order to improve the photovoltaic performance, we focused on the morphology of the electron transport layer. The electron transport layer is an important component of solar cells because it plays many roles, such as electron extraction, transportation, and hole blocking. One of the electron transport materials in MPLE-PSCs is TiO
2 with a mesoporous structure. It is commonly used as an electron transport layer in MPLE-PSCs. TiO
2 is one of the most studied electron transport materials because of its suitable band gap and ease of mesoporous electrode fabrication. The mesoporous TiO
2 layer extracts electrons from the perovskite light-absorbing crystal and transports them to the electrode. This system is developed from dye-sensitized solar cells, and its porous structure increases the interfacial area with the light-absorbing crystal, which leads to faster electron extraction and transport [
19]. In other words, in MPLE-PSCs, the perovskite light-absorbing crystal in the mesoporous TiO
2 layer has a strong influence on effective charge separation, resulting in the solar cell’s performance. This has led the researchers to control the structure. Previous studies have reported the control of TiO
2 particle diameter, thickness of film [
20], crystalline phases such as anatase and rutile [
21], and pore diameter [
22]. However, there are only a few reports about the porous structure of TiO
2 in MPLE-PSCs [
23]. Since most MPLE-PSCs are composed of porous materials, we believe that it is important to investigate the effect of changing the porous structure on the performance of MPLE-PSCs.
In this study, we prepared six kinds of mesoporous TiO
2 electron transport layers with different particle diameters (from 14 nm to 98 nm) and crystalline phases (anatase and rutile). These TiO
2 were dispersed in α-terpineol-based paste and deposited by screen printing. The α-terpineol-based pastes exhibit a viscosity that is rheologically suitable for screen printing [
24]. The structure composed of <glass/FTO (fluorine-doped tin oxide)/compact TiO
2/mesoporous TiO
2 + perovskite/mesoporous ZrO
2 + perovskite/carbon + perovskite> is shown in
Figure 1. The thicknesses were ranging from 0.3 μm to 0.5 μm, from 1.0 μm to 1.2 μm, and from 10 μm to 15 μm for mesoporous TiO
2, mesoporous ZrO
2, and carbon, respectively. First, for the analysis of TiO
2, X-ray diffraction (XRD) measurements and nitrogen adsorption/desorption measurements were performed. Moreover, it is also necessary to know the properties of solar cells when each TiO
2 applies to MPLE-PSCs. The absorbance of MPLE-PSCs was investigated by using UV-visible reflection spectra. The cross-sectional structure of MPLE-PSCs was observed by field emission scanning electron microscopy (SEM). Finally, to investigate the performance of MPLE-PSCs, we used current density-voltage (
J-
V) and incident-photo-current-efficiency (IPCE) measurements.
2. Experimental Details
2.1. Materials
The following materials were used as received: lead iodide (PbI2, 99.99%, Tokyo Chemical Industry Co., Ltd., Tokyo, Japan); methylammonium iodide (MAI, 99.0%, Tokyo Chemical Industry Co., Ltd., Tokyo, Japan); 5-ammonium valeric acid iodide (5-AVAI, 97.0%, Tokyo Chemical Industry Co., Ltd., Tokyo, Japan; γ-butyrolactone (GBL, for electrochemistry, Kanto Chemical Co., Inc., Tokyo, Japan); titanium diisopropoxide bis (acetylacetonate) (75 wt.% in isopropanol, Sigma-Aldrich, St. Louis, Missouri, USA); ethanol (99.5%, Kanto Chemical Co., Inc., Tokyo, Japan); α-terpineol (Kanto Chemical Co., Inc., Tokyo, Japan); acetic acid (Tokyo Chemical Industry Co., Ltd., Tokyo, Japan); ethyl cellulose 45–55 (Tokyo Chemical Industry Co., Ltd., Tokyo, Japan); titanium dioxide powder nanoparticles (“F-series”, Showa Titanium Co., Ltd., Toyama, Japan); ZrO2 nanoparticles (particle size of 20–40 nm, American Elements, California, USA); carbon black (averaged particle size of 18 nm, Printex L6, Orion Engineered Carbons, Senningerberg, Luxembourg); flake graphite (averaged particle size of 25 μm, SRP-150, Ito Graphite Co., Ltd., Kuwana, Japan); and ionomer resin (HYMIRAN, Dow-Mitsui Polychemicals, Tokyo, Japan).
2.2. Preparation of TiO2 Paste for Mesoporous TiO2 Layer
The paste for the mesoporous TiO
2 layer was prepared by a slight modification of a previously published method [
25]. First, 3.0 g of TiO
2 powder and 0.5 mL of acetic acid were mixed in a mortar. The mortar was made of alumina with a diameter of 20 cm. The experimental conditions were room temperature (from 15 °C to 25 °C) and atmospheric conditions (relative humidity: from 20% to 70%). Next, 0.5 mL of distilled water was added and mixed for 1 min. This operation was repeated 5 times. Next, 0.5 mL of ethanol was added and mixed in the same manner for 1 min. This operation was repeated 10 times. The TiO
2 dispersion in the mortar was transferred to a beaker with excess ethanol (100 mL) and stirred with the tip of a 4-centimeter-long magnet at 300 rpm for 1 min. After that, sonication was carried out for 2 min with a 2 s pause and 2 s using an ultrasonic homogenizer (Vibra cell 72408, SONICS & MATERIALS, INC., Connecticut, USA). Then, 10 g of α-terpineol and 15 g of ethyl cellulose dissolved in ethanol (10 wt.%) were added, and the mixture was stirred and sonicated in the same protocol. The dispersion was concentrated in an evaporator at 55 °C and 130 mbar. The pressure was reduced over a period of 30 min and eventually exhausted to 60 mbar. After setting to 60 mbar, the ethanol was removed for 1 h, and the preparation of TiO
2 paste was finished. Before screen printing, the paste was diluted at a ratio of paste/α-terpineol = 1:1.5 to control the thickness of the mesoporous TiO
2 layer.
2.3. Preparation of ZrO2 Paste for Mesoporous ZrO2 Layer
4.5 g of ZrO2 nanoparticles, 8.85 g of α-terpineol, 4.05 g of ethyl cellulose dissolved in α-terpineol (10 wt.%), Al2O3 beads (10 mm), and two sizes of ZrO2 beads (5 mm and 2 mm) were placed in an agate pot and crushed and stirred in a planetary ball mill (PULVERISETTE 7, Fritsch Japan Co., Ltd., Yokohama, Japan) for 2 h (700 rpm), then milled at low speed (300 rpm) for 5 min to remove air bubbles in the paste.
2.4. Preparation of Carbon Paste for Mesoporous Carbon Layer
0.8 g of carbon black, 3.2 g of graphite, 2.67 g of SnO2 nanoparticles dissolved in water (15 wt.%), 0.48 g of ethyl cellulose, 15 g of α-terpineol, Al2O3 beads (10 mm), and two sizes of ZrO2 beads (i.e., 5 mm and 2 mm) were placed in a zirconia ceramic bowl and crushed and stirred in a planetary ball mill (Planet M2-3F, Nagao System, Kawasaki, Japan) for 2 h (700 rpm), then milled at low speed (300 rpm) for 5 min to remove air bubbles in the paste.
2.5. Preparation of (HOOC(CH2)4NH3)0.05(CH3NH3)0.95PbI3 Perovskite Precursor Solution
The (HOOC(CH2)4NH3)0.05(CH3NH3)0.95PbI3 perovskite precursor solution (1.2 mol/L in GBL) was prepared in a glove box filled with nitrogen gas (the dew point was ranging from −30 °C to −20 °C). The precursor solution was prepared by mixing PbI2 (0.2766 g), MAI (0.0906 g), and 5-AVAI (0.00735 g) in GBL (0.5 mL), and then stirred at 70 °C and 800 rpm for 17.5 h.
2.6. Fabrication of MPLE-PSCs
The solar cells were fabricated under atmospheric conditions on fluorine-doped tin oxide (FTO)-coated glass substrates (TEC-15, Nippon Sheet Glass Co., Ltd., Tokyo, Japan). The conductive layers of the FTO glass (60 × 100 mm) were separated for the device patterning by laser etching. The patterned substrates were ultrasonically cleaned with detergent solution (1%, White 7-AL, Yuai Kasei, Amagasaki, Japan) and ethanol for 15 min each. A compact TiO
2 layer was deposited on the patterned substrate by spray pyrolysis deposition at 500 °C on a hot plate using 0.66 mL of titanium diisopropoxide bis(acetylacetonate) solution (volume ratio 1:34) diluted with 22.5 mL of ethanol. The spray interval for spray deposition was 10 s. The entire hot plate was sprayed uniformly. Mesoporous TiO
2 layer was screen printed using the TiO
2 paste, held at room temperature for 10 minutes, and then, dried on the hot plate at 140
◦C for 10 min. The mesoporous TiO
2 layer was annealed in an electric furnace at 500
◦C for 55 min (25 min temperature rise and 30 min holding time at 500
◦C). On the mesoporous TiO
2 layer, mesoporous ZrO
2 spacer layer was screen printed using the ZrO
2 paste, held at room temperature for 5 min, and dried on a hot plate at 140
◦C for 10 min. The ZrO
2 layer was annealed on the hot plate at 200
◦C for 20 min [
26]. And then, carbon layer was screen printed using the carbon paste on the mesoporous ZrO
2 layer, held at room temperature for 10 min, and then dried on a hot plate at 125
◦C for 10 min. The carbon-layer-coated substrate was annealed at 400
◦C for 1 hour using a hot plate. The substrate was then cooled to room temperature, cut into single cells, and electrical contacts were attached to both electrodes by ultrasonic soldering. The surrounding area of multiporous-layered-electrodes was masked with heat-resistant polyimide tape so that the perovskite solution would fill the multiporous-layered-electrodes. Finally, 4.0 µL of 1.2 mol/L (HOOC(CH
2)
4NH
3)
0.
05(CH
3NH
3)
0.
95PbI
3 perovskite precursor solution was drop-casted into the scaffold layer. The solution-coated solar cells were kept at room temperature in a Petri dish for 30 min. Then, it was heated on a hot plate with the Petri dish covered at 50 °C for 80 min. After the Petri dish was removed, the solar cells were dried at 50 °C for 10 min to complete the solar cell fabrication. This perovskite filling process was performed in the air (room temperature: from 15 °C to 25 °C; relative humidity: from 20% to 70%). After the device was completed, the encapsulant, ionomer resin, was covered on the carbon layer side, and a cover glass was placed over it [
18]. The device, encapsulant, and cover glass were fixed with heat-resistant tape. The device was then encapsulated by thermal vacuum crimping at 110 °C for 2 min.
2.7. Characterization
The crystal structure of TiO
2 was evaluated by XRD (MiniFlex II, Rigaku, Akishima, Japan). From nitrogen adsorption/desorption isotherm profiles, the specific surface area and the pore size distribution were calculated by the BET (Brunnauer-Emmett-TeIler) method and the BJH (Barrett-Joyner-Halenda) method, respectively (BELSORP MINI X, MicrotracBEL Corp., Osaka, Japan). Current density-voltage (
J-
V) curves were measured using a DC voltage current source (B2901A, Agilent, California, USA) under a solar simulator (AM1.5G, 100 mW cm
−2) with a 500 W xenon (Xe) lamp (YSS-100A, Yamashita Electric, Tokyo, Japan). The output of the AM1.5G solar simulator was calibrated using a reference Si photodiode (Bunko Keiki, Tokyo, Japan). The light illumination area was 3 × 3 mm (the active area of the device was 0.36 cm
2, and the mask aperture was 0.09 cm
2). The measurement voltage ranged from −0.05 to 1.05 V; forward and reverse scannings were performed; step was 0.01 V; and scanning delay time was 10 msec. Measurements were taken three times in the forward direction and three times in the reverse direction, with an interval of 2 min between each measurement. The device was continuously illuminated for photoactivation between measurements [
27]. Optical aging of AM1.5G was performed under open-circuit conditions. The 150 W Xe lamp (Peccell technologies, Kawasaki, Japan) equipped with a monochromator was used as a monochromator light source to measure the incident-photon-to-current-efficiency (IPCE) spectrum. Before the IPCE measurements, calibration was performed with a silicon photodiode. FE-SEM images were obtained by a field emission scanning electron microscope (S-4800, Hitachi High-Tech Corp., Tokyo, Japan). The accelerating voltage was 1.5 kV. To get the sample for FE-SEM, an ion milling system (IM 4000, Hitachi High-Tech Corp., Tokyo, Japan) was applied for focused ion beam (FIB) sample preparation. The accelerating voltage was 4 kV. Furthermore, the electrode was broken into pieces, and the broken sections were processed by cross-sectional ion milling. The images of TiO
2 nanoparticles were obtained using a field emission transmission electron microscope (FE-TEM, Talos F200i, Thermo Fisher Scientific, Massachusetts, USA). The accelerating voltage was 200 kV. UV-visible light reflectance measurements were made using a UV-visible spectrophotometer (V-650, JASCO, Hachioji, Japan).
3. Results and Discussion
To determine the particle diameters of six kinds of TiO
2 nanoparticles (
Table 1), XRD measurements and nitrogen adsorption/desorption measurements were performed. Assuming that the morphology of the TiO
2 nanoparticles is spherical, the TiO
2 diameter
is calculated using Equation (1) [
28].
The densities
of anatase and rutile TiO
2 are 4.250
and 3.894
, respectively [
29]. The TiO
2 crystal phases (anatase or rutile) were attributed to XRD measurements. The specific surface areas
of TiO
2 nanoparticles were obtained from nitrogen adsorption/desorption measurements. The
s were calculated by applying the
and the
to Equation (1).
From the XRD results shown in
Figure 2a, two peaks (25.5° and 27.5°) were observed, corresponding to anatase and rutile phases, respectively. The TiO
2 nanoparticles from 14 nm to 52 nm were mainly anatase; the TiO
2 nanoparticle at 98 nm was mainly rutile. For simplicity, the calculation in Equation (1) is performed with
= 3.894
(rutile) for 98 nm TiO
2 and
= 4.250
(anatase) from 14 nm to 52 nm TiO
2. However, when comparing the photovoltaic parameters of solar cells, it may be important to consider the effect of the mixture of anatase and rutile phases.
Table 1 shows the
of TiO
2 obtained by the nitrogen adsorption/desorption measurement, and the
of TiO
2 obtained by calculating Equation (1). Also, the TiO
2 crystallite size (
) is calculated using Scherrer’s formula (Equation (2)).
where
is the broadening of the diffraction line measured at half its maximum intensity, and
is the X-ray wavelength (0.154 nm). From this result, TiO
2 nanoparticles (
= 43 − 98 nm) are polycrystalline particles consisting of 2–3 crystallites. All TiO
2 particles may be coated by an amorphous-phase layer of TiO
2.
The result of pore size distribution (
Figure 2b) shows that the pore diameter (
: X-axis in
Figure 2b) can be controlled by changing the particle diameter of TiO
2. For example, a TiO
2 nanoparticle with a
of 26 nm has a
ranging from 10 nm to 60 nm, and among them, a
of about 35 nm is mostly distributed. Hence, the pore diameter is related to the particle size. Moreover, to investigate the wettability of the printed TiO
2 layer, the contact angle was measured. The time variation of the contact angle when water was dropped from the surface of the TiO
2 layer is shown in
Figure 2c. As a result, the contact angle decreased faster as the particle size increased. This is thought to be due to the fact that the larger particle size increases the pore size, which helps the solution penetrate into the mesoporous layer. This property has a significant influence on the good permeation of perovskite precursor solutions and will play an important role in ensuring the reproducibility of MPLE-PSCs.
The actual shape of the TiO
2 nanoparticles was also observed by transmission electron microscopy (TEM). The obtained image is shown in
Figure 2d. Although the actual observed TiO
2 nanoparticles varied in size, the particle size was confirmed to be equivalent to that determined by calculation.
To investigate the relationship between TiO
2 morphology and MPLE-PSC absorbance, we measured light reflectance by using UV-visible spectroscopy. Light collection and absorption by light-absorbing materials are important to improve the performance of solar cells [
30].
Figure 3a shows a summary of this measurement method. First, baseline measurements were performed using a reference white plate to correct for all fluctuations in the light source in order to perform accurate measurements. Then, the reflectance of the solar cells was measured. However, it is difficult to consider transmitted light in MPLE-PSCs because the back-contact electrodes are composed of a porous carbon layer. Therefore, for simplicity, we assume that the intensity of transmitted light
is zero (Equation (3)) because it is absorbed by the thick carbon layer.
Hence, assuming that all light scattered in the porous structure is also absorbed, we define the absorbance of the solar cells by the following Equation (4), considering only the light reflected from the solar cell.
where
is the reflectance of the solar cells from Equation (5), by using the incident light intensity
of the solar cell and the reflected light intensity
of the solar cell.
Figure 3b,c shows the absorbance of the solar cell calculated from Equation (4). It is observed that as the TiO
2 diameter decreases, the absorbance increases over a wide wavelength range from 350 nm to 870 nm. This is thought to be because the light scattering in the mesoporous TiO
2 layer becomes smaller with decreasing TiO
2-particle size, and then the absorbed light by the perovskite crystal in the porous electrode increases [
28]. This tendency can also be confirmed by the photograph in
Figure 3d. The smaller the TiO
2 particle diameter is, the less light scattering occurs, and thus, the mesoporous TiO
2 layer appears transparent. From these UV-visible reflectance measurement results, it can be said that TiO
2 with a smaller diameter is advantageous from the viewpoint of light absorption in solar cells.
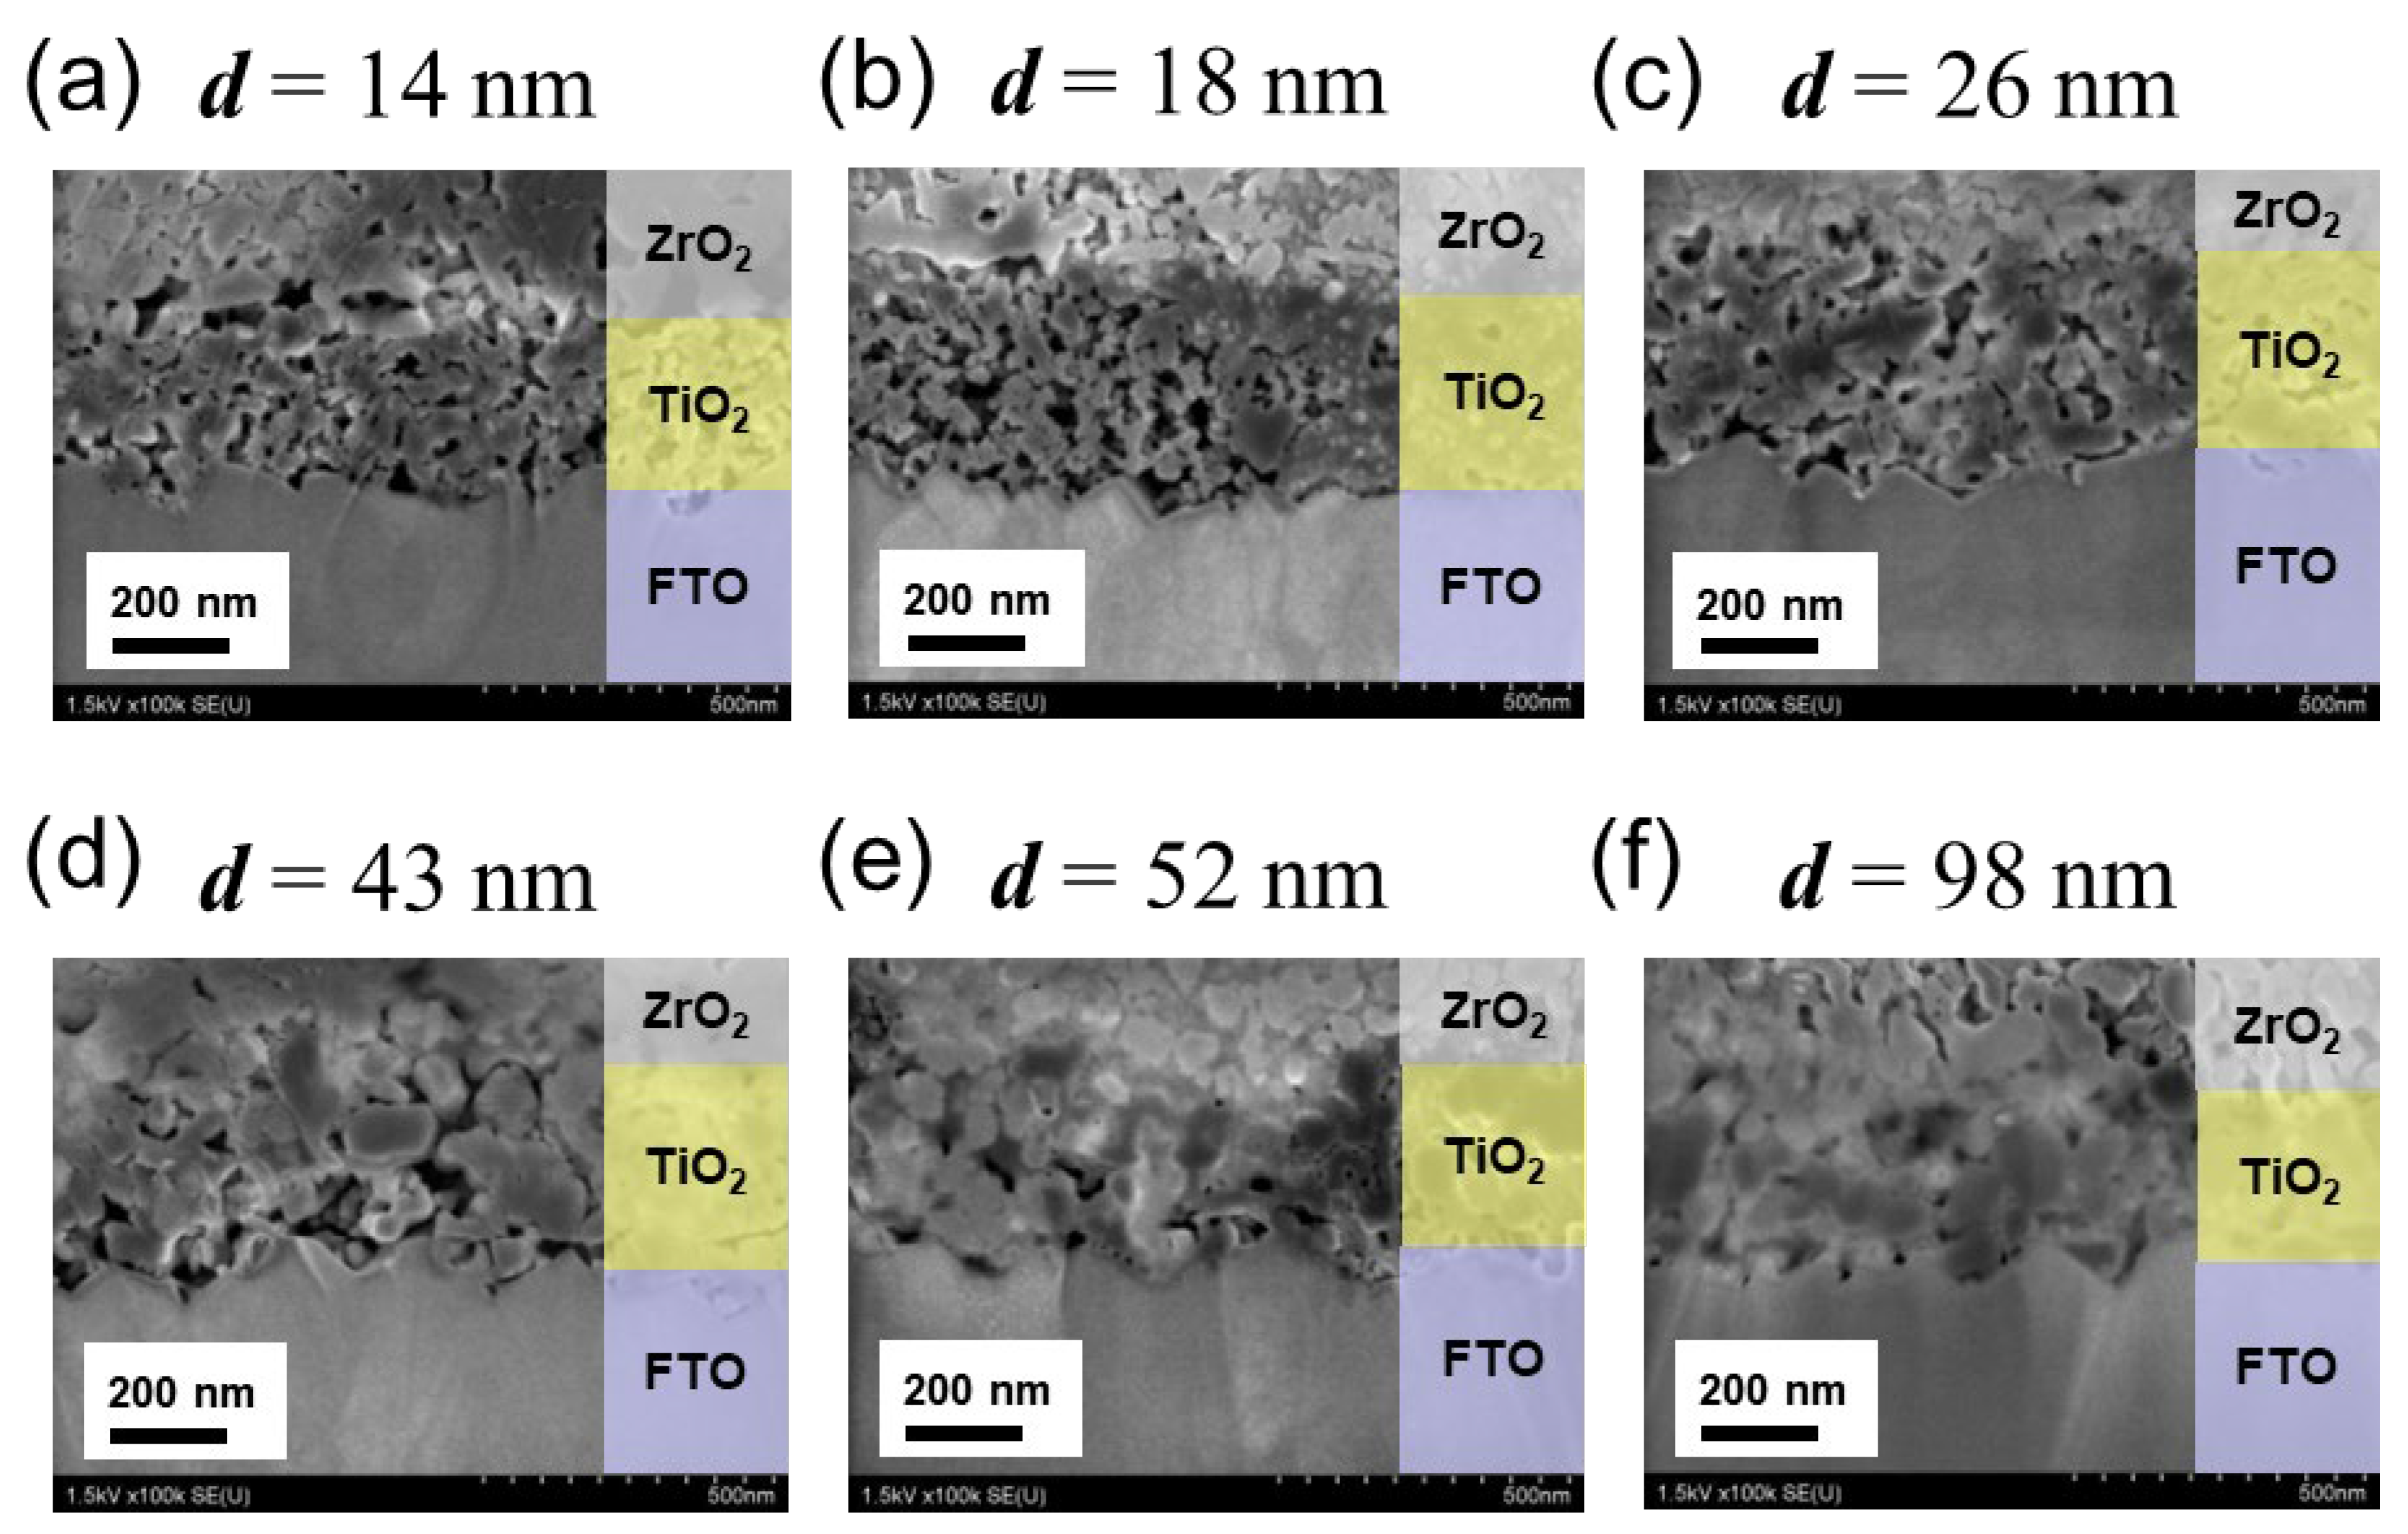
In order to confirm the pore-filling condition of the perovskite crystal, we observed the cross-sectional structure of each MPLE-PSC using FE-SEM measurements (
Figure 4). In
Figure 4a−d, perovskite crystals are uniformly crystallized throughout the mesoporous TiO
2 (26–98 nm) layer in the solar cells. However, the distributions of perovskite crystals in the solar cells using 14 nm and 18 nm TiO
2 nanoparticles were uneven, and there were some vacancies, as shown in
Figure 4e,f. These are due to the small pore diameter of TiO
2, which made it difficult for the perovskite precursor solution to penetrate (
Figure 2b,c).
Finally, based on the above results, the performance of six MPLE-PSCs was compared by
J-
V measurements. The values of photoelectric conversion efficiency (PCE), short-circuit current density (
JSC), open-circuit voltage (
VOC), fill factor (FF), series resistance (
Rs), and shunt resistance (
Rsh) are shown in
Figure 5. The results were evaluated with n = 15 cells. Although the highest PCE of 12.20% was observed in the solar cell using 26 nm TiO
2, reproducible PCE (
Figure 5a) and the highest
JSC (
Figure 5b) were obtained with 43 nm TiO
2 nanoparticles. These results suggest that the ideal particle diameter of TiO
2 in the mesoporous TiO
2 layer is in the range of 26–43 nm. The results show a similar trend to the previous report [
23]. When TiO
2 smaller than 20 nm is used, the small pores make it difficult for the perovskite precursor solution to penetrate the TiO
2 layer. Therefore, when TiO
2 nanoparticles with larger pores are used, the perovskite light-absorbing crystals are easier to fill, and the
JSC is improved. The
VOC values were reproducibly higher as the particle size of TiO
2 increased (
Figure 5c). This result may be related to the fact that the pores become larger as the TiO
2 particle size increases, as shown in the pore size distribution (
Figure 2b). The larger perovskite crystals can be formed in the larger pores, resulting in fewer defects on the perovskite crystal and a reduction in non-radiative recombination [
31,
32]. In
Figure 5d, there was no clear correlation between FF for all solar cells. Therefore, we examine the effect of TiO
2 morphology separately for
Rs and
Rsh. The
Rs in
Figure 5e decreased as the TiO
2 diameter decreased. This result may be due to the fact that the smaller TiO
2 diameter increases the interfacial area of perovskite/TiO
2, which leads to the easier collection of electrons. The
Rsh in
Figure 5f increased with increasing TiO
2 diameter for the five kinds of solar cells in the 14–52 nm range. The small
Rsh in the case of small TiO
2 may cause a large amount of leakage current at the perovskite/TiO
2 interface. This is attributed to the fact that the small TiO
2 causes more defects due to the insufficient filling of the perovskite crystals. However, the value for 98 nm TiO
2 was lower than that for 52 nm. This might be due to the rutile phase of 98 nm TiO
2. A previous study comparing the electron lifetime in TiO
2 of various crystalline phases reported that the rutile phase has a shorter electron lifetime than the anatase phase [
33].
To visually evaluate the performance and reproducibility of the devices, forward and reverse scans of the champion and worst cells of solar cells fabricated with TiO
2 nanoparticles of various particle sizes were prepared (
Figure 5g). According to the
J-
V curves of the champion cell, solar cells with TiO
2 of any particle size have small hysteresis and a good
JSC above 20 mA/cm
2. However, the
J-
V curves of the worst cells show that solar cells with 14–26 nm TiO
2 have low current density caused by defects due to poor perovskite precursor solution penetration and crystallization. The cells with more than 43 nm of TiO
2 show relatively high current densities, even in the worst cells. As shown above, device performance can be reproducibly improved by changing the morphology of TiO
2. It has a positive impact on industrial production.
The incident-photon-to-current conversion efficiency (IPCE) values of the solar cells used for the
J-
V measurements were measured, and spectra were obtained. The spectra are shown in
Figure 6a. However, optical reflections and other optical losses are neglected in the IPCE spectrum [
34]. In MPLE-PSCs with porous structures, light reflection and scattering occur at the glass substrate and TiO
2 layer before the light reaches the perovskite crystal. Therefore, in order to compensate for these losses and to evaluate the photoelectric conversion performance of MPLE-PSCs at different wavelengths in detail, the absorbed photon-to-current conversion efficiency (APCE) was calculated using Equation (6).
where
[%] is the light absorption rate of the solar cell. Assuming that no light is transmitted from the MPLE-PSCs (Equation (3)) and that scattered light will eventually be absorbed,
[%] is calculated by Equation (7).
Figure 6b shows the
of a solar cell calculated by Equation (6). The solar cells with 43 nm TiO
2 exhibited the highest
values (over 90% at the 370–550 nm wavelength). This result is consistent with the trend in
JSC values obtained from
J-
V measurements.
Figure 3 indicates that more light was absorbed by the perovskite crystal in the porous electrode using the smaller TiO
2 nanoparticles. However, as shown in
Figure 6b, TiO
2 nanoparticles smaller than 18 nm showed lower APCE values because the perovskite light-absorbing crystal in the TiO
2 nanoparticle layer smaller than 18 nm was not introduced uniformly, resulting in the defects as vacancies.


