Abstract
The development of sustainable alternatives to chemical and mechanical biofilm removal for submerged technical devices used in freshwater and marine environments represents a major technical challenge. In this context, the antibiotic impact of blue light with its low absorption underwater provides a potentially useful alternative. However, former technical limitations led to hours of treatment. Here, we applied high-power blue laser irradiation (1500 W) with a wavelength of 448 nm to demonstrate its strong antibiotic and algicidal effect on different bacteria and algae in seconds. High-power blue light treatment (139 W/cm2) for only 8.9 s led to the efficient deactivation of all tested organisms. Analyses of the underlying biological mechanisms revealed the absorption of the blue light by endogenous chromophores (flavins, tetrapyrroles) with the generation of reactive oxygen species (ROS). In agreement, Escherichia coli transcriptome analyses demonstrated a stress response at the level of DNA damage repair, respiration, and protein biosynthesis. Spectroscopic measurements of the irradiated algae indicated the irreversible damage of chlorophyll by photooxidation with the formation of singlet oxygen. In conclusion, high-power blue laser radiation provides a strong sustainable tool for the removal of biofouling in a very short time for applications in aquatic systems.
1. Introduction
Man-made objects submerged in fresh- and seawater are rapidly colonised by aquatic organisms [1,2]. These processes, known as biofouling, can have severe economic consequences for shipping [3], aquacultures [4], or seawater desalination plants [5]. For example, biofouling on ship hulls increases their drag in water and, consequently, fuel consumption [3]. Further, the global transfer of species from their original to a new habitat creates new invasive life forms which often has detrimental consequences [6]. Biofouling communities are often complex and usually composed of a variety of different organisms including bacteria, archaea, microscopic fungi, barnacles, mussels, bryozoans, and micro- and macroalgae [7]. Common chemical antibiofouling measures including the application of protective coatings, the direct treatment of grown organisms with antibiotic substances, or the mechanical removal of the biofilm with parts of the coating often lead to leakage of biocidal compounds into the environment [8]. Moreover, the mechanical removal of the often worldwide collected community members leads to the mentioned habitat transfer by mechanical abrasion [9].
The antibiotic effect of light radiation in the wavelength range of 400–470 nm has been demonstrated in several studies for a broad spectrum of organisms such as fungi, bacteria, and viruses before [10,11,12,13,14,15]. Several studies concluded that the observed antibiotic effect is due to the light absorption by cellular chromophores such as porphyrins [16,17,18,19] and flavins [20,21]. It was also found that other compounds, e.g., staphyloxanthin of Staphylococcus aureus [22] and granadaene of Streptococcus agalactiae [23], can be involved in this process. All these pigments absorb the blue light via their conjugated chemical systems, reaching an excited state, and subsequently mistransmit parts of the collected energy as electrons to cellular oxygen. This cellular oxygen is usually employed as a safe electron acceptor during the respiratory chain for energy generation or is produced during the water-splitting process of photosynthesis. This also naturally occurring, accidental process produces reactive oxygen species (ROS), which can damage cells and has led to the development of counteracting advanced cellular detoxification systems. However, permanent high-impact blue light overwhelms these cellular stress responses, finally leading to cellular failure and death [21,24]. Singlet oxygen radicals, hydroxyl radicals, and superoxide radicals were detected in target cells as a consequence of their blue light irradiation [25,26,27]. The addition of radical scavengers like ascorbic acid and dimethylthiourea reduced the antibiotic effect of blue light, proving these hypotheses [28,29,30]. In this context, the intensity, irradiation time, and employed wavelength range are the important parameters. It was observed that irradiation using a wavelength range of 400–410 nm had a higher antibiotic effect compared to those using 445 nm and 450 nm [21,31]. The dose of the irradiation determines the total energy administered over the course of the irradiation and is given in J/cm2. Interestingly, a higher inactivation of the periodontitis-causing bacterium Porphyronas gingivalis was achieved using shorter irradiations with higher intensities (up to 400 mW/cm2) compared to longer irradiations with lower intensities (100 mW/cm2), all with light of 405 nm wavelength and a maximal dose of 24 J/cm2 [32]. Opposed to that, no significant difference was found for Listeria monocytogenes treatment employing light at 405 nm using a light-emitting diodes array at different intensities (10–30 mW/cm2) and the same overall dose of 108 J/cm2 [33].
Usually employed blue light sources including diode arrays, lasers, and conventional light sources reach blue light intensities of 50 mW/cm2 [21], 100 mW/cm2 [20], and 70 mW/cm2, respectively [34]. However, only in the last years has high-intensity blue laser light radiation with a power of 1500 W become technologically applicable. Interestingly, due to its low absorption in water, underwater application on larger surfaces is possible [35]. Thus, high-intensity blue laser radiation might provide an alternative strong tool for in situ biofouling removal from ship hulls and other aquatic technological surfaces. The first experiments with blue laser-treated marine biofilm-overgrown metal surfaces by the authors of the present publication revealed biofilm bleaching and final removal by the drag of the current [36]. A general sterilizing effect of the blue laser radiation on seawater was observed [37].
The short high-power blue laser irradiation times required for the desired biocidal effect opened the door for new applications, but also required the examination of the underlying principles for the observed antibiotic effect. Thus, the first aim of the present study was to experimentally quantify the antibiotic effect of high-power blue laser radiation on bacteria with Escherichia coli as a model and on various unicellular algae. The second aim was to determine the biochemical basis for the observed antibiotic effect by identifying involved absorbing cellular pigments and coloured cofactors (chlorophylls, flavins) and detecting potentially formed ROS.
2. Materials and Methods
2.1. Microorganisms and Their Cultivation
Escherichia coli K12 MG1655 (DSM498, DSMZ, Braunschweig, Germany) was cultivated in Lytic Broth medium (LB) (10 g/L tryptone, 5 g/L yeast extract, 5 g/L NaCl) at 37 °C in baffled flasks in a shaking incubator (180 rpm). Solid LB medium was prepared by the addition of 15 g/L agar. For irradiation experiments, E. coli K12 was incubated in LB medium until it reached the exponential growth phase. The cells were sedimented at 4000× g for 10 min, washed three times, and finally suspended in isotonic NaCl solution (0.9% (w/v)). The optical density at 578 nm (OD578nm) was measured and adjusted to 0.5. The bacterial suspensions were kept on ice until the irradiation.
The algae Chlorella fusca, Cyanophora paradoxa SAG 19.80, Chlamydomonas reinhardtii, and Oocystis sp. (inhouse collection) were cultivated in Bristol’s modified medium with the addition of vitamin and trace element solutions [38], 1% (v/v) Fe-EDTA complex solution, and 4% (v/v) soil extract [39], respectively. For the solid medium, 12 g/L agar was added. Porphyridium purpurea was cultivated in synthetic ocean water medium YBCII [38] with the addition of 5.65 mg/L NaH2PO4·2H2O, 22.4 mg/L Na2SiO3·5H2O, 75 mg/L NaNO3, and 200 mg/L NaHCO3. One hundred milligrams per litre of carbenicillin was supplemented to all algae cultures upon inoculation to avoid contamination with bacteria. All algae strains were cultivated at room temperature under a natural light cycle. For the irradiation of algae, the optical density at 750 nm (OD750nm) was adjusted to the desired value and the cultures were kept in their respective cultivation mediums at room temperature.
2.2. Irradiation Setup and Assessment of Photo Inactivation Effect
A volume of 2.5 mL of the respective cell suspensions was irradiated coaxially through the 10 × 20 mm quartz cuvette’s opening. A continuous wave blue diode laser (LDMblue 1000-100, Laserline, Mülheim, Germany) with a maximum power of 1500 W and a central wavelength of 448 nm was used. The cuvette was placed on the sample holder halfway submerged in a water container to allow for cooling of the sample during irradiation (Figure 1). Using zoom optics, the laser beam was formed into a rectangular spot with uniform power density. The power density was continuously adjustable via the size of the laser spot and the laser power applied. The parameters of the setup and the irradiation are outlined in Table 1.
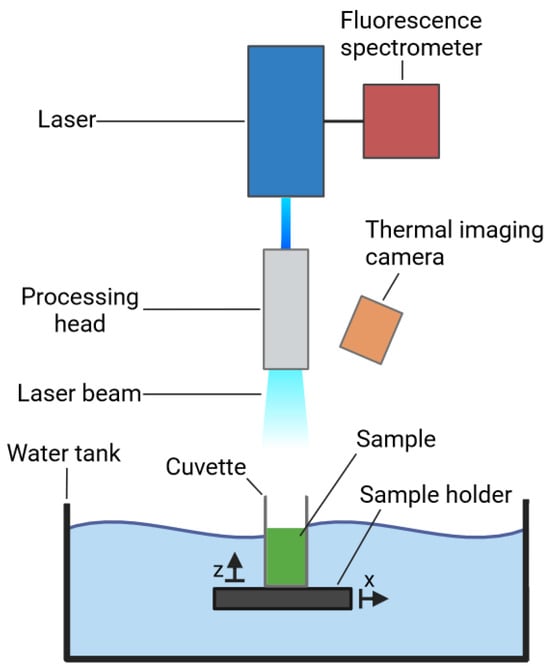
Figure 1.
High-power blue light laser irradiation setup. The sample to be tested was transferred into the quartz cuvette which was subsequently placed onto the sample holder and moved to the centre of the irradiated area. The processing head allowed for the modification of the laser beam according to the desired intensity. The thermal imaging camera was set up to measure the temperature development of the sample in the cuvette. The fluorescence emission was assessed via an optical fibre coaxially coupled to the laser optics, leading to the fluorescence spectrometer. The figure was generated using bioRender Software.

Table 1.
Parameters of the irradiation setup.
In order to assess the number of living cells before and after irradiation, the samples were serially diluted and defined volumes were plated onto corresponding solid media and incubated according to the outlined cultivation conditions to determine colony-forming units (CFUs). Triplicates were separately irradiated and analysed.
2.3. Spectroscopical and Temperature Measurement
The fluorescence emission was measured coaxially through the laser optics coupled to an optical fibre and fed into the fluorescence spectrometer (AvaSpec-Hero, Avantes, Apeldoorn, The Netherlands). Prior to recording, the overall radiation was filtered through a long-pass filter that blocks all emissions below a wavelength of 500 nm. Transmission spectra were recorded with a corresponding spectrometer (Lamda 900, PerklinElmer, Rodgau, Germany). For this purpose, the sample was transferred to a quartz cuvette and placed in the spectrometer. The layer thickness of the samples was 20 mm. The measuring interval of the wavelength was 1 nm. The temperature of the sample during irradiation was measured from above in the opening of the cuvette at an angle of 60° using a thermal imaging camera (RSE300, Fluke, Washington, DC, USA) (Figure 1). When evaluating the thermographic images, a specific pixel within the cuvette was selected that was located in the middle of the suspension.
2.4. Gene Expression Analyses Using RNA Microarray Technology
After irradiation of E. coli K12 MG1655 as outlined above, all samples including the controls were transferred to 15 mL tubes and further incubated at room temperature for 60 min under slight agitation. Cells were harvested by centrifugation for 5 min at 4000× g and kept at −80 °C. For further processing, the cells were thawed and resuspended in TE buffer (100 mM Tris-HCl, 50 mM EDTA, pH 8) including 15 mg/mL lysozyme. The RNA was isolated and purified using the RNeasy MiniKit (Qiagen, Hilden, Germany) and DNase treated using TurboDNase (ThermoFisher, Waltham, MA, USA) according to the manufacturer’s instructions. The RNA quality was assessed using a RNA nano chip for prokaryotic RNA according to the manufacturer’s instructions (Bioanalyzer 2100, Agilent, Waldbronn, Germany). The RNA concentration was measured in a spectrophotometer (NanoDrop Spectrophotometer ND-1000, peqlab, Potsdam, Germany). The RNA was labelled using the “ULS Fluorescent Labeling Kit for Agilent Arrays with Cy3 and Cy5” (Kreatech Biotechnology, Amsterdam, The Netherlands) following the manufacturer´s instructions for two-colour microarray-based gene expression analysis. For each condition, biological triplicates were examined. The fragmentation was carried out using the Gene Assay Hybridization Kit (Agilent). Agilent 8 × 15 K high-definition gene expression microarrays for E. coli K12 MG1655 were employed. Scanning of the microarrays was carried out in the Agilent C Scanner (Agilent; Scan Control 8.4.1; Feature Extraction 10.7.3.1). The raw data from the microarrays were processed using the software R (version 4.2.3) and the “Bioconductor” package [40,41]. A logarithmic fold change (logFC) higher than |0.8| was set as the cut-off value for a differential gene expression. The data of the transcriptome analyses of high-power blue laser radiation-treated E. coli K12 were made publicly accessible on NCBI GEO (Accession GSE255630).
2.5. Chlorophyll Extraction
A 500 mL culture of C. reinhardtii culture was grown as outlined above. Cells were harvested by centrifugation for 20 min at 3300× g. The resulting precipitate was frozen at −80 °C and then lyophilised at −45 °C and 180 µbar (Alpha 1-4 LD, Christ, Osterode am Harz, Germany). Dried cells were ground up by mortar and pistil treatment. After the addition of 100 mL acetone and 500 mg MgCO3, the suspension was incubated in the dark at 4 °C for 18 h. For hydrophobic exchange column chromatography purification, 50 mL carboxymethyl Sepharose CL-6B (Sigma-Aldrich, Taufkirchen, Gemany) was used. After equilibration with threecolumn volumes of acetone, the cell-free extract was applied. The column was washed with 50 mL methanol/acetone (5/95; v/v) and the elution was performed with 100 mL methanol/acetone (25/75; v/v). Chlorophyll-containing elution fractions were pooled and reduced under vacuum (Concentrator 5031, Eppendorf, Hamburg, Germany) and the final chlorophyll concentration was determined spectroscopically [42].
2.6. In Vitro Detection of Superoxide Radicals
Superoxide radical detection was performed after a modified protocol described before [40]. For this purpose, a volume of 1.65 mL nitroblue tetrazolium (NBT) solution (14 mg/mL NBT, 1.5 mg/mL L-methionine in 100 mM potassium phosphate buffer, pH 7.8) was added to 850 µL chromophore solution (11.7 µM riboflavin or 50.75 µM extracted chlorophyll, supplied as 10% (v/v) in acetone) and irradiated with a power of 300 W for 5 s. The absorbance was recorded at 560 nm (Touch Duo BioDrop, Biochrom, Cambridge, UK). Non-irradiated samples were used as blanks and samples without chromophores served as controls.
3. Results and Discussion
3.1. The Antibiotic Activity of High-Power Blue Laser
Unicellular organisms such as bacteria and microalgae are the first to attach to the surface of objects submerged in fresh- and seawater. They provide the basis for the formation of complex multi-layered biofilms [1]. Even the formation of a light slime layer on the surface of ships already leads to an 11% increase in the roughness [43] and as a consequence increases fuel consumption during operation. Here, we first investigated the impact and then its biochemical basis of high-power blue laser treatment of biofilm-forming microorganisms to systematically tackle the problem of aquatic biofouling. We started with the Gram-negative bacterium E. coli K12 DSM498 as a model for bacteria to study the antibiotic effect of high-power blue laser light (wavelength of 448 nm) using different radiation intensities of 2 and 139 W/cm2, respectively (Figure 2). These two values represent the highest and lowest intensities, respectively, possible in this setup.
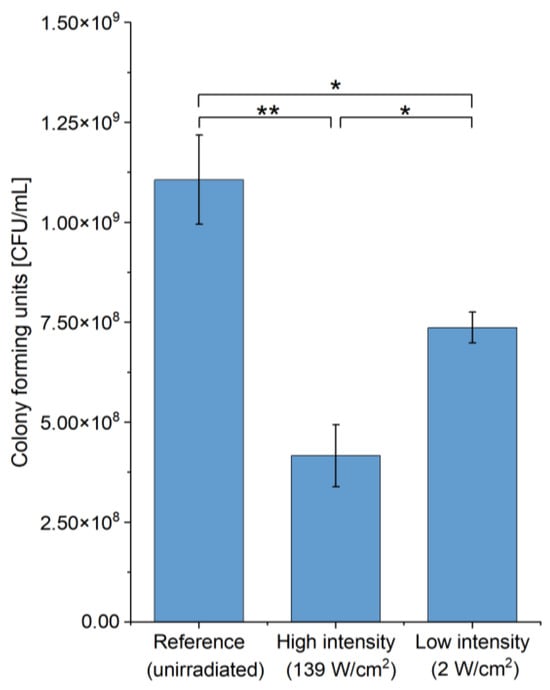
Figure 2.
Dose-dependence of the antibiotic effect of high-power blue laser radiation during the treatment of E. coli cultures. Colony forming units (CFU) of E. coli K12 DSM498 before and after irradiation are shown. High intensity was 8.9 s, 139 W/cm2. Low intensity was 600 s, 2 W/cm2. Total energy dose for all samples was 1240 J/cm2. Asterisks (*) indicate the significance value of the results (* p < 0.05; ** p < 0.01).
We used the identical overall dose of 1240 J/cm2, which proved sufficient for deactivating E. coli during our pre-experiments. Further, we intended to compare our effect obtained with the high-power blue laser radiation with the published effects of low-to-medium-power blue light (445 nm, 540 J/cm2 [21] and 450 nm, 18 J/cm2, 50 mW/cm2 on E. coli [34]). As expected, we observed that the survival rate for the high-intensity radiation (37.7 ± 7%) was almost half of that of low-intensity radiation (66.6 ± 3.5%). The temperature increase was 8.9 ± 2.9 °C from 17.4 ± 0.3 °C to 26.4 ± 2.9 °C during high-intensity irradiation and 3.6 ± 1.2 °C from 17.4 ± 1 °C to 21 ± 0.16 °C during low-intensity irradiation. It can be assumed that this temperature increase did not contribute significantly to the deactivation of the bacteria, since the growth rate of E. coli is usually not negatively affected by a temperature increase at temperatures below 40 °C [44]. Contrary, temperature increase as observed should enhance E. coli growth. Interestingly, Plavskii et al. observed a two-times reduced survival rate of 19% for E. coli using a laser radiation treatment at similar wavelengths of 445 nm with a dose of 540 J/cm2, but with a starting cell count of 1290 CFU/mL and following a 1200-times longer irradiation of 180 min. Since in our study just a 2-fold reduced survival rate of 37.7% was observed and E. coli suspensions with cell counts of six orders of magnitude larger (1.1 × 10⁹ ± 0.1 × 10⁹ CFU/mL) were irradiated, an overall comparison is difficult.
3.2. Transcriptome Analyses of High-Power Blue Laser Radiation Treated E. coli
In order to understand the molecular basis of the E. coli cellular stress response induced by blue light irradiation, a transcriptome analysis using RNA microarray technology was performed. Since E. coli stress responses are well understood at the gene regulatory level, the obtained results should be strongly indicative of underlying cellular responses and their triggering signals. To detect changes in the transcriptome of E. coli K12 following a high-power blue light laser irradiation, two different irradiation times (5 s and 20 s) were tested corresponding to doses of 310 J/cm2 and 1240 J/cm2, respectively, and an intensity of 62 W/cm2. A shorter irradiation time (5 s) was tested due to the high degree of 90% deactivation already observed for an irradiation time of 20 s (Figure S1). Furthermore, cells were incubated for 60 min after irradiation before analysing the mRNAs to allow the stressed cell a measurable transcriptional response.
At the 5 s irradiation time, only 15 genes out of over 4200 genes were found to be differentially expressed (logFC < |0.8|) (Figure 3A, Table 2). The expression of several genes responsive to DNA damage was found to be upregulated including that of recA (logFC 1.4), recN (logFC 1.3), and yebG (logFC 1.1). Firstly, RecA is part of the induction of the DNA repair SOS system via the proteolytic degradation of its transcriptional repressor LexA [10]. During this process, RecA forms filaments with the help of DinI (dinI LogFC 1.2) [45]. The biochemical opponent of DinI is DinD (dinD LogFC 1), required for disassembly of the RecA polymer after successful DNA repair [46]. The yebG and sbmC (LogFC 0.8) genes were found to be co-induced with the SOS response before [47,48]. During the DNA repair process, usually induced by UV light, the RecA recombinase binds single-stranded and double-stranded DNA during double-strand breaks to allow for a healing recombination process. During the same process, RecN is responsible for higher-ordered DNA compaction [49,50,51]. The also observed response to copper and zinc ions, visible in the upregulation of copA (LogFC 1.9, encoding a copper-exportin P-type ATPase) and zraP (LogFC 1.55, encoding a zinc resistance sensor/chaperone), relates to the SOS response in E. coli. Zn oxides protect LexA from cleavage by interfering with RecA [52]. Copper also influences the overall SOS response [53].
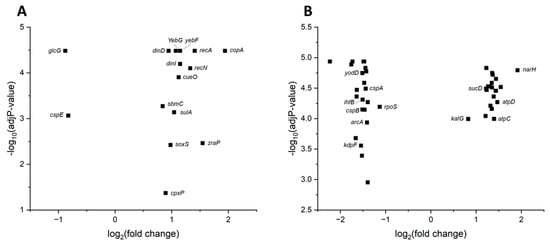
Figure 3.
Volcano plot displaying the differentially expressed genes and their corresponding adjusted p-values of E. coli K12 DSM498 following 5 s (panel (A)) and 20 s (panel (B)) irradiation with high-power blue laser radiation (310 J/cm2 and 1240 J/cm2 respectively, 62 W/cm2). A cut-off of logFC |0.8| was set for differential expression. Relevant genes were labelled.
Table 2.
Differentially expressed genes of E. coli K12 DSM498 following 5 s irradiation with high-power blue laser radiation (310 J/cm2, 62 W/cm2). A cut-off of logFC |0.8| was set for differential expression.
A similar response of bacteria to low- and medium-power blue laser radiation was observed before [54] and is in accordance with the evident damage of DNA observed following blue light irradiation [55]. Secondly, an oxygen stress response was observed, evidenced by the upregulation of soxS expression (logFC 1). SoxS is involved in the response to oxidative stress via the oxidation of the iron–sulphur cluster of SoxR [56].
Following a 20 s irradiation, 177 genes were found to be differentially transcribed in the range of logFC −2.2 to 1.9 (Figure 3B, Table 3). The response was dominated by the induction of the expression of many genes associated with mRNA translation (diverse rps, rpl, rpm genes, tuf, fusA), energy generation (narH, atpCD, sucD), and the further stress response (katG). Obviously, the E. coli cell was trying to repair ROS-damaged proteins via an induced protein biosynthesis [57]. For this purpose, essential parts of the energy metabolism are co-induced. Intracellular heme-containing catalase was shown to be photo-inactivated by blue-light treatment (410 nm) before [58]. Thus, an upregulation of the expression of katG gene encoding catalase, as seen in our study, was expected in order to replace damaged catalases and also meet the higher enzyme demand due to the generated ROS. Interestingly, genes encoding proteins of the initial steps of the classical general stress response were found in the process of decline (yodD, ihfB, rpoS, kdpF, arcA, cspAB). RpoS is the central sigma factor of E. coli coordinating general and stationary phase stress responses [59]. Integration host factor (IhfB) is involved as a DNA-bending protein for most adaptive gene responses in E. coli [60]. KdpF is part of the initial osmotic stress response [61]. ArcAB is the key regulator of the aerobic energy metabolism [62] and CspAB is an RNA protection system discovered during the analysis of the cold stress response [63]. Obviously, these proteins were not useful anymore.
Table 3.
Differentially expressed genes of E. coli K12 DSM498 following 20 s irradiation with high-power blue laser radiation (1240 J/cm2, 62 W/cm2). A cut-off of logFC |0.8| was set for differential expression. The genes were sorted by gene ontology (GO) terms following the classification available at Uniprot [64]. Genes which showed the highest differential expression and genes associated with the stress response are shown here. All genes are listed in the Supplementary Materials (Table S1).
In summary, for short time 5 s high-power blue light laser radiation of E. coli, we observed a general stress response with a strong focus on oxygen stress to repair DNA and protein damage. After 20 s radiation, the response shifted to protein biosynthesis to provide the cell with essential protein for survival and other stress responses declined.
3.3. Algicidal Effect of Blue Laser Treatment
Micro- and macroalgae are prominent members of aquatic biofilms [1] and thus important targets of a potential biofouling treatment strategy using high-power blue laser radiation. Consequently, the algicidal effect of high-intensity blue laser radiation was examined here. In previous experiments, the authors of the present publication showed the successful treatment of surface-attached natural marine biofilms partly composed of various microalgae with blue laser radiation [36]. In order to investigate the principal accessibility and underlying cellular processes of eukaryotic microalgae to this treatment, we used single algal species grown in liquid cultures. This was necessary in order to obtain defined growth times and conditions as well as the biomass yields required for the envisaged experiments. We started with the treatment of the worldwide spread freshwater green algae C. reinhardtii using high-power blue laser radiation (448 nm, radiation intensity of 139 W/cm2, 3, 6, and 8.9 s). C. reinhardtii is unicellular, eukaryotic, a chlorophyte, and the famous unicellular model algae [65]. We focused our investigation on the algicidal effect of high-intensity irradiation, since it was shown for E. coli above that high \-intensity radiation had a higher antibiotic effect compared to low-intensity radiation at the same overall dose.
Surprisingly, the killing effect of the laser treatment on C. reinhardtii was found to be much stronger than the effect observed for E. coli using comparable intensities and treatment times. A log10 reduction of 5.53 of viable cell counts was already observed after the irradiation with 139 W/cm2 for only 3 s, resulting in 417 J/cm2 (Figure 4). Longer irradiation times of 6 s resulting in 834 J/cm2 and 8.9 s in 1240 J/cm2 did not result in any detectable colony-forming units, indicating a complete eradication of the algae.
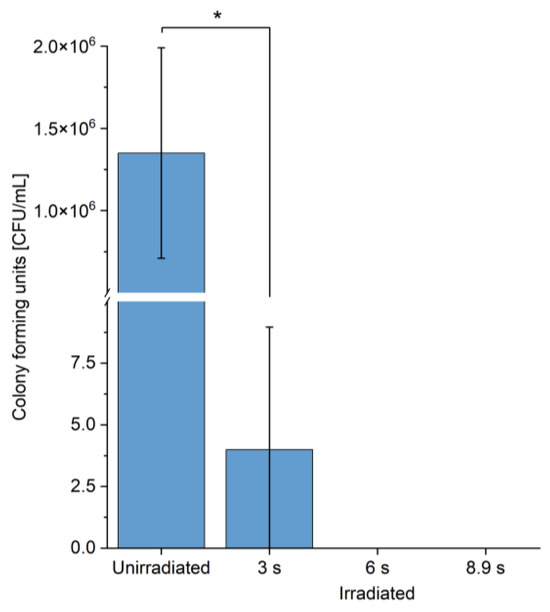
Figure 4.
Blue laser-mediated inactivation of green algae in seconds. Colony forming units of C. reinhartii before and after irradiation. Irradiation times: 3 s, 6 s, 8.9 s, intensity: 139 W/cm2. Asterisks (*) indicate the significance value of the results (* p < 0.05).
A temperature increase of 21.0 ± 2.0 °C from 19.8 ± 0.5 °C to 40.8 ± 2.5 °C was observed over the time course of the irradiation with 139 W/cm2 for only 3 s, resulting in 417 J/cm2. However, the latter effect did not influence the inactivation of algae, since in former studies, 1200 times longer incubation times (60 min) at 40 °C induced a heat shock response in the algae, however without killing the cells [66]. To our knowledge, high-power blue light treatment has not been published before for any Chlamydomonas species. However, the algicidal effect of blue light of unspecified wavelength was shown for the green algae Dunaliella bardawil and Dunaliella salina at 200 mW/cm2 after an irradiation of at least 1 h [67]. For D. salina, a survival rate of about 60% was observed following a 1 h blue light irradiation (200 mW/cm2, 720 J/cm2) at comparable cell counts of 0.5 to 1 × 10⁶ cells/mL [67]. For Prototheca zopfii, a 3 log-fold inactivation after blue light treatment (410 nm, 80 min, 38.2 W/cm2, 183.34 J/cm2) with a lower cell count of 105 CFU/mL was reported [68]. Clearly, the high-power laser with its up to 3500 times higher intensity inactivates the green algae in 6 s, whereas for other algae, blue light of lower intensity requires hours of treatment.
3.4. Transmission Spectra of High-Power Blue Laser Radiation Treated Algae
Interestingly, the green algae C. reinhardtii was much more sensitive to high-energy blue laser treatment compared to E. coli. The transcriptome of the non-pigmented E. coli suggested DNA damage and ROS formation as major detrimental causes of the blue light treatment. Moreover, in previous experiments of the authors of the present publication, a bleaching of the naturally green marine biofilm after laser treatment was observed [36]. Obviously, in both cases, bacteria and algae, pigment damage might contribute to the observed killing effect. In order to identify these involved pigments, in the next step we analysed the transmission spectra of irradiated and non-irradiated samples to gain insights into the nature of the affected pigments. For this purpose, we used the three green algae C. reinhardtii, C. fusca, and Oocystis sp. due to their status as model organisms or commercially relevant organisms [65,69,70]. In addition, the marine red algae P. purpurea was analysed due to its deviating pigmentation. As a red algae, it contains, in addition to chlorophylls and carotenoids also found in the green algae, light-harvesting phycobilisomes with the pigments phycoerythrin and phycocyanin, absorbing green-yellowish light [71]. The transmission spectra of irradiated and non-irradiated cell suspensions were compared to analyse the damage done to certain types of pigments, evident by the bleaching of the samples, in certain wavelength areas. Irradiation of high (139 W/cm2, 8.9 s) and low intensities (2 W/cm2, 600 s), both with the same total energy dose of 1240 J/cm2, was applied first on the green algae C. fusca. The loss of the typical green colour of the algae culture after irradiation with high-intensity blue laser radiation (139 W/cm2, 8.9 s) is clearly visible (Figure 5A, insert). Bleaching after blue laser radiation treatment was shown before for green algae D. bardawil and D. salina [67]. Transmission spectra of the algal culture revealed the disappearance of negative transmission peaks at about 440 nm, 490 nm, and 685 nm after irradiation (Figure 5). Almost identical results were obtained for the analogous blue laser radiation treatment of cultures of C. fusca and Oocystis sp. (Figure 5B,C). These peaks correspond to the absorbance of chlorophyll a (685 nm and 440 nm) and carotenoids (490 nm) [72].
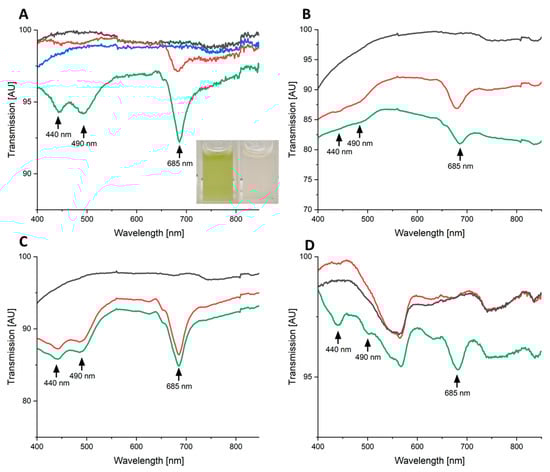
Figure 5.
Transmission spectra of high-power blue light laser irradiated green and red algae. Transmission spectra of the green algae C. fusca (panel (A)), C. reinhardtii (panel (B)), Oocysis sp. (panel (C)), and the red algae P. purpurea (panel (D)) are shown. The green lines represent spectra of untreated cells, the black lines spectra of high intensity blue light (139 W/cm2, 8.9 s) treated cells, the blue line in panel (A) spectra of low intensity blue light (2 W/cm2, 8.9 s) treated cells, and the red lines spectra of high intensity blue laser radiation (139 W/cm2, 8.9 s) treated cells in the presence of 1 mM ascorbic acid. A linear baseline adjustment was carried out manually. Total energy dose for all irradiated samples was 1240 J/cm2. The inserted picture in panel (A) shows C. fusca suspensions before (left) and after (right) irradiation.
As was shown for D. bardawil before [67], the conjugated systems of the chlorophyll and carotenoid molecules, representing also the target of blue light, were destroyed during the irradiation process and lost their absorbance properties. Usually, the rate of photobleaching of a fluorophore like chlorophyll (Figure 6) increases linearly with the power of excitation, and bleaching is strongly enhanced by the presence of oxygen in the cell [73,74]. In detail, the first excited triplet state of the pigment plays a key role in the process. A low triplet population results in low photobleaching. However, oxygen in the triplet state can interact with the first triplet of the chromophore/fluorophore in a photooxidation process forming a non-fluorescent chromophore radical and singlet molecular oxygen (ROS) [75]. Interestingly, the red algae P. purpurea showed a different behaviour after comparable blue light treatment (Figure 5D). Again, the typical transmission signals for chlorophylls and carotenoids disappeared. However, the broad peak at around 560 nm, characteristic of overlapping phycoerythrin (496 nm, 528 to 534 nm, 555 nm) and phycocyanin signals (550 nm and 615 nm) signals, remains stable even after high-power blue laser radiation treatment [76]. Obviously, the wavelength of the laser did not influence the green-yellowish absorbing pigments.
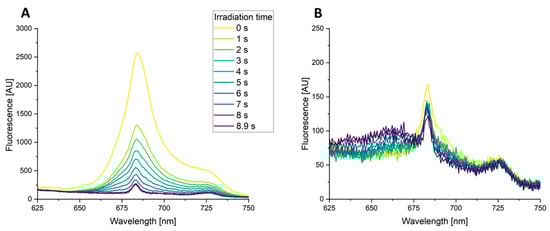
Figure 6.
Time-resolved fluorescence emission spectra of high-power blue laser radiation treated green and red algae. Fluorescence emission spectra were recorded of blue laser radiation (448 nm, 139 W/cm2, 0–8.9 s) excited suspensions of C. fusca (A) and P. purpurea (B). The fluorescence signals were recorded at 1 s intervals starting with the beginning of the irradiation.
3.5. Fluorescence Spectra of High-Power Blue Light Laser Irradiated Green and Red Algae
A central spectroscopic method to determine the basis of photobleaching is fluorescence spectroscopy [73]. To gain additional information about the effect of high-power blue laser radiation on chlorophylls in our algae, the fluorescence spectra of the freshwater green algae C. fusca and the marine red algae P. purpurea were measured. The high-power blue laser (448 nm, 139 W/cm2, 8.9 s) served as the excitation source, and the corresponding fluorescence emission was recorded between 500 nm and 800 nm. The obtained fluorescence signals recorded for C. fusca revealed the time-dependent diminishing of two peaks at 685 nm and 725 nm (Figure 6A). These fluorescence emission peaks with the employed excitation wavelength of the laser (448 nm) are typical for fluorescent chlorophyll a in accordance with the literature [77,78]. The peak at 685 nm is caused by chlorophyll a of photosystem II, while the peak around 725 nm can be attributed to chlorophyll a of antenna of photosystem I [78]. In agreement with the results of the transmission results, the fluorescence spectroscopy results indicated that chlorophyll is damaged and bleached during the blue light laser irradiation process.
Interestingly, the reduction of the fluorescence peak at 685 nm was significantly less visible for P. purpurea, where only a reduction of 30% was observed in contrast to the 91% reduction recorded over time for C. fusca (Figure 6). The overall chlorophyll fluorescence per biomass prior to radiation was 17 times lower for P. purpurea. In agreement, a chlorophyll content of 10 mg/gbiomass was determined before for P. purpurea during continuous cultivation [79], while a chlorophyll a and b content of 24.1 mg/gbiomass was described for C. fusca [80]. Additionally, the peak at 725 nm corresponding to photosystem I was not significantly diminished in P. purpurea during the blue light irradiation. It is possible that in P. purpurea, either blue light does not harm chlorophyll a in photosystem I, which would be in contrast to findings for the red algae Porphyra perforata [81], or that quenching to heat instead of reactive oxygen formation of the photosystem I is more significant. The emergence of a peak at 660 nm during the irradiation of P. purpurea might be due to allophycocyanin, which was described to emit fluorescence at this wavelength in P. cruentum [82]. The increasing fluorescence at 660 nm might indicate that energy transfer from allophycocyanin to chlorophyll a is lower, due to damaged chlorophylls, leading to emission of the energy in the form of fluorescence.
3.6. Heat Development during High-Power Blue Laser Radiation Treatment of Algae
The temperature of the samples was monitored during the high-power blue light irradiation of the algae to determine its impact on the bleaching of the organisms. Two different blue laser radiation intensities and irradiation times (139 W/cm2, 8.9 s and 2 W/cm2, 600 s) with the identical overall energy of 1240 J/cm2 were employed for the treatment of C. fusca. This analysis was carried out using C. fusca because it showed a more pronounced reduction of characteristic absorption peaks compared to C. reinhardtii (Figure 5). Since during blue light irradiation experiments with C. reinhardtii (139 W/cm2, 3 s, 417 J/cm2) a significant heat increase of 21.0 ± 2.0 °C was observed, a heat development in a similar order of magnitude was anticipated here. As expected, the different blue laser radiation intensities lead to different temperature increases in the C. fusca samples of 41.7 ± 4.5 °C at high and 4.4 ± 0.3 °C at low blue light intensity. However, the transmission spectra of both irradiated cultures showed no significant difference. All characteristic peaks were diminished as described above (Figure 5A). Obviously, the overall bleaching and inactivation procedure is not significantly related to the temperature increase in the sample. Clearly, the underlying chemical processes are temperature-dependent. However, the treatment time is only for seconds and usually algae can withstand these time spans of heating.
3.7. ROS Development during High-Power Blue Laser Radiation Treatment of Algae
The outlined chemical theory for chlorophyll bleaching proposed the formation of reactive oxygen species in the presence of molecular oxygen in the cell (see above). Thus, we concluded that also in our only seconds-lasting algae treatment with high-power blue laser light, triplet state oxygen interacts with the first triplet of chlorophyll yielding singlet molecular oxygen. Consequently, we wanted to confirm the presence and the involvement of reactive oxygen species in the observed bleaching and inactivation processes following high-intensity blue laser irradiation. Radical scavengers such as ascorbic acid are able to sequester radicals and thus lessen the damaging effects [83]. The addition of the radical scavenger ascorbic acid (1 mM) during high-intensity irradiation (139 W/cm2, 8.9 s) of cultures of C. fusca, Oocystis sp., and C. reinhardtii led to a diminished bleaching (Figure 5A–C). However, this was not observed for P. purpurea, where the addition seemed to have no significant impact on the pigmentation (Figure 5D). This might be explained by a failed uptake or a direct metabolisation after the uptake of ascorbic acid by P. purpurea. Since the alleviation of the bleaching by ascorbic acid was evident, one can assume that the deactivation of the algae was also diminished, due to the ROS binding by ascorbic acid. However, the restitution of viability of blue light irradiated C. reinhardtii in the presence of 1 mM ascorbic acid was not observed as described elsewhere [83]. It is conceivable that this was due to the high dose of blue laser radiation (139 W/cm2, 8.9 s) employed, which was three times higher than described before [83].
3.8. In Vitro Detection of ROS during Blue Light Irradiation of Chlorophyll and Riboflavin
To directly prove the role of chlorophylls and flavins as ROS sources during our in vivo experiments, extracted chlorophyll and riboflavin were used as chromophores to detect superoxide radicals in vitro after blue light irradiation (448 nm, 300 W, 5 s).
More than 250 times higher levels of superoxide radicals were detected during the irradiation of riboflavin compared to chlorophyll (Figure 7), pointing to flavins being one of the main sources of ROS during E. coli irradiation. Similarly, chlorophyll is a ROS source and the outlined theories of ROS development during high-power blue light radiation can be confirmed in principle. However, we interpret these assay qualitatively, since the experimental setup with the acetone and nitrobluetetrazolium (NBT) as a radical scavenger has some major drawbacks outlined before preventing quantitative interpretations.
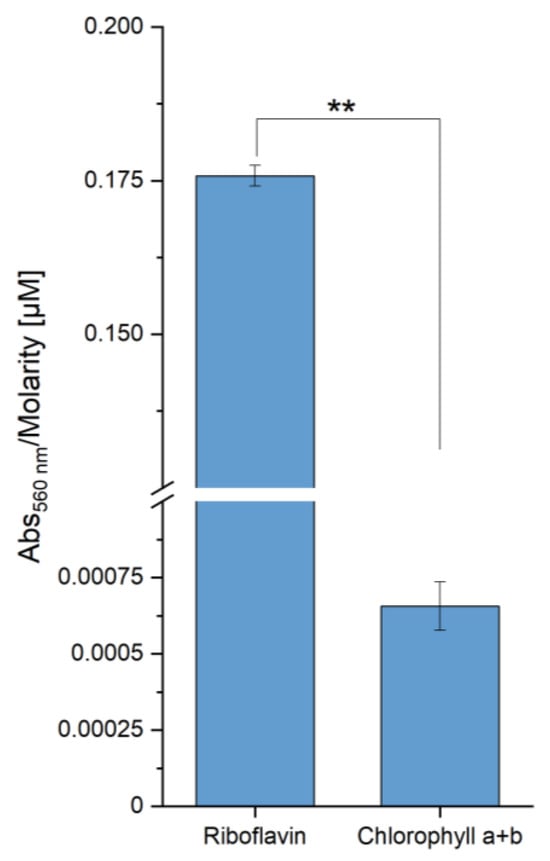
Figure 7.
In vitro detection of superoxide radicals via NBT-Assay with riboflavin and extracted chlorophyll after blue light irradiation. A volume of 1.65 mL nitrobluetetrazolium (NBT) solution (14 mg/mL NBT, 1.5 mg/mL L-methionine in 100 mM potassium phosphate buffer, pH 7.8) was added to 850 µL solution of the chromophores (Riboflavin, 11.7 µM in buffer) and extracted chlorophyll (50.75 µM in 10% (v/v) acetone) and irradiated with a power of 300 W blue light (448 nm) for 5 s. The absorbance resulting from the superoxide-dependent colour development of NBT was recorded at 560 nm. Asterisks (*) indicate the significance value of the results (** p < 0.01).
3.9. Limitations of the Study and Outlook
In this study, the effects of high-power blue laser radiation on single organisms all in liquid cultures were examined. This approach was necessary to deduce the underlying biochemical and biophysical principles for the observed antibiotic and algicidal effects. Of course, the next target will be surface-attached mixed organisms, but still defined biofilms in freshwater and marine environments. Thus, we are in the process of establishing reproducible surface-attached consortia also including higher organisms. From the technical side, we tackle the size of the whole setup and the necessary security measurements during operation.
4. Conclusions
The treatment of bacteria and algae with high-power blue laser light led to their efficient deactivation in a few seconds. The high-power blue laser light, absorbed by flavins and chlorophylls, led to the formation of reactive oxygen species (ROS), the damage of essential cellular functions, and ultimately to cell death. The next scientific challenge is its application on defined surface-attached biofilms. Thus, this novel technology represents a useful sustainable approach to the treatment of biofouling on large surfaces and is an ecological alternative to current chemical and mechanical treatment strategies.
Supplementary Materials
The following supporting information can be downloaded at: https://www.mdpi.com/article/10.3390/photonics11030220/s1, Figure S1: Dose–response curve of blue laser radiation-treated E. coli K12 DSM498, Table S1: Raw data RNA Microarray E. coli K12 irradiated and unirradiated.
Author Contributions
Conceptualization, M.H., S.Z., B.E., R.B., and D.J.; methodology, M.H. and S.Z.; validation, M.H., S.Z., B.E., and R.B.; formal analysis, M.H. and S.Z.; investigation, M.H. and S.Z.; data curation, M.H. and S.Z.; writing—original draft preparation, M.H.; writing—review and editing, R.B. and D.J.; visualization, M.H.; supervision, B.E. and R.B.; project administration, B.E., R.B., and D.J.; funding acquisition, R.B. and D.J. All authors have read and agreed to the published version of the manuscript.
Funding
This work was funded by the Volkswagen Foundation within “Change of Course” as part of the project “ProLAB—Project laboratory across borders”.
Data Availability Statement
The raw data supporting the conclusions of this article will be made available by the authors upon request. The data of the transcriptome analyses of high-power blue laser radiation-treated E. coli K12 was made publicly accessible on NCBI GEO (Accession GSE255630).
Acknowledgments
We thank Anja Hartmann for supplying the algae stains. We would like to thank the Open Access Funds of the Technische Universität Braunschweig. We gratefully acknowledge the support of the Braunschweig International Graduate School of Metrology B-IGSM.
Conflicts of Interest
The authors declare no conflicts of interest. The funders had no role in the design of the study; in the collection, analyses, or interpretation of data; in the writing of the manuscript; or in the decision to publish the results.
References
- Wahl, M. Marine epibiosis. I. Fouling and antifouling: Some basic aspects. Mar. Ecol. Prog. Ser. 1989, 58, 175–189. [Google Scholar] [CrossRef]
- Qian, P.-Y.; Cheng, A.; Wang, R.; Zhang, R. Marine biofilms: Diversity, interactions and biofouling. Nat. Rev. Microbiol. 2022, 20, 671–684. [Google Scholar] [CrossRef]
- Lewthwaite, J.C.; Molland, A.F.; Thomas, K.W. An investigation into the variation of ship skin frictional resistance with fouling. In Royal Institution of Naval Architects Transactions; Maritime Technical Information Facility: Evanston, WY, USA, 1985; ISSN 0035-8967. [Google Scholar]
- Shumway, S.E. (Ed.) Shellfish Safety and Quality; CRC Press: Boca Raton, FL, USA, 2009; ISBN 9781845691523. [Google Scholar]
- Matin, A.; Khan, Z.; Zaidi, S.; Boyce, M.C. Biofouling in reverse osmosis membranes for seawater desalination: Phenomena and prevention. Desalination 2011, 281, 1–16. [Google Scholar] [CrossRef]
- Molnar, J.L.; Gamboa, R.L.; Revenga, C.; Spalding, M.D. Assessing the global threat of invasive species to marine biodiversity. Front. Ecol. Environ. 2008, 6, 485–492. [Google Scholar] [CrossRef]
- Railkin, A.I. Marine Biofouling: Colonization Processes and Defenses; CRC Press: Boca Raton, FL, USA, 2004; ISBN 9780203503232. [Google Scholar]
- Alzieu, C.; Heral, M. Ecotoxicological effects of organotin compounds on oyster culture. In Ecotoxicological Testing for the Marine Environment; Persoone, G., Jaspers, E., Claus, C., Eds.; State University Ghent and Institute for Marine Scientific Research: Bredene, Belgium, 1984; Volume 2, pp. 187–196. [Google Scholar]
- Tamburri, M.N.; Davidson, I.C.; First, M.R.; Scianni, C.; Newcomer, K.; Inglis, G.J.; Georgiades, E.T.; Barnes, J.M.; Ruiz, G.M. In-Water Cleaning and Capture to Remove Ship Biofouling: An Initial Evaluation of Efficacy and Environmental Safety. Front. Mar. Sci. 2020, 7, 437. [Google Scholar] [CrossRef]
- Al-Shammary, A.A.K.; Mohd Ma’amor, N.A.A.; Chen, S.Q.; Lee, K.S.; Mohd Hanafiah, K. Bactericidal effects of in vitro 405 nm, 530 nm and 650 nm laser irradiation on methicillin-resistant Staphylococcus aureus, Pseudomonas aeruginosa and Mycobacterium fortuitum. J. Dent. Lasers 2020, 4, 111–121. [Google Scholar] [CrossRef]
- Hoenes, K.; Hess, M.; Vatter, P.; Spellerberg, B.; Hessling, M. 405 nm and 450 nm Photoinactivation of Saccharomyces cerevisiae. Eur. J. Microbiol. Immunol. 2018, 8, 142–148. [Google Scholar] [CrossRef]
- Leanse, L.G.; dos Anjos, C.; Mushtaq, S.; Dai, T. Antimicrobial blue light: A ‘Magic Bullet’ for the 21st century and beyond? Adv. Drug Deliv. Rev. 2022, 180, 114057. [Google Scholar] [CrossRef]
- Zupin, L.; Gratton, R.; Fontana, F.; Clemente, L.; Pascolo, L.; Ruscio, M.; Crovella, S. Blue photobiomodulation LED therapy impacts SARS-CoV-2 by limiting its replication in Vero cells. J. Biophotonics 2021, 14, e202000496. [Google Scholar] [CrossRef]
- Hessling, M.; Lau, B.; Vatter, P. Review of Virus Inactivation by Visible Light. Photonics 2022, 9, 113. [Google Scholar] [CrossRef]
- Kim, M.-J.; Mikš-Krajnik, M.; Kumar, A.; Ghate, V.; Yuk, H.-G. Antibacterial effect and mechanism of high-intensity 405 ± 5 nm light emitting diode on Bacillus cereus, Listeria monocytogenes, and Staphylococcus aureus under refrigerated condition. J. Photochem. Photobiol. B 2015, 153, 33–39. [Google Scholar] [CrossRef]
- Kumar, A.; Ghate, V.; Kim, M.-J.; Zhou, W.; Khoo, G.H.; Yuk, H.-G. Kinetics of bacterial inactivation by 405nm and 520nm light emitting diodes and the role of endogenous coproporphyrin on bacterial susceptibility. J. Photochem. Photobiol. B 2015, 149, 37–44. [Google Scholar] [CrossRef]
- Wu, J.; Chu, Z.; Ruan, Z.; Wang, X.; Dai, T.; Hu, X. Changes of Intracellular Porphyrin, Reactive Oxygen Species, and Fatty Acids Profiles During Inactivation of Methicillin-Resistant Staphylococcus aureus by Antimicrobial Blue Light. Front. Physiol. 2018, 9, 1658. [Google Scholar] [CrossRef]
- Amin, R.M.; Bhayana, B.; Hamblin, M.R.; Dai, T. Antimicrobial blue light inactivation of Pseudomonas aeruginosa by photo-excitation of endogenous porphyrins: In vitro and in vivo studies. Lasers Surg. Med. 2016, 48, 562–568. [Google Scholar] [CrossRef]
- Grinholc, M.; Rodziewicz, A.; Forys, K.; Rapacka-Zdonczyk, A.; Kawiak, A.; Domachowska, A.; Golunski, G.; Wolz, C.; Mesak, L.; Becker, K.; et al. Fine-tuning recA expression in Staphylococcus aureus for antimicrobial photoinactivation: Importance of photo-induced DNA damage in the photoinactivation mechanism. Appl. Microbiol. Biotechnol. 2015, 99, 9161–9176. [Google Scholar] [CrossRef]
- Biener, G.; Masson-Meyers, D.S.; Bumah, V.V.; Hussey, G.; Stoneman, M.R.; Enwemeka, C.S.; Raicu, V. Blue/violet laser inactivates methicillin-resistant Staphylococcus aureus by altering its transmembrane potential. J. Photochem. Photobiol. B 2017, 170, 118–124. [Google Scholar] [CrossRef]
- Plavskii, V.Y.; Mikulich, A.V.; Tretyakova, A.I.; Leusenka, I.A.; Plavskaya, L.G.; Kazyuchits, O.A.; Dobysh, I.I.; Krasnenkova, T.P. Porphyrins and flavins as endogenous acceptors of optical radiation of blue spectral region determining photoinactivation of microbial cells. J. Photochem. Photobiol. B 2018, 183, 172–183. [Google Scholar] [CrossRef]
- Dong, P.-T.; Mohammad, H.; Hui, J.; Leanse, L.G.; Li, J.; Liang, L.; Dai, T.; Seleem, M.N.; Cheng, J.-X. Photolysis of Staphyloxanthin in Methicillin-Resistant Staphylococcus aureus Potentiates Killing by Reactive Oxygen Species. Adv. Sci. 2019, 6, 1900030. [Google Scholar] [CrossRef] [PubMed]
- Jusuf, S.; Dong, P.-T.; Hui, J.; Ulloa, E.R.; Liu, G.Y.; Cheng, J.-X. Granadaene Photobleaching Reduces the Virulence and Increases Antimicrobial Susceptibility of Streptococcus agalactiae. Photochem. Photobiol. 2021, 97, 816–825. [Google Scholar] [CrossRef] [PubMed]
- Dos Anjos, C.; Leanse, L.G.; Ribeiro, M.S.; Sellera, F.P.; Dropa, M.; Arana-Chavez, V.E.; Lincopan, N.; Baptista, M.S.; Pogliani, F.C.; Dai, T.; et al. New Insights into the Bacterial Targets of Antimicrobial Blue Light. Microbiol. Spectr. 2023, 11, e0283322. [Google Scholar] [CrossRef] [PubMed]
- Cieplik, F.; Späth, A.; Leibl, C.; Gollmer, A.; Regensburger, J.; Tabenski, L.; Hiller, K.-A.; Maisch, T.; Schmalz, G. Blue light kills Aggregatibacter actinomycetemcomitans due to its endogenous photosensitizers. Clin. Oral Investig. 2014, 18, 1763–1769. [Google Scholar] [CrossRef]
- Ma, J.; Hiratsuka, T.; Etoh, T.; Akada, J.; Fujishima, H.; Shiraishi, N.; Yamaoka, Y.; Inomata, M. Anti-proliferation effect of blue light-emitting diodes against antibiotic-resistant Helicobacter pylori. J. Gastroenterol. Hepatol. 2018, 33, 1492–1499. [Google Scholar] [CrossRef]
- Lubart, R.; Lipovski, A.; Nitzan, Y.; Friedmann, H. A possible mechanism for the bactericidal effect of visible light. Laser Ther. 2011, 20, 17–22. [Google Scholar] [CrossRef]
- O’Donoghue, B.; NicAogáin, K.; Bennett, C.; Conneely, A.; Tiensuu, T.; Johansson, J.; O’Byrne, C. Blue-Light Inhibition of Listeria monocytogenes Growth Is Mediated by Reactive Oxygen Species and Is Influenced by σB and the Blue-Light Sensor Lmo0799. Appl. Environ. Microbiol. 2016, 82, 4017–4027. [Google Scholar] [CrossRef]
- Murdoch, L.E.; McKenzie, K.; Maclean, M.; MacGregor, S.J.; Anderson, J.G. Lethal effects of high-intensity violet 405-nm light on Saccharomyces cerevisiae, Candida albicans, and on dormant and germinating spores of Aspergillus niger. Fungal Biol. 2013, 117, 519–527. [Google Scholar] [CrossRef]
- Ramakrishnan, P.; Maclean, M.; MacGregor, S.J.; Anderson, J.G.; Grant, M.H. Cytotoxic responses to 405nm light exposure in mammalian and bacterial cells: Involvement of reactive oxygen species. Toxicol. Vitr. 2016, 33, 54–62. [Google Scholar] [CrossRef]
- Schmid, J.; Hoenes, K.; Vatter, P.; Hessling, M. Antimicrobial Effect of Visible Light-Photoinactivation of Legionella rubrilucens by Irradiation at 450, 470, and 620 nm. J. Antibiot. 2019, 8, 187. [Google Scholar] [CrossRef]
- Kotoku, Y.; Kato, J.; Akashi, G.; Hirai, Y.; Ishihara, K. Bactericidal effect of a 405-nm diode laser on Porphyromonas gingivalis. Laser Phys. Lett. 2009, 6, 388–392. [Google Scholar] [CrossRef]
- Murdoch, L.E.; Maclean, M.; Endarko, E.; MacGregor, S.J.; Anderson, J.G. Bactericidal effects of 405 nm light exposure demonstrated by inactivation of Escherichia, Salmonella, Shigella, Listeria, and Mycobacterium species in liquid suspensions and on exposed surfaces. Sci. World J. 2012, 2012, 137805. [Google Scholar] [CrossRef] [PubMed]
- de Sousa, N.T.A.; Santos, M.F.; Gomes, R.C.; Brandino, H.E.; Martinez, R.; de Jesus Guirro, R.R. Blue Laser Inhibits Bacterial Growth of Staphylococcus aureus, Escherichia coli, and Pseudomonas aeruginosa. Photomed. Laser Surg. 2015, 33, 278–282. [Google Scholar] [CrossRef] [PubMed]
- Pope, R.M.; Fry, E.S. Absorption spectrum (380–700 nm) of pure water. II. Integrating cavity measurements. Appl. Opt. 1997, 36, 8710–8723. [Google Scholar] [CrossRef]
- Zimbelmann, S.; Emde, B.; von Waldegge, T.H.; Stübing, D.; Baumann, M.; Hermsdorf, J. Interaction between laser radiation and biofouling for ship hull cleaning. Procedia CIRP 2022, 111, 705–710. [Google Scholar] [CrossRef]
- Zimbelmann, S.; Hermsdorf, J.; Emde, B. Disinfection of water by using laser radiation. Procedia CIRP 2022, 111, 766–769. [Google Scholar] [CrossRef]
- Chen, Y.-B.; Zehr, J.P.; Mellon, M. Growth and nitrogen fixation of the diazotrophic filamentous nonheterocystous cyanobacterium Trichodesmium sp. ims 101 in defined media: Evidence for a circadian rhythm1. J. Phycol. 1996, 32, 916–923. [Google Scholar] [CrossRef]
- Andersen, R.A. Algal Culturing Techniques; Elsevier Academic Press: Burlington, MA, USA, 2005; ISBN 9780080456508. [Google Scholar]
- Yang, Y.H.; Paquet, A.C. Preprocessing Two-Color Spotted Arrays. In Bioinformatics and Computational Biology Solutions Using R and Bioconductor; Springer: New York, NY, USA, 2005; pp. 49–69. [Google Scholar]
- Biedendieck, R.; Borgmeier, C.; Bunk, B.; Stammen, S.; Scherling, C.; Meinhardt, F.; Wittmann, C.; Jahn, D. Systems Biology of Recombinant Protein Production Using Bacillus megaterium. In Methods in Enzymology; Academic Press: Cambridge, MA, USA, 2011; pp. 165–195. [Google Scholar]
- Lichtenthaler, H.K. Chlorophyll Fluorescence Signatures of Leaves during the Autumnal Chlorophyll Breakdown. J. Plant Physiol. 1987, 131, 101–110. [Google Scholar] [CrossRef]
- Schultz, M.P. Effects of coating roughness and biofouling on ship resistance and powering. Biofouling 2007, 23, 331–341. [Google Scholar] [CrossRef]
- Ron, E.Z.; Davis, B.D. Growth rate of Escherichia coli at elevated temperatures: Limitation by methionine. J. Bacteriol. 1971, 107, 391–396. [Google Scholar] [CrossRef]
- Gao, B.; Liang, L.; Su, L.; Wen, A.; Zhou, C.; Feng, Y. Structural basis for regulation of SOS response in bacteria. Proc. Natl. Acad. Sci. USA 2023, 120, e2217493120. [Google Scholar] [CrossRef] [PubMed]
- Uranga, L.A.; Balise, V.D.; Benally, C.V.; Grey, A.; Lusetti, S.L. The Escherichia coli DinD protein modulates RecA activity by inhibiting postsynaptic RecA filaments. J. Biol. Chem. 2011, 286, 29480–29491. [Google Scholar] [CrossRef] [PubMed]
- Oh, T.J.; Jung, I.L.; Kim, I.G. The Escherichia coli SOS gene sbmC is regulated by H-NS and RpoS during the SOS induction and stationary growth phase. Biochem. Biophys. Res. Commun. 2001, 288, 1052–1058. [Google Scholar] [CrossRef] [PubMed]
- Oh, T.J.; Kim, I.G. Identification of genetic factors altering the SOS induction of DNA damage-inducible yebG gene in Escherichia coli. FEMS Microbiol. Lett. 1999, 177, 271–277. [Google Scholar] [CrossRef]
- Maslowska, K.H.; Makiela-Dzbenska, K.; Fijalkowska, I.J. The SOS system: A complex and tightly regulated response to DNA damage. Environ. Mol. Mutagen. 2019, 60, 368–384. [Google Scholar] [CrossRef]
- Fitzgerald, D.M.; Rosenberg, S.M. Biology before the SOS Response-DNA Damage Mechanisms at Chromosome Fragile Sites. Cells 2021, 10, 2275. [Google Scholar] [CrossRef]
- Klimova, A.N.; Sandler, S.J. An Epistasis Analysis of recA and recN in Escherichia coli K-12. J. Genet. 2020, 216, 381–393. [Google Scholar] [CrossRef]
- Bunnell, B.E.; Escobar, J.F.; Bair, K.L.; Sutton, M.D.; Crane, J.K. Zinc blocks SOS-induced antibiotic resistance via inhibition of RecA in Escherichia coli. PLoS ONE 2017, 12, e0178303. [Google Scholar] [CrossRef]
- Raro, O.H.F.; Poirel, L.; Nordmann, P. Effect of Zinc Oxide and Copper Sulfate on Antibiotic Resistance Plasmid Transfer in Escherichia coli. Microorganisms 2023, 11, 2880. [Google Scholar] [CrossRef]
- Rapacka-Zdonczyk, A.; Wozniak, A.; Kruszewska, B.; Waleron, K.; Grinholc, M. Can Gram-Negative Bacteria Develop Resistance to Antimicrobial Blue Light Treatment? Int. J. Mol. Sci. 2021, 22, 11579. [Google Scholar] [CrossRef]
- Liang, J.-Y.; Cheng, C.-W.; Yu, C.-H.; Chen, L.-Y. Investigations of blue light-induced reactive oxygen species from flavin mononucleotide on inactivation of E. coli. J. Photochem. Photobiol. B 2015, 143, 82–88. [Google Scholar] [CrossRef]
- Gu, M.; Imlay, J.A. The SoxRS response of Escherichia coli is directly activated by redox-cycling drugs rather than by superoxide. Mol. Microbiol. 2011, 79, 1136–1150. [Google Scholar] [CrossRef]
- Chang, R.L.; Stanley, J.A.; Robinson, M.C.; Sher, J.W.; Li, Z.; Chan, Y.A.; Omdahl, A.R.; Wattiez, R.; Godzik, A.; Matallana-Surget, S. Protein structure, amino acid composition and sequence determine proteome vulnerability to oxidation-induced damage. EMBO J. 2020, 39, e104523. [Google Scholar] [CrossRef]
- Dong, P.-T.; Zhan, Y.; Jusuf, S.; Hui, J.; Dagher, Z.; Mansour, M.K.; Cheng, J.-X. Photoinactivation of Catalase Sensitizes Candida albicans and Candida auris to ROS-Producing Agents and Immune Cells. Adv. Sci. 2022, 9, e2104384. [Google Scholar] [CrossRef]
- Schellhorn, H.E. Function, Evolution, and Composition of the RpoS Regulon in Escherichia coli. Front. Microbiol. 2020, 11, 560099. [Google Scholar] [CrossRef] [PubMed]
- Swinger, K.K.; Rice, P.A. IHF and HU: Flexible architects of bent DNA. Curr. Opin. Struct. Biol. 2004, 14, 28–35. [Google Scholar] [CrossRef]
- Pedersen, B.P.; Stokes, D.L.; Apell, H.-J. The KdpFABC complex—K+ transport against all odds. Mol. Membr. Biol. 2019, 35, 21–38. [Google Scholar] [CrossRef] [PubMed]
- Brown, A.N.; Anderson, M.T.; Bachman, M.A.; Mobley, H.L.T. The ArcAB Two-Component System: Function in Metabolism, Redox Control, and Infection. Microbiol. Mol. Biol. Rev. 2022, 86, e0011021. [Google Scholar] [CrossRef]
- Woodson, S.A.; Panja, S.; Santiago-Frangos, A. Proteins That Chaperone RNA Regulation. Microbiol. Spectr. 2018, 6, 385–397. [Google Scholar] [CrossRef]
- UniProt: The Universal Protein Knowledgebase in 2023. Nucleic Acids Res. 2023, 51, D523–D531. [CrossRef] [PubMed]
- Harris, E.H. Chlamydomonas as a model organism. Annu. Rev. Plant Physiol. Plant Mol. Biol. 2001, 52, 363–406. [Google Scholar] [CrossRef]
- Schulz-Raffelt, M.; Lodha, M.; Schroda, M. Heat shock factor 1 is a key regulator of the stress response in Chlamydomonas. Plant J. 2007, 52, 286–295. [Google Scholar] [CrossRef]
- Ben-Amotz, A.; Shaish, A.; Avron, M. Mode of Action of the Massively Accumulated beta-Carotene of Dunaliella bardawil in Protecting the Alga against Damage by Excess Irradiation. J. Plant Physiol. 1989, 91, 1040–1043. [Google Scholar] [CrossRef]
- Dos Anjos, C.; Sellera, F.P.; Gargano, R.G.; Lincopan, N.; Pogliani, F.C.; Ribeiro, M.G.; Jagielski, T.; Sabino, C.P. Algicidal effect of blue light on pathogenic Prototheca species. Photodiagn. Photodyn. Ther. 2019, 26, 210–213. [Google Scholar] [CrossRef] [PubMed]
- Krienitz, L.; Huss, V.A.R.; Bock, C. Chlorella: 125 years of the green survivalist. Trends Plant Sci. 2015, 20, 67–69. [Google Scholar] [CrossRef] [PubMed]
- Montezinos, D. A Cytological Model of Cellulose Biogenesis in the Alga Oocystis apiculata. In Cellulose and other Natural Polymer Systems: Biogenesis, Structure, and Degradation; Springer: Boston, MA, USA, 1982; pp. 3–21. [Google Scholar]
- Glazer, A.N. Light harvesting by phycobilisomes. Annu. Rev. Biophys. Biophys. Chem. 1985, 14, 47–77. [Google Scholar] [CrossRef] [PubMed]
- Davies-Colley, R.J.; Pridmore, R.D.; Hewitt, J.E. Optical properties of some freshwater phytoplanktonic algae. Hydrobiologia 1986, 133, 165–178. [Google Scholar] [CrossRef]
- Song, L.; Hennink, E.J.; Young, I.T.; Tanke, H.J. Photobleaching kinetics of fluorescein in quantitative fluorescence microscopy. Biophys. J. 1995, 68, 2588–2600. [Google Scholar] [CrossRef] [PubMed]
- Triantaphylidès, C.; Krischke, M.; Hoeberichts, F.A.; Ksas, B.; Gresser, G.; Havaux, M.; van Breusegem, F.; Mueller, M.J. Singlet oxygen is the major reactive oxygen species involved in photooxidative damage to plants. J. Plant Physiol. 2008, 148, 960–968. [Google Scholar] [CrossRef] [PubMed]
- Vass, I. Role of charge recombination processes in photodamage and photoprotection of the photosystem II complex. Physiol. Plant. 2011, 142, 6–16. [Google Scholar] [CrossRef] [PubMed]
- Gantt, E.; Lipschultz, C.A. Phycobilisomes of Porphyridium cruentum: Pigment analysis. Biochemistry 1974, 13, 2960–2966. [Google Scholar] [CrossRef]
- Israsena Na Ayudhya, T.; Posey, F.T.; Tyus, J.C.; Dingra, N.N. Using a Microscale Approach To Rapidly Separate and Characterize Three Photosynthetic Pigment Species from Fern. J. Chem. Educ. 2015, 92, 920–923. [Google Scholar] [CrossRef]
- Kalaji, H.M.; Schansker, G.; Brestic, M.; Bussotti, F.; Calatayud, A.; Ferroni, L.; Goltsev, V.; Guidi, L.; Jajoo, A.; Li, P.; et al. Frequently asked questions about chlorophyll fluorescence, the sequel. Photosynth. Res. 2017, 132, 13–66. [Google Scholar] [CrossRef]
- Csőgör, Z.; Kiessling, B.; Perner, I.; Fleck, P.; Posten, C. Growth and product formation of Porphyridium purpureum. J. Appl. Phycol. 2001, 13, 317–324. [Google Scholar] [CrossRef]
- Wild, A.; Urschel, B. Chlorophyll-Protein Complexes of Chlorella fusca. Z. Naturforschung C 1980, 35, 627–637. Available online: https://www.degruyter.com/document/doi/10.1515/znc-1980-7-815/xml (accessed on 12 December 2020). [CrossRef]
- Fork, D.C.; Öquist, G.; Hoch, G.E. Fluorescence emission from photosystem I at room temperature in the red alga Porphyra perforata. Plant Sci. Lett. 1982, 24, 249–254. [Google Scholar] [CrossRef]
- Mohanty, P.; Papageorgiou, G.; Govindjee. Fluorescence induction in the red alga Porphyridium cruentum. Photochem. Photobiol. 1971, 14, 667–682. [Google Scholar] [CrossRef]
- Rupel, K.; Zupin, L.; Ottaviani, G.; Bertani, I.; Martinelli, V.; Porrelli, D.; Vodret, S.; Vuerich, R.; da Passos Silva, D.; Bussani, R.; et al. Blue laser light inhibits biofilm formation in vitro and in vivo by inducing oxidative stress. NPJ Biofilms Microbiomes 2019, 5, 29. [Google Scholar] [CrossRef]
Disclaimer/Publisher’s Note: The statements, opinions and data contained in all publications are solely those of the individual author(s) and contributor(s) and not of MDPI and/or the editor(s). MDPI and/or the editor(s) disclaim responsibility for any injury to people or property resulting from any ideas, methods, instructions or products referred to in the content. |
© 2024 by the authors. Licensee MDPI, Basel, Switzerland. This article is an open access article distributed under the terms and conditions of the Creative Commons Attribution (CC BY) license (https://creativecommons.org/licenses/by/4.0/).