Quartz-Enhanced Photoacoustic Spectroscopy in the Terahertz Spectral Range


Abstract
1. Introduction
- -
- Sulfur—containing compounds (carbonyl sulfide—COS, carbon disulfide—CS2, hydrogen sulfide—H2S, sulfur oxide—SO2);
- -
- Halocarbons (chloromethane—CH3Cl);
- -
- Nitrogen—containing compounds (chlorine nitrate—ClONO2, ammonia—NH3, nitric oxide—N2O, nitric acid—HNO3);
- -
- Volatile organic compounds (methanol—CH3OH, methane—CH4, ethane—C2H6).
2. QTF-Based THz PAD Design
- -
- The optical radiation wave is focused between QTF prongs;
- -
- The wavelength of optical radiation is close to the wavelength of an absorption line of a molecular component of a studied gas sample;
- -
- The optical radiation wave amplitude (or wavelength) is modulated with a frequency coinciding with the frequency of an acoustic resonance of QTF;
- -
- Using the isothermal regime for “thin” prongs and using the adiabatic regime for “thick” prongs reduces ;
- -
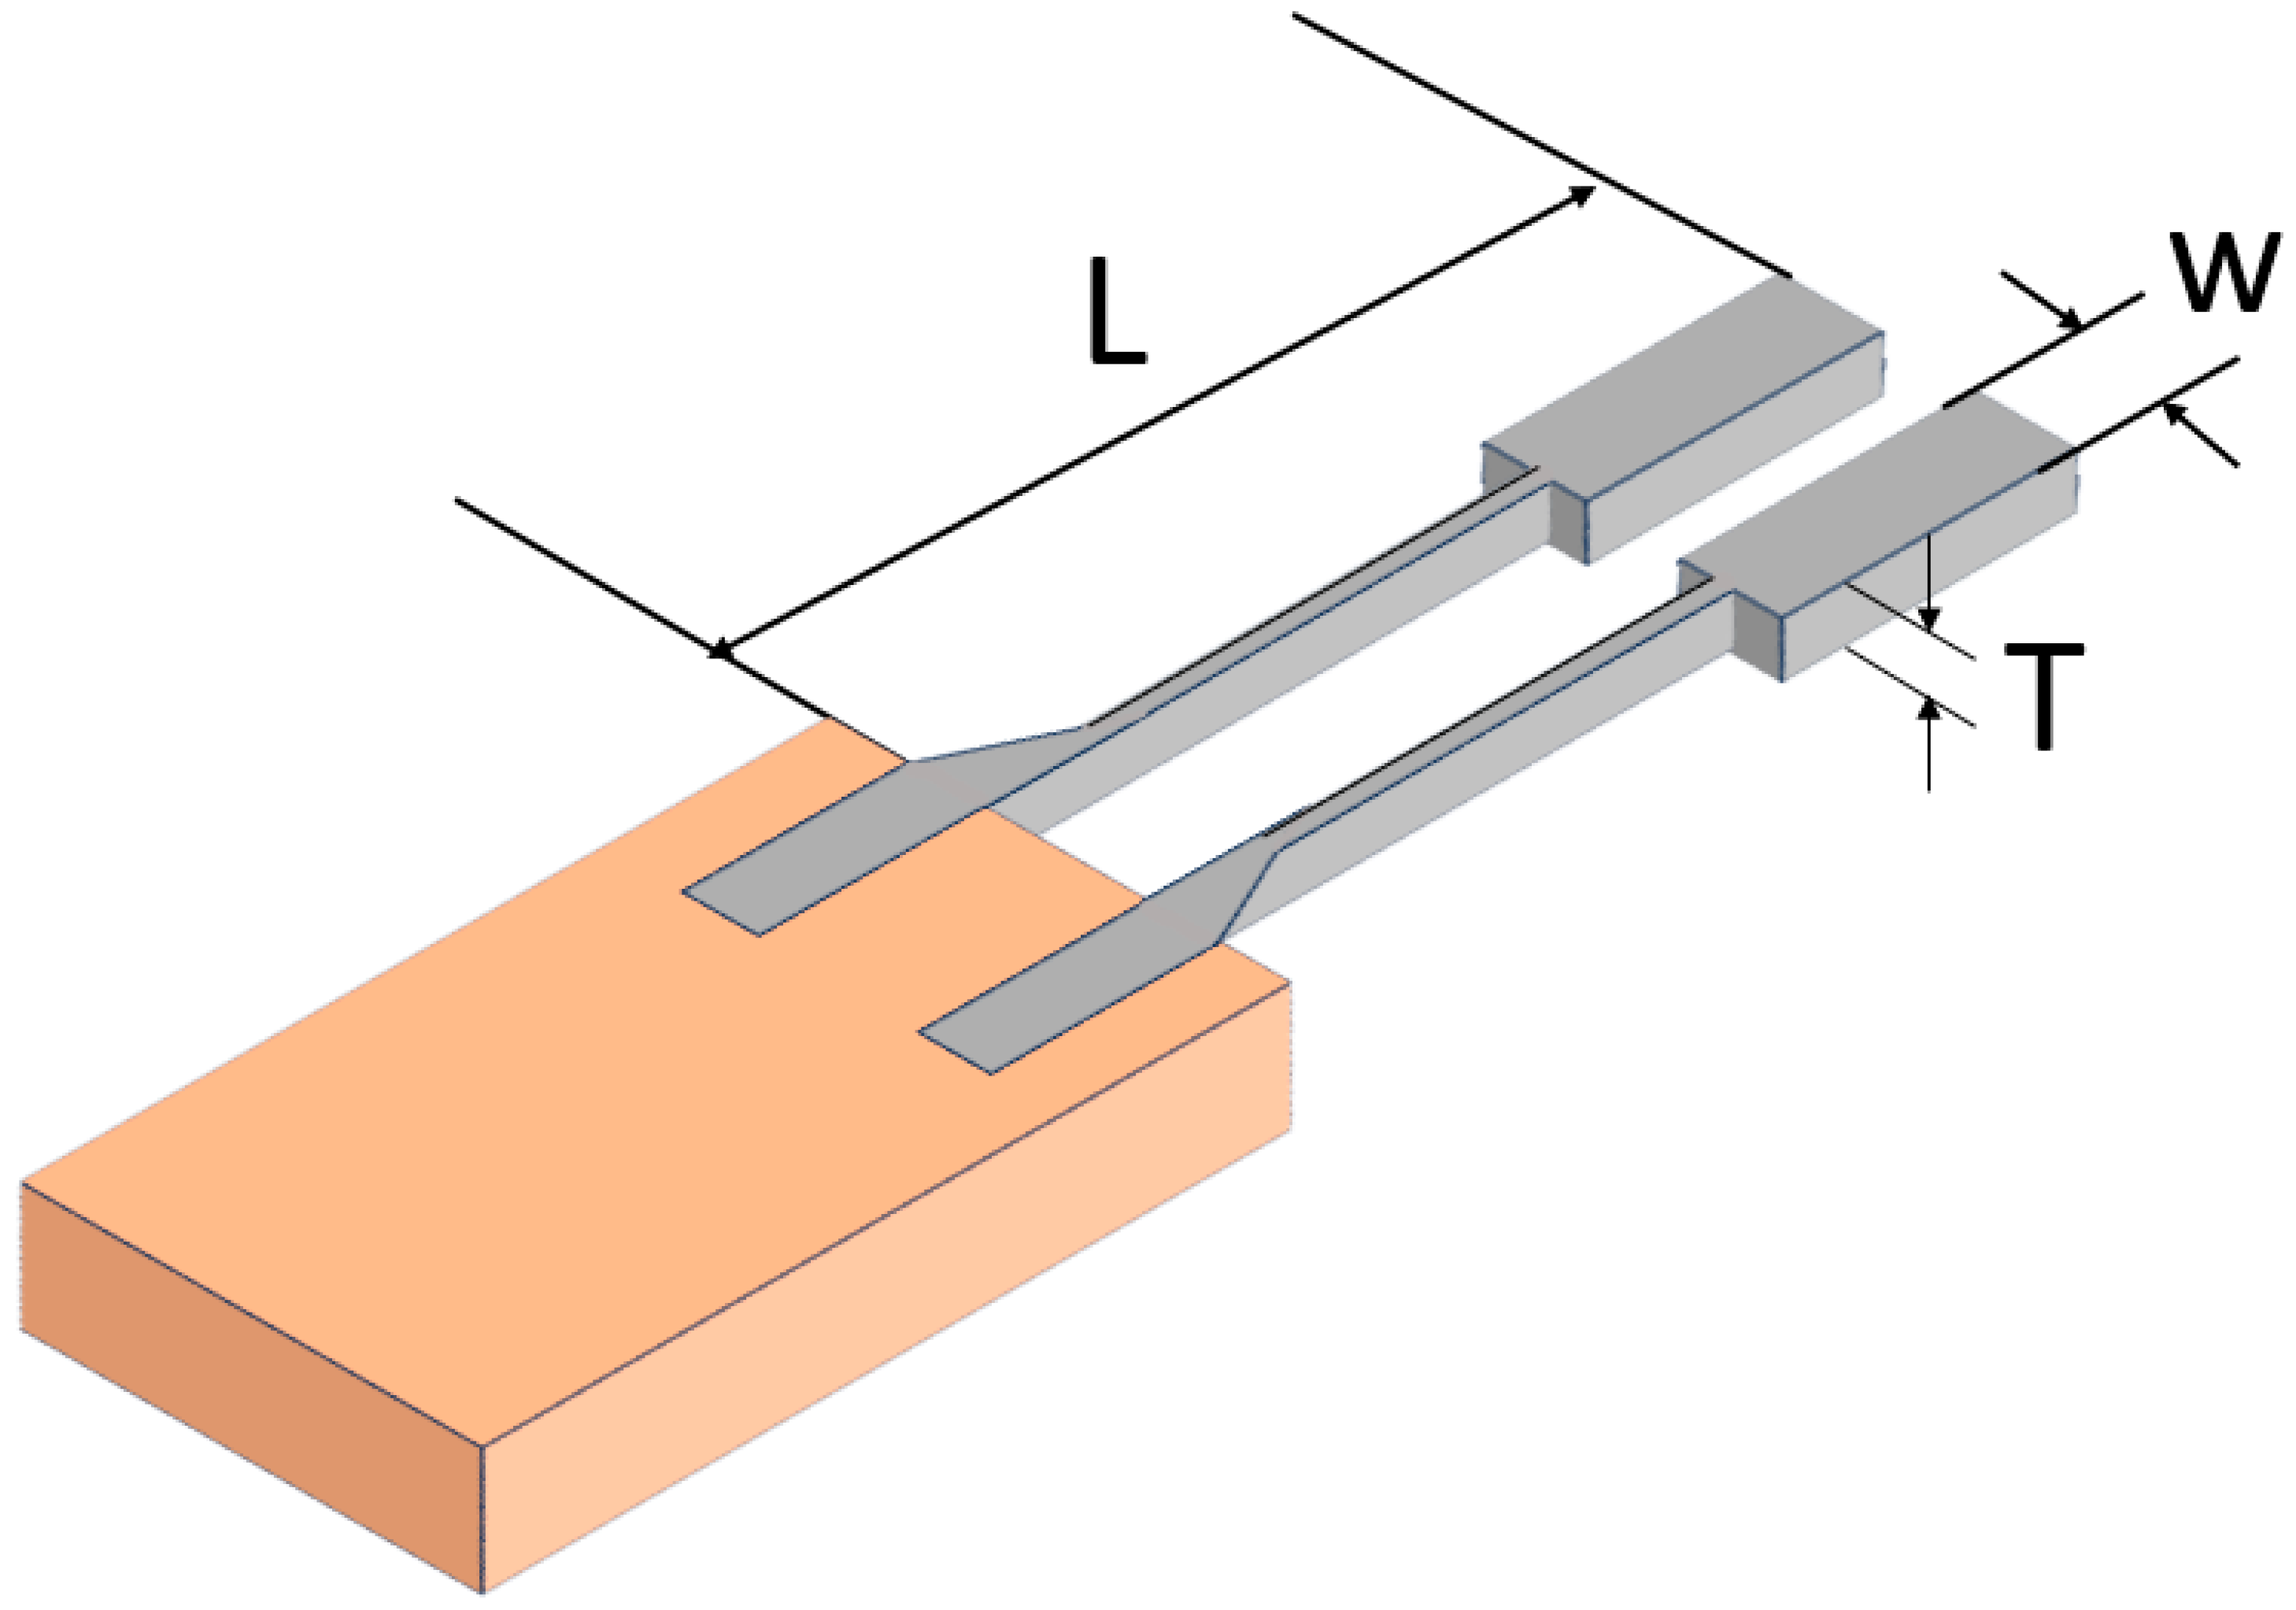
- increases with the prong width increasing and the thickness decreasing;
- -
- is inversely proportional to ;
- -
- is defined by the friction force arising at the prong-ambient gas boundary, which depends on the prong shape.
3. THz QEPAS Applications
4. Conclusions
- -
- Resonant absorption by a target gas component in a sample when the optical radiation source wavelength coincides with a central wavelength of an absorption line of this component;
- -
- Focusing the optical radiation in a small volume;
- -
- Mechanical resonance in an acoustic transducer when a frequency of amplitude of wavelength modulation of the optical radiation coincides with a resonance frequency of the transducer.
Author Contributions
Funding
Institutional Review Board Statement
Informed Consent Statement
Data Availability Statement
Conflicts of Interest
References
- Wang, F.; Cheng, Y.; Xue, Q.; Wang, Q.; Liang, R.; Wu, J.; Sun, J.; Zhu, C.; Li, Q. Techniques to Enhance the Photoacoustic Signal for Trace Gas Sensing: A Review. Sens. Actuators A Phys. 2022, 345, 113807. [Google Scholar] [CrossRef]
- Kistenev, Y.V.; Cuisset, A.; Romanovskii, O.A.; Zherdeva, A.V. A Study of Trace Atmospheric Gases at the Water–Atmosphere Interface Using Remote and Local IR Laser Gas Analysis: A Review. Atmos. Ocean. Opt. 2022, 35, S1, S17–S29. [Google Scholar] [CrossRef]
- The Hitran Database. Available online: https://hitran.org/ (accessed on 28 June 2023).
- GEISA—Spectroscopic Database. Available online: https://geisa.aeris-data.fr (accessed on 28 June 2023).
- Kistenev, Y.V.; Cuisset, A.; Hindl, F.; Raspopin, G.K.; Vax, V.L.; Domracheva, E.G.; Chernyaeva, M.B.; Karapuzikov, A.I. The Potential of Compact Sub-THz Band Spectrometers Based on Cascade Frequency Multi-plication for Local Environmental Monitoring of the Atmosphere. Radiophys. Quantum Electron. 2023. in print. [Google Scholar] [CrossRef]
- Cuisset, A.; Hindle, F.; Mouret, G.; Bocquet, R.; Bruckhuisen, J.; Decker, J.; Pienkina, A.; Bray, C.; Fertein, É.; Boudon, V. Terahertz Rotational Spectroscopy of Greenhouse Gases Using Long Interaction Path-Lengths. Appl. Sci. 2021, 11, 1229. [Google Scholar] [CrossRef]
- Zeninari, V.; Vallon, R.; Risser, C.; Parvitte, B. Photoacoustic Detection of Methane in Large Concentrations with a Helmholtz Sensor: Simulation and Experimentation. Int. J. Thermophys. 2016, 37, 7. [Google Scholar] [CrossRef]
- Karapuzikov, A.A.; Sherstov, I.V.; Kolker, D.B.; Karapuzikov, A.I.; Kistenev, Y.V.; Kuzmin, D.A.; Shtyrov, M.Y.; Dukhovnikova, N.Y.; Zenov, K.G.; Boyko, A.A.; et al. LaserBreeze Gas Analyzer for Noninvasive Di-agnostics of Air Exhaled by Patients. Phys. Wave Phenom. 2014, 22, 189–196. [Google Scholar] [CrossRef]
- Miklós, A.; Hess, P.; Bozóki, Z. Application of Acoustic Resonators in Photoacoustic Trace Gas Analysis and Metrology. Rev. Sci. Instrum. 2001, 72, 1937–1955. [Google Scholar] [CrossRef]
- Raspopin, G.K.; Makashev, D.R.; Borisov, A.V.; Kistenev, Y.V. Analysis of High-Frequency Acoustic Resonances of an Opto-Acoustic Detector with Differential Helmholtz Resonators. Opt. Spectrosc. 2022, 130, 278–283. [Google Scholar] [CrossRef]
- Kolker, D.B.; Pustovalova, R.V.; Starikova, M.K.; Karapuzikov, A.I.; Karapuzikov, A.A.; Kuznetsov, O.M.; Kistenev, Y.V. Optical Parametric Oscillator within 2.4–4.3 Μm Pumped with a Nanosecond Nd:YAG Laser. Atmos. Ocean. Opt. 2012, 25, 77–81. [Google Scholar] [CrossRef]
- Olvera, A.D.J.F.; Lu, H.; Gossard, A.C.; Preu, S. Continuous-Wave 1550 Nm Operated Terahertz System Us-ing ErAs:In(Al)GaAs Photo-Conductors with 52 DB Dynamic Range at 1 THz. Opt. Express. 2017, 25, 29492. [Google Scholar] [CrossRef]
- Zhu, J.; Qiao, D.; Jones, A.; Zhang, B.; Li, K.; Copner, N. 1.7 THz Tuning Range Pivot-Point-Independent Mode-Hop-Free External Cavity Diode Laser. Opt. Express. 2023, 31, 3970. [Google Scholar] [CrossRef] [PubMed]
- Hoppe, M.; Schmidtmann, S.; Aßmann, C.; Honsberg, M.; Milde, T.; Schanze, T.; Sacher, J.R.; Gu-Stoppel, S.; Senger, F. High Speed External Cavity Diode Laser Concept Based on a Resonantly Driven MEMS Scanner for the Mid-Infrared Region. Appl. Opt. 2021, 60, 92. [Google Scholar] [CrossRef]
- Bayrakli, I. Tunable Double-Mode Sensor for Multi-Gas Detection Based on the External-Cavity Diode Laser. Appl. Opt. 2018, 57, 4039. [Google Scholar] [CrossRef] [PubMed]
- Takida, Y.; Ikeo, T.; Nawata, K.; Wada, Y.; Higashi, Y.; Minamide, H. Terahertz Differential Absorption Spec-troscopy Using Multifurcated Subnanosecond Microchip Laser. Appl. Phys. Lett. 2019, 115, 121102. [Google Scholar] [CrossRef]
- Khan, M.S.; Keum, C.; Xiao, Y.; Isamoto, K.; Nishiyama, N.; Toshiyoshi, H. MEMS-VCSEL as a Tunable Light Source for OCT Imaging of Long Working Distance. J. Opt. Microsyst. 2021, 1, 1–16. [Google Scholar] [CrossRef]
- Shi, G.; Wang, W.; Zhang, F. Precision Improvement of Frequency-Modulated Continuous-Wave Laser Ranging System with Two Auxiliary Interferometers. Opt. Commun. 2018, 411, 152–157. [Google Scholar] [CrossRef]
- Pongrac, B.; Đonlagic, D.; Njegovec, M.; Gleich, D. THz Signal Generator Using a Single DFB Laser Diode and the Unbalanced Optical Fiber Interferometer. Sensors 2020, 20, 4862. [Google Scholar] [CrossRef]
- Chi, M.; Jensen, O.B.; Petersen, P.M. High-Power Dual-Wavelength External-Cavity Diode Laser Based on Tapered Amplifier with Tunable Terahertz Frequency Difference. Opt. Lett. 2011, 36, 2626. [Google Scholar] [CrossRef]
- Wang, J.; Tu, T.; Zhang, F.; Shen, F.; Xu, J.; Cao, Z.; Gao, X.; Plus, S.; Chen, W. External-Cavity Diode La-ser-Based near-Infrared Broadband Laser Heterodyne Radiometer for Remote Sensing of Atmospheric CO2. Opt. Express. 2023, 31, 9251. [Google Scholar] [CrossRef]
- Lu, Y.; Zhang, W.; Fan, J.; Zhou, X.; Wang, Y.; Qu, H.; Zheng, W. High-Power Tunable Dual-Wavelength Di-ode Laser with a Composite External Cavity. Opt. Lett. 2022, 47, 2486. [Google Scholar] [CrossRef]
- Mine, S.; Kawase, K.; Murate, K. Real-Time Wide Dynamic Range Spectrometer Using a Rapidly Wave-length-Switchable Terahertz Parametric Source. Opt. Lett. 2021, 46, 2618. [Google Scholar] [CrossRef] [PubMed]
- Zheng, Y.; Kurita, T.; Sekine, T.; Kato, Y.; Kawashima, T. Tunable Continuous-Wave Dual-Wavelength Laser by External-Cavity Superluminescent Diode with a Volume Bragg Grating and a Diffraction Grating. Appl. Phys. Lett. 2016, 109. [Google Scholar] [CrossRef]
- Yao, Y.; Hoffman, A.J.; Gmachl, C.F. Mid-Infrared Quantum Cascade Lasers. Nat. Photonics 2012, 6, 432–439. [Google Scholar] [CrossRef]
- Deutsch, C.; Detz, H.; Zederbauer, T.; Krall, M.; Brandstetter, M.; Andrews, A.M.; Klang, P.; Schrenk, W.; Strasser, G.; Unterrainer, K. InGaAs/GaAsSb/InP Terahertz Quantum Cascade Lasers. J. Infrared. Millim Terahertz Waves 2013, 34, 374–385. [Google Scholar] [CrossRef]
- Vurgaftman, I.; Canedy, C.L.; Kim, C.S.; Kim, M.; Bewley, W.W.; Lindle, J.R.; Abell, J.; Meyer, J.R. Mid-Infrared Interband Cascade Lasers Operating at Ambient Temperatures. New J. Phys. 2009, 11, 125015. [Google Scholar] [CrossRef]
- Williams, B.S. Terahertz Quantum-Cascade Lasers. Nat. Photonics 2007, 1, 517–525. [Google Scholar] [CrossRef]
- Fujita, K.; Hayashi, S.; Ito, A.; Hitaka, M.; Dougakiuchi, T. Sub-Terahertz and Terahertz Generation in Long-Wavelength Quantum Cascade Lasers. Nanophotonics 2019, 8, 2235–2241. [Google Scholar] [CrossRef]
- Lindner, S.; Hayden, J.; Schwaighofer, A.; Wolflehner, T.; Kristament, C.; González-Cabrera, M.; Zlabinger, S.; Lendl, B. External Cavity Quantum Cascade Laser-Based Mid-Infrared Dispersion Spectroscopy for Qualitative and Quantitative Analysis of Liquid-Phase Samples. Appl. Spectrosc. 2020, 74, 452–459. [Google Scholar] [CrossRef]
- Scheuermann, J.; Kluczynski, P.; Siembab, K.; Straszewski, M.; Kaczmarek, J.; Weih, R.; Fischer, M.; Koeth, J.; Schade, A.; Höfling, S. Interband Cascade Laser Arrays for Simultaneous and Selective Analysis of C1–C5 Hydrocarbons in Petrochemical Industry. Appl. Spectrosc. 2021, 75, 336–342. [Google Scholar] [CrossRef]
- Giraud, E.; Demolon, P.; Gresch, T.; Urio, L.; Muller, A.; Maulini, R. Room-Temperature Continuous-Wave External Cavity Interband Cascade Laser Tunable from 3.2 to 3.6 Μm. Opt. Express. 2021, 29, 38291. [Google Scholar] [CrossRef]
- Cherotchenko, E.D.; Dudelev, V.V.; Mikhailov, D.A.; Losev, S.N.; Babichev, A.V.; Gladyshev, A.G.; Novikov, I.I.; Lutetskiy, A.V.; Veselov, D.A.; Slipchenko, S.O.; et al. Observation of Long Turn-On Delay in Pulsed Quantum Cascade Lasers. J. Light. Technol. 2022, 40, 2104–2110. [Google Scholar] [CrossRef]
- Vanier, F.; Parrot, A.; Padioleau, C.; Blouin, A. Mid-Infrared Reflectance Spectroscopy Based on External Cavity Quantum Cascade Lasers for Mineral Characterization. Appl. Spectrosc. 2022, 76, 361–368. [Google Scholar] [CrossRef] [PubMed]
- Ma, Y. Review of Recent Advances in QEPAS-Based Trace Gas Sensing. Appl. Sci. 2018, 8, 1822. [Google Scholar] [CrossRef]
- Spagnolo, V.; Patimisco, P.; Borri, S.; Sampaolo, A.; Scamarcio, G.; Vitiello, M.S.; Beere, H.E.; Ritchie, D.A. THz Quartz-Enhanced Photoacoustic Sensor Employing a Quantum Cascade Laser Source. Proc. SPIE 2013, 8993, 899320. [Google Scholar]
- Borri, S.; Patimisco, P.; Sampaolo, A.; Beere, H.E.; Ritchie, D.A.; Vitiello, M.S.; Scamarcio, G.; Spagnolo, V. Terahertz Quartz Enhanced Photo-Acoustic Sensor. Appl. Phys. Lett. 2013, 103, 021105. [Google Scholar] [CrossRef]
- Spagnolo, V.; Borri, S.; Patimisco, P.; Sampaolo, A.; Calabrese, P.P.; Beere, H.E.; Ritchie, D.A.; Vitiello, M.S.; Scamarcio, G. THz Quantum Cascade Laser-Based Quartz Enhanced Photo-Acoustic Sensor. In Proceedings of the 2013 38th International Conference on Infrared, Millimeter, and Terahertz Waves (IRMMW-THz), Mainz, Germany, 1–6 September 2013; pp. 1–3. [Google Scholar]
- Elia, A.; Lugarà, P.M.; Di Franco, C.; Spagnolo, V. Photoacoustic Techniques for Trace Gas Sensing Based on Semiconductor Laser Sources. Sensors 2009, 9, 9616–9628. [Google Scholar] [CrossRef]
- Trzpil, W.; Maurin, N.; Rousseau, R.; Ayache, D.; Vicet, A.; Bahriz, M. Analytic Optimization of Cantilevers for Photoacoustic Gas Sensor with Capacitive Transduction. Sensors 2021, 21, 1489. [Google Scholar] [CrossRef]
- Patimisco, P.; Sampaolo, A.; Giglio, M.; dello Russo, S.; Mackowiak, V.; Rossmadl, H.; Cable, A.; Tittel, F.K.; Spagnolo, V. Tuning forks with optimized geometries for quartz-enhanced photoacoustic spectroscopy. Opt. Express 2019, 27, 1401. [Google Scholar] [CrossRef]
- Glauvitz, N.E.; Coutu, R.A.; Medvedev, I.R.; Petkie, D.T. Terahertz Photoacoustic Spectroscopy Using an MEMS Cantilever Sensor. J. Microelectromechanical Syst. 2015, 24, 216–223. [Google Scholar] [CrossRef]
- Sampaolo, A.; Patimisco, P.; Giglio, M.; Zifarelli, A.; Wu, H.; Dong, L.; Spagnolo, V. Quartz-Enhanced Photo-acoustic Spectroscopy for Multi-Gas Detection: A Review. Anal. Chim. Acta 2022, 1202, 338894. [Google Scholar] [CrossRef]
- Menduni, G.; Zifarelli, A.; Sampaolo, A.; Patimisco, P.; Giglio, M.; Amoroso, N.; Wu, H.; Dong, L.; Bellotti, R.; Spagnolo, V. High-Concentration Methane and Ethane QEPAS Detection Employing Partial Least Squares Regression to Filter out Energy Relaxation Dependence on Gas Matrix Composition. Photoacoustics 2022, 26, 100349. [Google Scholar] [CrossRef] [PubMed]
- Glauvitz, N.; Coutu, R.A.; Medvedev, I.R.; Petkie, D.T. MEMS-Based Terahertz Photoacoustic Chemical Sensing System. In Progresses in Chemical Sensor; InTech: Rijeka, Croatia, 2016; Volume 2, pp. 11–36. [Google Scholar] [CrossRef]
- Patimisco, P.; Borri, S.; Sampaolo, A.; Beere, H.E.; Ritchie, D.A.; Vitiello, M.S.; Scamarcio, G.; Spagnolo, V. A Quartz Enhanced Photo-Acoustic Gas Sensor Based on a Custom Tuning Fork and a Terahertz Quantum Cascade Laser. Analyst 2014, 139, 2079–2087. [Google Scholar] [CrossRef] [PubMed]
- Spagnolo, V.; Patimisco, P.; Sampaolo, A.; Giglio, M.; Vitiello, M.S.; Scamarcio, G.; Tittel, F.K. New Developments in THz Quartz Enhanced Photoacoustic Spectroscopy. In Terahertz Emitters, Receivers, and Applications VII; SPIE: Bellingham, WA, USA, 2016; Volume 9934, p. 99340. [Google Scholar] [CrossRef]
- Patimisco, P.; Scamarcio, G.; Tittel, F.; Spagnolo, V. Quartz-Enhanced Photoacoustic Spectroscopy: A Review. Sensors 2014, 14, 6165–6206. [Google Scholar] [CrossRef]
- Duquesnoy, M.; Aoust, G.; Melkonian, J.-M.; Lévy, R.; Raybaut, M.; Godard, A. Quartz Enhanced Photoacoustic Spectroscopy Based on a Custom Quartz Tuning Fork. Sensors 2019, 19, 1362. [Google Scholar] [CrossRef] [PubMed]
- Sadiek, I.; Mikkonen, T.; Vainio, M.; Toivonen, J.; Foltynowicz, A. Optical Frequency Comb Photoacoustic Spectroscopy. Phys. Chem. Chem. Phys. 2018, 20, 27849–27855. [Google Scholar] [CrossRef]
- McNaghten, E.D.; Grant, K.A.; Parkes, A.M.; Martin, P.A. Simultaneous Detection of Trace Gases Using Mul-tiplexed Tunable Diode Lasers and a Photoacoustic Cell Containing a Cantilever Microphone. Appl. Phys. B 2012, 107, 861–871. [Google Scholar] [CrossRef]
- Dong, L.; Kosterev, A.A.; Thomazy, D.; Tittel, F.K. QEPAS spectrophones: Design, optimization, and performance. Appl. Phys. B 2010, 100, 627–635. [Google Scholar] [CrossRef]
- Verstuyft, M.; Akiki, E.; Walter, B.; Faucher, M.; Vanwolleghem, M.; Kuyken, B. An Integrated Photoacoustic Terahertz Gas Sensor. In Proceedings of the 2019 44th International Conference on Infrared, Millimeter, and Terahertz Waves (IRMMW-THz), Paris, France, 1–6 September 2019; pp. 1–2. [Google Scholar]
- Kun, L.; Xiaoyong, G.; Hongming, Y.; Weidong, C.; Weijun, Z.; Xiaoming, G. Off-beam quartz-enhanced photoacoustic spectroscopy. Opt. Lett. 2009, 34, 1594–1596. [Google Scholar] [CrossRef]
- Köhring, M.; Böttger, S.; Willer, U.; Schade, W. LED-Absorption-QEPAS Sensor for Biogas Plants. Sensors 2015, 15, 12092–12102. [Google Scholar] [CrossRef]
- Rousseau, R.; Loghmari, Z.; Bahriz, M.; Chamassi, K.; Teissier, R.; Baranov, A.N.; Vicet, A. Off-Beam QEPAS Sensor Using an 11-Μm DFB-QCL with an Optimized Acoustic Resonator. Opt. Express. 2019, 27, 7435. [Google Scholar] [CrossRef]
- Hellström, J.; Jänes, P.; Elgcrona, G.; Karlsson, H. Compact and Efficient Nanosecond Pulsed Tuneable OPO in the Mid-IR Spectral Range. In Proceedings of the SPIE—The International Society for Optical Engineering, Munchen, Germany, 13–16 May 2013; Volume 8733, p. 87330A. [Google Scholar] [CrossRef]
- Rousseau, R.; Ayache, D.; Maurin, N.; Trzpil, W.; Bahriz, M.; Vicet, A. Monolithic Double Resonator for Quartz Enhanced Photoacoustic Spectroscopy. Appl. Sci. 2021, 11, 2094. [Google Scholar] [CrossRef]
- Vogt, D.W.; Jones, A.H.; Leonhardt, R. Terahertz Gas-Phase Spectroscopy Using a Sub-Wavelength Thick Ul-trahigh-Q Microresonator. Sensors 2020, 20, 3005. [Google Scholar] [CrossRef] [PubMed]
- Vogt, D.W.; Jones, A.H.; Haase, T.A.; Leonhardt, R. Subwavelength Thick Ultrahigh-Q Terahertz Disc Micro-resonators. Photonics Res. 2020, 8, 1183. [Google Scholar] [CrossRef]
- Seoudi, T.; Charensol, J.; Trzpil, W.; Pages, F.; Ayache, D.; Rousseau, R.; Vicet, A.; Bahriz, M. Highly Sensitive Capacitive MEMS for Photoacoustic Gas Trace Detection. Sensors 2023, 23, 3280. [Google Scholar] [CrossRef] [PubMed]
- Trzpil, W.; Charensol, J.; Ayache, D.; Maurin, N.; Rousseau, R.; Vicet, A.; Bahriz, M. A Silicon Micromechani-cal Resonator with Capacitive Transduction for Enhanced Photoacoustic Spectroscopy. Sens. Actuators B Chem. 2022, 353, 131070. [Google Scholar] [CrossRef]
- Chamassi, K.; Trzpil, W.; Arinero, R.; Rousseau, R.; Vicet, A.; Bahriz, M. Capacitive Silicon Mi-cro-Electromechanical Resonator for Enhanced Photoacoustic Spectroscopy. Appl. Phys. Lett. 2019, 115, 081106. [Google Scholar] [CrossRef]
- Glauvitz, N.E.; Coutu, R.A.; Petkie, D.T.; Medvedev, I.R. A Micro-Cantilever Based Photoacoustic Detector of Terahertz Radiation for Chemical Sensing. In Proceedings of the 2013 38th International Conference on Infrared, Millimeter, and Terahertz Waves (IRMMW-THz), Mainz, Germany, 1–6 September 2013; pp. 1–3. [Google Scholar]
- Adamson, B.D.; Sader, J.E.; Bieske, E.J. Photoacoustic Detection of Gases Using Microcantilevers. J. Appl. Phys. 2009, 106, 114510. [Google Scholar] [CrossRef]
- Patimisco, P.; Zou, S.; dello Russo, S.; Zifarelli, A.; Sampaolo, A.; Giglio, M.; Rossmadl, H.; Mackowiak, V.; Cable, A.; Iannuzzi, D.; et al. Comparison between interferometric and piezoelectric readout of tuning fork vibrations in quartz-enhanced photoacoustic spectroscopy. Proc. SPIE 2020, 11301, 113011S. [Google Scholar] [CrossRef]
- Siddiqui, N.A.; Kim, S.-B.; Kim, D.-J.; Overfelt, R.A.; Prorok, B.C. Shape Optimization of Cantilevered Piezoelectric Devices. In MEMS and Nanotechnology, Volume 5, Proceedings of the 2013 Annual Conference on Experimental and Applied Mechanics; Springer: Cham, Switzerland, 2014; pp. 43–48. [Google Scholar] [CrossRef]
- Mouret, G.; Guinet, M.; Cuisset, A.; Croize, L.; Eliet, S.; Bocquet, R.; Hindle, F. Versatile Sub-THz Spectrometer for Trace Gas Analysis. IEEE Sens. J. 2013, 13, 133–138. [Google Scholar] [CrossRef]
- Pohlkötter, A.; Köhring, M.; Willer, U.; Schade, W. Detection of molecular oxygen at low concentrations using quartz enhanced photoacoustic spectroscopy. Sensors 2010, 10, 8466. [Google Scholar] [CrossRef]
- Williams, B.S.; Kumar, S.; Hu, Q.; Reno, J.L. High-Power Terahertz Quantum-Cascade Lasers. Electron. Lett. 2006, 42, 89. [Google Scholar] [CrossRef]
- Sampaolo, A.; Patimisco, P.; Giglio, M.; Vitiello, M.; Beere, H.; Ritchie, D.; Scamarcio, G.; Tittel, F.; Spagnolo, V. Improved Tuning Fork for Terahertz Quartz-Enhanced Photoacoustic Spectroscopy. Sensors 2016, 16, 439. [Google Scholar] [CrossRef] [PubMed]
- Bigourd, D.; Cuisset, A.; Hindle, F.; Matton, S.; Bocquet, R.; Mouret, G.; Cazier, F.; Dewaele, D.; Nouali, H. Multiple Component Analysis of Cigarette Smoke Using THz Spectroscopy, Comparison with Standard Chemical Analytical Methods. App. Phys. 2007, 86, 579–586. [Google Scholar] [CrossRef]
- Gerecht, E.; Douglass, K.O.; Plusquellic, D.F. Chirped-Pulse Terahertz Spectroscopy for Broadband Trace Gas Sensing. Opt. Express. 2011, 19, 8973. [Google Scholar] [CrossRef]
- Harmon, S.A.; Cheville, R.A. Part-per-Million Gas Detection from Long-Baseline THz Spectroscopy. Appl. Phys. Lett. 2004, 85, 2128–2130. [Google Scholar] [CrossRef]
- Sampaolo, A.; Yu, C.; Wei, T.; Zifarelli, A.; Giglio, M.; Patimisco, P.; Zhu, H.; Zhu, H.; He, L.; Wu, H.; et al. H2S Quartz-Enhanced Photoacoustic Spectroscopy Sensor Employing a Liquid-Nitrogen-Cooled THz Quantum Cascade Laser Operating in Pulsed Mode. Photoacoustics 2021, 21, 100219. [Google Scholar] [CrossRef]
- Giglio, M.; Patimisco, P.; Sampaolo, A.; Scamarcio, G.; Tittel, F.K.; Spagnolo, V. Allan Deviation Plot as a Tool for Quartz Enhanced Photoacoustic Sensors Noise Analysis. IEEE Trans. Ultrason. Ferroelectr. Freq. Control. 2016, 63, 555. [Google Scholar] [CrossRef]
- Zifarelli, A.; Sampaolo, A.; Patimisco, P.; Giglio, M.; Yu, C.; Zhu, H.; Zhu, H.; Chang, G.; Wang, F.; Chen, J.; et al. N2-Cooled THz Quartz-Enhanced Photoacoustic Sensor Operating in Pulsed Mode for Hydrogen Sulfide Detection in the Part-per-Billion Concentration Range. In Proceedings of the Quantum Sensing and Nano Electronics and Photonics XVII; Razeghi, M., Lewis, J.S., Khodaparast, G.A., Khalili, P., Eds.; SPIE: Bellingham, WA, USA, 2020; p. 70. [Google Scholar]
- Yu, C.; Zhu, H.; Wang, F.; Chang, G.; Zhu, H.; Chen, J.; Chen, P.; Tang, Z.; Lu, W.; Shen, C.; et al. Highly Effi-cient Power Extraction in Terahertz Quantum Cascade Laser via a Grating Coupler. Appl. Phys. Lett. 2018, 113, 121114. [Google Scholar] [CrossRef]
- Wilke, I.; Rice, T.E.; Mansha, M.W.; Chowdhury, M.A.Z.; Hella, M.M.; Oehlschlaeger, M.A. Quantitative Gas Spectroscopy in the 220 to 330 GHz Frequency Band Utilizing a Microelectronic Spectrometer. In Proceedings of the 2022 47th International Conference on Infrared, Millimeter and Terahertz Waves (IRMMW-THz), Delft, The Netherlands, 28 August–2 September 2022; pp. 1–2. [Google Scholar]
- Mansha, M.W.; Rice, T.E.; Oehlschlaeger, M.A.; Wilke, I.; Hella, M.M. A 220–300 GHz Twin-FET Detector for Rotational Spectroscopy of Gas Mixtures. IEEE Sens. J. 2021, 21, 4553–4562. [Google Scholar] [CrossRef]
- Zhang, H.; Wang, Z.; Wang, Q.; Borri, S.; Galli, I.; Sampaolo, A.; Patimisco, P.; Spagnolo, V.L.; De Natale, P.; Ren, W. Parts-per-billion-level detection of hydrogen sulfide based on doubly resonant photoacoustic spectroscopy with line-locking. Photoacoustics 2023, 29, 100436. [Google Scholar] [CrossRef]
- Kistenev, Y.V.; Skiba, V.E.; Prischepa, V.V.; Vrazhnov, D.A.; Borisov, A.V. Super-Resolution Reconstruction of Noisy Gas-Mixture Absorption Spectra Using Deep Learning. J. Quant. Spectrosc. Radiat. Transf. 2022, 289, 108278. [Google Scholar] [CrossRef]
- Palzer, S. Photoacoustic-Based Gas Sensing: A Review. Sensors 2020, 20, 2745. [Google Scholar] [CrossRef]
- Niu, M.; Liu, Q.; Liu, K.; Yuan, Y.; Gao, X. Temperature-Dependent Characteristics of a Photoacoustic Detector. Optik (Stuttg) 2013, 124, 2450–2454. [Google Scholar] [CrossRef]
- Szakáll, M.; Csikós, J.; Bozóki, Z.; Szabó, G. On the Temperature Dependent Characteristics of a Photoacous-tic Water Vapor Detector for Airborne Application. Infrared. Phys. Technol. 2007, 51, 113–121. [Google Scholar] [CrossRef]
- Barreiro, N.; Peuriot, A.; Santiago, G.; Slezak, V. Water-Based Enhancement of the Resonant Photoacoustic Signal from Methane–Air Samples Excited at 3.3 Μm. Appl. Phys. B 2012, 108, 369–375. [Google Scholar] [CrossRef]
- Barreiro, N.; Vallespi, A.; Santiago, G.; Slezak, V.; Peuriot, A. Influence of Oxygen on the Resonant Photoa-coustic Signal from Methane Excited at the ν 3 Mode. Appl. Phys. B 2011, 104, 983–987. [Google Scholar] [CrossRef]
- Barreiro, N.; Peuriot, A.; Slezak, V.; Santiago, G. Study of the Dependence of the Photoacoustic Signal Am-plitude from Methane on Different Collisional Partners. Vib. Spectrosc. 2013, 68, 158–161. [Google Scholar] [CrossRef]
- Kistenev, Y.V.; Borisov, A.V.; Vrazhnov, D.A. Medical Applications of Laser Molecular Imaging and Machine Learning; SPIE: Bellingham, WA, USA, 2021; ISBN 9781510645356. [Google Scholar]
- Kistenev, Y.V.; Borisov, A.V.; Vrazhnov, D.A. Breathomics for Lung Cancer Diagnosis. In Multimodal Optical Diagnostics of Cancer; Springer International Publishing: Cham, Switzerland, 2020; pp. 209–243. [Google Scholar] [CrossRef]
- Borisov, A.V.; Syrkina, A.G.; Kuzmin, D.A.; Ryabov, V.V.; Boyko, A.A.; Zaharova, O.; Zasedatel, V.S.; Kistenev, Y. V Application of Machine Learning and Laser Optical-Acoustic Spectroscopy to Study the Profile of Exhaled Air Volatile Markers of Acute Myocardial Infarction. J. Breath Res. 2021, 15, 027104. [Google Scholar] [CrossRef]
- Ayache, D.; Rousseau, R.; Kniazeva, E.; Charensol, J.; Seoudi, T.; Bahriz, M.; Gouzi, F.; Spagnolo, V.; Vicet, A. Commercial and Custom Quartz Tuning Forks for Quartz Enhanced Photoacoustic Spectroscopy: Stability under Humidity Variation. Sensors 2023, 23, 3135. [Google Scholar] [CrossRef]


| Spectral Range | Laser Source and Power | Configuration of the Acoustic Detection Module, Acoustic Resonance Frequency; on/off-Beam Scheme | Wavelength (μm) | Absorption Line Strength (cm/mol) | NNEA (cm1∙W/√Hz) | Minimum Detection Limit at ~10 s Averaging |
|---|---|---|---|---|---|---|
| Near IR | Fiber-reinforced laser diode, 1500 mW | Adjustable QTF resonator, 7.2 kHz, on-beam | 1.5 | 1.5 × 10⁻²³ | 1.3 × 10⁻⁸ | 150 ppb |
| Medium IR | External resonator of a quantum cascade laser, 118 mW, constant power | Standard QTF resonator, 32 kHz, off-beam | 8.1 | 7.77 × 10⁻²³ | 3.05 × 10⁻⁹ | 40 ppb |
| THz | Fabry–Perot quantum cascade laser, 0.24 mW, constant power | Tunable QTF resonator, 2.8 kHz, on-beam | 103 (2.91 THz) | 1.13 × 10⁻²³ | 4.4 × 10⁻¹⁰ | 20 ppm |
| THz | Fabry–Perot quantum cascade laser, 150 mW, pulsed | Adjustable QTF resonator, 15.8 kHz, on-beam | 104.6 (2.87 THz) | 5.53 × 10⁻²³ | 3.1 × 10⁻⁸ | 360 ppb |
Disclaimer/Publisher’s Note: The statements, opinions and data contained in all publications are solely those of the individual author(s) and contributor(s) and not of MDPI and/or the editor(s). MDPI and/or the editor(s) disclaim responsibility for any injury to people or property resulting from any ideas, methods, instructions or products referred to in the content. |
© 2023 by the authors. Licensee MDPI, Basel, Switzerland. This article is an open access article distributed under the terms and conditions of the Creative Commons Attribution (CC BY) license (https://creativecommons.org/licenses/by/4.0/).
Share and Cite
Votintsev, A.P.; Borisov, A.V.; Makashev, D.R.; Stoyanova, M.Y.; Kistenev, Y.V. Quartz-Enhanced Photoacoustic Spectroscopy in the Terahertz Spectral Range. Photonics 2023, 10, 835. https://doi.org/10.3390/photonics10070835
Votintsev AP, Borisov AV, Makashev DR, Stoyanova MY, Kistenev YV. Quartz-Enhanced Photoacoustic Spectroscopy in the Terahertz Spectral Range. Photonics. 2023; 10(7):835. https://doi.org/10.3390/photonics10070835
Chicago/Turabian StyleVotintsev, Alexey P., Alexey V. Borisov, Didar R. Makashev, Mariya Y. Stoyanova, and Yury V. Kistenev. 2023. "Quartz-Enhanced Photoacoustic Spectroscopy in the Terahertz Spectral Range" Photonics 10, no. 7: 835. https://doi.org/10.3390/photonics10070835
APA StyleVotintsev, A. P., Borisov, A. V., Makashev, D. R., Stoyanova, M. Y., & Kistenev, Y. V. (2023). Quartz-Enhanced Photoacoustic Spectroscopy in the Terahertz Spectral Range. Photonics, 10(7), 835. https://doi.org/10.3390/photonics10070835