Abstract
An experimental study on an innovative contrast agent is presented. This work demonstrates that copper sulfide in the form of small-sized nanoparticles can be exploited in photoacoustic imaging. An advantage of this material is strong light absorption in the near-infrared range, especially in the transparency windows of biological tissues. In order to yield a proper contrast, light absorption must be followed by heat release with high efficiency. Therefore, it is important to evaluate the photochemical conversion efficiency of the material. We applied a method that is strictly related to photoacoustic applications. The nanoparticles were produced according to a well-established synthesis. Subsequently, they were diluted in pure water to obtain an extinction <0.2/cm at 1064 nm. The photoacoustic signals, generated by 1064 nm laser excitation, were analyzed as a function of concentration and incident laser energy below 70 μJ /pulse. The signals were carefully compared with those of a reference aqueous solution, containing a light-absorbing ionic solute. Data analysis yielded a light-to-heat conversion efficiency 1.0 (±0.1). We discuss this result by comparison with related studies on other types of copper sulfide nanoparticles, where the conversion efficiency reportedly varied from 33% to 93%. The high value determined in the present study possibly indicates that resonant light scattering and luminescence are negligible for our material system.
1. Introduction
The development of exogenous contrast agents is a primary task in the innovative research field of photoacoustic imaging (PAI) [1]. This technique is based on localized optical absorption of pulsed laser radiation followed by thermoelastic expansion that can be detected and spatially resolved. The contrast is given by the specific optical absorption of certain components in the visible and near-infrared spectral range, for most applications [2,3]. PAI as a diagnostic tool can gain sensitivity, selectivity, and ease of use, when a suitable contrast agent—either of the molecular type or in the form of a nanostructured solid—is employed. An ideal PAI contrast agent should display low toxicity, high efficiency—including photochemical stability—and versatility. The first requirement is common to all pharmaceutical products that are administered to patients [2]. Although PAI agents are not used as chronic drugs, the choice of researchers in this field is mainly oriented towards safe molecules [3]. The efficiency of PAI agents is a complex scientific and technological question [4,5,6]. High-performance contrast agents, in fact, should (i) absorb light strongly, i.e., display a high extinction coefficient at the excitation wavelength, and (ii) release all the absorbed energy by nonradiative pathways, leading to heat transfer to the environment surrounding the photoexcited systems. The latter step occurs on manifold time scales. It is often described as photothermal conversion efficiency (PCE) [7]. In addition, light absorption should not induce photodegradation of the contrast agent, nor the production of photoproducts that are potentially toxic for the patient. Finally, an advantageous feature—sometimes termed tunability—is the opportunity that a PAI agent can be optically excited at useful wavelengths in the widest possible range. This property can allow to employ PAI contrast agents in human tissues at excitation wavelengths that are not excessively screened by the tissues themselves: for example, within the transparency window between 750 nm and 1000 nm (first near-infrared window, or NIR-I), or that between 1000 and 1700 nm, indicated as second near-infrared window, or NIR-II [8,9,10]. NIR-I and NIR-II contrast agents efficiently combine both deep light penetration in the tissues and low attenuation by the components of body cells. We remind that light-to-heat conversion is not only essential in PAI: it also opens the way to drugs for photothermal therapy [11,12].
In addition to the physicochemical properties, suitable PAI agents must display advantageous features from the biological standpoint. This means they should be efficiently concentrated in the region of a living organism that must be imaged, and they should be rapidly excreted from the organism after imaging. Both features can be optimized in PAI contrast agents by chemical modifications, often indicated as biological targeting [13,14]. This strategy requires that the agent displays suitable chemical reactivity [15,16].
In summary, it is unlikely that a contrast agent joins all the favorable properties that we have mentioned. On the other hand, a criterion for the selection of a PAI contrast agent is PCE at a useful excitation wavelength. In the present communication, we discuss the experimentally determined PCE for a nanostructured system that strongly absorbs light at 1064 nm, due to a localized surface plasmon resonance (LSPR). Light at this wavelength is emitted by several commercial laser sources and can therefore be advantageously employed in PAI. We chose, in particular, small copper sulfide nanoparticles (NPs) in water dispersion because of both ease of chemical synthesis and the existing characterization of this material, that includes morphological and optical properties, pharmacokinetics, and theranostic applications [17].
2. Materials and Methods
2.1. Synthesis
The synthesis procedure follows the description of Ref. [17].
2.2. Materials
CuCl2 (Sigma-Aldrich, St. Louis, US, purity ≥ 99%), sodium citrate dihydrate (Sigma-Aldrich, St. Louis, US, purity ≥ 99.5%), Na2S nonahydrate (Alfa Aesar, Kandel, Germany, purity ≥ 98%), and water for HPLC (Sigma-Aldrich, St. Louis, MO, USA).
2.3. Procedure
A total of 100 μL of a 5 mM Na2S aqueous solution were added to 100 mL of an aqueous solution containing CuCl2 1 mM and sodium citrate 0.68 mM, under stirring at 400 rounds per minute at room temperature. After 5 min, the reaction mixture was heated to 90 °C and kept for 15 min at this temperature, until the color turned to dark green. Then, the reaction flask was transferred in ice-cold water. The obtained CuS NPs, after characterization through absorption spectroscopy, could be stored at 4 °C for long time. The authors of Ref. [17] report that the NPs display a spheroidal shape with 11 nm diameter.
2.4. UV-Visible Spectroscopy
Extinction spectra were measured with a Cary 60 spectrophotometer (Agilent Technologies, Santa Clara, CA, USA) in polymethyl methacrylate cuvettes with 1 cm optical path. The control spectra of the synthesis products were corrected by subtracting water absorption during the extinction measurement. At variance, the control spectra for the photoacoustic measurements were not corrected for water absorption to include the contribution of water absorption at 1064 nm to the generated photoacoustic signal (see Section 3).
2.5. Photoacoustic Spectroscopy
Photoacoustic signals were detected with a 1 MHz Panametrics V103-RM piezoelectric transducer, clamped to a standard quartz cuvette. The signals were amplified with a Panametrics 5660 B amplifier, and averaged with a Tektronix TDS-3054B digitizing oscilloscope. The minimum number of signals was 256 for each average. The excitation source was the 1064 nm emission of a Quanta System Giant Nd:Yag laser. The pulse duration was 10 ns and the repetition rate 10 Hz. The incident laser beam was shaped by a rectangular slit with a size of 1 mm × 10 mm, without focusing on the sample. The laser energy (from 20 to 70 μJ/pulse) was measured behind the empty cuvette by a pyroelectric energy meter before and after each photoacoustic signal measurement. The CuS samples for the photoacoustic measurements were prepared diluting the synthesized dispersions with pure water to reach the desired extinction value at 1064 nm. The corresponding concentrations can be evaluated by the extinction coefficient reported in Ref. [17], under the assumption that the NP size and shape are similar to those of the products of the original synthesis. The NP molarity range was therefore from 3 × 10⁻¹⁰ mol dm−3 to 1.5 × 10⁻⁹ mol dm−3. CuSO4 aqueous solutions were employed as a calorimetric reference.
3. Results and Discussion
The synthesis of CuS NPs led to fairly stable dispersions that could be kept for approximately one month before aggregation and precipitation were observed. The extinction spectrum of the freshly synthesized dispersion after dilution is shown in Figure 1. The NIR band, that displays LSPR characteristics, shows a maximum at 960 nm. The shape and position of LSPR bands have been related to the excitation of charge carriers in nanostructured solids. In pioneer research, metal-based NPs were investigated. In the following years, plasmonics spread over various classes of chemical compounds including, in particular, transition-metal sulfides [18]. Generally speaking, LSPR bands consist of the sum of an overwhelming absorption contribution and of a scattering contribution, both giving origin to extinction, with the scattering contribution being especially relevant in anisotropic NPs [19].
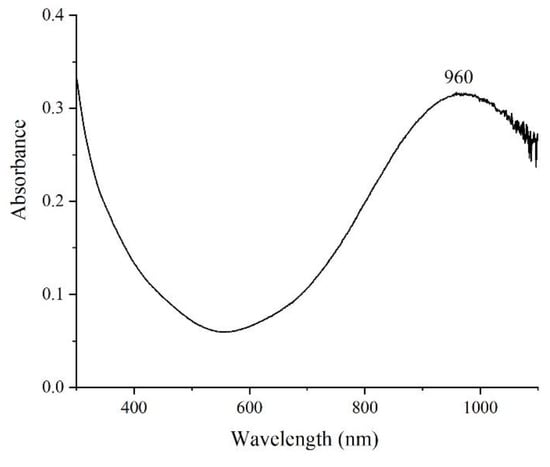
Figure 1.
Extinction spectrum of a newly synthesized CuS aqueous dispersion after (1:9) v/v dilution. The optical path was 1 cm. The absorption of water was subtracted by the instrument during the acquisition.
The position of the LSPR band and that reported in Ref. [17], namely 930 nm, are comparable. This similarity implies that the NPs employed in the present study, and those previously characterized, are strictly related from the structural point of view. Importantly, the broad absorption band covers a wide part of the NIR-I and NIR-II wavelength ranges.
Strong light absorption at therapeutic wavelengths is not the only prerequisite for potential PAI agents. In fact, the energy absorbed by light must be efficiently converted to heat in case a sizeable temperature increase must be locally effected. Therefore, the evaluation of PCE attracts a steadily growing importance in the field of photoactive materials in general, and especially in PAI. Photothermal methods are the natural choice to investigate PCE in isolated model systems and also in vivo. Photoacoustic signals, in particular, can be properly measured and analyzed to obtain accurate values from aqueous solutions and dispersions of various materials with PAI properties. In the present study, we evaluated the PCE of NP dispersions at a single light excitation wavelength, namely, 1064 nm. The results are shown in Figure 2a as a plot of the photoacoustic signal vs. incident laser pulse energy. This type of presentation offers a double advantage. Linear fitting of the signals yields curves with a slope that can be considered as the averaged value of the signal amplitude. In addition, signal linearity with laser energy is an important check of the absence of undesired photoinduced processes, such as photolysis or saturation, in the employed experimental conditions. A noteworthy feature of the photoacoustic amplitude with 1064 nm excitation was the presence of the signal of water. As the employed dispersions were fairly diluted, the contribution of water stayed constant in all the samples in opposition to the NP contributions that scaled with the NP concentration. The broad absorption band of water, with a maximum at 975 nm, can be clearly observed in the spectra we report in Figure 2b for a useful comparison with the corresponding photoacoustic signals of Figure 2a.
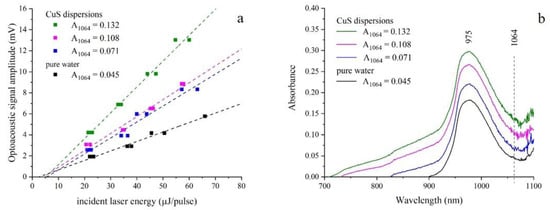
Figure 2.
(a) Optoacoustic signal amplitudes (mV) of CuS dispersions plotted as a function of incident laser energy (μJ/pulse). Dashed lines represent a linear fitting function of the data. According to the legend, different colors refer to samples having the extinction values at 1064 nm shown in the extinction spectra (b). In black, the data referred to pure water are also reported. The vertical dashed line in (b) corresponds to the laser excitation wavelength. The extinction band of water with a maximum at 975 nm was not subtracted from the extinction spectra shown in this figure.
To extend averaging, the photoacoustic measurements were repeated with samples at increasing NP concentration. It is expected, then, that the photoacoustic signals increase linearly with the absorption factor a defined as:
where A(λ) is the decadic absorbance at the excitation wavelength.
The evaluation of the PCE by photoacoustic measurements requires the use of a calorimetric reference. This is a substance that immediately releases all the energy absorbed by light as heat [20]. In many cases, calorimetric references display a unitary PCE. The important aspect is that the reference PCE is high and accurately known. In the present study, copper sulfate solutions were employed. Representative reference measurements are shown in Figure 3 together with the corresponding NIR absorption spectra.
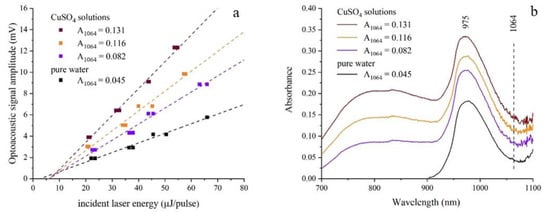
Figure 3.
(a) Optoacoustic signal amplitudes (mV) of CuSO4 solutions plotted as a function of incident laser energy (μJ/pulse). Dashed lines represent a linear fitting function of the data. According to the legend, different colors refer to samples having the extinction values at 1064 nm shown in the extinction spectra (b). In black, the data referred to pure water are also reported. The vertical dashed line in (b) corresponds to the laser excitation wavelength. The extinction band of water with a maximum at 975 nm was not subtracted from the extinction spectra shown in this figure.
The photoacoustic signals were measured with the same setup operated in the same conditions, and the measurements were separated by a delay of few minutes due to experimental reasons. Therefore, the ratio of the signals obtained from NP dispersions and reference solutions can be related to the PCE of the nanosystems. It can be expected that this efficiency is unity if two requirements are fulfilled, i.e., radiative relaxation is negligible for NPs and photochemical side reactions are absent as well [21]. In previous studies on gold NPs with various size, we could compare the wavelength dependence of the signals with the experimental extinction spectra. We could relate the observed differences with the energy loss due to light scattering, that is especially strong in sizeable NPs, e.g., in Au spheroids with a diameter > 60 nm [22]. In these systems, the experimental graphs of the kind of Figure 2a displayed significantly reduced slopes when compared to those of the calorimetric reference.
The PCE of CuS NPs could thus be evaluated by the analysis shown in Figure 4. For this purpose, the slopes of 14 fitting lines, including those shown in Figure 2a and Figure 3a, were plotted as a function of the absorption factor a. Within the experimental error, the plots of the signals of CuS NPs and those of the CuSO4 reference solutions resulted identically linear with absorption, having slopes S, respectively.
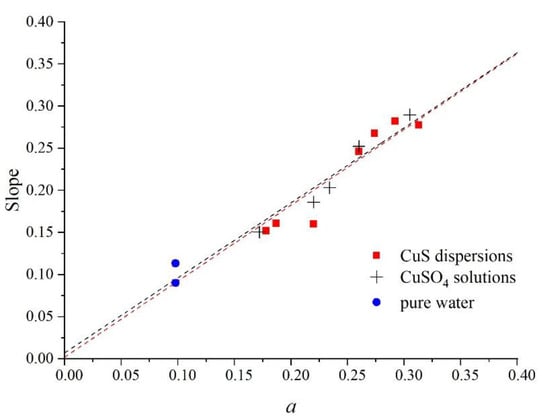
Figure 4.
Slopes derived from the graphs in Figure 2 and Figure 3, and from additional optoacoustic measurements, plotted as a function of the absorption factor a at 1064 nm (see text for details). Data for CuS dispersions are displayed as red squares. Data for reference CuSO4 solutions are plotted as crosses. Data for pure water are plotted as blue circles. Dashed lines result from the linear fitting procedure of the two sets of data, red for CuS and black for CuSO4.
Considering the ratio of these slopes and the effect of the error propagation, we can conclude that the PCE is 1.0 (±0.1) for CuS NPs. We remark that this signal analysis is normalized to the number of absorbed photons as it includes the absorption factor.
The experimental determination of this photothermal property is a valuable result. It must be reminded that the photoacoustic signal amplitude is directly linked to the relaxation pathway that follows light absorption. Therefore, PCE is expected to be unity unless radiative processes are present, namely, either photoluminescence or scattering of the excitation light. In other terms, the photoacoustic signals of the samples and those of the calorimetric reference should be superimposable in most cases. It is surprising, though, that deviations from unitary PCE are observed for many systems. Au NPs are possibly the most widely studied photothermal agents. In milestone studies, the experimental PCE was systemically lower than the theoretically predicted value [23,24,25]. Recently developed investigation methods, though, have shown that PCE can reach unity when experimental errors are accurately avoided [26]. For instance, small Au nanorods display a PCE—which the authors of Ref. [26] have designated internal heat conversion efficiency—close to 100% at 794 nm excitation wavelength. Interestingly, small-sized, citrate-capped CuS nanospheres have also shown a PCE close to unity in that research.
We propose that the present results are consistent with the previous investigations. Figure 5 presents a bar graph where the PCEs of various CuS nanosystems are contrasted. The method we present here has been previously applied to the determination of the PCE of CuS covellite nanoflakes [27]. In that case, PCE was significantly lower than unity, as it was 72% at 1064 nm excitation. We interpreted this result according to losses due to light scattering that are possibly negligible in the present case. This effect, in fact, is expected to be much larger for nanoflakes than for small-sized CuS NPs, because the size of the nanoflakes was several hundreds of nanometers. Light scattering is known to generally increase with NP size. In fact, it was reported that PCE was improved in various CuS nanosystems with reduced NP size [28,29]. On the other hand, the observed PCE values (37% [28] and 32.9% [29]) leave an open question, namely, where has the >63% complementary heat disappeared? An application of our method to the same material systems would be a useful benchmark.
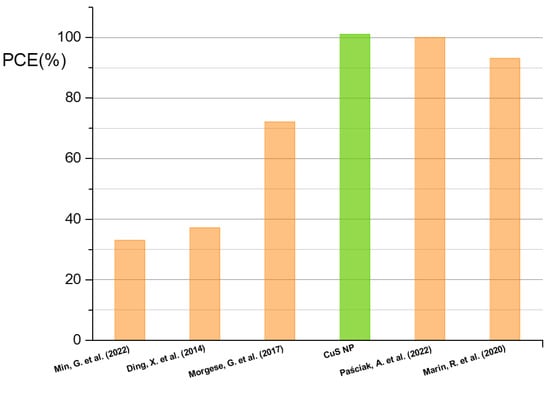
Figure 5.
Comparison among the PCE values (%) measured for different systems already reported in the literature: CuS nanorods [29], AuCu9S5 hybrid spheroids [28], CuS nanoflakes [27], CuS NPs in this work (green bar), CuS nanospheres [26], and CuS nanoplatelets [30]. All the data have been obtained exciting at 1064 nm, with exception of CuS nanospheres in Ref. [26], measured exciting at 794 nm.
In contrast, recent CuS-based materials display PCE values close to unity. In a study on dark contrast agents for optical coherence tomography, small (24 nm diameter and 4 nm height) CuS platelets displayed 93 ± 3% PCE when excited at 1064 nm [30]. The authors noticed that these contrast agents may be suitable for PAI too, as their extinction almost completely originates from light absorption. This advantage is consistent with possible applications in photothermal therapy as well.
4. Conclusions
The method presented in this communication has yielded a significant result for the investigation on the photothermal properties of innovative nanostructured materials. On the basis of a detailed analysis of the amplitude of photoacoustic signals, it is shown that small-sized copper sulfide NPs reach a PCE close to unity. This value is possibly more realistic than those previously reported in the literature about NPs made of the same material. In many studies, PCE had been obtained through the measurement of light-induced temperature changes, and its value was significantly less than unity. Interestingly, the high efficiency of small-sized copper sulfide NPs is observed by excitation with infrared light in a range where biological tissues are relatively transparent. These photothermal properties are a strong indication for possible applications of small-sized NPs as contrast agents in PAI of biological tissues and organs.
Author Contributions
Conceptualization, C.G., M.R. and A.F.; methodology, C.G., M.R. and A.F.; formal analysis, C.G., M.R. and A.F.; investigation, C.G., M.R. and A.F.; resources, C.G., M.R. and A.F.; data curation, C.G., M.R. and A.F.; writing—original draft preparation, C.G., M.R. and A.F.; writing—review and editing, C.G., M.R. and A.F.; supervision, C.G., M.R. and A.F.; project administration, C.G., M.R. and A.F.; funding acquisition, C.G., M.R. and A.F. All authors have read and agreed to the published version of the manuscript.
Funding
Funding from the University of Florence, Italy (RICATEN 2017) is acknowledged.
Institutional Review Board Statement
Not applicable.
Informed Consent Statement
Not applicable.
Data Availability Statement
Not applicable.
Conflicts of Interest
The authors declare no conflict of interest.
Abbreviations
PAI, photoacoustic imaging; PCE, photothermal conversion efficiency; NIR-I, first near-infrared window; NIR-II, second near-infrared window; NP(s), nanoparticle(s); LSPR, localized surface plasmon resonance.
References
- Weber, J.; Beard, P.C.; Bohndiek, S.E. Contrast agents for molecular photoacoustic imaging. Nat. Methods 2016, 13, 639–650. [Google Scholar] [CrossRef] [PubMed]
- Laramie, M.D.; Smith, M.K.; Marmarchi, F.; McNally, L.R.; Henary, M. Small Molecule Optoacoustic Contrast Agents: An Unexplored Avenue for Enhancing In Vivo Imaging. Molecules 2018, 23, 2766. [Google Scholar] [CrossRef] [PubMed]
- Liu, X.; Duan, Y.; Liu, B. Nanoparticles as contrast agents for photoacoustic brain imaging. Aggregate 2021, 2, 4–19. [Google Scholar] [CrossRef]
- Beard, P. Biomedical photoacoustic imaging. Interface Focus 2011, 1, 602–631. [Google Scholar] [CrossRef]
- Mantri, Y.; Jokerst, J.V. Engineering Plasmonic Nanoparticles for Enhanced Photoacoustic Imaging. ACS Nano 2020, 14, 9408–9422. [Google Scholar] [CrossRef] [PubMed]
- Steinbrueck, A.; Karges, J. Metal Complexes and Nanoparticles for Photoacoustic Imaging. Chembiochem 2023, e202300079. [Google Scholar] [CrossRef] [PubMed]
- Gellini, C.; Feis, A. Optothermal properties of plasmonic inorganic nanoparticles for photoacoustic applications. Photoacoustics 2021, 23, 100281. [Google Scholar] [CrossRef]
- Lyu, Y.; Li, J.; Pu, K. Second Near-Infrared Absorbing Agents for Photoacoustic Imaging and Photothermal Therapy. Small Methods 2019, 3, 1900553. [Google Scholar] [CrossRef]
- Skripka, A.; Mendez-Gonzalez, D.; Marin, R.; Ximendes, E.; del Rosal, B.; Jaque, D.; Rodríguez-Sevilla, P. Near infrared bioimaging and biosensing with semiconductor and rare-earth nanoparticles: Recent developments in multifunctional nanomaterials. Nanoscale Adv. 2021, 3, 6310–6329. [Google Scholar] [CrossRef]
- Li, Z.; Zhang, C.; Zhang, X.; Sui, J.; Jin, L.; Lin, L.; Fu, Q.; Lin, H.; Song, J. NIR-II Functional Materials for Photoacoustic Theranostics. Bioconjugate Chem. 2022, 33, 67–86. [Google Scholar] [CrossRef]
- Paściak, A.; Pilch-Wróbel, A.; Marciniak, Ł.; Schuck, P.J.; Bednarkiewicz, A. Standardization of Methodology of Light-to-Heat Conversion Efficiency Determination for Colloidal Nanoheaters. ACS Appl. Mater. Interfaces 2021, 13, 44556–44567. [Google Scholar] [CrossRef] [PubMed]
- Yan, T.; Su, M.; Wang, Z.; Zhang, J. Second Near-Infrared Plasmonic Nanomaterials for Photoacoustic Imaging and Photothermal Therapy. Small 2023, e2300539. [Google Scholar] [CrossRef] [PubMed]
- Jung, J.; Jang, Y.; Kim, M.; Kim, H. Types/Applications of Photoacoustic Contrast Agents: A Review. Photonics 2021, 8, 287. [Google Scholar] [CrossRef]
- Liu, Y.; Teng, L.; Yin, B.; Meng, H.; Yin, X.; Huan, S.; Song, G.; Zhang, X.-B. Chemical Design of Activatable Photoacoustic Probes for Precise Biomedical Applications. Chem. Rev. 2022, 122, 6850–6918. [Google Scholar] [CrossRef] [PubMed]
- Zeng, Y.; Dou, T.; Ma, L.; Ma, J. Biomedical Photoacoustic Imaging for Molecular Detection and Disease Diagnosis: “Always-On” and “Turn-On” Probes. Adv. Sci. 2022, 9, 2202384. [Google Scholar] [CrossRef] [PubMed]
- Zhao, Z.; Swartchick, C.B.; Chan, J. Targeted contrast agents and activatable probes for photoacoustic imaging of cancer. Chem. Soc. Rev. 2022, 51, 829–868. [Google Scholar] [CrossRef]
- Zhou, M.; Zhang, R.; Huang, M.; Lu, W.; Song, S.; Melancon, M.P.; Tian, M.; Liang, D.; Li, C. A Chelator-Free Multifunctional [64Cu]CuS Nanoparticle Platform for Simultaneous Micro-PET/CT Imaging and Photothermal Ablation Therapy. J. Am. Chem. Soc. 2010, 132, 15351–15358. [Google Scholar] [CrossRef]
- Comin, A.; Manna, L. New materials for tunable plasmonic colloidal nanocrystals. Chem. Soc. Rev. 2014, 43, 3957–3975. [Google Scholar] [CrossRef]
- Huang, X.; Neretina, S.; El-Sayed, M.A. Gold Nanorods: From Synthesis and Properties to Biological and Biomedical Applications. Adv. Mater. 2009, 21, 4880–4910. [Google Scholar] [CrossRef]
- Braslavsky, S.E.; Heibel, G.E. Time-resolved photothermal and photoacoustic methods applied to photoinduced processes in solution. Chem. Rev. 1992, 92, 1381–1410. [Google Scholar] [CrossRef]
- Marin, R.; Skripka, A.; Besteiro, L.V.; Benayas, A.; Wang, Z.; Govorov, A.O.; Canton, P.; Vetrone, F. Highly Efficient Copper Sulfide-Based Near-Infrared Photothermal Agents: Exploring the Limits of Macroscopic Heat Conversion. Small 2018, 14, e1803282. [Google Scholar] [CrossRef] [PubMed]
- Feis, A.; Gellini, C.; Salvi, P.R.; Becucci, M. Photoacoustic excitation profiles of gold nanoparticles. Photoacoustics 2014, 2, 47–53. [Google Scholar] [CrossRef] [PubMed]
- Roper, D.K.; Ahn, W.; Hoepfner, M. Microscale Heat Transfer Transduced by Surface Plasmon Resonant Gold Nanoparticles. J. Phys. Chem. C 2007, 111, 3636–3641. [Google Scholar] [CrossRef]
- Cole, J.R.; Mirin, N.A.; Knight, M.W.; Goodrich, G.P.; Halas, N.J. Photothermal Efficiencies of Nanoshells and Nanorods for Clinical Therapeutic Applications. J. Phys. Chem. C 2009, 113, 12090–12094. [Google Scholar] [CrossRef]
- Jiang, K.; Smith, D.A.; Pinchuk, A. Size-Dependent Photothermal Conversion Efficiencies of Plasmonically Heated Gold Nanoparticles. J. Phys. Chem. C 2013, 117, 27073–27080. [Google Scholar] [CrossRef]
- Paściak, A.; Marin, R.; Abiven, L.; Pilch-Wróbel, A.; Misiak, M.; Xu, W.; Prorok, K.; Bezkrovnyi, O.; Marciniak, Ł.; Chanéac, C.; et al. Quantitative Comparison of the Light-to-Heat Conversion Efficiency in Nanomaterials Suitable for Photothermal Therapy. ACS Appl. Mater. Interfaces 2022, 14, 33555–33566. [Google Scholar] [CrossRef] [PubMed]
- Morgese, G.; Dolcet, P.; Feis, A.; Gellini, C.; Gialanella, S.; Speghini, A.; Badocco, D.; Pastore, P.; Casarin, M.; Gross, S. Room-Temperature Crystallization of CuS Nanostructures for Photothermal Applications through a Nanoreactor Approach. Eur. J. Inorg. Chem. 2017, 2017, 2745–2754. [Google Scholar] [CrossRef]
- Ding, X.; Liow, C.H.; Zhang, M.; Huang, R.; Li, C.; Shen, H.; Liu, M.; Zou, Y.; Gao, N.; Zhang, Z.; et al. Surface Plasmon Resonance Enhanced Light Absorption and Photothermal Therapy in the Second Near-Infrared Window. J. Am. Chem. Soc. 2014, 136, 15684–15693. [Google Scholar] [CrossRef]
- Min, G.; Hong, F.; Shi, C.; Zhao, Q.; Lin, N.; Liu, X.-Y. Biomimetic synthesis of 2D ultra-small copper sulfide nanoflakes based on reconfiguration of the keratin secondary structure for cancer theranostics in the NIR-II region. J. Mater. Chem. B 2022, 10, 3152–3161. [Google Scholar] [CrossRef]
- Marin, R.; Lifante, J.; Besteiro, L.V.; Wang, Z.; Govorov, A.O.; Rivero, F.; Alfonso, F.; Sanz-Rodríguez, F.; Jaque, D. Plasmonic Copper Sulfide Nanoparticles Enable Dark Contrast in Optical Coherence Tomography. Adv. Healthc. Mater. 2020, 9, e1901627. [Google Scholar] [CrossRef]
Disclaimer/Publisher’s Note: The statements, opinions and data contained in all publications are solely those of the individual author(s) and contributor(s) and not of MDPI and/or the editor(s). MDPI and/or the editor(s) disclaim responsibility for any injury to people or property resulting from any ideas, methods, instructions or products referred to in the content. |
© 2023 by the authors. Licensee MDPI, Basel, Switzerland. This article is an open access article distributed under the terms and conditions of the Creative Commons Attribution (CC BY) license (https://creativecommons.org/licenses/by/4.0/).