Abstract
Photoacoustic imaging is a promising medical imaging modality that enables the visualization of molecular functional and morphological information of biological tissues. Its clinical potential has been widely investigated for assessing and diagnosing various diseases. Currently, several research groups are developing photoacoustic imaging systems for translation from the laboratory to the clinic. In particular, the integration of photoacoustic imaging into existing diagnostic ultrasound applications, such as cancer diagnosis, has shown promising results. Additionally, recent research has explored the application of photoacoustic imaging for novel clinical uses. In this review paper, recent trials of photoacoustic imaging in both conventional and novel clinical applications are summarized and evaluated. Additionally, current limitations and future directions of photoacoustic imaging for successful translation into the clinical world are discussed. The aim of this review is to provide a comprehensive overview of the recent advancements in photoacoustic imaging and highlight its potential for clinical diagnosis and treatment. It is hoped that this review will contribute to the development of improved diagnostic and therapeutic approaches for a wide range of diseases using photoacoustic imaging.
1. Introduction
Visualization of biological tissue is a critical tool for diagnosing diseases, particularly for the early detection of cancer [1,2]. Imaging techniques including magnetic resonance imaging (MRI) [3,4,5], positron emission tomography (PET) [6,7,8], and X-ray computed tomography (CT) [9,10] have been extensively used in clinics for the characterization, assessment, and monitoring of tumor pathologies. However, these imaging techniques have some drawbacks, such as high costs, slow imaging speed, immobility, or potential side effects from ionizing radiation.
For routine screening, ultrasound imaging (USI) has been widely used due to its safety, mobility, and ease of use [11,12,13]. USI provides excellent morphological information on biological tissues, allowing for the identification of tumor masses and their spatial relationships with surrounding tissues. However, the lack of molecular functional information in USI can degrade diagnostic performance, limiting its accuracy in detecting small or early stage tumors.
Photoacoustic imaging (PAI) is an emerging medical imaging technique that integrates the principles of USI and optical imaging techniques. Instead of ultrasound (US) transmission in USI, PAI illuminates biological tissue with a short-pulsed laser (typically a few nanoseconds), which is absorbed by optically absorbing chromophores in the tissue. This absorbed light energy is converted into heat energy, which generates acoustic waves through thermoelastic expansion [14]. These acoustic waves are called photoacoustic (PA) waves, which can be captured by conventional US transducers and imaged using the US image generation procedure.
The core advantage of PAI is the visualization of optical absorption properties of biological tissue with a spatiotemporal resolution of USI [15]. PAI can provide strong optical contrast with both endogenous (e.g., oxyhemoglobin, deoxyhemoglobin, melanin, and lipid) [16,17,18,19] and exogenous [20,21,22,23,24] chromophores. From a clinical perspective, PAI can complement conventional USI with its unique advantages. Firstly, PAI and USI can be implemented in a single imaging platform, reducing the need for multiple imaging modalities [25,26,27,28,29,30]. Secondly, the resolution and imaging depth can be adjusted according to the target tissues [31,32,33,34,35,36]. Lastly, various geometries of imaging probes are applicable for optimized data acquisition, enabling the customization of imaging systems for specific clinical applications [37,38,39,40].
Recently, PAI techniques have been improved with advanced light sources [41,42] and novel image reconstruction algorithms [43,44,45]. Many research groups are translating their PAI systems from the laboratory bench to the clinical bedside [46]. The main purpose of PAI is to provide complementary molecular functional information of the region, augmenting the morphological information from USI. By adding PAI to existing USI, diseased tissues can be accurately delineated before biopsy or surgical operation, improving diagnostic accuracy. In addition, multispectral PA responses would be more helpful to diagnose or classify diseased tissues in vivo. Furthermore, recent research has investigated the potential application of photoacoustic imaging in novel clinical uses that have not yet been explored with USI.
In this review, we provide an overview of the clinical trials of PAI systems focusing on the potential of photoacoustic imaging for clinical diagnosis and treatment. Particularly, we aimed to review PAI studies for clinical application in terms of two aspects: (1) PAI studies improving the conventional USI-based diagnosis; and (2) PAI studies introducing unconventional clinically viable information. The former refers to clinical applications where PAI could be added to an existing USI procedure in the current diagnostic protocol, and thus more likely to be clinically approved in the future. The latter proposes new forms of diagnosis, which may not fit in the current protocol but provided promising findings that encourage the development of new clinical workflow. We highlight the integration of PAI into existing diagnostic USI applications and the exploration of novel clinical uses. The systemic configurations are also overviewed according to the geometric structures of US transducers, which determine the imaging region and applicable area. The goals of this review are to survey the recent advances of PAI toward clinical translation, discuss the current limitations, and present the future direction of research for successful clinical translation.
2. Imaging Probes for Photoacoustic Imaging
Various types of probes have been used in PAI to provide functional information in addition to structural information obtained from conventional USI (Table 1). Linear array transducers (LATs) are widely used in clinical studies due to their cost-efficiency and simplicity of implementation [47,48,49]. The piezoelectric elements in the LATs are aligned in a row, resulting in a rectangular field of view (FOV) in the cross-sectional plane. LATs offer an excellent near-field resolution, which is advantageous for PAI, as the target depth in PAI is usually shallow compared to USI. Since LATs have been used in the initial trials of clinical PAI systems, there have been numerous preliminary studies for evaluating imaging performance in both preclinical and clinical applications [50,51,52]. However, LATs have a finite aperture, which limits the signal acceptance angle, leading to radial artifacts [53].

Table 1.
Typical performance of PAI probes with respect to the types of transducers. LAT, linear array transducer; TRT, transrectal transducer; CAT, curved array transducer; HAT, hemispherical array transducer; 2D, two-dimensional; 3D, three-dimensional; PA, photoacoustic; US, ultrasound; FOV, field of view; PAI, photoacoustic imaging; USI, ultrasound imaging.
For dedicated usage for transrectal USI, transrectal transducers (TRTs) have been designed to be inserted through the rectum and to provide wide radial FOV at the same time. TRTs are basically convex array transducers where the US transducer elements are facing away from the center of the arc, which is beneficial for wide FOV with the small footprint of the transducer. For PAI, however, the signal acceptance angle is even more limited compared to LATs because the convex geometry allows only a small portion of transducer elements to receive PA signals at effective reception angles.
To overcome the limited view of LAT and TRT, curved array transducers have been widely used in both preclinical and clinical studies [54,55,56,57,58,59]. Curved array transducers (CATs) with arc or ring shapes can cover a wider angle of view compared to LATs, producing high-quality tomographic images of biological tissues in vivo. However, from the perspective of human imaging, CAT-based PAI systems need to overcome their relatively small FOV which may limit the versatility of the system. Currently, CATs have mainly been applied in breast imaging [60].
To achieve high-quality three-dimensional (3D) images, hemispherical array transducers (HATs) have also been utilized for biological imaging [61,62,63,64]. HATs typically consist of 128–512 elements at wide detecting angles, enabling the acquisition of volumetric images without the need for scanning the transducer. However, the acquisition and processing of large volumetric data require a specialized data acquisition system and processing device, which are typically expensive. Currently, emerging research using HATs has focused on diagnosing breast and skin conditions as well as detecting tumors.
3. Photoacoustic Imaging Amended to Conventional Diagnostic Procedures
3.1. Thyroid Imaging
The thyroid has been widely studied using PAI [65]. The current standard diagnostic method for thyroid nodules is USI-based risk stratification, which relies solely on the shape of the nodules. However, this approach often leads to overdiagnosis of benign cases and unnecessary biopsies, resulting in low specificity [66,67]. To address this limitation, researchers have turned to PAI to provide additional pathological and metabolomic information. The results of recent studies using PAI-aided analysis techniques have demonstrated its potential to complement the existing USI-based risk stratification and improve the diagnostic accuracy of thyroid nodules.
Roll et al. conducted a clinical study to evaluate the potential of multispectral PAI in distinguishing benign and malignant nodules in the thyroid gland [68]. They employed a dual-modal PA and US imaging (PAUSI) system equipped with a tunable pulsed laser with a PRF of 25 Hz and a fluence of 20 mJ/cm2. A 256-element CAT with a center frequency of 3 MHz and a coverage angle of 125° provided cross-sectional images with a field of view of 40 × 40 mm2 (Figure 1a). Multispectral PA images were acquired from six Graves’ disease lobes, eight healthy lobes, thirteen benign nodules, and three malignant nodules using eight wavelengths (700, 730, 760, 800, 850, 900, 920, and 950 nm). The results indicated that Graves’ disease lobes exhibited higher deoxygenated hemoglobin (p = 0.0055) and total hemoglobin concentration (p = 0.0084), and lower lipid content (p = 0.0293). The multispectral PA response also demonstrated lower sO2 levels (p = 0.0393) and fat content (p = 0.1295) in malignant nodules compared to benign nodules. Although the study population was limited, the findings demonstrated the potential of multispectral PAI for identifying thyroid diseases.
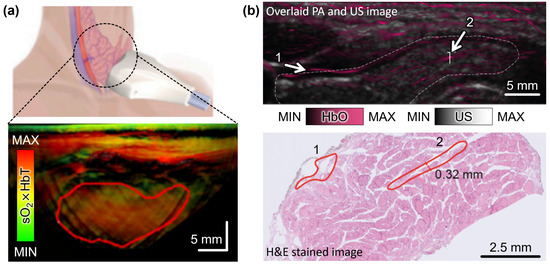
Figure 1.
Multispectral PA analysis of thyroid nodules in vivo. (a) Schematic illustration and the resulting multispectral PA images in thyroid region. The pseudo color represents the sO2 level weighted with the signal of HbT. The red solid boundary indicates the nodule area. (b) Overlaid unmixed PA and US image and the corresponding H&E-stained histopathological image in thyroid region. Numbers indicate blood vessels. The white dashed boundary indicates the thyroid lobe. PA, photoacoustic; US, ultrasound; HbT, total hemoglobin; HbO, oxygenated hemoglobin; HbT, total hemoglobin; sO2, hemoglobin oxygen saturation; H&E, hematoxylin and eosin. The images are reproduced with permission from [68,69].
Noltes et al. demonstrated the characterization of malignant nodules using spectrally unmixed PA images with high spatial resolution and spectral contrast [69]. They analyzed data from 27 nodules obtained from 17 patients, including 11 malignant and 16 benign nodules, with final histopathology. Multispectral PA responses from 14 optical wavelengths (680, 700, 730, 760, 800, 850, 900, 930, 970, 1000, 1030, 1064, 1100, and 1195 nm) were analyzed to identify patterns for malignancy stratification, particularly vascular patterns in the thyroid region. The resulting images resolved blood vessels with a diameter of approximately 250 μm at a depth of 2 cm. The findings showed a matched (R2-value of 0.9426) intramodular microvascularity and extrathyroidal extension between the unmixed PA images and histopathological images (Figure 1b).
Kim et al. presented a novel approach to improve the diagnostic accuracy of thyroid nodules by combining multispectral PAI analysis with conventional US stratification [70]. They utilized a PAUSI system with a 128-element LAT and a laser source to collect data from 23 malignant and 29 benign patients. Multispectral PA images were obtained from five wavelengths (700, 756, 796, 866, and 900 nm), and three parameters (sO2 level, spectral gradient of the PA signal, and skewness of the sO2 distribution) were defined from the multispectral data to determine a machine learning trained decision boundary, which provided a probability of malignancy. By combining this machine learning score with the conventional American Thyroid Association (ATA) Guidelines, they demonstrated a new risk stratification metric, named ATAP (ATA Guidelines with PA-indicated-probability of PTC) score. The ATAP score distinguished malignant from benign nodules with a sensitivity of 83% and a specificity of 93%, addressing the low specificity of the conventional ATA guideline score.
3.2. Breast Imaging
Breast USI has been used as a diagnostic tool to complement X-ray mammography by observing abnormalities in the breast such as lumps, cysts, or tumors. It is particularly useful for women who should not be exposed to X-rays or for women with dense breasts [71]. LATs are typically used for diagnosing breast cancer with handheld scanning. However, the diagnostic accuracy of handheld US scans depends on the proficiency of the operator. To address this limitation, the automated breast ultrasound system (ABUS) provides motorized scanning of a large-aperture LAT (~768 elements) to obtain 3D US images of the entire breast with consistent image quality, which enables the detection of suspicious masses. Although US Doppler can also provide blood flow information near breast masses, breast USI suffers from low specificity and requires other imaging modalities to effectively characterize the distinct features of benign or malignant tumors. PAI is an attractive technique for imaging breast cancer, as it is compatible with USI and allows multispectral measurement of hemoglobin oxygen saturation (sO2).
In a study by Wang et al., a fast and miniaturized system was developed to achieve deep tissue imaging of human breasts [72]. The system utilized a compact laser with a fixed wavelength of 1064 nm and a tunable pulse repetition rate (PRF) of up to 50 Hz to observe the distribution of blood vessels in human breasts (Figure 2a). The imaging probe consisted of a 128-element LAT operating at a center frequency of 5 MHz and a bifurcated fiber bundle. By scanning the probe in the elevational direction, 3D data were acquired from stacks of cross-sectional B-mode data, and landscape images were reconstructed using maximum amplitude projection (MAP) (Figure 2b). The total imaging time for one breast was 75 s with a scanning range of 75 mm. Nyayapathi et al. further developed the system by equipping it with two 128-element LATs with a center frequency of 2.25 MHz [73]. A translational scan was performed to achieve mammography-like images with the two LATs sandwiching the breast from both sides. The resulting images successfully identified blood vessels and their depth from the surface. The total scanning time for the whole breast was 80 s, making it feasible for clinical application. The same research group obtained PA images from 38 patients with breast tumors and found higher vascular activity in tumor-bearing breasts compared to healthy breasts [74]. These studies demonstrate the potential of PAI for breast imaging, as it allows for non-invasive and non-ionizing imaging of deep tissue structures. The development of compact and miniaturized systems with improved imaging speed and quality provides promising opportunities for the early detection and diagnosis of breast cancer.
Diot et al. conducted a study on multispectral analysis of breast tissues using a CAT [75] and designed a hand-held PAI probe by integrating a 256-element CAT with a laser-delivering fiber bundle (Figure 2c). The CAT consisted of piezoelectric elements with a center frequency of 5 MHz, arranged in an arc surface with an entire angle of 174° and a diameter of 120 mm. The system was equipped with a 256-channel data acquisition module, facilitating fast data acquisition and real-time image generation at a remarkable rate of 50 fps. For their investigation, ten patients with malignant breast masses and three healthy volunteers were recruited and imaged using multispectral illumination at wavelengths ranging from 700 to 970 nm. By applying the linear spectral unmixing technique, the study explored the components of oxyhemoglobin, deoxyhemoglobin, total blood volume, lipid, and water. The results revealed remarkable differences in the total blood volume and the ratio of oxyhemoglobin to deoxyhemoglobin between cancerous and control tissues, indicating the diagnostic potential of this technique. In a subsequent study, Kukacka et al. demonstrated the visualization of overlaid PA and US images of breast lesions in vivo [76]. They simultaneously achieved multispectral PA images and corresponding US images from sixteen malignant and six benign patients (Figure 2d). The spectrally unmixed image showed the diagnostic potential of this technique in assessing vasculature abnormalities, hypoxia, and inflammation around the nodules in vivo (Figure 2e).
Neuschler et al. conducted a multi-site study with 2105 patients to test the diagnostic utility of multispectral PAI for breast cancer diagnosis [77]. They used a 128-element LAT with a center frequency of 10 MHz and two laser wavelengths (757 and 1064 nm) to assess the sO2 in the breasts. The spectrally unmixed PA images were overlaid on the corresponding US B-mode images, and five features in PA images were defined to score the malignancy of breast masses. These PA features were subsequently incorporated into the conventional Breast Imaging Reporting and Data System (BI-RADS) categories, which provide a risk stratification score ranging from 1 (negative) to 5 (highly suspicious for malignancy). The results showed that multispectral PA analysis has the potential to enhance diagnostic specificity when combined with conventional ultrasound B-mode images. Menezes et al. also demonstrated the feasibility of multispectral PA analysis in a similar study utilizing the same device [78]. By combining the PA scoring method with the BI-RADS score, the researchers successfully downgraded the scores of incorrectly diagnosed benign nodules with initial scores of 4 (suspicious for malignant) to 3 (probably benign) or 2 (negative but with benign findings). These studies highlight the potential of multispectral PAI as a complementary diagnostic tool to existing ultrasound stratification methods, ultimately improving the specificity of breast cancer diagnosis.

Figure 2.
PA images acquired from human breasts in vivo. (a) Schematic illustration of the configuration of PA imaging system for breast imaging. (b) A depth-encoded PA MAP image of the breast from a healthy volunteer. (c) Schematic illustration of the dual-modal PA and US image acquisition from breast cancer patients. (d) Overlaid PA and US image around the breast mass in a malignant patient. (e) Spectrally unmixed image by applying a linear unmixing technique. PA, photoacoustic; US, ultrasound; LAT, linear array transducer; CAT, curved array transducer; DAQ, data acquisition module; MAP, maximum intensity projection; HbO, oxyhemoglobin; HbR, deoxyhemoglobin. The images are reproduced with permission from [72,76].
3.3. Transrectal Imaging
Transrectal USI is a widely used technique for assessing the structural features of prostate glands, including the identification of abnormal nodules and guiding needle biopsy. In recent years, PAI has emerged as a promising tool for providing functional information on suspicious regions. However, transrectal USI presents a unique challenge due to the use of a narrow transrectal US transducer (TRT) that must fit within the colorectal region. This constraint imposes limitations on the size of the optical delivery component. Moreover, the convex shape of the TRT, in which elements are aligned on the surface, presents further challenges to the reception of PA signals due to the limited aperture. Therefore, an exploration of prostate research that addresses these challenges and examines the significance of PA indices under harsh PA signal reception conditions is of interest.
Horiguchi et al. conducted a pilot study to explore the potential of transrectal PAUSI in visualizing microvasculature in periprostatic tissues from seven prostate cancer patients [79]. The study aimed to detect the location and extent of neurovascular bundles (NVBs) in prostate cancer patients. The PAUSI system utilized a 128-element TRT with a center frequency of 6.5 MHz, offering a detectable FOV of 170° (Figure 3a). The illumination system delivered a pulsed laser with a wavelength of 756 nm, a PRF of 10 Hz, and a fluence of 11 mJ/cm2, utilizing two convex apertures (2.5 mm × 180° each) positioned beside the TRT. The transrectal part of the imaging probe had a thickness of ~26 mm, allowing for effective transrectal imaging. During radical prostatectomies, PA and US images of the periprostatic tissues were acquired (Figure 3b). The results demonstrated the ability to identify the location of periprostatic NVBs, suggesting the feasibility of incorporating this technique in nerve-sparing radical prostatectomy procedures. In a follow-up study, they modified the probe to be smaller and lighter to facilitate transrectal delivery [80]. Microvascular density (MVD), total vessel area (TVA), and total vessel length (TVL) were investigated from PA images acquired from three prostate cancer patients. The result showed higher TVA and TVL in the peripheral region compared to the inside of the tumors. By comparing with the histopathological results, PAI can potentially reflect the microvascularity, suggesting a novel modality for imaging prostate cancer angiogenesis.
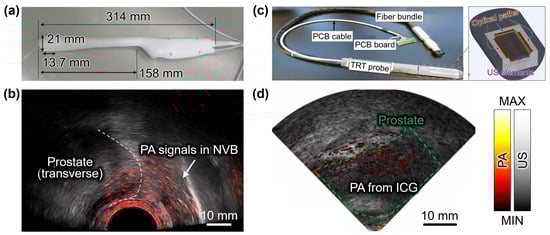
Figure 3.
Dual modal PA and US imaging of NVBs in prostatic tissues from prostate cancer patients. (a) Photograph of the TRT imaging probe. (b) Overlaid PA and US images of the prostatic region. White dashed line indicates the boundary of the prostate. (c) Photograph and schematic configuration of the TRT imaging probe. (d) Overlaid PA and US images of the prostatic region after intravenous administration of ICG. PA, photoacoustic; US, ultrasound; NVB, neurovascular bundles; TRT, transrectal ultrasound transducer; PCB, printed circuit board; ICG, indocyanine green. The images are reproduced with permission from [79,81].
In a recent study by Kothapalli et al., a clinical transrectal PAUSI technique was employed to image prostate cancer patients using a miniaturized 64-element capacitive micromachined TRT with a center frequency of 5 MHz [81]. For intrarectal irradiation, a tunable pulsed laser with a PRF of 10 Hz, emitting wavelengths ranging from 680 to 950 nm, and a fluence of 10 mJ/cm2, was coupled to three fiber optic paths (Figure 3c). The imaging probe had a thickness of approximately 23 mm. Among the 20 patients who participated in the clinical trial, 10 patients received intravenous administration at a concentration of 2.5 mg/mL. The use of ICG enabled the acquisition of high-contrast and high-resolution PA images through transrectal PAI (Figure 3d), facilitating the visualization of prostate vascularity and surrounding tissues. The results demonstrated the potential of this approach in differentiating prostate cancers, reducing the need for random biopsies through targeted biopsies, and aiding in the selection of suitable treatment options.
3.4. Cervical Vasculature Imaging
PAI has been also applied in the imaging of human carotid arteries, offering insights into potential disorders within these blood vessels by integrating with the conventional USI. Ivankovic et al. demonstrated a 3D multispectral PAI system for monitoring the bifurcation area of the human carotid artery, particularly in relation to ischemic stroke (Figure 4a) [82]. Their system utilized a hand-held HAT array capable of capturing 10 multispectral data points per second. A higher contrast-to-noise ratio was observed with wavelengths in the range of 800–900 nm (18.8 ± 4.28 dB) compared to shorter wavelengths of 730–760 nm (9.18 ± 3.8 dB), indicating that the carotid artery is a highly oxygenated vessel. Karlas et al. acquired multispectral PA images of the human neck area from five atherosclerosis patients, with the goal of comparing the levels of lipid and hemoglobin in healthy volunteers (Figure 4b) [83]. They used 28 wavelengths ranging from 700 to 970 nm with a 10 nm step, enabling the generation of a multispectral stack of PA images (Figure 4c). They also acquired US images co-registered to each PA image, and then manually segmented the regions of arterial cross-section, plaque, and lumen. Using spectral unmixing techniques, lipid and hemoglobin concentrations within the carotid artery were determined. The results demonstrated distinguishable differences in the fat–blood ratio between atherosclerosis patients and healthy volunteers, illustrating the feasibility of molecular imaging for human carotid atherosclerosis and the potential clinical assessment of carotid plaques. These studies showcase the valuable role of PAI in investigating carotid artery pathologies and highlight its potential for non-invasive assessment of vascular disorders.
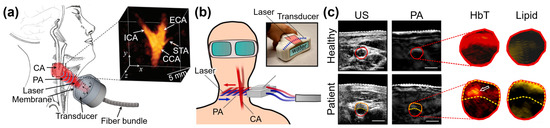
Figure 4.
Photoacoustic imaging techniques for investigating cervical vasculature. (a) Schematic illustration for multispectral PA imaging of human CA bifurcation. (b) Schematic illustration for multispectral PA imaging from atherosclerosis patients. (c) US and multispectral PA images acquired from the neck area. Inset images are unmixed distributions in the cross-sectional area of the CA. PA, photoacoustic; US, ultrasound; ADP, dorsalis pedis artery; CA, carotid artery; ICA, internal carotid artery; ECA, external carotid artery; CCA, common carotid artery; STA, superior thyroid artery; HbT, total hemoglobin. The images were reproduced with permission from [82,83].
4. Photoacoustic Imaging as Novel Diagnostic Methods
4.1. Peripheral Vasculature Imaging
Vascular imaging has prominent applications of PAI in biomedical studies. Several research groups have achieved PA images for the evaluation of vascular function, especially peripheral vasculature assessment. Yang et al. demonstrated a vascular dysfunction monitoring PAI system for diabetic patients, employing a 128-element CAT array and a tunable pulsed laser with a repetition rate of 20 Hz (Figure 5a) [84]. Multispectral PA images of the dorsalis pedis artery and arterioles in the distal hallux region were acquired from seven diabetic patients and seven healthy volunteers, while a pressure cuff was applied to induce venous and arterial occlusions alternately (Figure 5b). The recorded PA signals indirectly reflected changes in blood volume (Figure 5c). Arterial occlusion led to a decrease in PA signals due to reduced blood volume resulting from arterial compression. Upon release of the pressure, the PA signal gradually recovered, with distinguishable differences in recovery time observed between the diabetic and normal groups. A noticeable time delay was observed in the arteries of the diabetic group (healthy: 14.66 ± 1.10 s, diabetic: 24.05 ± 5.36 s). In addition, a lower variation in PA signal was observed in the veins (healthy: 5.63 ± 0.024%, diabetic: 3.38 ± 0.331%), indicating decreased blood perfusion in the feet. These findings highlighted distinct vascular responses in the diabetic group compared to the healthy controls under occlusion. In a recent study, Choi et al. conducted in vivo morphological and physiological analyses of healthy human feet using 3D PAUS images [85]. To enhance the reliability of PAI, they implemented adaptive contour scanning of a 128-element LAT, tracking the curvature of the dorsal surface of the foot (Figure 5d). Several image processing techniques were applied to achieve comprehensive multi-structural visualization of the entire foot, including the skin, bone, and vasculature (Figure 5e). Quantitative analysis of parameters such as total hemoglobin concentration, vessel density, sO2, and vessel depth, obtained from five independent acquisitions of ten healthy volunteers, further evaluated the reliability of the system. The resulting images showed the potential of this technique to quantify the blood vessel activities and valuable insights into both morphological vessel networks and physiological sO2 distribution.
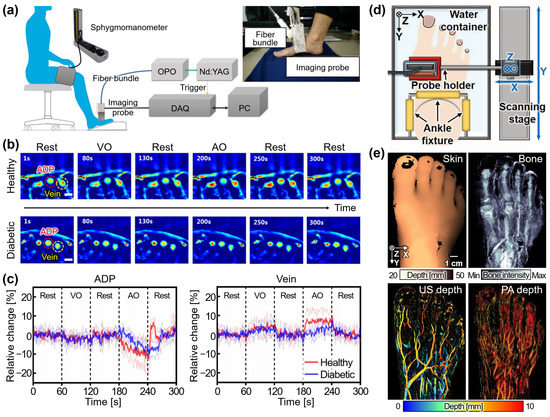
Figure 5.
Photoacoustic imaging techniques for investigating peripheral vasculature. (a) Schematic illustration of the PA imaging system with a pressure cuff. The inset shows the photograph of the imaging probe. (b) Series of PA images acquired from a healthy volunteer and a diabetic patient under cuff pressure. (c) Relative changes in PA signals under pressure. (d) Schematic illustration of the volumetric PA imaging system with adaptive scanning. (e) The multi-structural visualizations of a healthy foot in vivo. PA, photoacoustic; OPO, optical parametric oscillator; DAQ, data acquisition module; PC, personal computer; VO, venous occlusion; AO, arterial occlusion. The images were reproduced with permissions from [84,85].
4.2. Volumetric Vasculature Imaging in Breast
Volumetric vasculature imaging in the breast has emerged as an innovative diagnostic procedure enabled by 3D PA images using HATs. This technique offers the visualization and assessment of blood vessels within breast tissue, presenting valuable insights for the detection and characterization of breast lesions. This chapter will explore the applications of volumetric vasculature imaging in the breast using PAI, highlighting its potential impact on breast cancer diagnosis and management.
Kruger et al. conducted a notable study demonstrating human breast imaging using a 128-element HAT with a center frequency of 5 MHz [86]. The piezo elements were arranged in a spiral distribution on the probe’s hemispherical surface, which had a radius of 100 mm (Figure 6a). PA images were acquired from a healthy volunteer by illuminating a 20 mJ pulsed laser at a wavelength of 800 nm. The total data acquisition time amounted to 24 s, encompassing a FOV of 64 × 50 mm2. The resulting images visualized 3D vascular networks up to a depth of 40 mm (Figure 6b). To achieve enhanced tissue penetration and improved contrast sensitivity, the system was further modified with a 512-element, 2 MHz center frequency HAT (Figure 6c) [87]. The transducer was mounted on a two-axis translational stage to enable spiral scanning, thereby achieving a larger FOV in the form of a circular region with a radius of 96 mm. Volumetric breast data were collected from four healthy female volunteers (Figure 6d), revealing clear images of the breast vasculature with the potential to provide complementary information when integrated with conventional X-ray mammography.
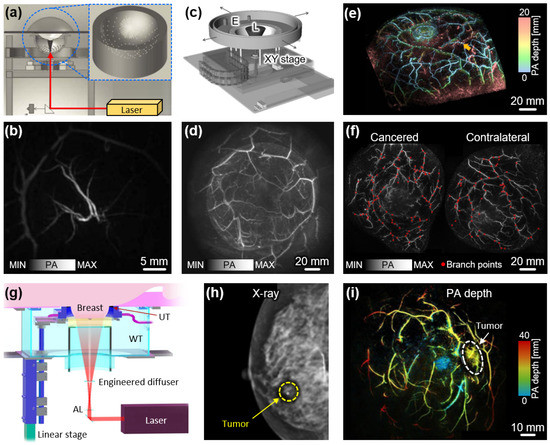
Figure 6.
Volumetric PA images of human breasts. (a) Schematic illustration of HAT-based PA imaging system. (b) Volumetric PA image of the breast from a healthy volunteer. (c) Schematic illustration of the updated PA imaging system equipped with a 512-element HAT. (d) Volumetric PA image of a healthy breast with a larger FOV. (e) Volumetric PA images of the breast with the pseudo color of depth from the surface. (f) PA images of cancerous and contralateral breasts with branch points in blood vessels. (g) Schematic illustration of volumetric PA imaging system using a 512-element ring-shaped array transducer. (h) X-ray mammogram of the breast from a breast cancer patient. (i) Volumetric PA images of the cancerous breast with the pseudo color of depth from the nipple. PA, photoacoustic; HAT, hemispherical array transducer; L, laser; E, extension of holder; AL, axicon lens; WT, water tank; UT, ultrasound transducer. The images are reproduced with permission from [86,87,88,89,90].
Toi et al. also developed and demonstrated a volumetric PAI system for breast imaging [88]. Their system employed a 512-element HAT operating at a center frequency of 2 MHz, which was moved along the spherical scanning trajectory to acquire volumetric data. Notably, the inner side of the spiral scan had a higher data collection density, resulting in improved image quality at the center of the breast. Multispectral PA data from 22 malignant breast lesions were acquired using a Q-switched Alexandrite laser with wavelengths of 755 nm and 795 nm (Figure 6e). The resulting images revealed distinctive morphological changes within the malignant vascular areas. Specifically, features such as centripetal blood vessel structure, vessel disruption, and rapid narrowing were detected in invasive breast carcinoma. In a related study, Yamaga et al. utilized the same system to investigate tumor characteristics by quantifying vessel branching points (VBP) in breast cancer patients [89]. The results demonstrated that the mean VBP level, up to a depth of 7 mm below the skin surface, was significantly higher in the cancerous breast compared to the contralateral breast (Figure 6f). Furthermore, this system exhibited the capability to provide functional sO2 maps with three-dimensional visualization in other body regions, highlighting its potential for clinical research applications [64].
Tumor detection in the breast has often been hindered by respiratory distortion resulting from lengthy scanning times. To address this challenge, Lin et al. developed a fast PAI system capable of capturing whole breast images within a single breath-hold [90]. Their approach involved the translational scanning of a 512-element ring-shaped array transducer with a center frequency of 2.25 MHz, enabling rapid scanning in less than 15 s (Figure 6g). For PA generation, a laser beam with a wavelength of 1064 nm and a fluence of approximately 20 mJ/cm2 was directed towards the breast. To achieve a uniform light distribution, the beam passed through an axicon lens and an engineered diffuser, which transformed it into a donut shape. Notably, the system utilized four 128-channel data acquisition modules to facilitate high-speed data acquisition by maintaining a one-to-one mapping between the transducer elements and the data acquisition channels. Analysis of the PA images obtained from the breasts of seven breast cancer patients revealed higher blood vessel densities associated with tumor regions. Especially, in patients with dense breast tissue, where conventional X-ray mammography often faces limitations (Figure 6h), PAI exhibited great potential for sensitively diagnosing malignant regions (Figure 6i). These findings highlight the promising role of PAI in improving breast cancer detection, particularly in cases involving dense breast tissue.
4.3. Non-Invasive Staging of Melanoma
In recent years, PAI has been explored for the non-invasive staging of melanoma, offering a range of capabilities such as visualization of melanoma lesions, precise depth measurement, and accurate boundary delineation. Kim et al. conducted a study demonstrating the feasibility of PAI with a 128-element LAT in distinguishing melanoma from normal tissue using an excised tissue specimen [91]. They further advanced the application of PAI by developing a handheld scanner for in vivo melanoma depth measurement (Figure 7a) [92,93]. Through a series of in vivo experiments involving six patients, the researchers collected multispectral PA and ultrasound data to evaluate the depth-measuring capabilities of PAI. The resulting spectrally unmixed PA images exhibited remarkable accuracy in depicting melanoma contours by visualizing the concentration of melanin (Figure 7b). Furthermore, the PA images effectively measured the depth of melanoma, demonstrating a mean absolute error of 0.36 mm when compared to histopathological results. Chuah et al. reported another noteworthy study using a handheld HAT [94]. From the multispectral PA data, subcutaneous chromophores including melanin, oxyhemoglobin, and deoxyhemoglobin were mapped (Figure 7c). These studies highlight the significant advancements in the non-invasive staging of melanoma enabled by PAI. The accurate delineation of melanoma boundaries holds tremendous potential for enhancing the diagnosis and treatment of this complex and challenging form of skin cancer.
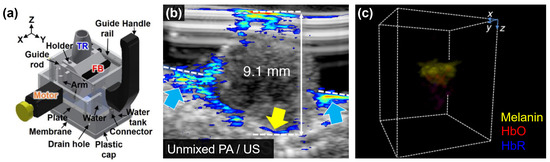
Figure 7.
Volumetric PA images of cutaneous melanoma. (a) Schematic illustration of hand-held PA and US imaging probe with translational scanning of LAT. (b) Cross-sectional PA image of melanoma lesion overlaid on the corresponding US image. The yellow and blue arrows indicate the bottom boundary and invasion of melanoma, respectively. (c) Spectrally unmixed PA images with volumetric visualization from HAT. PA, photoacoustic; US, ultrasound; LAT, linear array transducer; HAT, hemispherical array transducer; TR, transducer; FB, fiber bundle; HbO, oxygenated hemoglobin; HbR deoxygenated hemoglobin. The images are reproduced with permission from [92,93,94].
4.4. Muscular and Gastrointestinal Assessment
The hemodynamic responses that can be measured from PAI have been also utilized for analyzing the metabolic functioning of organs. Yang et al. conducted a study utilizing PAI to characterize circulatory and metabolic functions by monitoring hemodynamic changes in the forearm skeletal muscle during cuff occlusion [95]. They acquired multispectral PA images using a 128-element CAT with a diameter of 100 mm and a spanning angle of 174°. By monitoring PA signals from veins, arteries, and muscles during alternating venous and arterial occlusions (Figure 8a), a similar trend to the conventional near-infrared spectroscopy was observed (Figure 8b). This finding demonstrated the feasibility of the PAI system for imaging hemodynamic responses in both muscles and blood vessels. In another study, Regensburger et al. demonstrated the visualization of disease progression and treatment response in Duchenne muscular dystrophy (DMD) using multispectral PAI [96]. The spectrally unmixed PA signals determined the components of collagen, lipid, and hemoglobin in the muscles of 10 DMD patients and 10 healthy volunteers (Figure 8c). The results revealed a clear difference in collagen signal intensity between healthy subjects (14.60 ± 4.42) and DMD patients (24.72 ± 5.92). Volumetric images further showcased significant differences in oxyhemoglobin, deoxyhemoglobin, and total hemoglobin levels, underscoring the potential of multispectral PAI for monitoring DMD patients. Furthermore, Knieling et al. presented a preliminary study on the application of PAI for assessing Crohn’s disease, based on the correlation between hemoglobin content and intestinal inflammation [97]. Multispectral PA images were acquired from a total of 108 patients. The PA responses were compared between active and non-active patients, as determined by conventional scoring methods including the Harvey–Bradshaw index, simplified endoscopic score for Crohn’s disease, and modified Riley score. The initial results showed significant differences in oxyhemoglobin, deoxyhemoglobin, and total hemoglobin levels. These studies highlight the valuable role of PAI in investigating hemodynamic responses and metabolic functions, providing insights into the pathophysiology of various disorders, and monitoring treatment outcomes in a non-invasive manner.
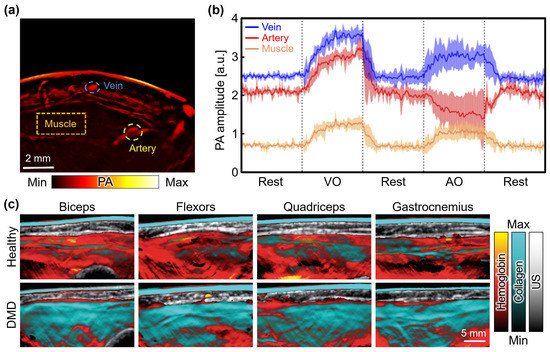
Figure 8.
PA monitoring of hemodynamic changes and molecular composition of muscles. (a) PA images acquired from human forearms. Monitoring regions for veins, arteries, and muscles are denoted as blue, yellow, and orange dashed areas, respectively. (b) PA amplitude at each region according to the time series of VO and AO conditions. Dashed lines denote the boundary between different cuff pressures. (c) Multispectral PA images of four regions in a 7-year-old healthy volunteer and a 5-year-old DMD patient. PA, photoacoustic; US, ultrasound; VO, venous occlusion; AO, arterial occlusion; DMD, Duchenne muscular dystrophy. The images were reproduced with permission from [95,96].
5. Summary and Discussion
In this paper, we have presented an extensive overview of the diverse applications of PAI in clinical human studies. By offering molecular and functional information on biological tissues, PAI has demonstrated remarkable potential for various clinical applications, including cancer detection, melanoma staging, vascular imaging, and metabolic function assessment. Initially, PAI has been successfully integrated with existing diagnostic USI, then expanding its scope to novel clinical applications. The findings and advancements discussed in this paper provide valuable insights into the wide-ranging clinical applications of PAI and highlight its significant contributions to non-invasive imaging in the field of medical diagnosis. Table 2 summarizes the key specifications of the clinical application of PAI, understanding its versatility and potential in diverse clinical settings. Further research and development efforts in this field hold promise for optimizing PAI systems, refining image processing techniques, and validating the clinical utility of PAI in improving patient outcomes across various medical conditions.
Table 2.
Summary of PAI in clinical human studies. PA, photoacoustic; US, ultrasound; PRF, pulse repetition rate; , excitation wavelength for PA imaging; , number of elements; , center frequency; LAT, linear array transducer; CAT, curved array transducer; HAT, hemispherical array transducer; TRT, transrectal transducer; GI, gastrointestinal; BV, blood vessel; sO2, hemoglobin oxygen saturation; HbO, oxygenated hemoglobin; HbR, deoxygenated hemoglobin. BI-RADS, Breast Imaging Reporting and Data System; ATA, American Thyroid Association; NVB, neurovascular bundle; MVD, microvascular density; TVA, total vessel area; TVL, total vessel length; ICG, indocyanine green; DMD, Duchenne muscular dystrophy.
The promising clinical applications of PAI presented in this paper open up avenues for further research and development toward its successful translation into clinical practice. In addition to the studies discussed in this paper, there are several potential clinical applications that PAI can be utilized. One such application is functional brain imaging, which has been widely investigated in preclinical animal studies. However, translating this technique to human subjects presents challenges due to its invasiveness, as it currently requires opening the scalp for imaging [98,99,100]. Recently, Na et al. reported human brain imaging by using four 256-element quarter-ring-shaped CAT [101], but they achieved images after hemicraniectomy, suffering from the invasiveness. Despite the current limitations, ongoing advancements in technology and potential improvements in non-invasive imaging approaches may offer promising possibilities for achieving functional imaging of the human brain using PAI.
Another potential clinical application is PA endoscopy (PAE), which has been widely investigated in biomedical studies [102]. In preclinical research, PAE has demonstrated its feasibility for diagnosing tumors, polyps, and other colorectal conditions using in vivo small animal models [103,104,105] and ex vivo human colorectal tissues [106]. However, PAE has not yet been applied to in vivo human imaging due to certain challenges related to inserting miniaturized imaging probes into the body for clinical use. The approval and adoption of such miniaturized devices for clinical human imaging require compliance with rigid regulatory standards, including good manufacturing practices. Despite the current limitations, the potential for future clinical applications of PAE in human analysis remains promising. To realize its clinical translation, it will be essential to focus on achieving technical improvements, as well as obtaining regulatory approval for safe and effective use in humans.
While PAI has demonstrated remarkable capabilities in various areas, there are several important considerations and future directions that need to be addressed to facilitate its clinical translation. Firstly, further advancements in PAI technology are required to enhance its clinical applicability [107]. This includes the development of compact and portable PAI systems that are user-friendly and cost-effective, enabling widespread adoption across different healthcare settings [41]. Improvements in imaging speed, spatial resolution, and depth penetration are also crucial for obtaining high-quality images and maximizing clinical utility.
Standardization of imaging protocols and data analysis techniques is another critical aspect of the clinical translation of PAI [108]. Establishing consensus guidelines and benchmarks for image acquisition, data processing, and interpretation will enable accurate and reproducible results, facilitating comparison and validation of findings across different studies and institutions. To achieve this goal, rigorous validation through well-designed clinical trials is necessary. Large-scale studies involving diverse patient populations and comparisons with established diagnostic modalities are needed to assess the clinical performance and utility of PAI in real-world scenarios.
In addition, the development and application of artificial intelligence (AI)-based analysis techniques also represent a promising avenue for enhancing the diagnostic accuracy of clinical PAI. Extensive research has recently been explored to assess AI-based analysis with PA images [109,110,111]. Through these techniques, PAI can significantly improve the diagnostic process by providing efficient guidance and supporting accurate decision-making. To establish robust and reliable AI algorithms, large-scale datasets with multi-location acquisitions may be essential, which is one of the main challenges. By using the potential of AI, PAI can overcome challenges related to limited-view issues and enhance image qualities.
Moreover, efforts should be directed toward the development of targeted contrast agents or molecular probes that can specifically enhance the PAI signals of pathological tissues or biomarkers [112,113,114]. The integration of molecular imaging capabilities into PAI can enable the non-invasive detection of molecular targets and facilitate early diagnosis, treatment planning, and monitoring of therapeutic responses. Advancements in nanoparticle-based contrast agents, biomolecular targeting strategies, and theranostic agents hold great promise for enhancing the sensitivity and specificity of PAI in molecular imaging applications. However, the application of nanoparticles as contrast agents in clinical human studies has not been realized thus far. The regulatory approval process for the usage of exogenous agents in humans poses significant challenges, requiring comprehensive safety and efficacy assessments. Nevertheless, extensive preclinical research has demonstrated the potential of nanoparticles in PAI, showcasing their capabilities in contrast-enhanced imaging, targeted drug delivery, and treatment monitoring. While the translation of nanoparticle-based PA agents to clinical human studies is challenging, they are promising for advancing the capabilities of PAI in clinical diagnosis and theranostic applications.
In conclusion, while PAI has shown remarkable promise in various clinical applications, further research and development efforts are required for its successful translation into routine clinical use. Advances in technology, standardization of protocols, validation through clinical trials, and development of targeted contrast agents are all crucial elements in realizing the full potential of PAI as a powerful clinical imaging modality. To date, there have been only a few clinically approved PAI systems. Imagio™ Breast Imaging System (Seno Medical Instruments Inc.) succeeded in obtaining the first pre-market approval (PMA) by the United States Food and Drug Administration (FDA) in 2021. The approval was based on compelling evidence presented in their report, which demonstrated that PAI could significantly enhance the specificity of conventional ultrasound-based breast cancer diagnosis, as discussed in the previous section [77]. In addition, iThera Medical GmbH succeeded in obtaining CE Marks with their PAI systems: MSOT Acuity (PAI only) in 2019 [83] and MSOT Acuity Echo (dual-modal PAI and USI) in 2021 [97]. These achievements marked a significant advancement in the clinical translation of PAI. With continued interdisciplinary collaborations and concerted efforts, PAI holds great potential to transform medical diagnostics and improve patient outcomes across a wide range of clinical scenarios.
Author Contributions
Conceptualization, J.K. and W.C.; investigation, H.L., S.H., and H.K.; writing—original draft preparation, H.L., S.H., and H.K.; writing—review and editing, J.K., W.C., and T.-K.K.; visualization, H.L., S.H., and H.K.; supervision, J.K. and W.C.; project administration, J.K. All authors have read and agreed to the published version of the manuscript.
Funding
This research was supported by a 2-Year Research Grant from Pusan National University.
Institutional Review Board Statement
Not applicable.
Informed Consent Statement
Not applicable.
Data Availability Statement
Not applicable.
Conflicts of Interest
The authors declare no conflict of interest.
References
- García-Figueiras, R.; Baleato-González, S.; Padhani, A.R.; Luna-Alcalá, A.; Vallejo-Casas, J.A.; Sala, E.; Vilanova, J.C.; Koh, D.-M.; Herranz-Carnero, M.; Vargas, H.A. How Clinical Imaging Can Assess Cancer Biology. Insights Imaging 2019, 10, 28. [Google Scholar] [CrossRef]
- Glasspool, R.; Evans, T. Clinical Imaging of Cancer Metastasis. Eur. J. Cancer 2000, 36, 1661–1670. [Google Scholar] [CrossRef]
- Morrow, M.; Waters, J.; Morris, E. MRI for Breast Cancer Screening, Diagnosis, and Treatment. Lancet 2011, 378, 1804–1811. [Google Scholar] [CrossRef]
- Padhani, A.R. MRI for assessing antivascular cancer treatments. Br. J. Radiol. 2003, 76, S60–S80. [Google Scholar] [CrossRef]
- Morris, E.A. Breast Cancer Imaging with MRI. Radiol. Clin. 2002, 40, 443–466. [Google Scholar] [CrossRef]
- Hoh, C.K.; Hawkins, R.A.; Glaspy, J.A.; Dahlbom, M.; Tse, N.Y.; Hoffman, E.J.; Schiepers, C.; Choi, Y.; Rege, S.; Nitzsche, E.; et al. Cancer Detection with Whole-Body PET Using 2-[18F]Fluoro-2-Deoxy-D-Glucose. J. Comput. Assist. Tomogr. 1993, 17, 582–589. [Google Scholar] [CrossRef]
- Iyer, V.R.; Lee, S.I. MRI, CT, and PET/CT for Ovarian Cancer Detection and Adnexal Lesion Characterization. Am. J. Roentgenol. 2010, 194, 311–321. [Google Scholar] [CrossRef]
- Kalinyak, J.E.; Berg, W.A.; Schilling, K.; Madsen, K.S.; Narayanan, D.; Tartar, M. Breast Cancer Detection using High-Resolution Breast PET Compared to Whole-Body PET or PET/CT. Eur. J. Nucl. Med. Mol. Imaging 2014, 41, 260–275. [Google Scholar] [CrossRef]
- Makaju, S.; Prasad, P.; Alsadoon, A.; Singh, A.; Elchouemi, A. Lung Cancer Detection using CT Scan Images. Procedia Comput. Sci. 2018, 125, 107–114. [Google Scholar] [CrossRef]
- Pastorino, U.; Bellomi, M.; Landoni, C.; De Fiori, E.; Arnaldi, P.; Picchio, M.; Pelosi, G.; Boyle, P.; Fazio, F. Early lung-cancer detection with spiral CT and positron emission tomography in heavy smokers: 2-year results. Lancet 2003, 362, 593–597. [Google Scholar] [CrossRef]
- Cheng, H.-D.; Shan, J.; Ju, W.; Guo, Y.; Zhang, L. Automated Breast Cancer Detection and Classification using Ultrasound Images: A Survey. Pattern Recognit. 2010, 43, 299–317. [Google Scholar] [CrossRef]
- Guo, R.; Lu, G.; Qin, B.; Fei, B. Ultrasound Imaging Technologies for Breast Cancer Detection and Management: A Review. Ultrasound Med. Biol. 2018, 44, 37–70. [Google Scholar] [CrossRef]
- Sood, R.; Rositch, A.F.; Shakoor, D.; Ambinder, E.; Pool, K.-L.; Pollack, E.; Mollura, D.J.; Mullen, L.A.; Harvey, S.C. Ultrasound for Breast Cancer Detection Globally: A Systematic Review and Meta-Analysis. J. Glob. Oncol. 2019, 5, 1–17. [Google Scholar] [CrossRef]
- Bell, A.G. The Photophone. Science 1880, 1, 130–134. [Google Scholar] [CrossRef]
- Kim, C.; Favazza, C.; Wang, L.V. In Vivo Photoacoustic Tomography of Chemicals: High-Resolution Functional and Molecular Optical Imaging at New Depths. Chem. Rev. 2010, 110, 2756–2782. [Google Scholar] [CrossRef]
- Li, M.; Tang, Y.; Yao, J. Photoacoustic tomography of blood oxygenation: A mini review. Photoacoustics 2018, 10, 65–73. [Google Scholar] [CrossRef]
- Lee, C.; Jeon, M.; Jeon, M.Y.; Kim, J.; Kim, C. In Vitro photoacoustic measurement of hemoglobin oxygen saturation using a single pulsed broadband supercontinuum laser source. Appl. Opt. 2014, 53, 3884–3889. [Google Scholar] [CrossRef]
- Jeon, M.; Kim, J.; Kim, C. Multiplane spectroscopic whole-body photoacoustic imaging of small animals in vivo. Med. Biol. Eng. Comput. 2016, 54, 283–294. [Google Scholar] [CrossRef]
- Ahn, J.; Kim, J.Y.; Choi, W.; Kim, C. High-resolution functional photoacoustic monitoring of vascular dynamics in human fingers. Photoacoustics 2021, 23, 100282. [Google Scholar] [CrossRef]
- Lee, C.; Kim, J.; Zhang, Y.; Jeon, M.; Liu, C.; Song, L.; Lovell, J.F.; Kim, C. Dual-color photoacoustic lymph node imaging using nanoformulated naphthalocyanines. Biomaterials 2015, 73, 142–148. [Google Scholar] [CrossRef]
- Park, S.; Park, G.; Kim, J.; Choi, W.; Jeong, U.; Kim, C. Bi2Se3 Nanoplates for Contrast-Enhanced Photoacoustic Imaging at 1064 nm. Nanoscale 2018, 10, 20548–20558. [Google Scholar] [CrossRef]
- Park, B.; Lee, K.M.; Park, S.; Yun, M.; Choi, H.-J.; Kim, J.; Lee, C.; Kim, H.; Kim, C. Deep Tissue Photoacoustic Imaging of Nickel (II) Dithiolene-Containing Polymeric Nanoparticles in the Second Near-Infrared Window. Theranostics 2020, 10, 2509–2521. [Google Scholar] [CrossRef]
- Maji, D.; Oh, D.; Sharmah Gautam, K.; Zhou, M.; Zhang, H.; Kao, J.; Giblin, D.; Smith, M.; Lim, J.; Lee, S.; et al. Copper-Catalyzed Covalent Dimerization of Near-Infrared Fluorescent Cyanine Dyes: Synergistic Enhancement of Photoacoustic Signals for Molecular Imaging of Tumors. Anal. Sens. 2022, 2, e202100045. [Google Scholar]
- Ding, Y.; Park, B.; Ye, J.; Wang, X.; Liu, G.; Yang, X.; Jiang, Z.; Han, M.; Fan, Y.; Song, J.; et al. Surfactant-Stripped Semiconducting Polymer Micelles for Tumor Theranostics and Deep Tissue Imaging in the NIR-II Window. Small 2022, 18, 2104132. [Google Scholar] [CrossRef]
- Kim, C.; Erpelding, T.N.; Jankovic, L.; Pashley, M.D.; Wang, L.V. Deeply Penetrating In Vivo Photoacoustic Imaging using a Clinical Ultrasound Array System. Biomed. Opt. Express 2010, 1, 278–284. [Google Scholar] [CrossRef]
- Park, E.-Y.; Park, S.; Lee, H.; Kang, M.; Kim, C.; Kim, J. Simultaneous Dual-Modal Multispectral Photoacoustic and Ultrasound Macroscopy for Three-Dimensional Whole-Body Imaging of Small Animals. Photonics 2021, 8, 13. [Google Scholar] [CrossRef]
- Park, J.; Park, B.; Kim, T.Y.; Jung, S.; Choi, W.J.; Ahn, J.; Yoon, D.H.; Kim, J.; Jeon, S.; Lee, D.; et al. Quadruple Ultrasound, Photoacoustic, Optical Coherence, and Fluorescence Fusion Imaging with a Transparent Ultrasound Transducer. Proc. Natl. Acad. Sci. USA 2021, 118, e1920879118. [Google Scholar] [CrossRef] [PubMed]
- Karpiouk, A.B.; Aglyamov, S.R.; Mallidi, S.; Scott, W.G.; Rubin, J.M.; Emelianov, S.Y.; Shah, J. Combined Ultrasound and Photoacoustic Imaging to Detect and Stage Deep Vein Thrombosis: Phantom and Ex Vivo Studies. J. Biomed. Opt. 2008, 13, 054061. [Google Scholar] [CrossRef]
- Harrison, T.; Ranasinghesagara, J.C.; Lu, H.; Mathewson, K.; Walsh, A.; Zemp, R.J. Combined Photoacoustic and Ultrasound Biomicroscopy. Opt. Express 2009, 17, 22041–22046. [Google Scholar] [CrossRef]
- Needles, A.; Heinmiller, A.; Sun, J.; Theodoropoulos, C.; Bates, D.; Hirson, D.; Yin, M.; Foster, F.S. Development and Initial Application of a Fully Integrated Photoacoustic Micro-Ultrasound System. IEEE Trans. Ultrason. Ferroelectr. Freq. Control 2013, 60, 888–897. [Google Scholar] [CrossRef] [PubMed]
- Wang, L.V.; Hu, S. Photoacoustic Tomography: In Vivo Imaging from Organelles to Organs. Science 2012, 335, 1458–1462. [Google Scholar] [CrossRef]
- Yao, J.; Wang, L.V. Photoacoustic Microscopy. Laser Photon. Rev. 2013, 7, 758–778. [Google Scholar] [CrossRef] [PubMed]
- Jeon, S.; Kim, J.; Lee, D.; Woo, B.J.; Kim, C. Review on Practical Photoacoustic Microscopy. Photoacoustics 2019, 155, 100141. [Google Scholar] [CrossRef] [PubMed]
- Baik, J.W.; Kim, J.Y.; Cho, S.; Choi, S.; Kim, J.; Kim, C. Super Wide-Field Photoacoustic Microscopy of Animals and Humans In Vivo. IEEE Trans. Med Imaging 2019, 39, 975–984. [Google Scholar] [CrossRef] [PubMed]
- Kim, J.; Kim, J.Y.; Jeon, S.; Baik, J.W.; Cho, S.H.; Kim, C. Super-Resolution Localization Photoacoustic Microscopy using Intrinsic Red Blood Cells as Contrast Absorbers. Light Sci. Appl. 2019, 8, 103. [Google Scholar] [CrossRef]
- Park, B.; Oh, D.; Kim, J.; Kim, C. Functional Photoacoustic Imaging: From Nano-and Micro-to Macro-Scale. Nano Converg. 2023, 10, 29. [Google Scholar] [CrossRef]
- Choi, W.; Park, E.-Y.; Jeon, S.; Kim, C. Clinical photoacoustic imaging platforms. Biomed. Eng. Lett. 2018, 8, 139–155. [Google Scholar] [CrossRef]
- Heijblom, M.; Steenbergen, W.; Manohar, S. Clinical Photoacoustic Breast Imaging: The Twente Experience. IEEE Pulse 2015, 6, 42–46. [Google Scholar] [CrossRef]
- Valluru, K.S.; Wilson, K.E.; Willmann, J.K. Photoacoustic Imaging in Oncology: Translational Preclinical and Early Clinical Experience. Radiology 2016, 280, 332–349. [Google Scholar] [CrossRef]
- Park, E.-Y.; Lee, H.; Han, S.; Kim, C.; Kim, J. Photoacoustic Imaging Systems Based on Clinical Ultrasound Platform. Exp. Biol. Med. 2022, 247, 551–560. [Google Scholar] [CrossRef]
- Cho, S.-W.; Park, S.M.; Park, B.; Kim, D.Y.; Lee, T.G.; Kim, B.-M.; Kim, C.; Kim, J.; Lee, S.-W.; Kim, C.-S. High-Speed Photoacoustic Microscopy: A Review Dedicated on Light Sources. Photoacoustics 2021, 24, 100291. [Google Scholar] [PubMed]
- Singh, M.K.A.; Xia, W. Portable and Affordable Light Source-Based Photoacoustic Tomography. Sensors 2020, 20, 6173. [Google Scholar] [CrossRef] [PubMed]
- Lutzweiler, C.; Razansky, D. Optoacoustic Imaging and Tomography: Reconstruction Approaches and Outstanding Challenges in Image Performance and Quantification. Sensors 2013, 13, 7345–7384. [Google Scholar] [CrossRef] [PubMed]
- Jeon, S.; Choi, W.; Park, B.; Kim, C. A Deep Learning-Based Model That Reduces Speed of Sound Aberrations for Improved In Vivo Photoacoustic Imaging. IEEE Trans. Image Process. 2021, 30, 8773–8784. [Google Scholar] [CrossRef] [PubMed]
- Olefir, I.; Tzoumas, S.; Restivo, C.; Mohajerani, P.; Xing, L.; Ntziachristos, V. Deep Learning-Based Spectral Unmixing for Optoacoustic Imaging of Tissue Oxygen Saturation. IEEE Trans. Med Imaging 2020, 39, 3643–3654. [Google Scholar] [CrossRef]
- Steinberg, I.; Huland, D.M.; Vermesh, O.; Frostig, H.E.; Tummers, W.S.; Gambhir, S.S. Photoacoustic clinical imaging. Photoacoustics 2019, 14, 77–98. [Google Scholar] [CrossRef]
- Kim, C.; Erpelding, T.N.; Jankovic, L.; Wang, L.V. Performance Benchmarks of an Array-Based Hand-Held Photoacoustic Probe Adapted from a Clinical Ultrasound System for Non-Invasive Sentinel Lymph Node Imaging. Philos. Trans. R. Soc. A Math. Phys. Eng. Sci. 2011, 369, 4644–4650. [Google Scholar] [CrossRef]
- Gateau, J.; Caballero, M.Á.A.; Dima, A.; Ntziachristos, V. Three-Dimensional Optoacoustic Tomography using a Conventional Ultrasound Linear Detector Array: Whole-Body Tomographic System for Small Animals. Med. Phys. 2013, 40, 013302. [Google Scholar] [CrossRef]
- Zafar, H.; Breathnach, A.; Subhash, H.M.; Leahy, M.J. Linear-Array-Based Photoacoustic Imaging of Human Microcirculation with a Range of High Frequency Transducer Probes. J. Biomed. Opt. 2015, 20, 051021. [Google Scholar] [CrossRef]
- Kim, J.; Park, S.; Jung, Y.; Chang, S.; Park, J.; Zhang, Y.; Lovell, J.F.; Kim, C. Programmable Real-time Clinical Photoacoustic and Ultrasound Imaging System. Sci. Rep. 2016, 6, 35137. [Google Scholar] [CrossRef]
- Kim, J.; Park, E.-Y.; Park, B.; Choi, W.; Lee, K.J.; Kim, C. Towards Clinical Photoacoustic and Ultrasound Imaging: Probe Improvement and Real-Time Graphical User Interface. Exp. Biol. Med. 2020, 245, 321–329. [Google Scholar] [CrossRef]
- Erpelding, T.N.; Kim, C.; Pramanik, M.; Jankovic, L.; Maslov, K.; Guo, Z.; Margenthaler, J.A.; Pashley, M.D.; Wang, L.V.; Suzuki, Y.; et al. Sentinel Lymph Nodes in the Rat: Noninvasive Photoacoustic and US Imaging with a Clinical US System 1. Radiology 2010, 256, 102–110. [Google Scholar] [CrossRef] [PubMed]
- Choi, W.; Oh, D.; Kim, C. Practical Photoacoustic Tomography: Realistic Limitations and Technical Solutions. J. Appl. Phys. 2020, 127, 230903. [Google Scholar] [CrossRef]
- Yang, J.; Choi, S.; Kim, C. Practical Review on Photoacoustic Computed Tomography using Curved Ultrasound Array Transducer. Biomed Eng. Lett. 2022, 12, 19–35. [Google Scholar] [CrossRef] [PubMed]
- Brecht, H.-P.F.; Su, R.; Fronheiser, M.P.; Ermilov, S.A.; Conjusteau, A.; Oraevsky, A.A. Whole-Body Three-Dimensional Optoacoustic Tomography System for Small Animals. J. Biomed. Opt. 2009, 14, 064007. [Google Scholar] [CrossRef]
- Su, R.; Ermilov, S.A.; Liopo, A.V.; Oraevsky, A.A. Three-Dimensional Optoacoustic Imaging as a New Noninvasive Technique to Study Long-Term Biodistribution of Optical Contrast Agents in Small Animal Models. J. Biomed. Opt. 2012, 17, 1015061–1015067. [Google Scholar] [CrossRef]
- Razansky, D.; Buehler, A.; Ntziachristos, V. Volumetric Real-Time Multispectral Optoacoustic Tomography of Biomarkers. Nat. Protoc. 2011, 6, 1121–1129. [Google Scholar] [CrossRef]
- Xia, J.; Chatni, M.R.; Maslov, K.I.; Guo, Z.; Wang, K.; Anastasio, M.A.; Wang, L.V. Whole-Body Ring-Shaped Confocal Photoacoustic Computed Tomography of Small Animals In Vivo. J. Biomed. Opt. 2012, 17, 050506. [Google Scholar] [CrossRef]
- Li, L.; Zhu, L.; Ma, C.; Lin, L.; Yao, J.; Wang, L.; Maslov, K.; Zhang, R.; Chen, W.; Shi, J.; et al. Single-Impulse Panoramic Photoacoustic Computed Tomography of Small-Animal Whole-Body Dynamics at High Spatiotemporal Resolution. Nat. Biomed. Eng. 2017, 1, 0071. [Google Scholar] [CrossRef]
- Schoustra, S.M.; Piras, D.; Huijink, R.; Root, T.J.P.M.O.; Alink, L.; Kobold, W.M.F.; Steenbergen, W.; Manohar, S. Twente Photoacoustic Mammoscope 2: System Overview and Three-Dimensional Vascular Network Images in Healthy Breasts. J. Biomed. Opt. 2019, 24, 121909. [Google Scholar] [CrossRef]
- Lv, J.; Peng, Y.; Li, S.; Guo, Z.; Zhao, Q.; Zhang, X.; Nie, L. Hemispherical Photoacoustic Imaging of Myocardial Infarction: In Vivo Detection and Monitoring. Eur. Radiol. 2018, 28, 2176–2183. [Google Scholar] [CrossRef] [PubMed]
- Dean-Ben, X.L.; Razansky, D. Portable Spherical Array Probe for Volumetric Real-Time Optoacoustic Imaging at Centimeter-Scale Depths. Opt. Express 2013, 21, 28062–28071. [Google Scholar] [CrossRef] [PubMed]
- Choi, S.; Yang, J.; Lee, S.Y.; Kim, J.; Lee, J.; Kim, W.J.; Lee, S.; Kim, C. Deep Learning Enhances Multiparametric Dynamic Volumetric Photoacoustic Computed Tomography In Vivo (DL-PACT). Adv. Sci. 2023, 10, 2202089. [Google Scholar] [CrossRef]
- Matsumoto, Y.; Asao, Y.; Sekiguchi, H.; Yoshikawa, A.; Ishii, T.; Nagae, K.-I.; Kobayashi, S.; Tsuge, I.; Saito, S.; Takada, M.; et al. Visualising Peripheral Arterioles and Venules Through High-Resolution and Large-Area Photoacoustic Imaging. Sci. Rep. 2018, 8, 14930. [Google Scholar] [CrossRef]
- Park, B.; Kim, C.; Kim, J. Recent Advances in Ultrasound and Photoacoustic Analysis for Thyroid Cancer Diagnosis. Adv. Phys. Res. 2023, 2, 2200070. [Google Scholar] [CrossRef]
- Ahn, H.S.; Kim, H.J.; Welch, H.G. Korea’s Thyroid-Cancer “Epidemic”—Screening and Overdiagnosis. N. Engl. J. Med. 2014, 371, 1765–1767. [Google Scholar] [CrossRef] [PubMed]
- Welch, H.G.; Black, W.C. Overdiagnosis in Cancer. J. Natl. Cancer Inst. 2010, 102, 605–613. [Google Scholar] [CrossRef]
- Roll, W.; Markwardt, N.A.; Masthoff, M.; Helfen, A.; Claussen, J.; Eisenblätter, M.; Hasenbach, A.; Hermann, S.; Karlas, A.; Wildgruber, M. Multispectral Optoacoustic Tomography of Benign and Malignant Thyroid Disorders: A Pilot Study. J. Nucl. Med. 2019, 60, 1461–1466. [Google Scholar] [CrossRef]
- Noltes, M.E.; Bader, M.; Metman, M.J.H.; Vonk, J.; Steinkamp, P.J.; Kukačka, J.; Westerlaan, H.E.; Dierckx, R.A.J.O.; van Hemel, B.M.; Brouwers, A.H.; et al. Towards in vivo characterization of thyroid nodules suspicious for malignancy using multispectral optoacoustic tomography. Eur. J. Nucl. Med. 2023, 50, 2736–2750. [Google Scholar] [CrossRef]
- Kim, J.; Park, B.; Ha, J.; Steinberg, I.; Hooper, S.M.; Jeong, C.; Park, E.-Y.; Choi, W.; Liang, T.; Bae, J.S.; et al. Multiparametric Photoacoustic Analysis of Human Thyroid Cancers In Vivo. Cancer Res 2021, 81, 4849–4860. [Google Scholar] [CrossRef]
- Nyayapathi, N.; Xia, J. Photoacoustic imaging of breast cancer: A mini review of system design and image features. J. Biomed. Opt. 2019, 24, 121911. [Google Scholar] [CrossRef] [PubMed]
- Wang, D.; Wang, Y.; Wang, W.; Luo, D.; Chitgupi, U.; Geng, J.; Zhou, Y.; Wang, L.; Lovell, J.F.; Xia, J. Deep Tissue Photoacoustic Computed Tomography with a Fast and Compact Laser System. Biomed. Opt. Express 2017, 8, 112–123. [Google Scholar] [CrossRef] [PubMed]
- Nyayapathi, N.; Lim, R.; Zhang, H.; Zheng, W.; Wang, Y.; Tiao, M.; Oh, K.W.; Fan, X.C.; Bonaccio, E.; Takabe, K.; et al. Dual Scan Mammoscope (DSM)—A New Portable Photoacoustic Breast Imaging System with Scanning in Craniocaudal Plane. IEEE Trans. Biomed. Eng. 2019, 67, 1321–1327. [Google Scholar] [CrossRef] [PubMed]
- Nyayapathi, N.; Zhang, H.; Zheng, E.; Nagarajan, S.; Bonaccio, E.; Takabe, K.; Fan, X.C.; Xia, J. Photoacoustic dual-scan mammoscope: Results from 38 patients. Biomed. Eng. Lett. 2021, 12, 2054–2063. [Google Scholar] [CrossRef] [PubMed]
- Diot, G.; Metz, S.; Noske, A.; Liapis, E.; Schroeder, B.; Ovsepian, S.V.; Meier, R.; Rummeny, E.; Ntziachristos, V. Multispectral Optoacoustic Tomography (MSOT) of Human Breast Cancer. Clin. Cancer. Res. 2017, 23, 6912–6922. [Google Scholar] [CrossRef] [PubMed]
- Kukačka, J.; Metz, S.; Dehner, C.; Muckenhuber, A.; Paul-Yuan, K.; Karlas, A.; Fallenberg, E.M.; Rummeny, E.; Jüstel, D.; Ntziachristos, V. Image Processing Improvements Afford Second-Generation Handheld Optoacoustic Imaging of Breast Cancer Patients. Photoacoustics 2022, 26, 10034. [Google Scholar] [CrossRef] [PubMed]
- Neuschler, E.I.; Butler, R.; Young, C.A.; Barke, L.D.; Bertrand, M.L.; Böhm-Vélez, M.; Destounis, S.; Donlan, P.; Grobmyer, S.R.; Katzen, J. A Pivotal Study of Optoacoustic Imaging to Diagnose Benign and Malignant Breast Masses: A New Evaluation Tool for Radiologists. Radiology 2017, 287, 398–412. [Google Scholar] [CrossRef]
- Menezes, G.L.G.; Pijnappel, R.M.; Meeuwis, C.; Bisschops, R.; Veltman, J.; Lavin, P.T.; van de Vijver, M.J.; Mann, R.M. Downgrading of Breast Masses Suspicious for Cancer by Using Optoacoustic Breast Imaging. Radiology 2018, 288, 355–365. [Google Scholar] [CrossRef]
- Horiguchi, A.; Tsujita, K.; Irisawa, K.; Kasamatsu, T.; Hirota, K.; Kawaguchi, M.; Shinchi, M.; Ito, K.; Asano, T.; Shinmoto, H.; et al. A Pilot Study of Photoacoustic Imaging System for Improved Real-Time Visualization of Neurovascular Bundle during Radical Prostatectomy. Prostate 2016, 76, 307–315. [Google Scholar] [CrossRef]
- Horiguchi, A.; Shinchi, M.; Nakamura, A.; Wada, T.; Ito, K.; Asano, T.; Shinmoto, H.; Tsuda, H.; Ishihara, M. Pilot Study of Prostate Cancer Angiogenesis Imaging Using a Photoacoustic Imaging System. Urology 2017, 108, 212–219. [Google Scholar] [CrossRef]
- Kothapalli, S.-R.; Sonn, G.A.; Choe, J.W.; Nikoozadeh, A.; Bhuyan, A.; Park, K.K.; Cristman, P.; Fan, R.; Moini, A.; Lee, B.C.; et al. Simultaneous Transrectal Ultrasound and Photoacoustic Human Prostate Imaging. Sci. Transl. Med. 2019, 11, eaav2169. [Google Scholar] [CrossRef]
- Ivankovic, I.; Merčep, E.; Schmedt, C.-G.; Deán-Ben, X.L.; Razansky, D. Real-Time Volumetric Assessment of the Human Carotid Artery: Handheld Multispectral Optoacoustic Tomography. Radiology 2019, 291, 45–50. [Google Scholar] [CrossRef] [PubMed]
- Karlas, A.; Kallmayer, M.; Bariotakis, M.; Fasoula, N.-A.; Liapis, E.; Hyafil, F.; Pelisek, J.; Wildgruber, M.; Eckstein, H.-H.; Ntziachristos, V. Multispectral Optoacoustic Tomography of Lipid and Hemoglobin Contrast in Human Carotid Atherosclerosis. Photoacoustics 2021, 23, 100283. [Google Scholar] [CrossRef] [PubMed]
- Yang, J.; Zhang, G.; Shang, Q.; Wu, M.; Huang, L.; Jiang, H. Detecting Hemodynamic Changes in the Foot Vessels of Diabetic Patients by Photoacoustic Tomography. J. Biophoton. 2020, 13, e202000011. [Google Scholar] [CrossRef] [PubMed]
- Choi, W.; Park, E.-Y.; Jeon, S.; Yang, Y.; Park, B.; Ahn, J.; Cho, S.; Lee, C.; Seo, D.-K.; Cho, J.-H.; et al. Three-dimensional Multistructural Quantitative Photoacoustic and US Imaging of Human Feet In Vivo. Radiology 2022, 303, 467–473. [Google Scholar] [CrossRef] [PubMed]
- Kruger, R.A.; Lam, R.B.; Reinecke, D.R.; Del Rio, S.P.; Doyle, R.P. Photoacoustic Angiography of the Breast. Med. Phys. 2010, 37, 6096–6100. [Google Scholar] [CrossRef] [PubMed]
- Kruger, R.A.; Kuzmiak, C.M.; Lam, R.B.; Reinecke, D.R.; Del Rio, S.P.; Steed, D. Dedicated 3D Photoacoustic Breast Imaging. Med. Phys. 2013, 40, 113301. [Google Scholar] [CrossRef]
- Toi, M.; Asao, Y.; Matsumoto, Y.; Sekiguchi, H.; Yoshikawa, A.; Takada, M.; Kataoka, M.; Endo, T.; Kawaguchi-Sakita, N.; Kawashima, M.; et al. Visualization of Tumor-Related Blood Vessels in Human Breast by Photoacoustic Imaging System with a Hemispherical Detector Array. Sci. Rep. 2017, 7, 41970. [Google Scholar] [CrossRef]
- Toi, M.; Asao, Y.; Matsumoto, Y.; Sekiguchi, H.; Yoshikawa, A.; Takada, M.; Kataoka, M.; Endo, T.; Kawaguchi-Sakita, N.; Kawashima, M.; et al. Vascular Branching Point Counts using Photoacoustic Imaging in the Superficial Layer of the Breast: A Potential Biomarker for Breast Cancer. Photoacoustics 2018, 11, 6–13. [Google Scholar]
- Lin, L.; Hu, P.; Shi, J.; Appleton, C.M.; Maslov, K.; Li, L.; Zhang, R.; Wang, L.V. Single-Breath-Hold Photoacoustic Computed Tomography of the Breast. Nat. Commun. 2018, 9, 2352. [Google Scholar] [CrossRef]
- Kim, J.; Kim, Y.; Park, B.; Seo, H.-M.; Bang, C.; Park, G.; Park, Y.; Rhie, J.; Lee, J.; Kim, C. Multispectral Ex Vivo Photoacoustic Imaging of Cutaneous Melanoma for Better Selection of the Excision Margin. Brit. J. Dermatol. 2018, 179, 780–782. [Google Scholar] [CrossRef] [PubMed]
- Lee, C.; Choi, W.; Kim, J.; Kim, C. Three-Dimensional Clinical Handheld Photoacoustic/Ultrasound Scanner. Photoacoustics 2020, 18, 100173. [Google Scholar] [CrossRef] [PubMed]
- Park, B.; Bang, C.; Lee, C.; Han, J.; Choi, W.; Kim, J.; Park, G.; Rhie, J.; Lee, J.; Kim, C. 3D Wide-Field Multispectral Photoacoustic Imaging of Human Melanomas In Vivo: A Pilot Study. J. Eur. Acad. Dermatol. 2020, 35, 669–676. [Google Scholar] [CrossRef] [PubMed]
- Chuah, S.Y.; Attia, A.B.E.; Long, V.; Ho, C.J.H.; Malempati, P.; Fu, C.Y.; Ford, S.J.; Lee, J.S.S.; Tan, W.P.; Razansky, D.; et al. Structural and Functional 3D Mapping of Skin Tumours with Non-Invasive Multispectral Optoacoustic Tomography. Skin Res. Technol. 2017, 23, 221–226. [Google Scholar] [CrossRef]
- Yang, J.; Zhang, G.; Chang, W.; Chi, Z.; Shang, Q.; Wu, M.; Pan, T.; Huang, L.; Jiang, H. Photoacoustic Imaging of Hemodynamic Changes in Forearm Skeletal Muscle During Cuff Occlusion. Biomed. Opt. Express 2020, 11, 4560–4570. [Google Scholar] [CrossRef]
- Regensburger, A.P.; Fonteyne, L.M.; Jüngert, J.; Wagner, A.L.; Gerhalter, T.; Nagel, A.M.; Heiss, R.; Flenkenthaler, F.; Qurashi, M.; Neurath, M.F.; et al. Detection of Collagens by Multispectral Optoacoustic Tomography as an Imaging Biomarker for Duchenne Muscular Dystrophy. Nat. Med. 2019, 25, 1905–1915. [Google Scholar] [CrossRef]
- Knieling, F.; Neufert, C.; Hartmann, A.; Claussen, J.; Urich, A.; Egger, C.; Vetter, M.; Fischer, S.; Pfeifer, L.; Hagel, A.; et al. Multispectral Optoacoustic Tomography for Assessment of Crohn’s Disease Activity. N. Engl. J. Med. 2017, 376, 1292–1294. [Google Scholar] [CrossRef]
- Razansky, D.; Klohs, J.; Ni, R. Multi-Scale Optoacoustic Molecular Imaging of Brain Diseases. Eur. J. Nucl. Med. Mol. Imaging 2021, 48, 4152–4170. [Google Scholar] [CrossRef]
- Upputuri, P.K.; Pramanik, M. Dynamic In Vivo Imaging of Small Animal Brain using Pulsed Laser Diode-Based Photoacoustic Tomography System. J. Biomed. Opt. 2017, 22, 090501. [Google Scholar] [CrossRef]
- Yao, J.; Wang, L.; Yang, J.-M.; I Maslov, K.; Wong, T.T.W.; Li, L.; Huang, C.-H.; Zou, J.; Wang, L.V. High-Speed Label-Free Functional Photoacoustic Microscopy of Mouse Brain in Action. Nat. Methods 2015, 12, 407–410. [Google Scholar] [CrossRef]
- Na, S.; Russin, J.J.; Lin, L.; Yuan, X.; Hu, P.; Jann, K.B.; Yan, L.; Maslov, K.; Shi, J.; Wang, D.J.; et al. Massively Parallel Functional Photoacoustic Computed Tomography of the Human Brain. Nat. Biomed. Eng. 2022, 6, 584–592. [Google Scholar] [CrossRef] [PubMed]
- Guo, H.; Li, Y.; Qi, W.; Xi, L. Photoacoustic Endoscopy: A Progress Review. J. Biophoton. 2020, 13, e202000217. [Google Scholar] [CrossRef] [PubMed]
- Xiong, K.; Yang, S.; Li, X.; Xing, D. Autofocusing Optical-Resolution Photoacoustic Endoscopy. Opt. Lett. 2018, 43, 1846–1849. [Google Scholar] [CrossRef] [PubMed]
- Xiong, K.; Wang, W.; Guo, T.; Yuan, Z.; Yang, S. Shape-Adapting Panoramic Photoacoustic Endomicroscopy. Opt. Lett. 2019, 44, 2681–2684. [Google Scholar] [CrossRef]
- Yang, J.-M.; Li, C.; Chen, R.; Rao, B.; Yao, J.; Yeh, C.-H.; Danielli, A.; Maslov, K.; Zhou, Q.; Shung, K.K.; et al. Optical-Resolution Photoacoustic Endomicroscopy In Vivo. Biomed. Opt. Express 2015, 6, 918–932. [Google Scholar] [CrossRef]
- Yang, G.; Amidi, E.; Chapman, W.C., Jr.; Nandy, S.; Mostafa, A.; Abdelal, H.; Alipour, Z.; Chatterjee, D.; Mutch, M.; Zhu, Q. Co-Registered Photoacoustic and Ultrasound Imaging of Human Colorectal Cancer. J. Biomed. Opt. 2019, 24, 121913. [Google Scholar]
- Attia, A.B.E.; Balasundaram, G.; Moothanchery, M.; Dinish, U.; Bi, R.; Ntziachristos, V.; Olivo, M. A Review of Clinical Photoacoustic Imaging: Current and Future Trends. Photoacoustics 2019, 16, 100144. [Google Scholar] [CrossRef]
- Palma-Chavez, J.; Pfefer, T.J.; Agrawal, A.; Jokerst, J.V.; Vogt, W.C. Review of Consensus Test Methods in Medical Imaging and Current Practices in Photoacoustic Image Quality Assessment. J. Biomed. Opt. 2021, 26, 090901. [Google Scholar] [CrossRef]
- Kim, J.; Kim, G.; Li, L.; Zhang, P.; Kim, J.Y.; Kim, Y.; Kim, H.H.; Wang, L.V.; Lee, S.; Kim, C. Deep Learning Acceleration of Multiscale Superresolution Localization Photoacoustic Imaging. Light Sci. Appl. 2022, 11, 131. [Google Scholar] [CrossRef]
- Yang, C.; Lan, H.; Gao, F.; Gao, F. Review of Deep Learning for Photoacoustic Imaging. Photoacoustics 2021, 21, 100215. [Google Scholar] [CrossRef]
- Gröhl, J.; Schellenberg, M.; Dreher, K.; Maier-Hein, L. Deep Learning for Biomedical Photoacoustic Imaging: A Review. Photoacoustics 2021, 22, 100241. [Google Scholar] [CrossRef]
- Choi, W.; Park, B.; Choi, S.; Oh, D.; Kim, J.; Kim, C. Recent Advances in Contrast-Enhanced Photoacoustic Imaging: Overcoming the Physical and Practical Challenges. Chem. Rev. 2023, 123, 7379–7419. [Google Scholar] [CrossRef] [PubMed]
- Park, S.; Jung, U.; Lee, S.; Lee, D.; Kim, C. Contrast-Enhanced Dual Mode Imaging: Photoacoustic Imaging Plus More. Biomed. Eng. Lett. 2017, 7, 121–133. [Google Scholar] [CrossRef] [PubMed]
- Xiao, S.; Tang, Y.; Lin, Y.; Lv, Z.; Chen, L. In Vivo Nano Contrast-Enhanced Photoacoustic Imaging for Dynamically Lightening the Molecular Changes of Rheumatoid Arthritis. Mater. Des. 2021, 207, 109862. [Google Scholar] [CrossRef]
Disclaimer/Publisher’s Note: The statements, opinions and data contained in all publications are solely those of the individual author(s) and contributor(s) and not of MDPI and/or the editor(s). MDPI and/or the editor(s) disclaim responsibility for any injury to people or property resulting from any ideas, methods, instructions or products referred to in the content. |
© 2023 by the authors. Licensee MDPI, Basel, Switzerland. This article is an open access article distributed under the terms and conditions of the Creative Commons Attribution (CC BY) license (https://creativecommons.org/licenses/by/4.0/).