Article

Design of Cascaded Diffractive Optical Elements for Optical Beam Shaping and Image Classification Using a Gradient Method

by
Daniil V. Soshnikov
1,2,
Leonid L. Doskolovich
1,2,*,
Georgy A. Motz
2,
Egor V. Byzov
1,2,
Evgeni A. Bezus
1,2,
Dmitry A. Bykov
1,2 and
Albert A. Mingazov
1,2
1
Image Processing Systems Institute, Branch of the Federal Scientific Research Centre “Crystallography and Photonics” of Russian Academy of Sciences, 151 Molodogvardeyskaya Street, 443001 Samara, Russia
2
Samara National Research University, 34 Moskovskoye Shosse, 443086 Samara, Russia
*
Author to whom correspondence should be addressed.
Photonics 2023, 10(7), 766; https://doi.org/10.3390/photonics10070766
Submission received: 23 May 2023 / Revised: 19 June 2023 / Accepted: 29 June 2023 / Published: 3 July 2023

Abstract

:
We present a gradient method for designing cascaded diffractive optical elements (DOEs) consisting of several sequentially located phase DOEs. Using the unitarity property of the operator of light propagation through the cascaded DOE, we obtain explicit expressions for the derivatives of the error functional with respect to the phase functions of the cascaded DOE. We consider the application of the gradient method to the problem of focusing different incident beams to regions with different intensity distributions and to the problem of optical image classification. The presented description of the gradient method treats the problems of designing cascaded DOEs for focusing laser radiation and for image classification within a unified approach reducing the calculation of the derivatives of the error functionals to the same formula. We present examples of the calculation of single and cascaded DOEs for focusing different incident beams to different regions and for classifying handwritten digits, which demonstrate the high performance of the proposed method. The presented results may find application in the design of diffractive neural networks and systems for focusing laser radiation.

1. Introduction

Nowadays, the design and investigation of diffractive optical elements (DOEs) are the subjects of active research [1,2,3,4,5,6,7]. The main reasons for the interest in this research field are the compactness, manufacturability, and efficiency of using DOEs for solving a wide range of problems of transforming and focusing optical radiation. As a rule, the DOE design is carried out within the framework of the scalar diffraction theory. The problem of calculating a DOE belongs to the class of ill-posed inverse problems and consists in determining the shape of the “phase” diffractive microrelief, which ensures the formation of a light field with specified parameters (usually, with a required intensity distribution) in a given region of space. Since the height of the DOE microrelief is proportional to the phase function of the light field formed by the DOE, the problem of DOE design is usually considered as the problem of calculating a phase function, which ensures the generation of the required intensity distribution. For the calculation of the phase function, various iterative algorithms are traditionally used including the “classical” Gerchberg–Saxton algorithm, the error-reduction algorithm, and a wide range of their modifications [8,9,10,11,12,13,14].
In addition to single DOEs, the so-called cascaded DOEs are widely used, consisting of several sequentially located phase DOEs. Such DOEs possess a wider functionality and make it possible to solve more complex problems, e.g., the problem of focusing different incident beams (in particular, with different propagation directions or different wavelengths) into different regions [2,15,16]. For the calculation of cascaded DOEs, iterative algorithms are also used, which are a generalization of the existing algorithms for designing single DOEs. At the same time, most of these algorithms are heuristic and do not have a strict theoretical justification. In particular, for the iterative algorithms used in [2,15,16], there is no analysis of the error decrease property, which the Gerchberg–Saxton algorithm and error-reduction algorithm possess. In this regard, it appears relevant to develop gradient methods for calculating cascaded DOEs, which, at least, have a clear theoretical justification.
In addition to the utilization of cascaded DOEs in complex problems of focusing laser radiation, in recent years, they have found wide application in solving various problems of machine learning (in particular, the problems of image classification) [3,5,17,18,19,20,21,22], as well as in the problems of implementing various mathematical transformations described by linear operators [23]. In these problems, cascaded DOEs are often referred to as diffractive neural networks (DNNs). The main method for designing DNNs is the stochastic gradient method, as well as the “improved” first-order methods based on it [24]. In a number of works, expressions were obtained for the gradients of the error functions with respect to the parameters of the phase functions [2,5,20]. However, these expressions were obtained for a discrete form of the operators of light propagation between the DOEs. As a result, the expressions for the gradients have a complex and cumbersome form, which, in the opinion of the present authors, complicates their understanding and implementation.
In this work, we present a gradient method for calculating cascaded DOEs. Using the unitarity property of the operator of light propagation through a cascaded DOE, we obtain explicit and compact expressions for the derivatives of the error functional with respect to the phase functions of the cascaded DOE. We consider the application of the gradient method to the problem of focusing different incident beams to regions with different intensity distributions and to the problem of image classification. The presented description of the gradient method “combines” the problems of designing cascaded DOEs for focusing laser radiation and for classifying images within a single methodological approach, in which the calculation of the derivatives of the error functionals is reduced to the same formula. Using the proposed gradient method, single and cascaded DOEs are calculated for solving the problem of focusing several incident beams on different regions and the problem of classifying handwritten digits. The presented numerical simulation results demonstrate the high performance of the proposed method.

2. Problem Statement

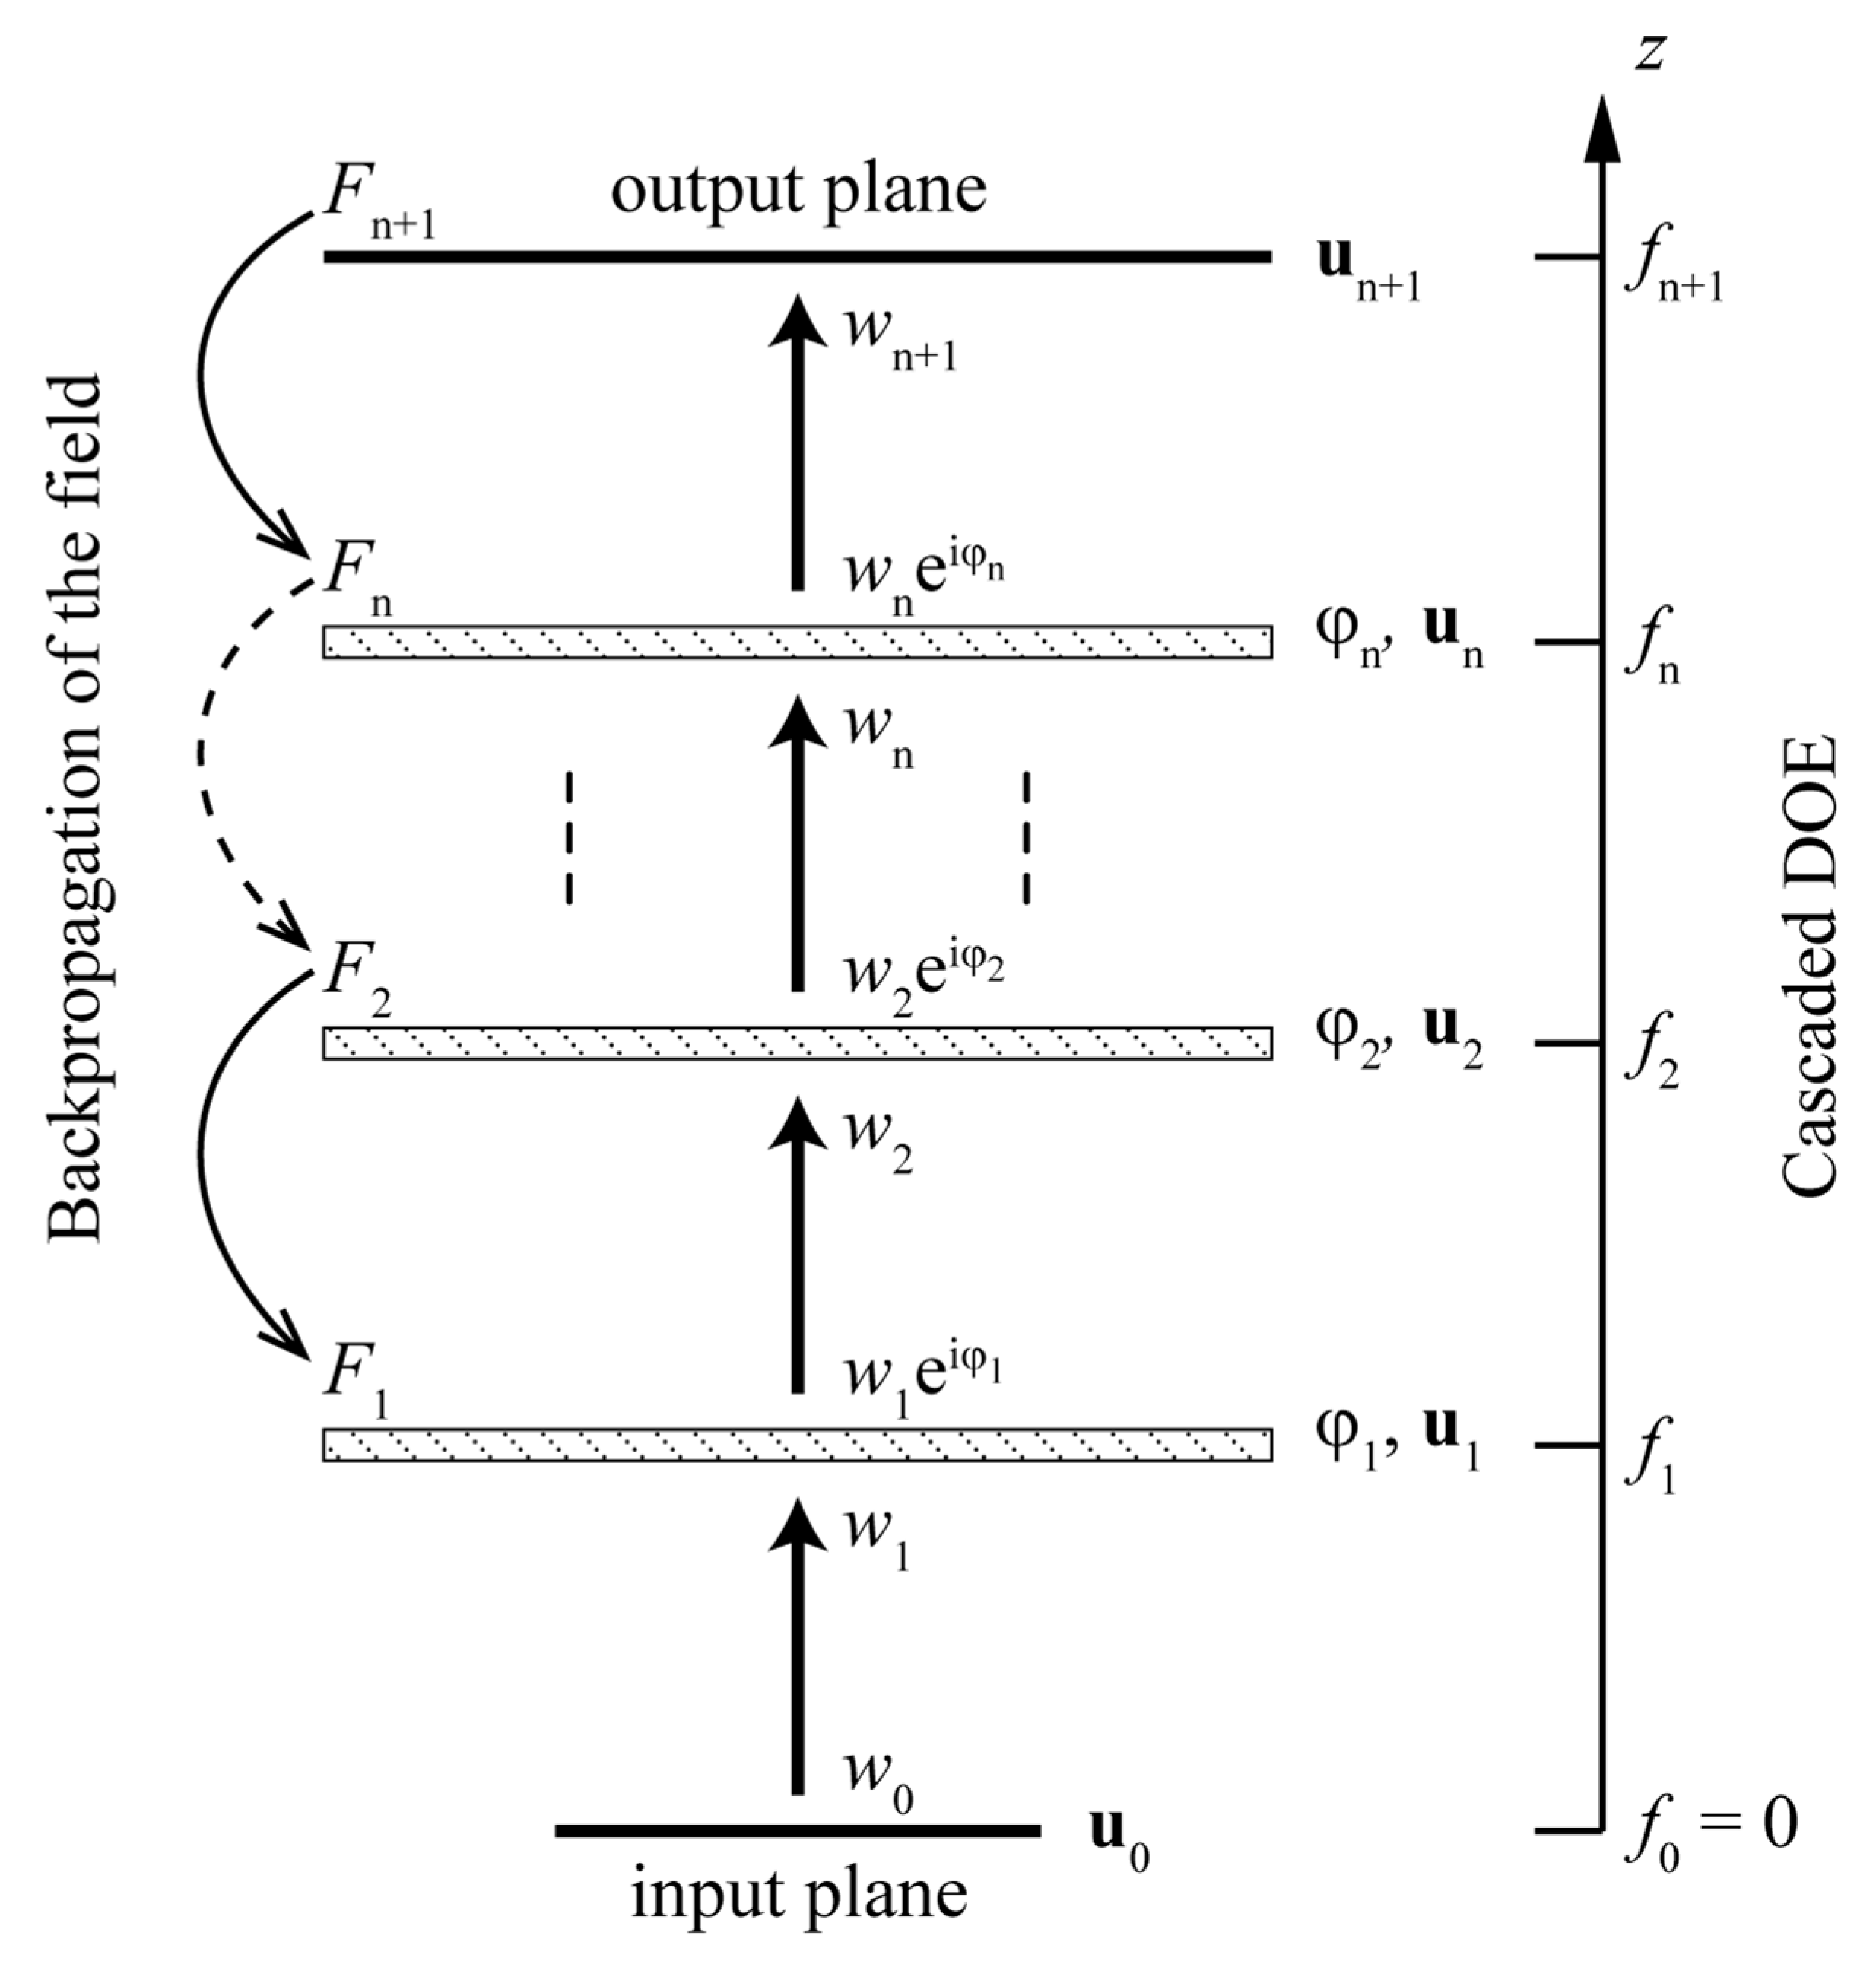
Let the complex amplitude of the “input” field w 0 ( u 0 ) be defined in the input plane z = f 0 = 0 , where u 0 = ( u 0 , v 0 ) are the Cartesian coordinates in this plane. We will assume that the light field with the wavelength λ propagates from the plane z = 0 through a set of n phase DOEs located in the planes z = f 1 , , z = f n   ( 0 < f 1 < < f n ) , and finally comes to the output plane z = f n + 1 > f n (Figure 1).
Let us denote by φ 1 ( u 1 ) , , φ n ( u n ) the phase functions of the DOEs, where u j = ( u j , v j ) are the Cartesian coordinates in the planes z = f 1 , , z = f n . We will assume that the propagation of light between the planes z = f i ,   i = 1 , , n + 1 is described by the Fresnel–Kirchhoff integral of the scalar diffraction theory. We will describe the propagation of light through a DOE in the thin optical element approximation as the multiplication of the complex amplitude of the incident beam by the complex transmission function of the DOE exp { i φ m ( u m ) } ,   m = 1 , n .
In this case, the propagation of light through a cascaded DOE is described by the following expressions:
w 1 ( u 1 ) = e i k d 1 λ i d 1 w 0 ( u 0 ) exp { i π λ d 1 ( u 1 u 0 ) 2 } d 2 u 0 , w m ( u m ) = e i k d m λ i d m w m 1 ( u m 1 ) e i φ m 1 ( u m 1 ) exp { i π λ d m ( u m u m 1 ) 2 } d 2 u m 1 ,     m = 2 , , n + 1 ,
where w m ( u m ) ,   m = 1 , , n are the complex amplitudes of the fields incident on DOEs located in the planes z = f m , and d m = f m f m 1 are the distances between these planes. According to Equation (1), the calculation of the complex amplitude of the output field w n + 1 ( u n + 1 ) is carried out recursively. For the following analysis, it will be convenient to consider Equation (1) as a representation of linear operators describing the propagation of light from the input plane z = f 0 to the planes z = f m ,   m = 1 , , n + 1 .
Under the inverse problem, we will understand the problem of calculating the phase functions φ 1 ( u 1 ) , , φ n ( u n ) from the condition of generating a light field with the required intensity distribution I ( u n + 1 ) in the output plane. Let us describe the error of generating the required distribution using an integral criterion
ε ( φ 1 , , φ n ) = D [ I n + 1 ( u n + 1 ) , I ( u n + 1 ) ] d 2 u n + 1 ,
where I n + 1 ( u n + 1 ) = | w n + 1 ( u n + 1 ) | 2 is the intensity distribution generated by a cascaded DOE with phase functions φ 1 ( u 1 ) , , φ n ( u n ) , and D is a certain function representing the difference between the generated and required distributions at the current point.
In what follows, we will consider the inverse problem of designing a cascaded DOE as the problem of minimizing the functional of Equation (2), which we will refer to as the error functional:
ε ( φ 1 , , φ n ) min φ 1 , , φ n .

3. Gradient Method for Calculating a Cascaded DOE

For solving the problem of Equation (3), we will utilize a gradient method. Let us consider the calculation of the derivative of the functional of Equation (3) with respect to the function φ m . Let us denote by
Δ m ε ( φ 1 , , φ n ) = ε ( φ 1 , , φ m + Δ φ m , , φ n ) ε ( φ 1 , , φ m , , φ n ) ,
the increment of the error functional caused by the increment Δ φ m of the function φ m . According to Equation (2), this increment has the form
Δ m ε ( φ 1 , , φ n ) = D [ I n + 1 ( u n + 1 ) , I ( u n + 1 ) ] I n + 1 Δ m ( w n + 1 ( u n + 1 ) w n + 1 * ( u n + 1 ) ) d 2 u n + 1 = D [ I n + 1 ( u n + 1 ) , I ( u n + 1 ) ] I n + 1 2 Re [ ( Δ m w n + 1 ( u n + 1 ) ) w n + 1 * ( u n + 1 ) ] d 2 u n + 1 = 2 Re [ ( Δ m w n + 1 ( u n + 1 ) ) F n + 1 * ( u n + 1 ) d 2 u n + 1 ] = 2 Re Δ m w n + 1 ( u n + 1 ) , F n + 1 ( u n + 1 ) ,
where Δ m I n + 1 ( u n + 1 ) and Δ m w n + 1 ( u n + 1 ) are the increments of the intensity and complex amplitude caused by the phase increment Δ φ m , the angle brackets denote the scalar product of functions, and the function F n + 1 ( u n + 1 ) has the form
F n + 1 ( u n + 1 ) = D [ I n + 1 ( u n + 1 ) , I ( u n + 1 ) ] I n + 1 w n + 1 ( u n + 1 ) .
For the following derivations, let us introduce the operator Pr f n + 1 f m + of the “backpropagation” of light from the output plane z = f n + 1 to the plane z = f m + located immediately after the plane of the m-th DOE z = f m . In this plane, the complex amplitude of the field in the case of “direct” propagation reads as w m e i φ m . Let us present formulas for calculating this operator by starting with the field F n + 1 ( u n + 1 ) (see Figure 1). At m = n , the backpropagation operator corresponds to the Fresnel–Kirchhoff integral, in which the propagation distance d n + 1 is taken with a negative sign:
F n ( u n ) = Pr f n + 1 f n + ( F n + 1 ) = e i k d n + 1 λ i d n + 1 F n + 1 ( u n + 1 ) exp { i π λ d n + 1 ( u n u n + 1 ) 2 } d 2 u n + 1 .
At m < n , the operator Pr f n + 1 f m + ( F n + 1 ) is calculated recursively using the following expression:
F j 1 ( u j 1 ) = e i k d j λ i d j F j ( u j ) e i φ j ( u j ) exp { i π λ d j ( u j 1 u j ) 2 } d 2 u j ,       j = n , , m + 1 .
One can easily show that the operators of direct propagation and backpropagation of light through a set of phase DOEs are unitary and conserve the scalar product [18]. Due to the scalar product conservation, the increment of the criterion of Equation (5) can be represented as
Δ m ε ( φ 1 , , φ n ) = 2 Re Δ m w n + 1 , F n + 1 = 2 Re Pr f n + 1 f m + ( Δ m w n + 1 ) , Pr f n + 1 f m + ( F n + 1 ) .
Since Pr f n + 1 f m + ( Δ m w n + 1 ) = Δ m ( w m e i φ m ) , where w m e i φ m is the complex amplitude of the field immediately after the plane of the m-th DOE at direct propagation and Pr f n + 1 f m + ( F n + 1 ) = F m . Let us transform Equation (9) to the form
Δ m ε ( φ 1 , , φ n ) = 2 Re Δ m ( w m e i φ m ) , F m = 2 Re w m ( u m ) Δ e i φ m ( u m ) F m * ( u m ) d 2 u m .
By substituting the increment Δ e i φ m as its Taylor series expansion up to the linear term Δ e i φ m = e i φ m + i Δ φ m e i φ m i Δ φ m e i φ m , let us write the main (linear) part of the increment of the functional (10) as
δ m ε ( φ 1 , , φ n ) = 2 Δ φ m ( u m ) Im [ w m ( u m ) e i φ m ( u m ) F m * ( u m ) ] d 2 u m .
According to Equation (11), the derivative of the functional has the form
δ ε ( φ 1 , , φ n ) δ φ m = 2 Im [ w m ( u m ) e i φ m ( u m ) F m * ( u m ) ] .
When solving the problem of minimizing the functional (3) using the gradient method, the calculation of the phase functions of the DOEs is carried out iteratively. Let us describe the calculations performed at each iteration of the method. Let φ 1 k ( u 1 ) , , φ n k ( u n ) be the phase functions of the cascaded DOE obtained at the k-th iteration. Then, for the calculation of the next approximations of the phase functions, the following steps are performed:
(1) Using Equation (1) describing the direct propagation of the field, complex amplitudes of the fields w m ( u m ) e i φ m ( u m ) in the planes z = f m ,   m = 1 , , n and in the output plane z = f n + 1 are calculated.
(2) For the chosen optimization criterion, the function F n + 1 ( u n + 1 ) of Equation (6) is calculated, and, using Equations (7) and (8) describing the backpropagation of the field, the functions F j ( u j ) ,   j = n , n 1 , , 1 are found.
(3) Using Equation (12), the derivatives of the functional δ ε δ φ m ,   m = 1 , , n are calculated.
(4) New approximations of the phases are found as
φ m k + 1 ( u m ) = φ m k ( u m ) t k δ ε δ φ m ( u m ) ,     m = 1 , , n ,
where t k is the step of the gradient method.

4. Application of the Gradient Method to the Case of Several Incident Beams

The presented gradient method can be easily generalized to the problem, in which there are defined K > 1 different input distributions w 0 , j ( u 0 ) , j = 1 , , K (different incident beams), and, for each input distribution, the cascaded DOE has to generate a corresponding output intensity distribution I j ( u n + 1 ) . In this case, the following sum of functionals can be used as the error functional:
ε s e t ( φ 1 , , φ n ) = j = 1 K ε j ( φ 1 , , φ n ) ,
where the functionals ε j ( φ 1 , , φ n ) describe the difference of the intensity distributions I n + 1 , j ( u n + 1 ) generated for the input distributions w 0 , j ( u 0 ) from the required distributions I j ( u n + 1 ) . Without loss of generality, we can assume that these functionals are defined by Equation (2). Since the derivatives of the sum of functionals (14) simply equal the sum of the derivatives of these functionals
δ ε s e t ( φ 1 , , φ n ) δ φ m = j = 1 K δ ε j ( φ 1 , , φ n ) δ φ m ,   m = 1 , , n ,
the calculation of the derivatives of the functional of Equation (14) is also reduced to Equation (12). The calculation of new approximations of the phase functions at each iteration is carried out using a formula similar to Equation (13). The investigation of the performance of the presented method in the problem of the design of cascaded DOEs generating different intensity distributions at different incident beams is presented below in Section 6.1.
Let us note that the considered gradient method can also be easily generalized to the problem, in which the required intensity distributions I j ( u n + 1 ) are defined in different output planes located at different distances from the output DOE.

5. Application of the Gradient Method to the Image Classification Problem

Let us now consider the application of the developed gradient method to the design of cascaded DOEs performing optical image classification. Let the amplitude images of objects belonging to L different classes (for example, the images of handwritten digits) be generated in the input plane z = 0 . The generated light field then propagates through the cascaded DOE and comes to the output plane z = f n + 1 . Let L spatially separate regions G i corresponding to the images of different classes be defined in the output plane. At each input distribution (image), certain energy distribution E i ,   i = 1 , , L is generated in these regions, where E i corresponds to the integral of the generated intensity distribution over the region G i . In this case, the problem of designing a cascaded DOE for classifying images can be formulated as a problem of calculating such phase functions φ 1 ( u 1 ) , , φ n ( u n ) of the cascaded DOE, so that for an “input signal” corresponding to an image of a certain j-th class, the maximum of the generated energies E i ,   i = 1 , , L is achieved in the corresponding region G j [3,5].
In the problems of calculating cascaded DOEs for image classification, approaches typical for the design of artificial neural networks are used [3,5,19,20,21]. In this case, for the design (training) of the cascaded DOE, a training data set is used, which contains a number of input distributions corresponding to the images of objects belonging to different classes. Due to the large size of the training set, usually, for performing a training step, a smaller set (batch) of distributions is randomly chosen from the whole set, for which the derivatives of the error functional are calculated. One can show that the expectations of the derivatives calculated over a batch are proportional to the derivatives calculated using the whole training set, which enables considering this approach as a stochastic gradient method.
The training of a cascaded DOE on a particular batch corresponds to the gradient method in the case of several incident beams. Indeed, the error functional in the case of training on a batch can be defined in the form of Equation (14), where K is the batch size, and the functionals ε j ( φ 1 , , φ n ) represent the classification errors of different classes included in the batch. The difference of the image classification problem from the problem of generating different intensity distributions for different incident beams consists mainly in the form of the functionals ε j ( φ 1 , , φ n ) . In the following subsections, we will consider two error functionals used for the solution of the classification problem and will show that the calculation of the derivatives of these functionals is also reduced to the general Formula (12).

5.1. Quadratic Error Functional

Let w 0 , j ( u 0 ) be an input distribution corresponding to some image of the j-th class. The energy values in the regions G k of the output plane in this case have the form
E k = I n + 1 ( u n + 1 ) χ k ( u n + 1 ) d 2 u n + 1 ,     k = 1 , , L . ,
where χ k ( u n + 1 ) is the indicator function of the region G k . For recognizing (i.e., correctly classifying) the input image w 0 , j ( u 0 ) , it is necessary for the energy E j in the corresponding region G j to be “large”, with the energies in the rest of the regions being close to zero. Accordingly, the following quadratic functional can be utilized as the error functional for recognizing an input image of the j-th class:
ε j ( φ 1 , , φ n ) = k = 1 L ( E k E max δ k , j ) 2 ,
where δ k , j is the Kronecker delta and E max is the maximum possible energy value. As for the E max value, one can, for example, use the total energy of the input distribution E max = | w 0 , j ( u 0 ) | 2 d 2 u 0 .
Let us demonstrate that the calculation of the derivatives of the functional ε j ( φ 1 , , φ n ) is very similar to the calculation of the derivatives of the “general” functional of Equation (2) considered in Section 3. Indeed, let Δ m ε j ( φ 1 , , φ n ) be the increment of the functional of Equation (17) caused by an increment Δ φ m of the function φ m . According to Equation (17), this increment has the form
Δ m ε j ( φ 1 , , φ n ) = 2 k = 1 L ( E k E max δ k , j ) ( Δ m E k ) = 2 k = 1 L ( E k E max δ k , j ) Δ m ( w n + 1 ( u n + 1 ) w n + 1 * ( u n + 1 ) ) χ k ( u n + 1 ) d 2 u n + 1 = 4 Re [ ( Δ m w n + 1 ( u n + 1 ) )   w n + 1 * ( u n + 1 ) k = 1 L χ k ( u n + 1 ) ( E k E max χ j ( u n + 1 ) ) d 2 u n + 1 ] = 4 Re Δ m w n + 1 ( u n + 1 ) , F n + 1 ( u n + 1 ) ,
where
F n + 1 ( u n + 1 ) = w n + 1 ( u n + 1 ) k = 1 L χ k ( u n + 1 ) ( E k E max χ j ( u n + 1 ) ) .
Similarly to Equation (5), we obtained the increment of the functional Δ m ε j ( φ 1 , , φ n ) in the form of a scalar product. Thus, the derivatives of the functional ε j ( φ 1 , , φ n ) are also defined by Equation (12), where the functions F m ( u m ) are calculated through the backpropagation of the field of Equation (19).

5.2. Cross Entropy Functional

In the classification problems, the so-called softmax cross entropy is used as a criterion [19,20]. In this case, the following error functional is used for recognizing an input distribution belonging to the j-th class w 0 , j ( u 0 ) :
ε j ( φ 1 , , φ n ) = ln [ exp ( E j ) k = 1 L exp ( E k ) ] ,
where E k are the energies in the regions G k defined by Equation (16). Let us note that Equation (20) is close to zero when the energy in the required region G j is much greater than the energies in the other regions.
Let us consider the increment of the functional (20) caused by an increment Δ φ m of the function φ m . By carrying out transformations similar to those presented above, it is easy to obtain the increment of the functional as
Δ m ε j ( φ 1 , , φ n ) = 4 Re [ ( Δ m w n + 1 ( u n + 1 ) ) F n + 1 * ( u n + 1 ) d 2 u n + 1 ] = 4 Re Δ m w n + 1 ( u n + 1 ) , F n + 1 ( u n + 1 ) ,
where
F n + 1 ( u n + 1 ) = 2 w n + 1 ( u n + 1 ) [ k = 1 L exp ( E k ) χ k ( u n + 1 ) χ j ( u n + 1 ) k = 1 L exp ( E k ) ] ( k = 1 L exp ( E k ) ) 1 .
As in the previous case, we obtained the increment of the functional Δ m ε j ( φ 1 , , φ n ) as a scalar product. Accordingly, the derivatives of the functional (20) are also defined by Equation (12), where the functions F m ( u m ) are calculated through the backpropagation of the field of Equation (22).
Thus, the calculation of the phase functions of the cascaded DOE in the problem of image classification consists of the following. For the current batch, the gradient of the functional (14) is calculated, where the calculation of the derivatives of the terms is carried out using Equations (12) and (19) or Equations (12) and (22) depending on the chosen criterion. After calculating the derivatives of the functional (14), the phase functions are corrected using a formula similar to Equation (13). Then, the next batch is considered and the process is repeated. The investigation of the performance of the proposed method in the problem of classifying handwritten digits is presented below in Section 6.2.

6. Numerical Examples of Cascaded DOE Design

In the previous two sections, we considered the application of the proposed gradient method to the problems of calculating cascaded DOEs for the generation of required intensity distributions (for several incident beams) and for optical image classification. In the present section, numerical examples illustrating the performance of the method in the indicated problems are presented. In Section 6.1, we discuss the design of cascaded DOEs for generating different intensity distributions at different angles of incidence of the input beam, and Section 6.2 is dedicated to the design of DOEs for classifying handwritten digits.

6.1. Design of Cascaded DOEs for Focusing Different Incident Beams to Different Regions

Let in the input plane of the cascaded DOE, four input distributions w 0 , j ( u 0 ) , j = 1 , 2 , 3 , 4 be defined, which correspond to Gaussian beams with the radius at the 1 / e 2 level equal to 2 σ = 2.3   mm and the wavelength λ = 532   nm , incident on this plane from different directions. Let the vectors defining the propagation directions of the beams w 0 , 1 ( u 0 ) and w 0 , 2 ( u 0 ) lie in the plane u 0 z and make angles ± θ = ± 0.16 ° with the z axis, and the corresponding vectors of the beams w 0 , 3 ( u 0 ) and w 0 , 4 ( u 0 ) lie in the plane v 0 z and also make angles ± θ with the z axis. The complex amplitudes of these beams in the plane z = 0 have the form
w 0 , 1 ( u 0 ) = exp ( u 0 2 2 σ 2 ) exp ( + i 2 π λ u 0 sin θ ) ,     w 0 , 2 ( u 0 ) = exp ( u 0 2 2 σ 2 ) exp ( i 2 π λ u 0 sin θ ) , w 0 , 3 ( u 0 ) = exp ( u 0 2 2 σ 2 ) exp ( i 2 π λ v 0 sin θ ) ,   w 0 , 4 ( u 0 ) = exp ( u 0 2 2 σ 2 ) exp ( + i 2 π λ v 0 sin θ ) .
Let us consider the calculation of cascaded DOEs generating in the output plane z = 600   mm different uniform intensity distributions I j ( u n + 1 ) , j = 1 , 2 , 3 , 4 for the incident beams of Equation (23). The four output distributions are centered at the origin of coordinates and correspond to a circle with the diameter of 2.3 mm, contour of a square with the side of 2.3 mm, a cross consisting of two perpendicular segments with the length of 2.3 mm, and a “rotated cross” consisting of two diagonals of the square with the side of 2.3 mm (Figure 2). The thickness of the lines of the required output intensity distributions amounts to 0.2 mm.
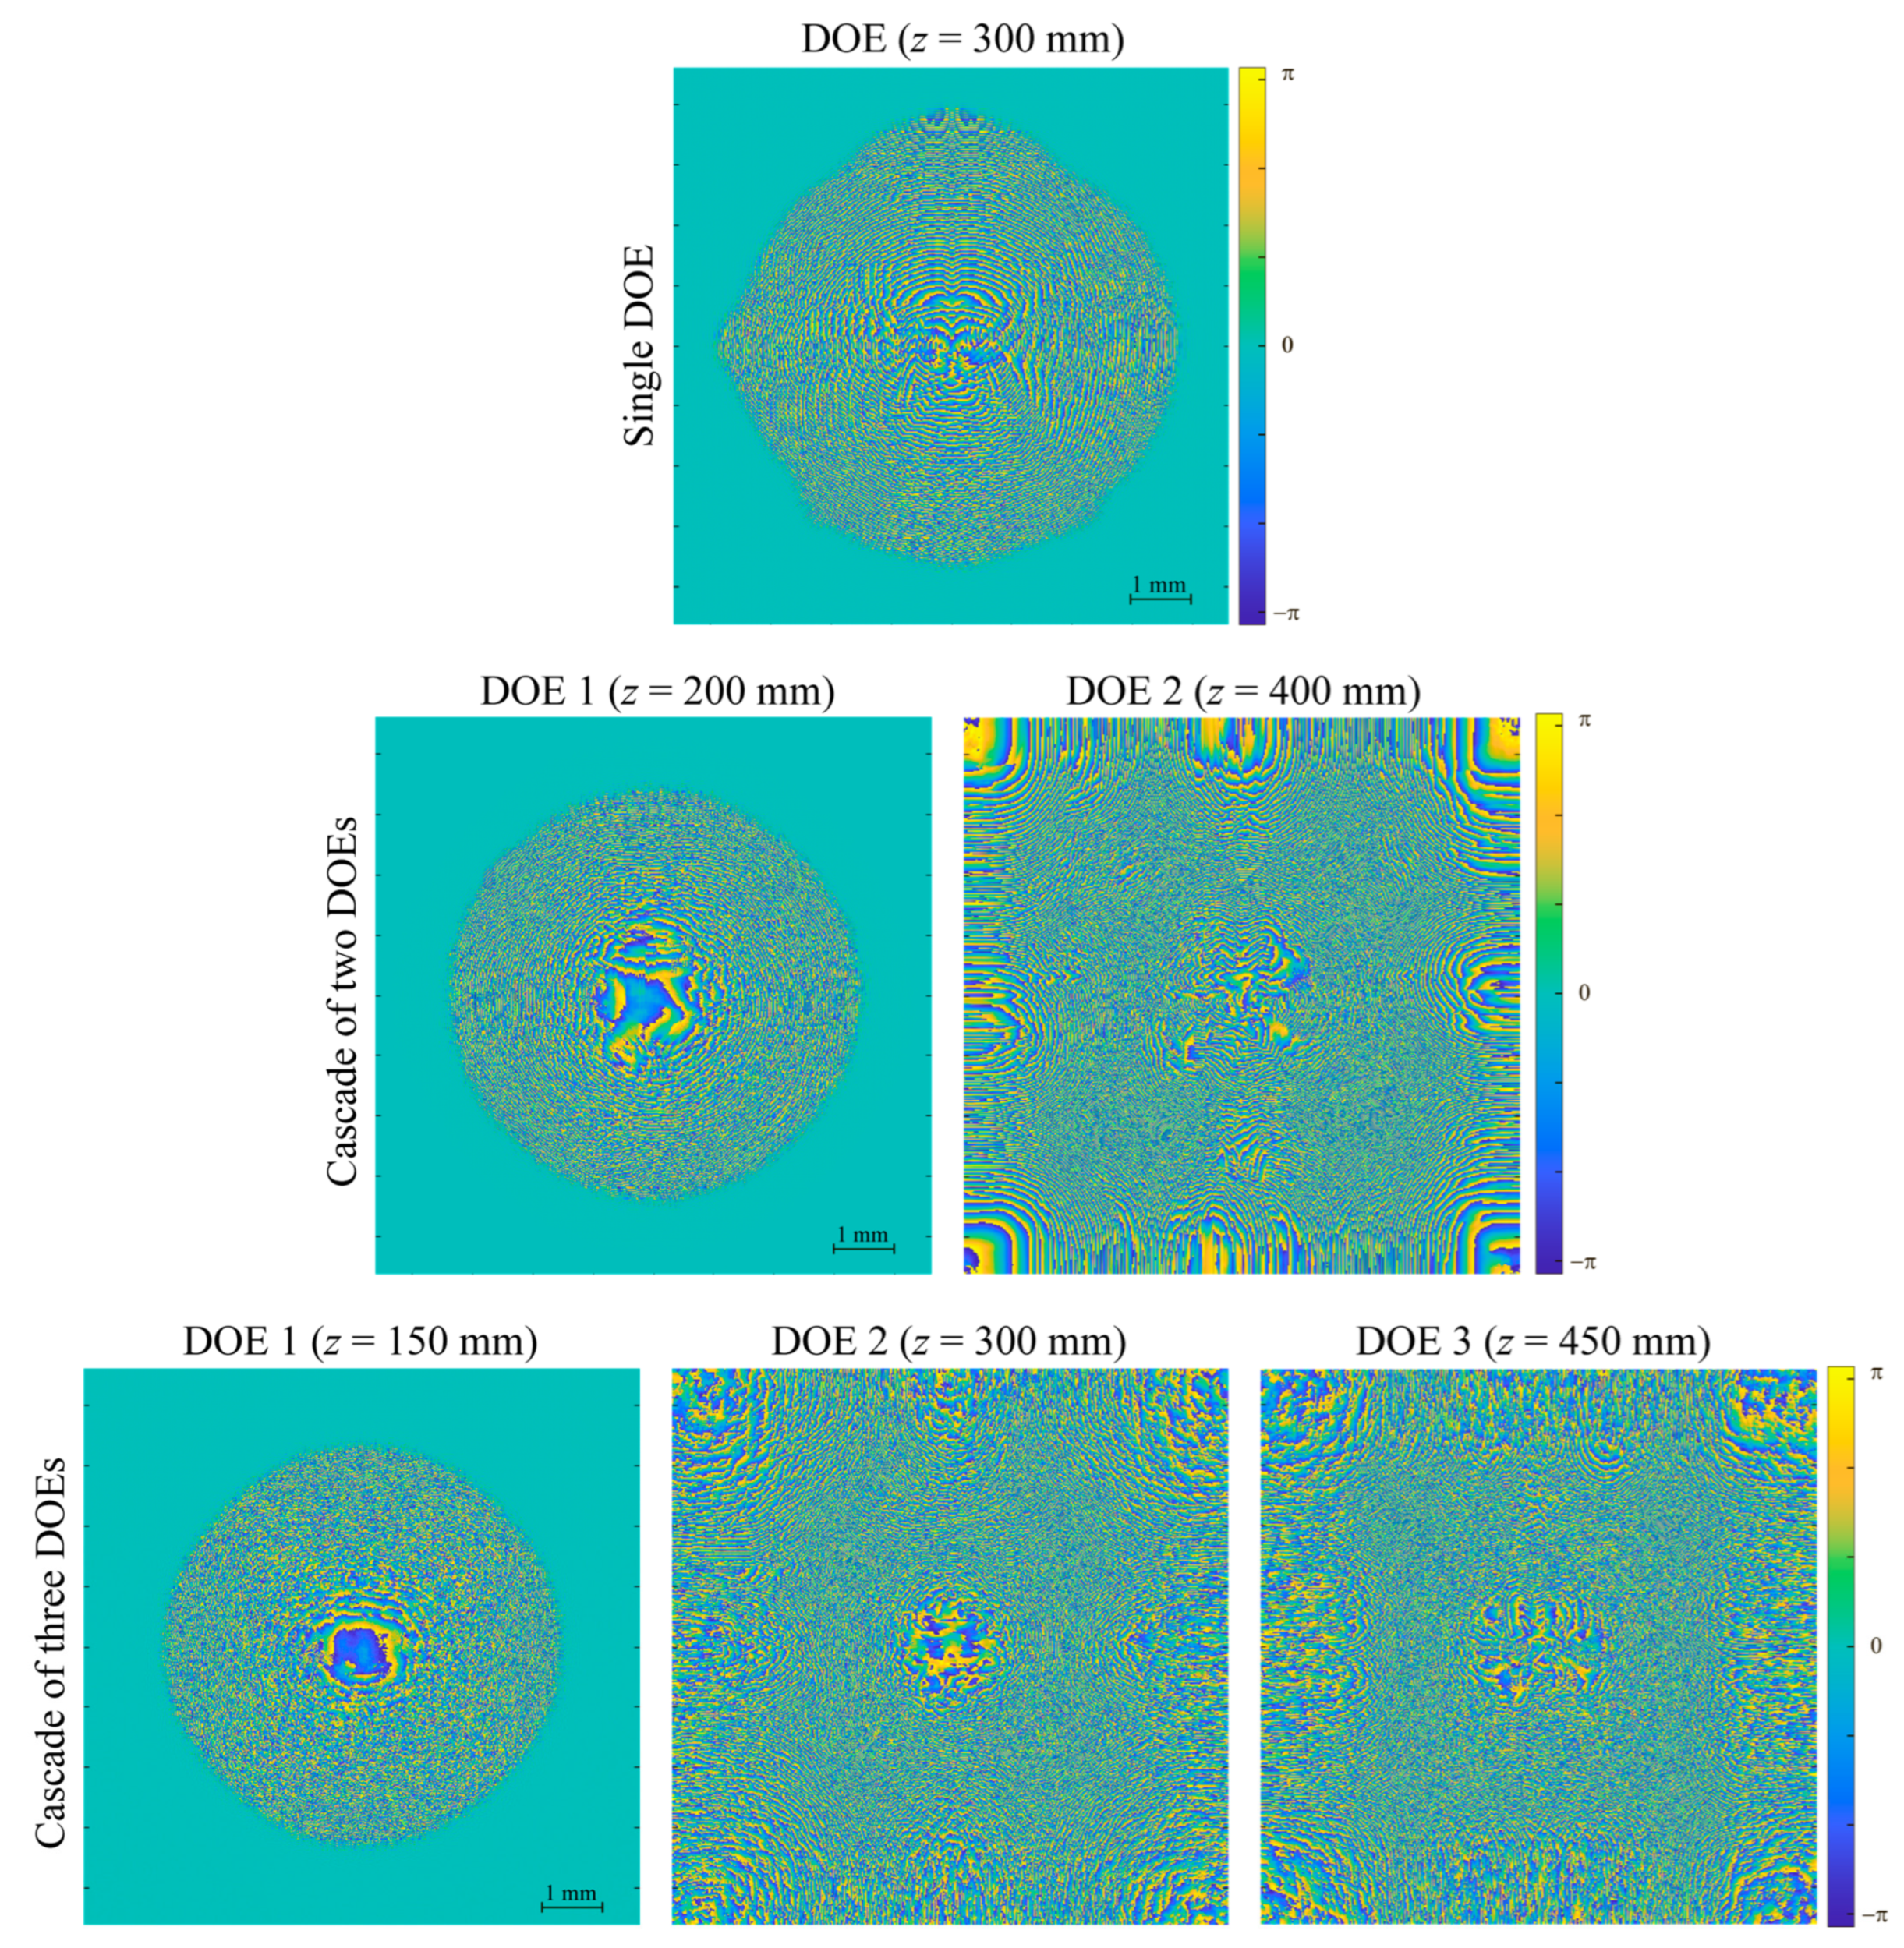
We will consider three design examples: a single DOE (located in the plane z = f 1 = 300   mm ) and cascaded DOEs consisting of two DOEs (located at z = f 1 = 200   mm and z = f 2 = 400   mm ) and three DOEs (located at z = f 1 = 150   mm , z = f 2 = 300   mm , and z = f 3 = 450   mm ). We will define the phase functions in the DOE planes on 512 × 512 grids with the step of d = 18   μ m (these parameters correspond to some of the available spatial light modulators, which can be used as DOEs). In this case, the side length of the square aperture of each DOE amounts to 9.216 mm.
Let us note that at the chosen parameters, the incident beams strongly overlap in the planes of the DOEs. For example, after the propagation to the plane z = 300   mm , the centers of the beams are displaced from the optical axis (the z axis) only by 300   t g θ 0.83   mm , which is significantly smaller than the radius of the beams. This overlap of the incident beams significantly complicates the problem of calculating the cascaded DOE.
The calculation of the phase functions of the DOE was carried out using the gradient method described above. As the error functional, the sum of functionals (14) was used, where the functionals ε j ( φ 1 , , φ n ) representing the difference between the required distributions and the ones generated at the input fields w 0 , j ( u 0 ) were defined as
ε j ( φ 1 , , φ n ) = [ I n + 1 , j ( u n + 1 ) I j ( u n + 1 ) ] 2 d 2 u n + 1 .
At each iteration, the derivatives of the error functional were calculated, which, according to Equation (17), correspond to the sum of derivatives of the functionals ε j ( φ 1 , , φ n ) . The calculation of the derivatives of the functionals ε j ( φ 1 , , φ n ) was carried out using Equation (12), where w m ( u m ) = w m , j ( u m ) is the complex amplitude of the field incident on the m-th DOE in the case of the direct propagation of the incident beam w 0 , j ( u 0 ) , and the function F m ( u m ) = F m , j ( u m ) is calculated through the backpropagation of the field
F n + 1 , j ( u n + 1 ) = 2 [ I n + 1 , j ( u n + 1 ) I j ( u n + 1 ) ] w n + 1 , j ( u n + 1 ) ,
where w n + 1 , j ( u n + 1 ) is the complex amplitude of the field in the output plane. In the optimization, the calculation of the functions w m , j ( u m ) and F m , j ( u m ) featured in the expressions for the derivatives of the functionals was based on the numerical calculation of the Fresnel–Kirchhoff integrals using the fast Fourier transform routine.
Figure 3 shows the calculated phase functions of one, two, and three DOEs. For the calculation of each example, 8000 iterations with an exponentially decreasing step were performed (such a number of iterations turned out to be sufficient for the convergence of the method). As initial values, phases equal to zero at the whole aperture were used. The calculation time on a standard PC (Intel Core i9 10920X CPU, 3.50 GHz) was from 30 min for the single DOE to approximately one hour for the cascade of three DOEs.
One can see that the calculated phase functions of the single DOE and of the first DOEs in the cascaded structures are close to zero (to the initial phase value) near the edges of the aperture. This is caused by the fact that the amplitude of the fields generated in the plane of the first DOE in the case of the input beams of Equation (23) is close to zero in the peripheral regions of the aperture. Since the derivatives of the error functional are close to zero in the regions with a small amplitude of the field, the phase functions changed only weakly in these regions and remained close to the initial zero value.
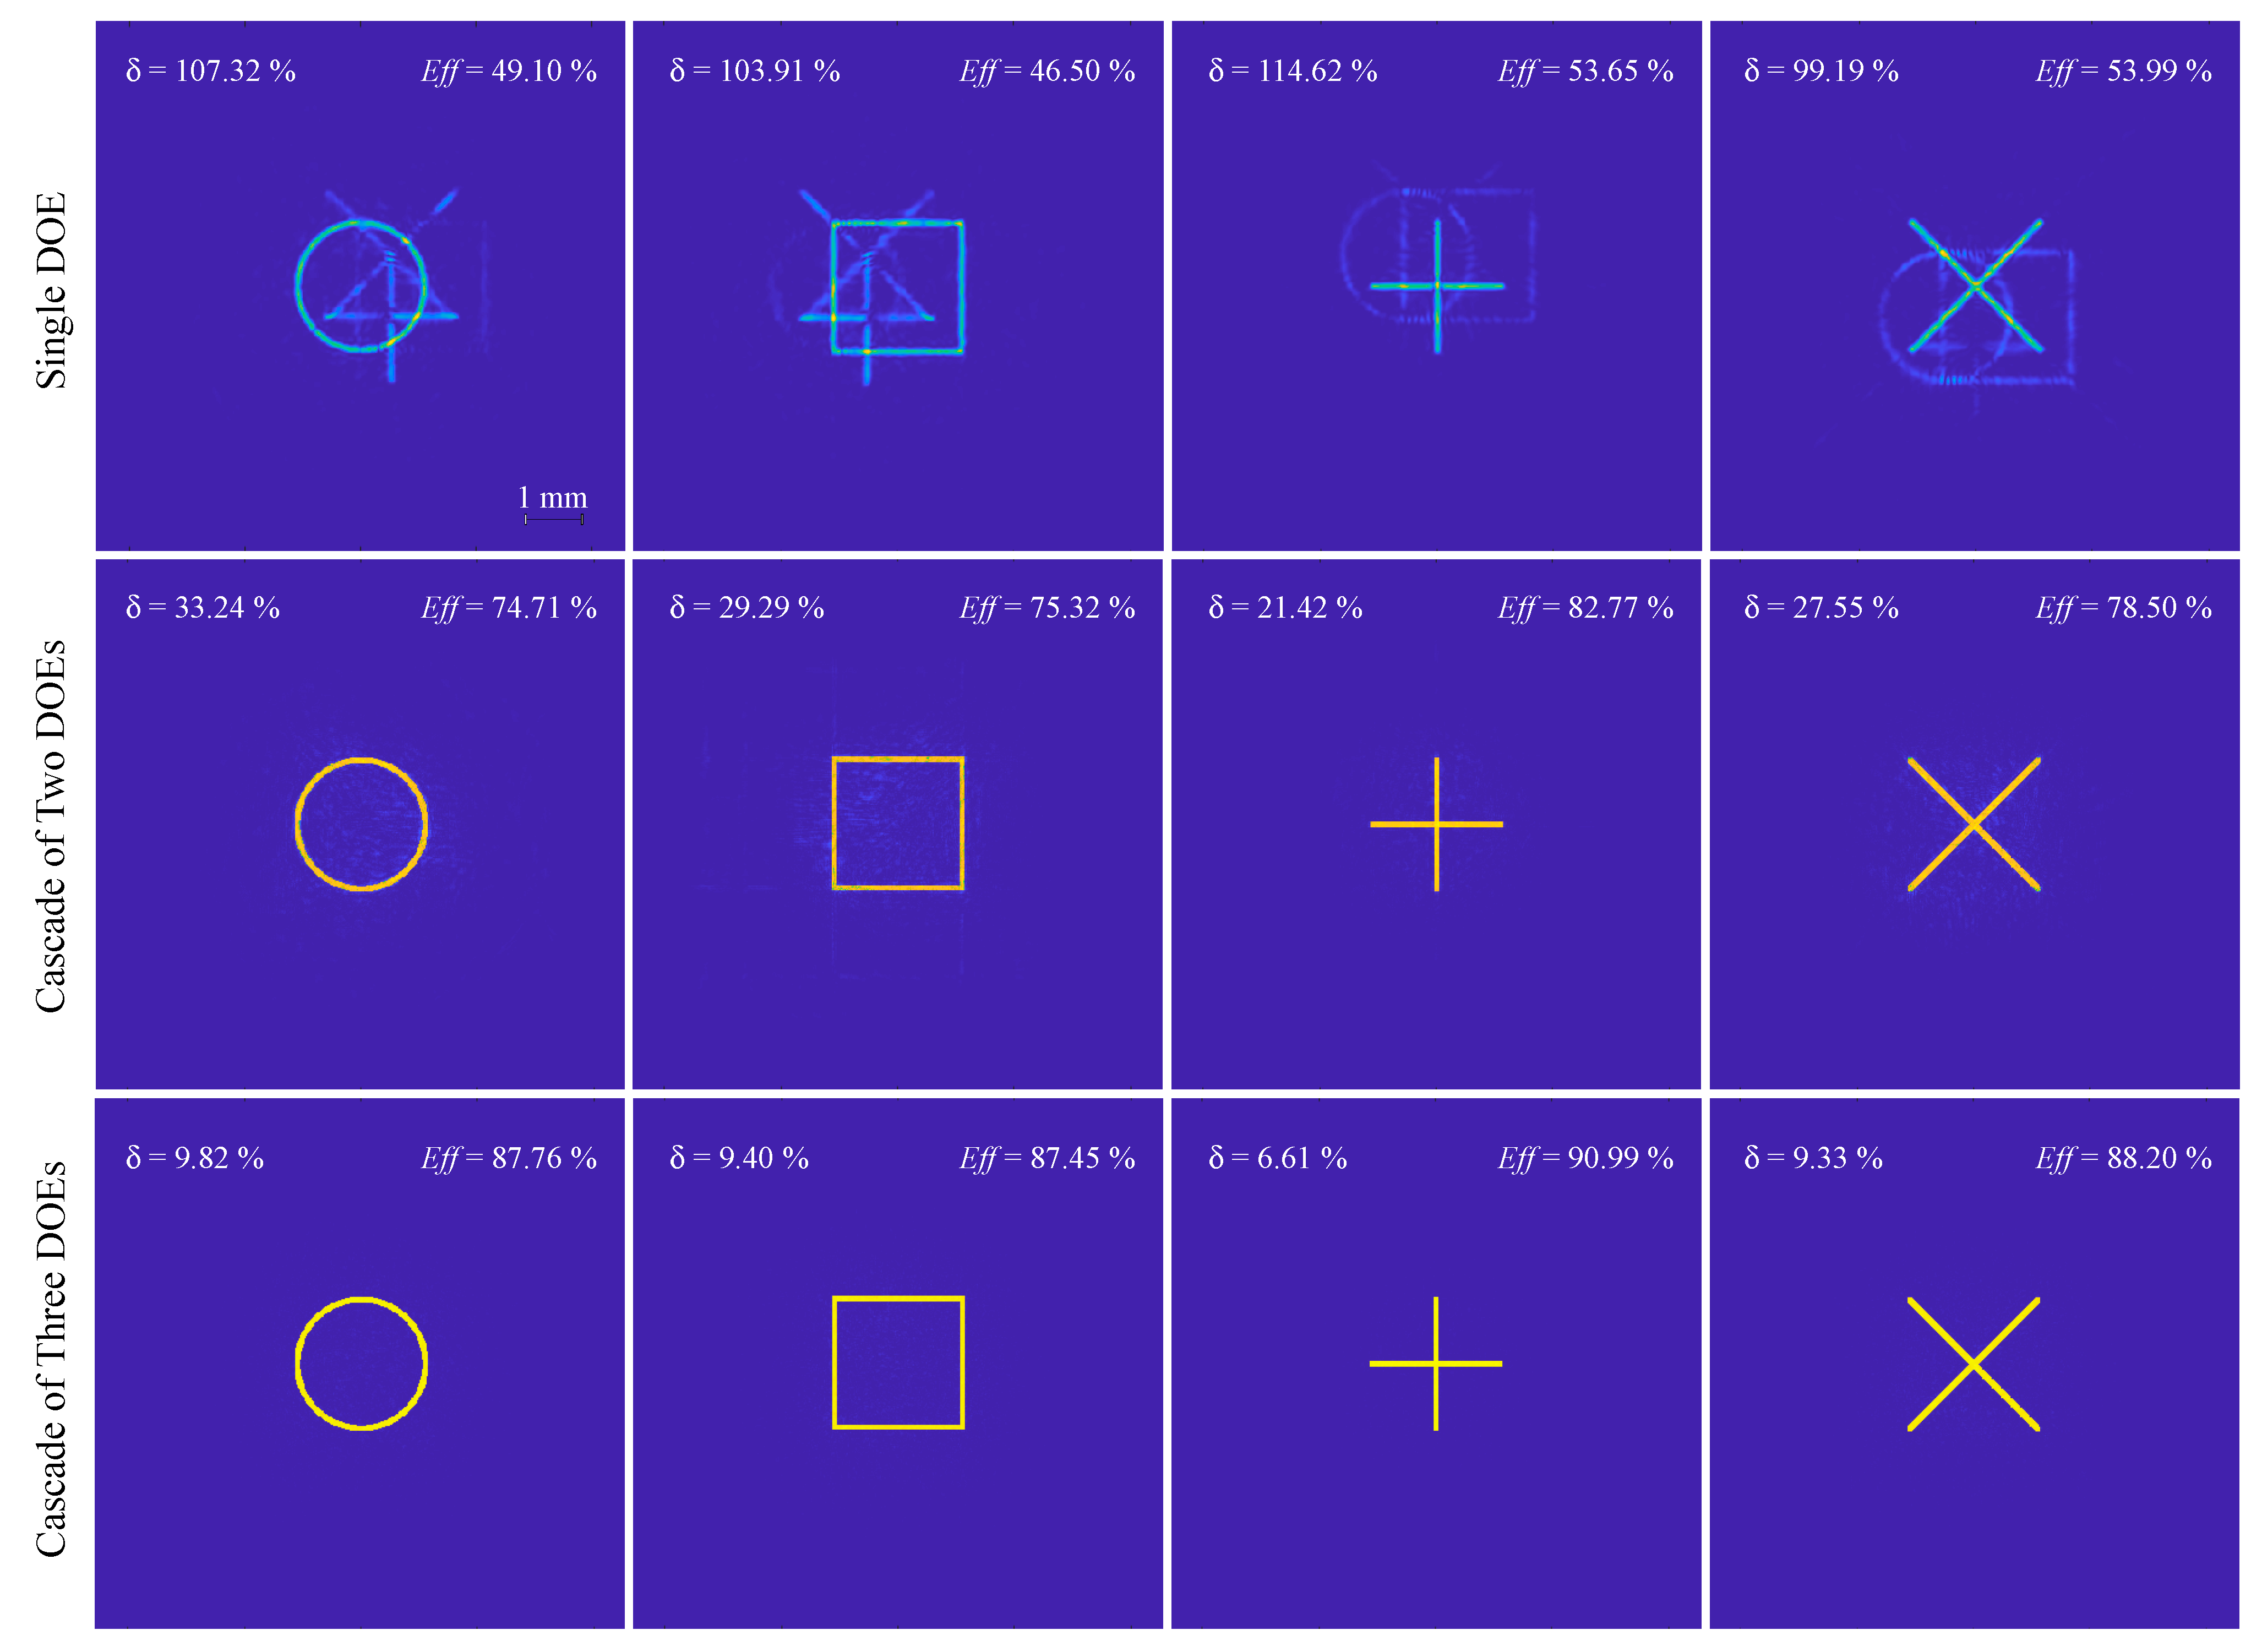
Figure 4 shows the calculated intensity distributions generated by the calculated single and cascaded DOEs at different incident beams of Equation (23). In order to characterize the quality of the generated distributions, let us use the energy efficiencies E f f j and root-mean-square errors δ j . The energy efficiencies
E f f j = 1 E 0 , j G j I n + 1 , j ( u n + 1 ) d 2 u n + 1
describe the fraction of the energy E 0 , j = | w 0 , j ( u 0 ) | 2 d 2 u 0 of the j-th incident beam, which arrives to the required region G j = { u n + 1 |     I j ( u n + 1 ) 0 } . The root-mean-square errors
δ j = 1 M j 1 G G [ I n + 1 , j ( u n + 1 ) E f f j I j ( u n + 1 ) ] 2 d 2 u n + 1
describe the root-mean-square deviation of the distribution I n + 1 , j ( u n + 1 ) generated for the j-th incident beam from the required distribution I j ( u n + 1 ) in the region G covering all the required regions G j and corresponding to a square with the side of 3 mm centered at the origin of coordinates. Here, G is the area of the region G and M j = 1 G G I n + 1 , j ( u n + 1 ) d 2 u n + 1 is the average intensity in this region. The values of the energy efficiencies and root-mean-square errors for the designed DOE examples are presented in Figure 4 above each of the calculated intensity distributions.
From Figure 4, it is evident that the quality of the generated distributions increases with an increase in the number of DOEs. In particular, for the single DOE, the required distributions are generated with extremely large root-mean-square errors (being close to or even exceeding 100%) and at relatively low energy efficiencies (less than 54%). For a cascaded structure containing three DOEs, the root-mean-square error significantly decreases (the maximum error, which corresponds to the distribution I 1 ( u n + 1 ) , amounts to 9.8%), and the energy efficiency exceeds 87%.
Thus, the presented examples demonstrate the advantages of cascaded DOEs over single ones in the problem of generating different required intensity distributions for different incident beams and confirm the high performance of the proposed design method.

6.2. Design of Cascaded DOEs for Classifying Handwritten Digits

In this subsection, we will consider the design of DOEs for classifying handwritten digits from the MNIST database [25]. Let us start by considering the case of a single DOE. In the calculations, the input images of the digits were defined on a 56 × 56 grid with the step of d = 18   μ m . The phase function of the DOE was defined on a 512 × 512 grid with the same step. Let the DOE and the output plane be located at z = f 1 = 300   mm and z = f 2 = 600   mm , respectively. Let us note that at the design wavelength λ = 532   nm , the diffraction angle at a pixel of the input distribution amounts to φ = arcsin ( λ / d ) 1.7 ° . In this case, the diffraction pattern from the pixel (with respect to the first minimum) at the distance f 1 = 300   mm roughly covers the DOE aperture. In this regard, the chosen parameters ensure the “connection” of each pixel of the input image with all the pixels (grid nodes), at which the phase function of the DOE is defined.
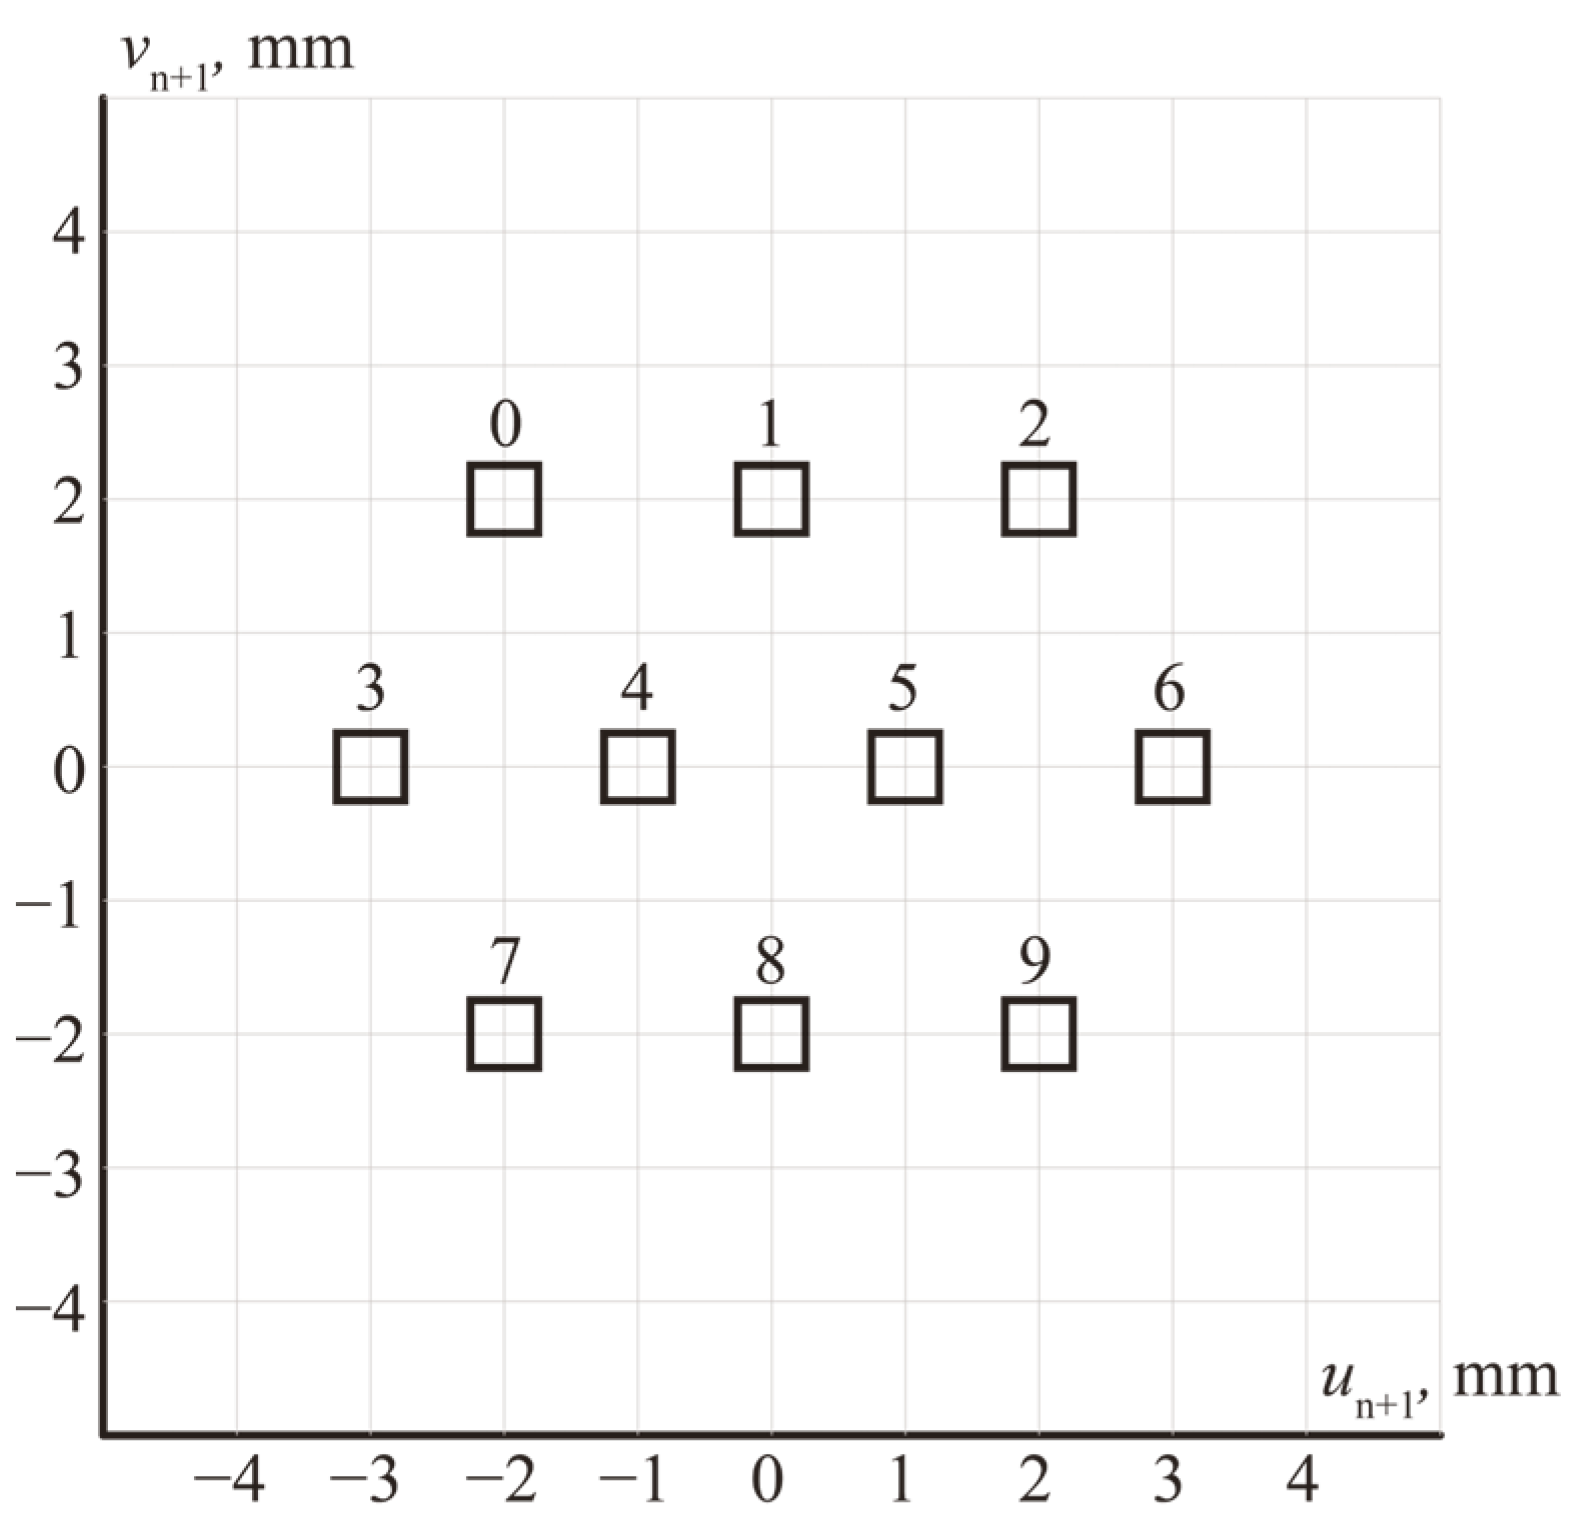
In accordance with the design method, in the output plane, 10 spatially separated square regions G j with the side length of 0.5 mm were defined, in which maximum energies for different input images of different digits have to be generated (see Figure 5).
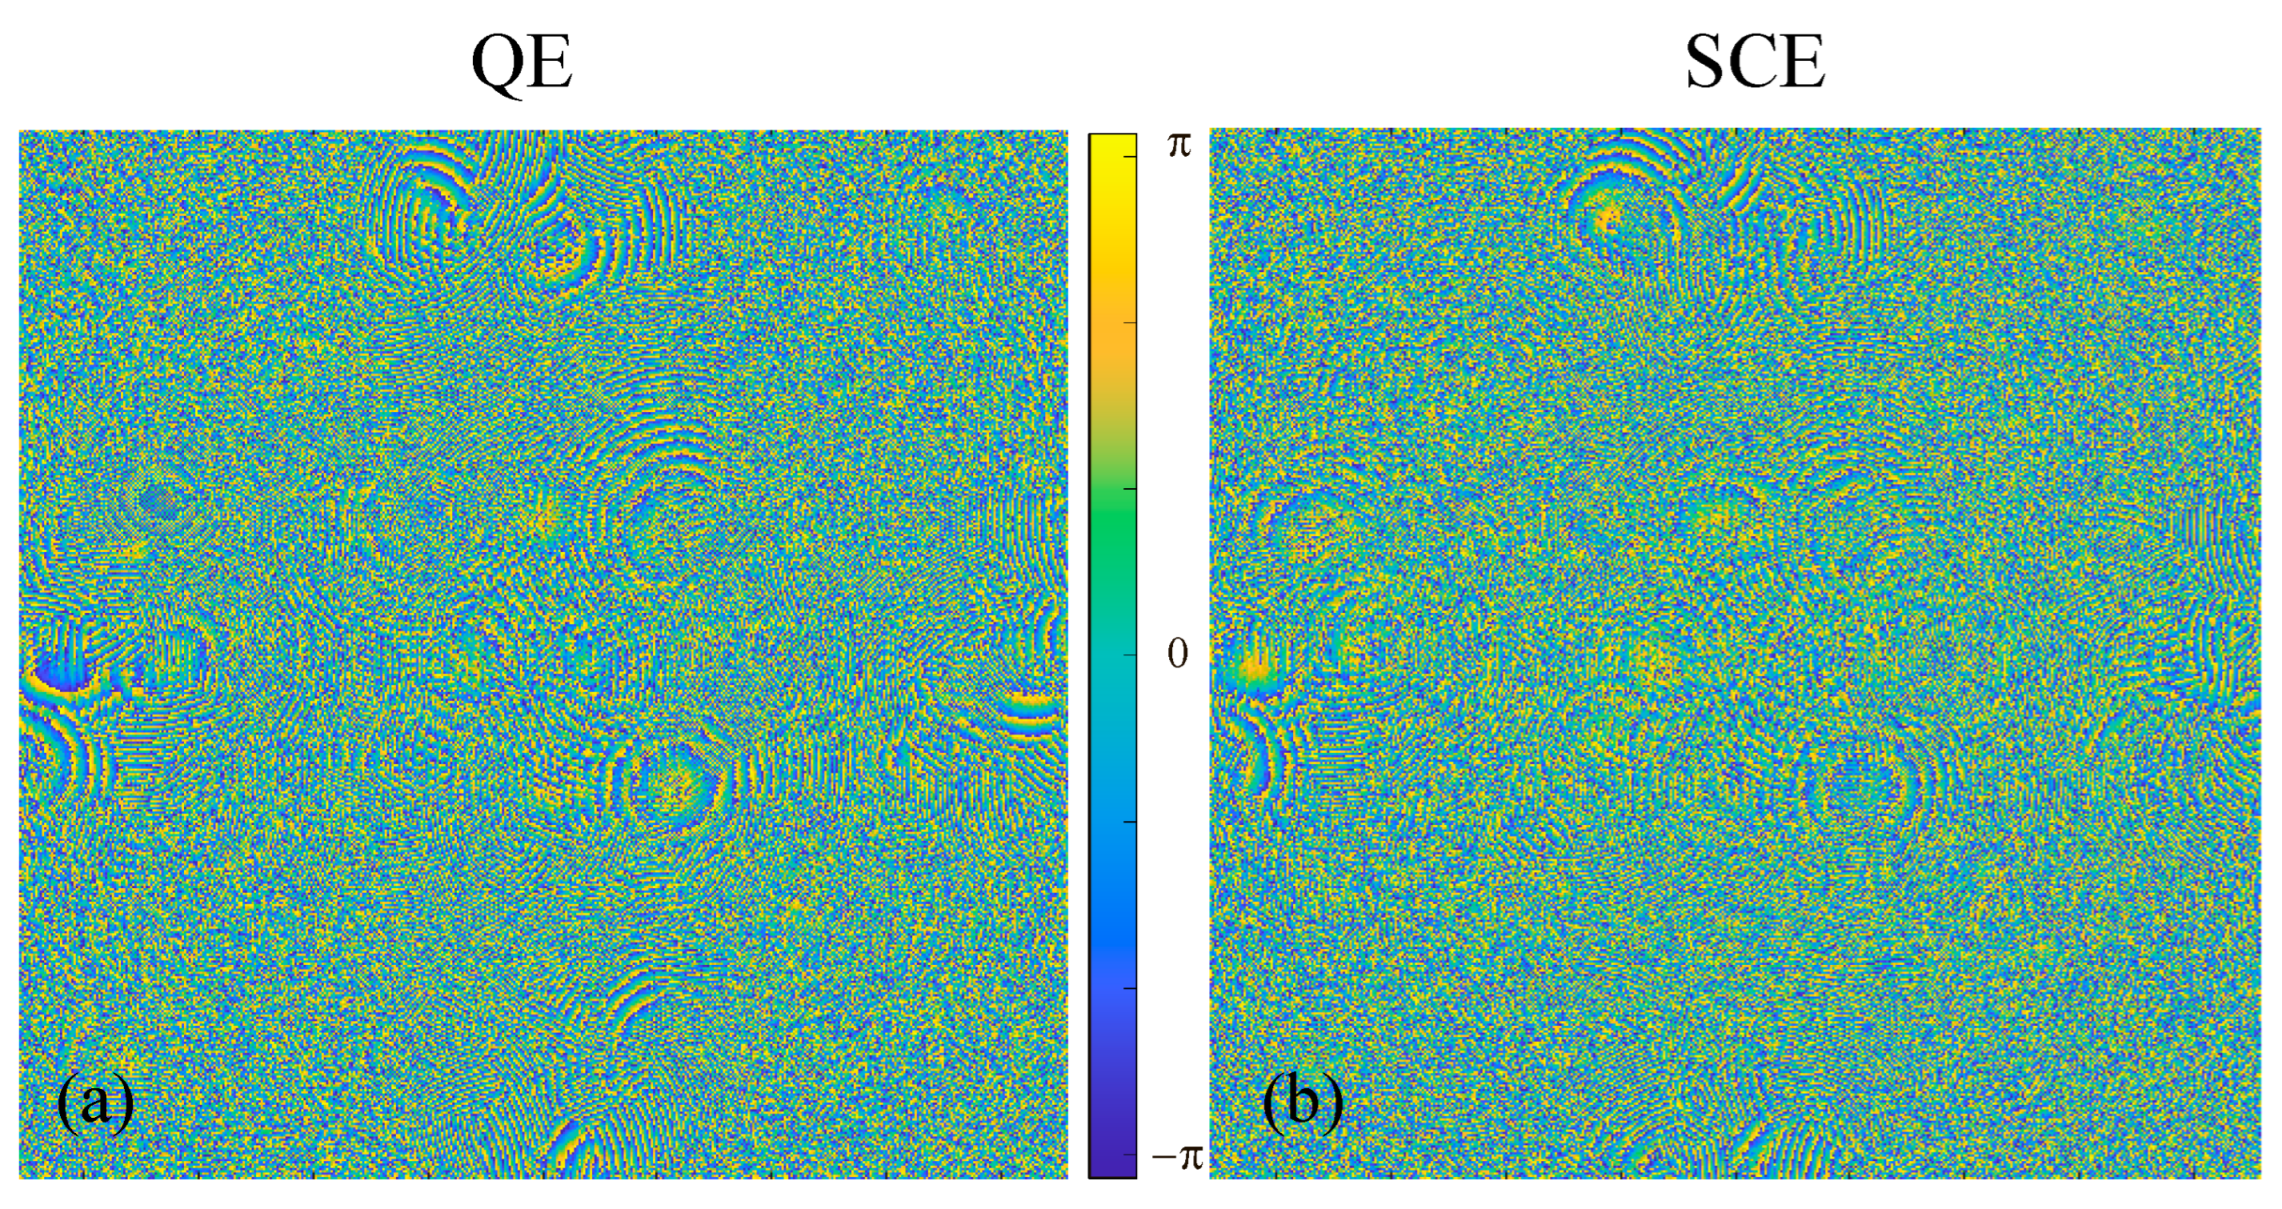
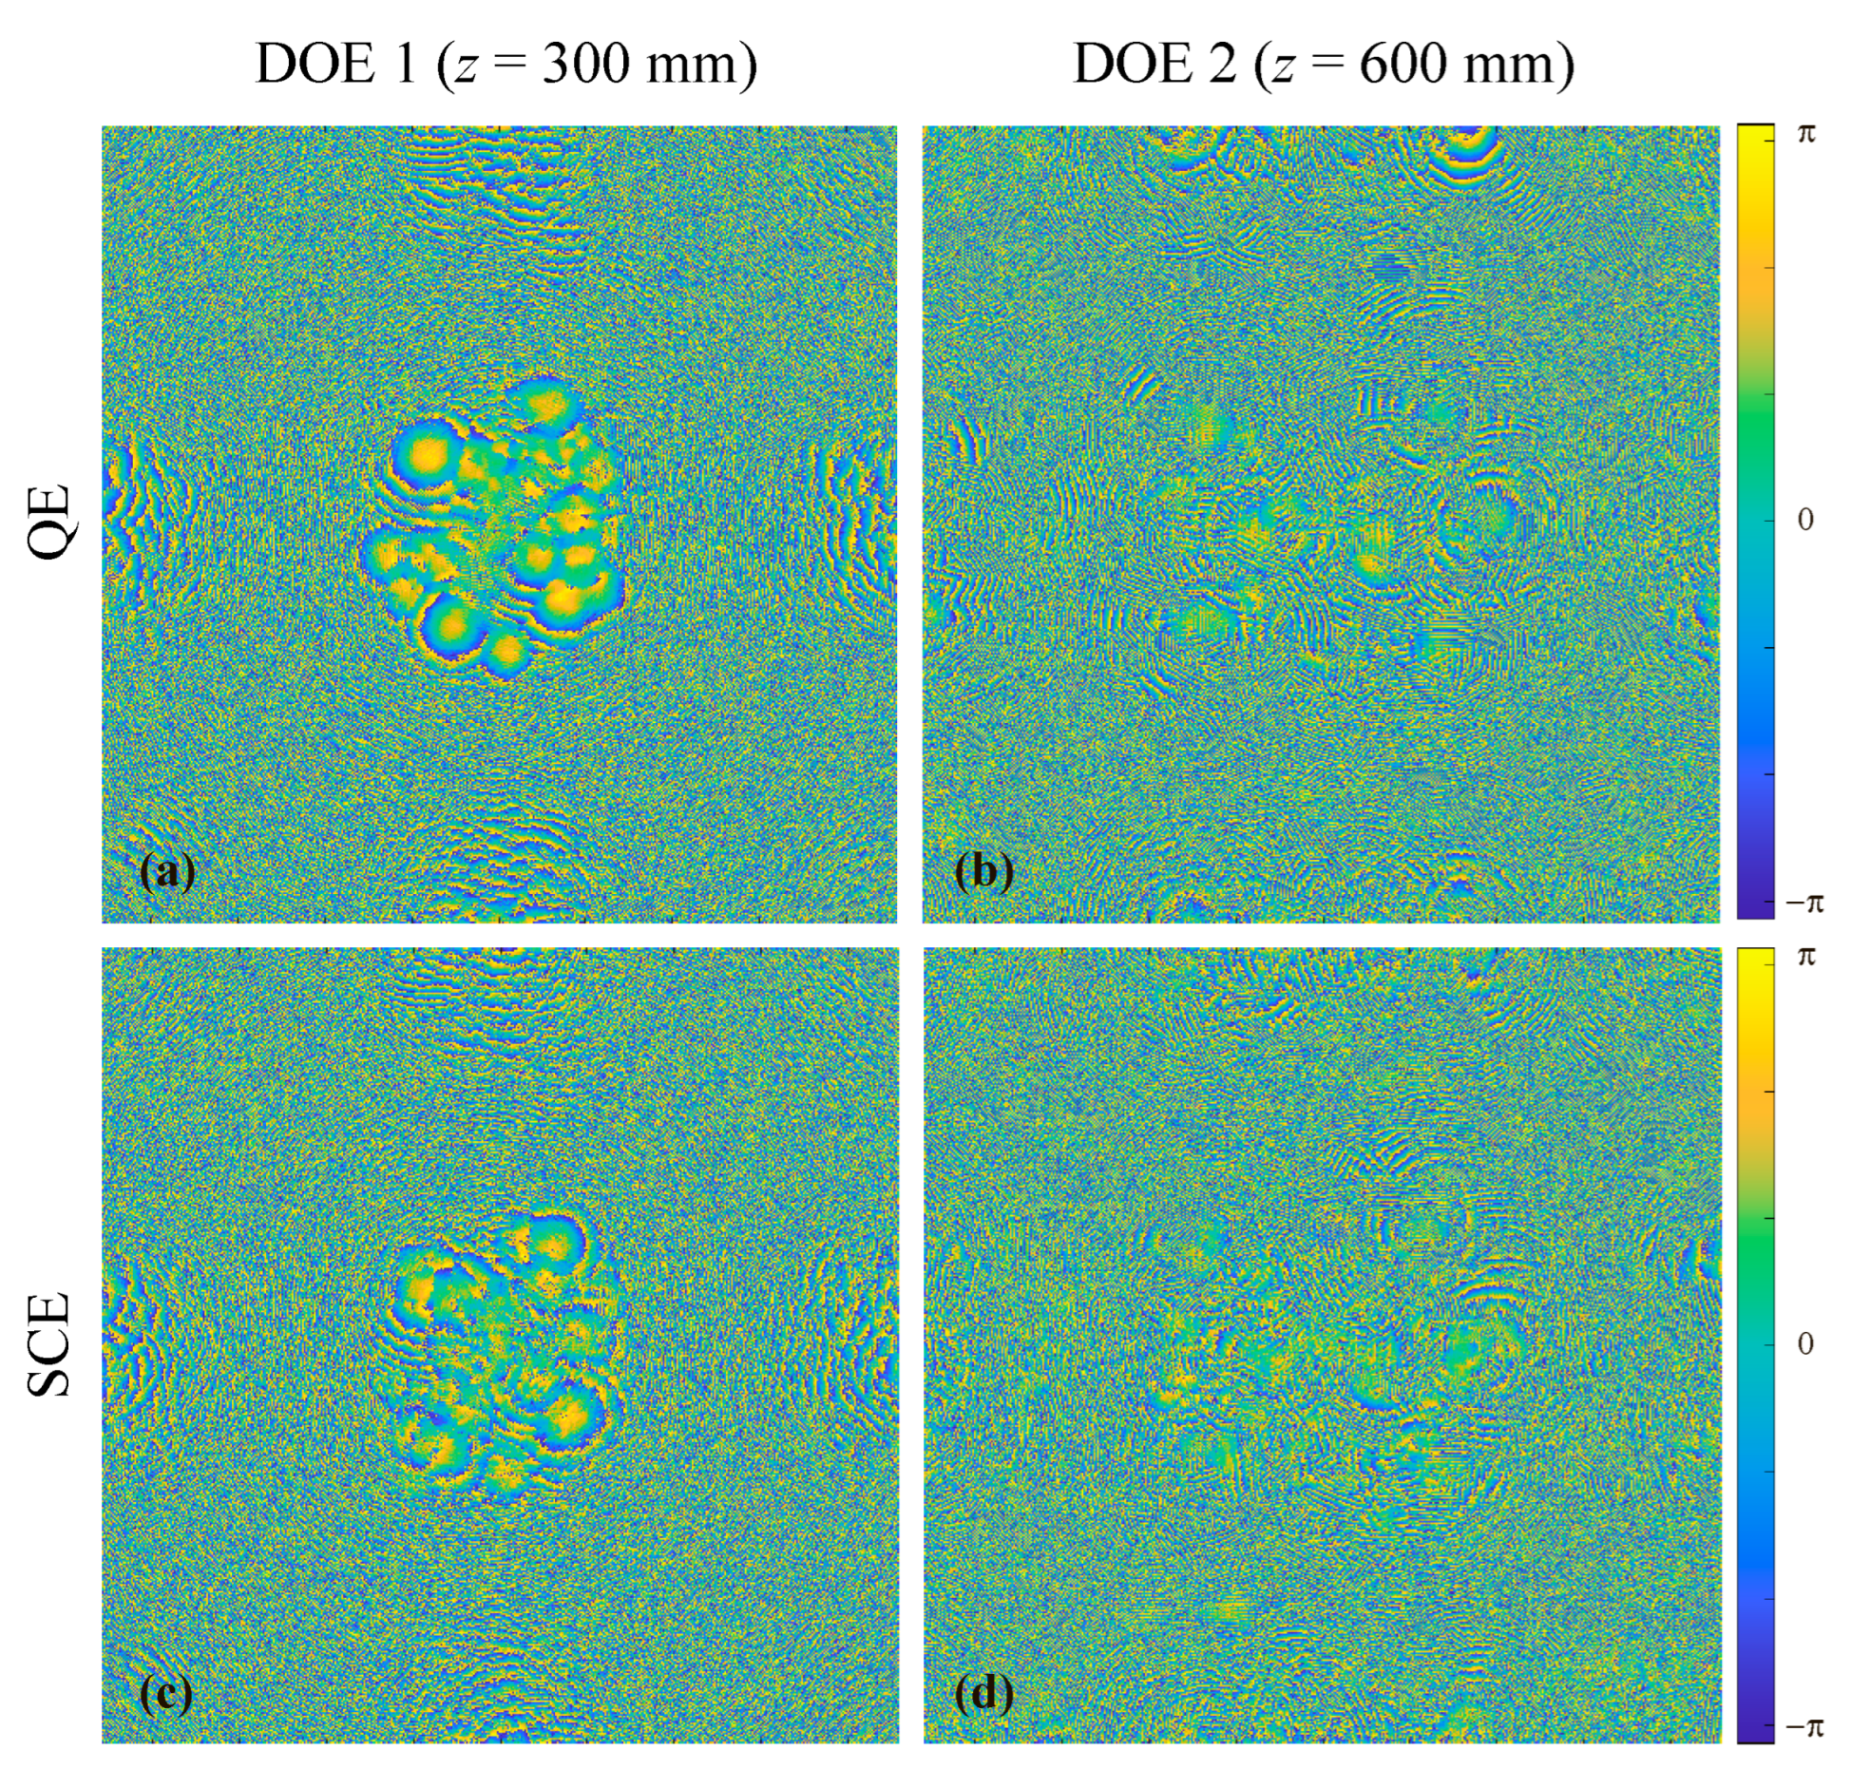
In the calculation, a training set containing 60,000 images of digits from the MNIST database was used. The DOE was calculated using batch training, with each batch containing 60 randomly chosen digits. As the error functionals, the quadratic error (QE) functional of Equations (14) and (17) and the softmax cross entropy (SCE) functional of Equations (14) and (20) were used. As the initial approximation for the DOE phase function, a random phase from the range [ 0 ,   2 π ) was chosen. In the DOE calculation, 10 epochs were performed, which takes approximately 7 min on a NVIDIA GTX 1070 8 Gb graphics card. Under an epoch, we understand the training of the DOE on 1000 batches containing all the images from the training set. The phase functions of the DOEs calculated using the QE and SCE criteria are shown in Figure 6.
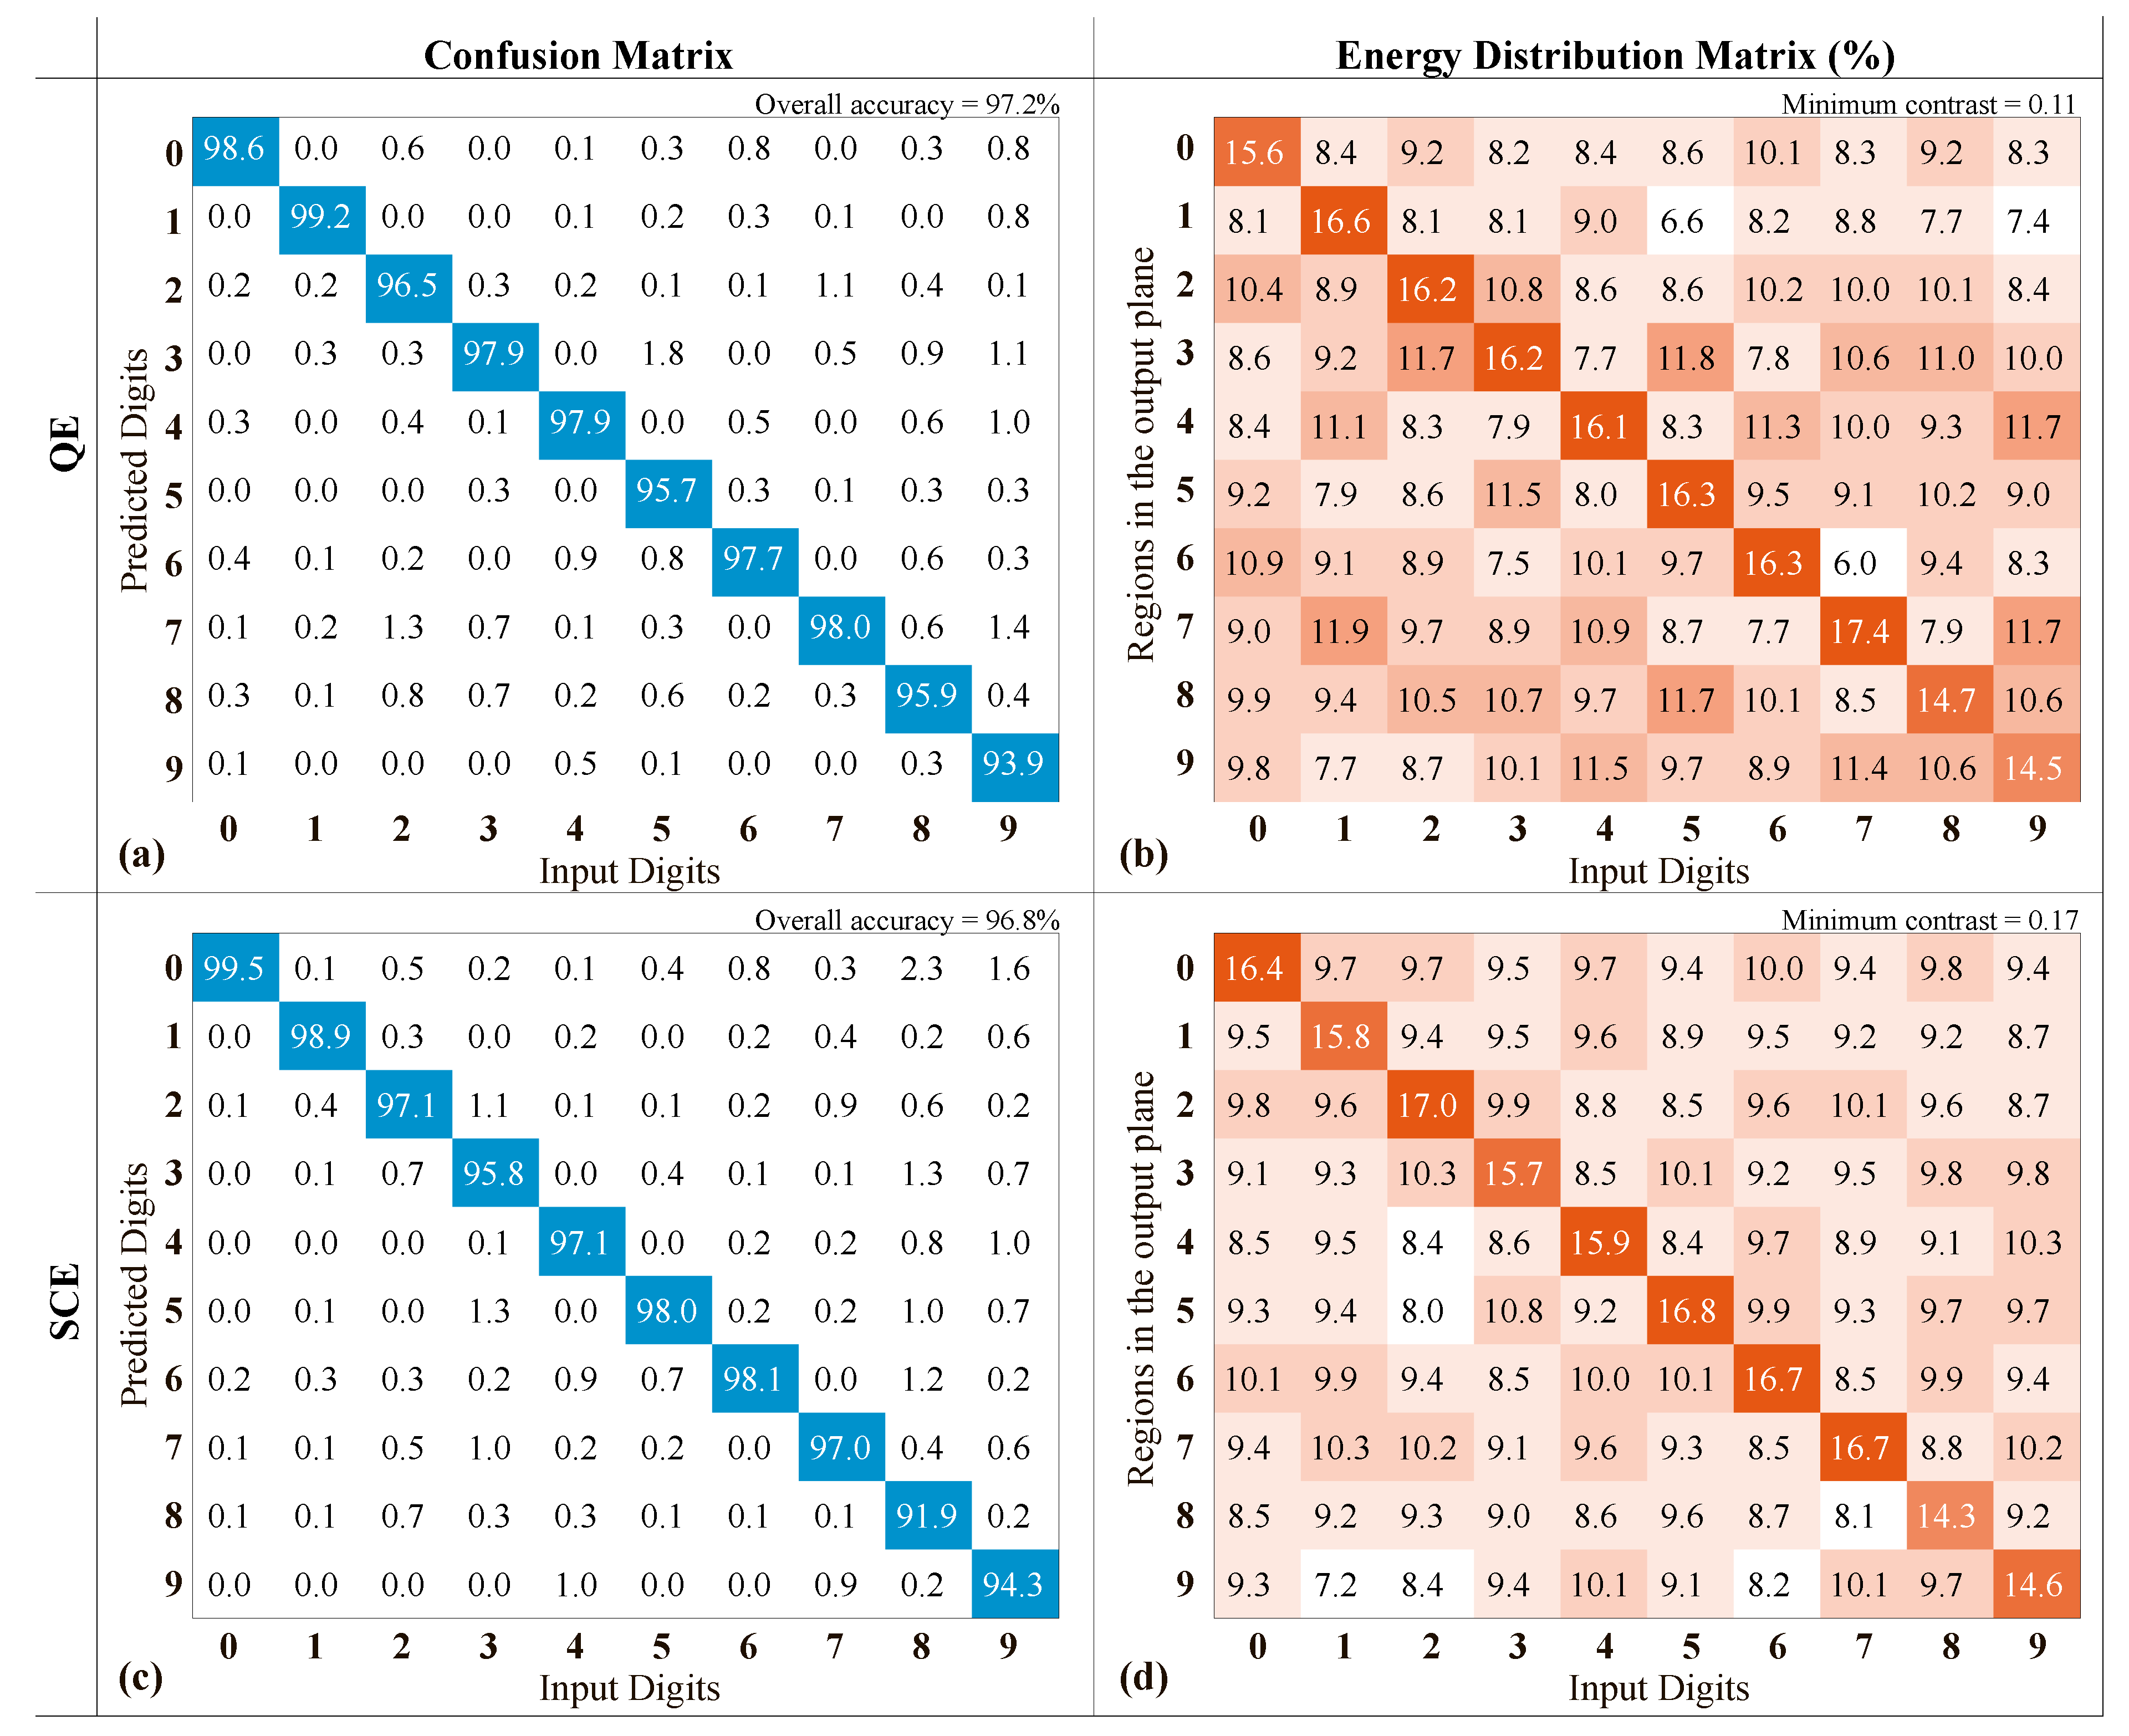
After training, “blind” testing of the performance of the calculated DOEs was performed using a test set consisting of 10,000 images not included in the training set. For each image from the test set, the generated intensity distribution was simulated, the energies (16) in the regions G j were calculated, and then the input digit was determined using the maximum energy value. The testing results represented as confusion matrices and energy distribution matrices are represented in Figure 7. The element (i,j) of the confusion matrix contains the percentage of cases, in which an input image of the digit j was recognized as the digit i. Accordingly, the diagonal elements of these matrices contain the percentage of the correct classifications. Similarly, the element (i,j) of the energy distribution matrix contains the averaged energy (in percent) in the region G i at an input image of the digit j. The diagonal elements of this matrix correspond to mean energies (in percent) in the “correct” regions corresponding to each digit.
For the DOE calculated using the QE criterion (Figure 6a), the accuracy of the digit recognition varies from 93.9% for the digit “9” to 99.2% for the digit “1”. The overall classification accuracy (i.e., the ratio of the number of correctly recognized digits to the total amount of digits in the test set) amounts to 97.2%. For the DOE calculated using the SCE criterion (Figure 6b), the accuracy varies from 91.9% for the digit “8” to 99.5% for the digit “0”, and the overall accuracy equals 96.8%. Let us note that the achieved classification accuracy values are quite high for single DOEs. For the sake of comparison, the overall classification accuracies in Refs. [3,5,21] achieved using cascaded structures containing 5–10 DOEs vary from 91.8% to 93.4%.
As it was noted above, for the DOE calculated using the SCE criterion, the overall classification accuracy turned out to be 0.4% lower. At the same time, the energy distribution matrix for this DOE is better. Indeed, from the practical point of view, an important parameter is the contrast value, which shows, how much the energy in the required region exceeds the energy values in the other regions. Let us define the contrast for the digit i as
γ min , i = I i , i max j i I j , i I i , i + max j i I j , i ,
where I i , j ,   i , j = 0 , , 9 are the elements of the energy distribution matrix. For robust determination of the “true maxima”, it is necessary for the contrast values γ min , i to exceed 0.1. According to the energy distribution matrix shown in Figure 7b and corresponding to the DOE calculated using the QE criterion, the minimum contrast is achieved for the digit “9” and amounts to γ min 0.11 . For the energy distribution matrix of Figure 7d corresponding to the DOE calculated using the SCE criterion, the minimum contrast is also achieved for the digit “9” but is somewhat greater: γ min 0.17 .
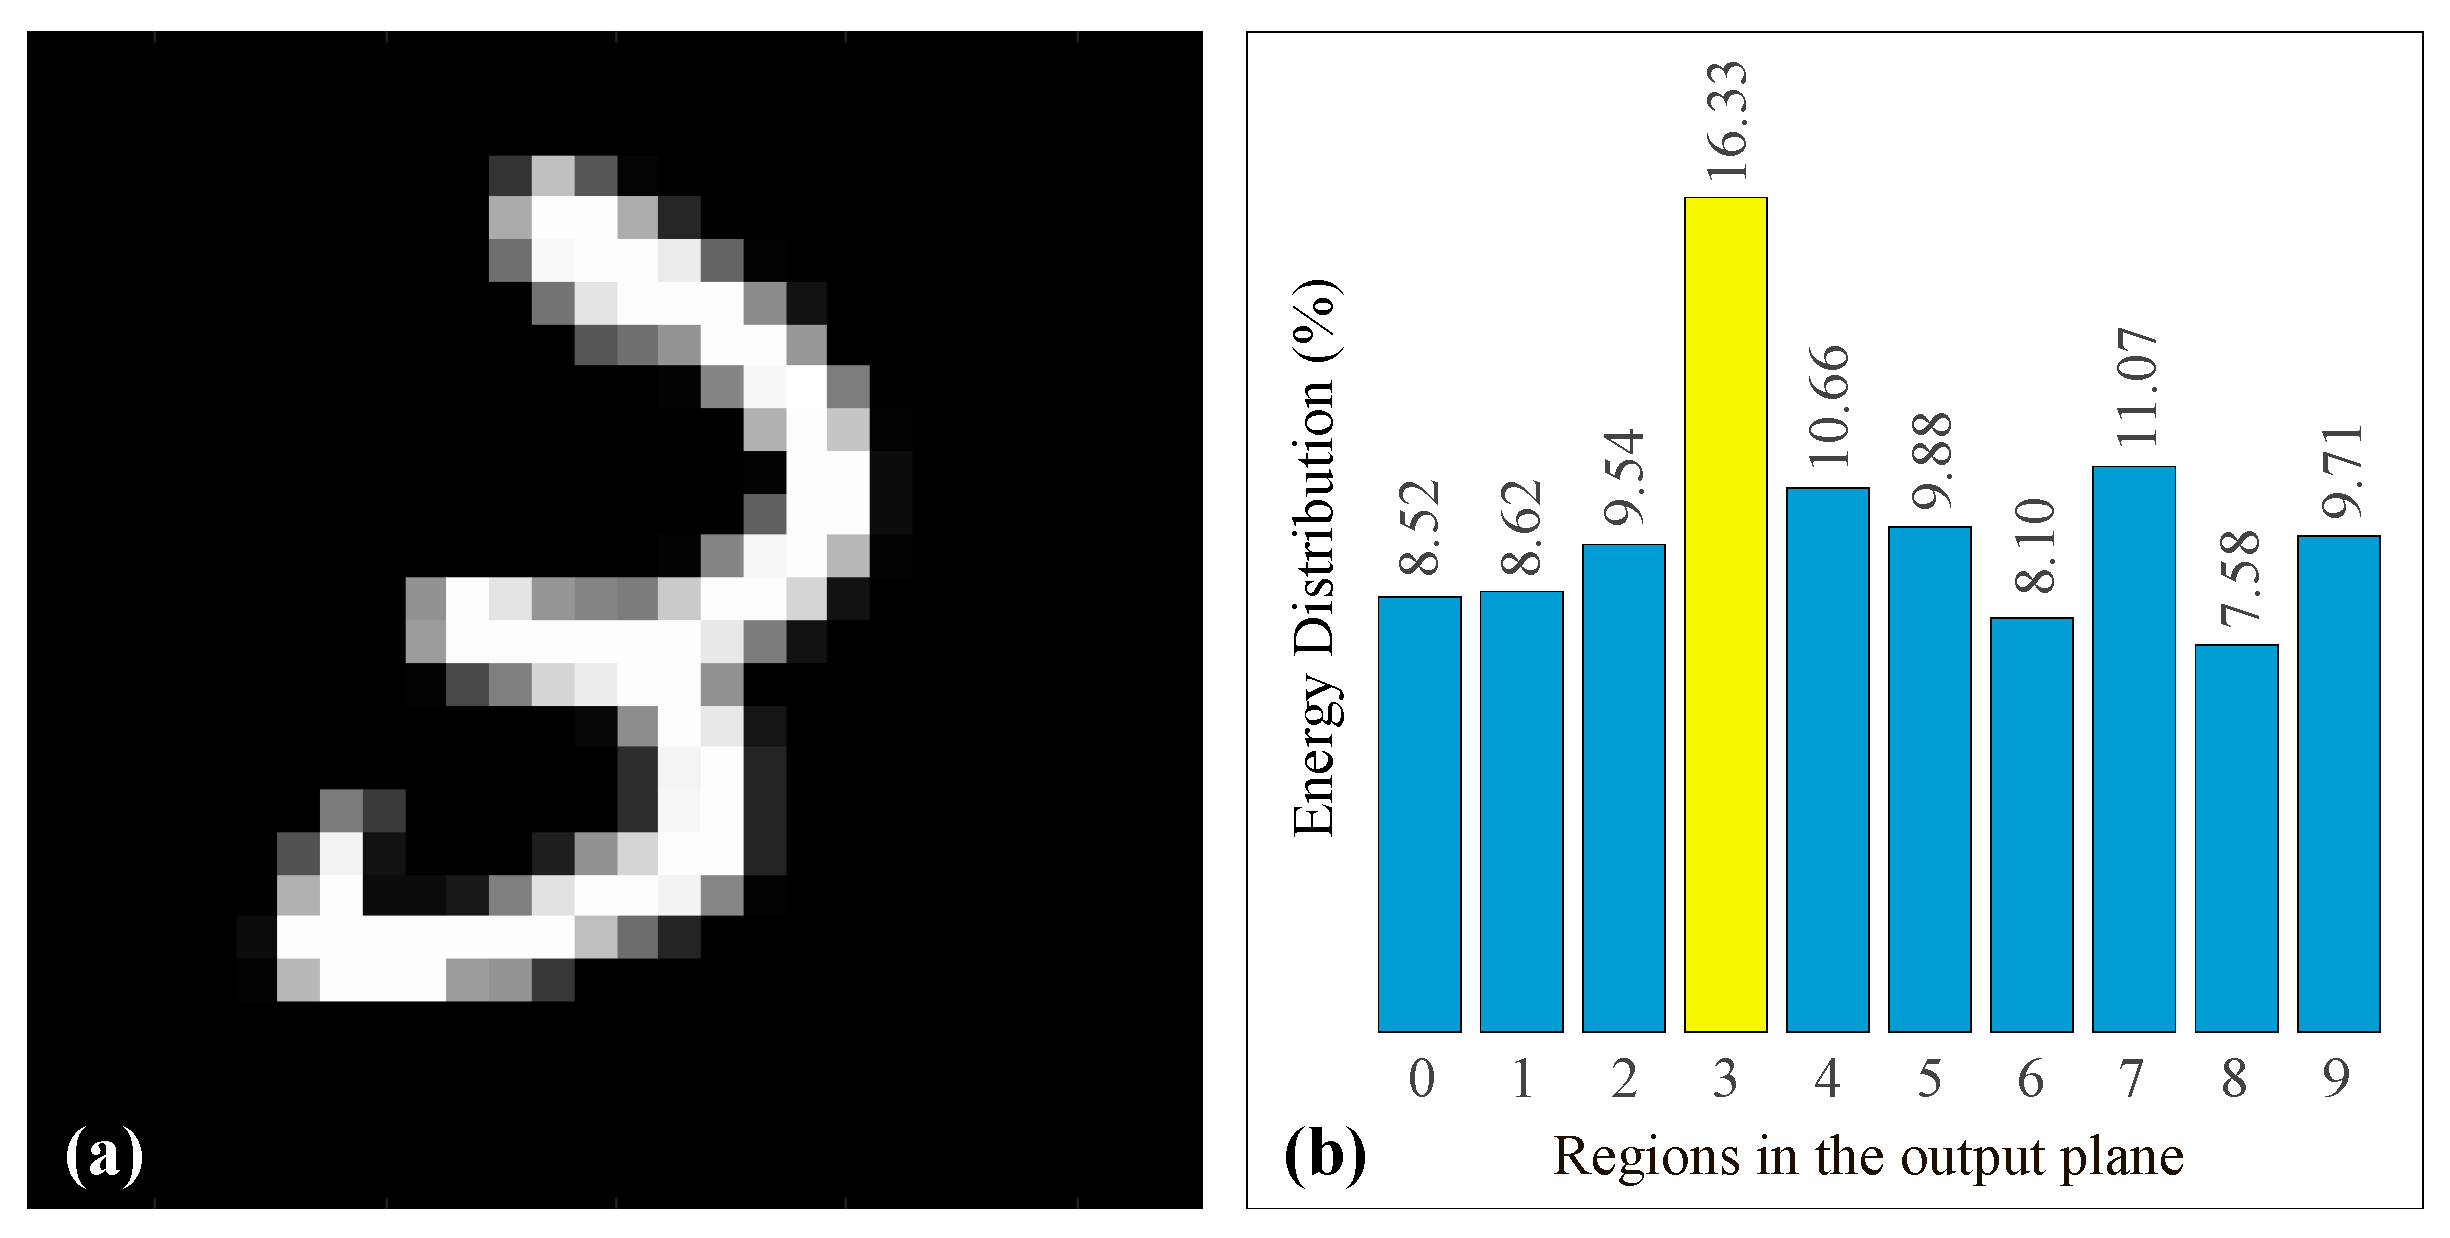
As an example, Figure 8 shows a typical input image of the digit “3” and the corresponding energy distribution demonstrating a correct digit recognition.
Then, using the QE and SCE criteria, we designed cascaded DOEs comprising two DOEs located in the planes z = f 1 = 300   mm and z = f 2 = 600   mm . The output plane was located at z = 900   mm . All the other parameters (discretization, wavelength, and aperture sizes) coincide with the parameters of the examples considered above. The phase functions of the cascaded DOEs calculated after 10 epochs are shown in Figure 9.
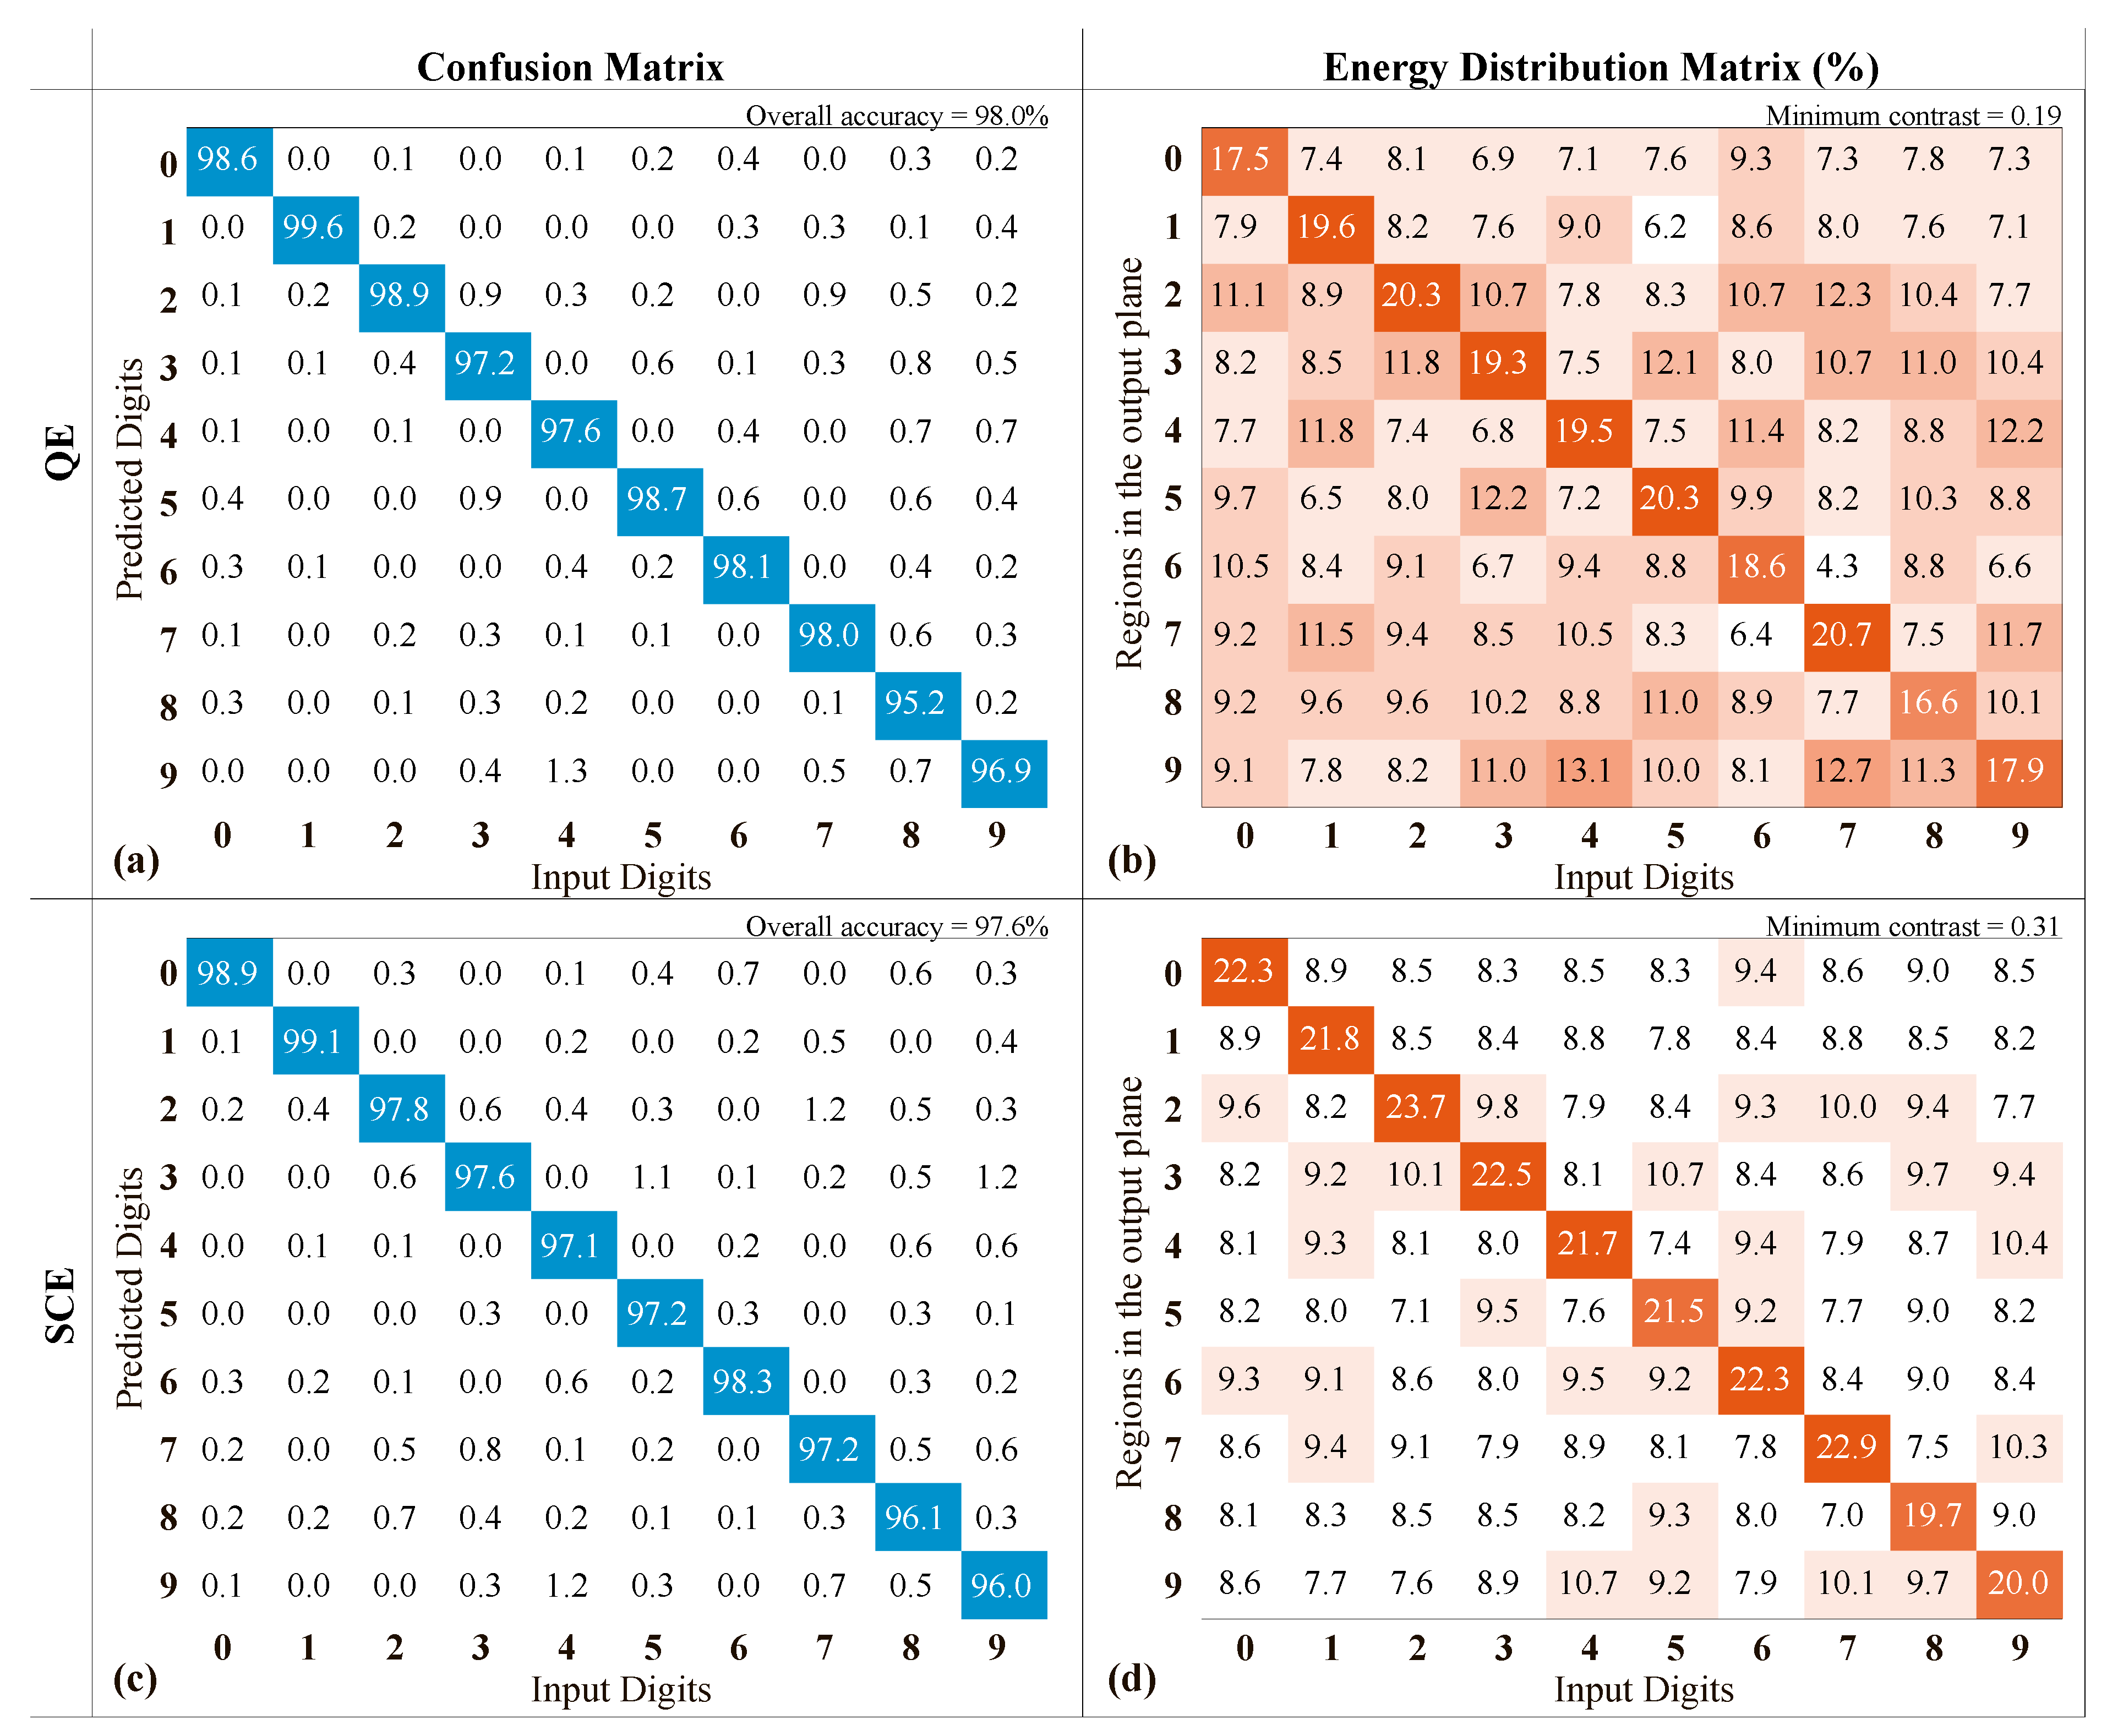
The confusion matrices and the energy distribution matrices for the designed cascaded DOEs are presented in Figure 10. As before, the DOE performance was evaluated on a test set containing 10,000 images not included in the training set. By comparing the confusion matrices for single and cascaded DOEs (Figure 7a,c and Figure 10a,c), one can see an increase in the classification accuracy. The overall accuracy values for the cascaded DOEs calculated using the QE and SCE criteria amount to 98.0% and 97.6%, respectively. Thus, for the considered example, the increase in the classification accuracy achieved by using a cascaded structure containing two DOEs equals 0.8%. The energy distribution matrices for the cascaded DOEs (Figure 10b,d) are also improved. In particular, minimum contrast values for the cascaded DOEs, which are also achieved for the digit “9”, amount to 0.19 and 0.31 for the QE and SCE criteria, respectively. These contrast values are more than 1.7 times greater than those for single DOEs.
Let us note that a further increase in the number of DOEs leads to only a marginal increase in the classification accuracy but enables improving the contrast values. In particular, for a cascaded structure consisting of three DOEs calculated using the SCE criterion, the minimum contrast amounts to 0.55, which is significantly greater than the value of 0.31 provided by the cascaded structure of two DOEs.
Another way to increase the DOE performance consists in increasing the number of the optimized parameters, which can be achieved by decreasing the step of the grid, at which the phase functions of the DOEs are defined. For example, a single DOE with the step size d = 4   μ m (and the rest of the parameters coinciding with those of the single DOE examples considered above) calculated using the QE criterion provides the overall accuracy of 97.9% and minimum contrast of 0.16, which is considerably better than in the case of a single DOE with the larger step size of 18   μ m [see Figure 7a,b]. It is worth noting that this result is comparable with the performance of the cascaded structure of two DOEs with the 18   μ m step size [see Figure 10a,b].
From the practical point of view, it is important to discuss the misalignment issues, which will inevitably occur when implementing cascaded DOEs (DNNs). It is known that alignment errors smaller than the neuron (DOE pixel) size show a minor influence on the DNN performance [3,21]. When the alignment error is just bigger than the neuron size, the classification accuracy can be drastically reduced. It should also be noted that the longitudinal misalignment usually influences the performance of a DNN much less than the lateral (transverse) one [21].
The cascaded DOEs studied in this work are no exception. In order to estimate the influence of DOE misalignment, as an example, let us consider the cascaded DOE comprising two DOEs and designed using the SCE criterion (Figure 9c,d). The simulation results demonstrate that when the first DOE is laterally displaced by the vectors Δ = ( Δ u 1 , Δ v 1 ) = ( ± 18 ,   ± 18 )   μ m (in the case of a fixed position of the second DOE), the overall classification accuracy remains greater than 95% (i.e., the decrease in the overall accuracy does not exceed 3%). The minimum contrast in this case also stays acceptable and exceeds 0.12. At further increase of the lateral displacement, the accuracy and contrast decrease more significantly: for example, at the lateral displacement Δ = ( 36 , 36 )   μ m , the overall accuracy and minimum contrast amount to 90.9% and 0.09, respectively. The lateral displacement of the second DOE influences the performance somewhat less, e.g., at the ( 36 , 36 )   μ m displacement, the overall accuracy equals 96.3%, whereas the minimum contrast is 0.13. Similar to the results presented in [21], the longitudinal misalignment is much less critical: for example, the displacement of each of the DOEs along the optical axis by 200 μm leads to a decrease in the overall efficiency not exceeding 0.1% at virtually the same contrast.
7. Conclusions

In this work, we presented a gradient method for calculating cascaded DOEs. Using the unitarity property of the operator of light propagation through the cascaded DOE, we obtained explicit expressions for the derivatives of the general error functional with respect to the phase functions of the cascaded DOE. We considered the application of the gradient method to the problem of focusing different incident beams to regions with different intensity distributions and to the problem of image classification. The presented description of the gradient method unifies the problems of designing cascaded DOEs for focusing laser radiation and for image classification within a general methodological approach, in which the calculation of the derivatives of the error functionals is reduced to the same formula.
Using the proposed gradient method, we designed single and cascaded DOEs for solving the problem of focusing different incident beams on different regions and the problem of classifying handwritten images. The presented numerical simulation results demonstrate the high performance of the proposed method. In particular, it was shown that a single DOE enables solving the classification problem with an accuracy of approximately 97%, whereas a cascaded structure containing two DOEs provides a 98% accuracy.
In the opinion of the authors, the presented gradient method can be generalized to the case of generating required intensity distributions in the case of several incident beams with different wavelengths. The design and investigation of such DOEs operating at several wavelengths will be the subject of further research.

Author Contributions

Conceptualization, L.L.D. and D.V.S.; methodology, L.L.D., D.V.S., G.A.M., and A.A.M.; software, D.V.S. and G.A.M.; validation, D.V.S., G.A.M., E.V.B. and L.L.D.; formal analysis, D.V.S., L.L.D., E.V.B., E.A.B., A.A.M., and D.A.B.; investigation, D.V.S., G.A.M., and L.L.D.; writing—original draft preparation, L.L.D., D.V.S., and E.A.B.; writing—review and editing, L.L.D., E.A.B., and D.A.B.; visualization, D.V.S. and E.V.B.; supervision, L.L.D.; project administration, L.L.D.; funding acquisition, L.L.D. All authors have read and agreed to the published version of the manuscript.

Funding

This work was performed within the State assignment of Federal Scientific Research Center “Crystallography and Photonics” of Russian Academy of Sciences (development of a gradient method for designing cascaded DOEs) and was supported by the Ministry of Science and Higher Education of the Russian Federation (State assignment for research to Samara University (laboratory “Photonics for Smart Home and Smart City”, project FSSS-2021-0016), design and investigation of DOEs for the problem of classifying images of handwritten digits).

Institutional Review Board Statement

Not applicable.

Informed Consent Statement

Not applicable.

Data Availability Statement

The data that support the presented results are available from the corresponding author upon reasonable request.

Conflicts of Interest

The authors declare no conflict of interest.

References

  1. Zhang, J.; Pégard, N.; Zhong, J.; Adesnik, H.; Waller, L. 3D computer-generated holography by non-convex optimization. Optica 2017, 4, 1306–1313. [Google Scholar] [CrossRef]
  2. Wang, H.; Piestun, R. Dynamic 2D implementation of 3D diffractive optics. Optica 2018, 5, 1220–1228. [Google Scholar] [CrossRef]
  3. Lin, X.; Rivenson, Y.; Yardimci, N.T.; Veli, M.; Luo, Y.; Jarrahi, M.; Ozcan, A. All-optical machine learning using diffractive deep neural networks. Science 2018, 361, 1004–1008. [Google Scholar] [CrossRef] [PubMed] [Green Version]
  4. Schmidt, S.; Thiele, S.; Toulouse, A.; Bösel, C.; Tiess, T.; Herkommer, A.; Gross, H.; Giessen, H. Tailored micro-optical freeform holograms for integrated complex beam shaping. Optica 2020, 7, 1279–1286. [Google Scholar] [CrossRef]
  5. Zhou, T.; Fang, L.; Yan, T.; Wu, J.; Li, Y.; Fan, J.; Wu, H.; Lin, X.; Dai, Q. In situ optical backpropagation training of diffractive optical neural networks. Photon. Res. 2020, 8, 940–953. [Google Scholar] [CrossRef]
  6. Banerji, S.; Meem, M.; Majumder, A.; Vasquez, F.G.; Sensale-Rodriguez, B.; Menon, R. Imaging with flat optics: Metalenses or diffractive lenses? Optica 2019, 6, 805–810. [Google Scholar] [CrossRef]
  7. Banerji, S.; Sensale-Rodriguez, B. Computational design framework for efficient, fabrication error-tolerant, planar THz diffractive optical elements. Sci. Rep. 2019, 9, 5801. [Google Scholar] [CrossRef] [Green Version]
  8. Gerchberg, R.; Saxton, W. A practical algorithm for the determination of phase from image and diffraction plane pictures. Optik 1972, 35, 237. [Google Scholar]
  9. Fienup, J.R. Phase retrieval algorithms: A comparison. Appl. Opt. 1982, 21, 2758–2769. [Google Scholar] [CrossRef] [Green Version]
  10. Soifer, V.A.; Kotlyar, V.V.; Doskolovich, L.L. Iterative Methods for Diffractive Optical Elements Computation; Taylor & Francis: London , UK; Bristol, UK, 1997. [Google Scholar]
  11. Shechtman, Y.; Eldar, Y.C.; Cohen, O.; Chapman, H.N.; Miao, J.W.; Segev, M. Phase retrieval with application to optical imaging. IEEE Signal Process. Mag. 2015, 32, 87–109. [Google Scholar] [CrossRef] [Green Version]
  12. Latychevskaia, T. Iterative phase retrieval in coherent diffractive imaging: Practical issues. Appl. Opt. 2018, 57, 7187–7197. [Google Scholar] [CrossRef] [PubMed]
  13. Ripoll, O.; Kettunen, V.; Herzig, H.P. Review of iterative Fourier transform algorithms for beam shaping applications. Opt. Eng. 2004, 43, 2549–2556. [Google Scholar]
  14. Doskolovich, L.L.; Mingazov, A.A.; Byzov, E.V.; Skidanov, R.V.; Ganchevskaya, S.V.; Bykov, D.A.; Bezus, E.A.; Podlipnov, V.V.; Porfirev, A.P.; Kazanskiy, N.L. Hybrid design of diffractive optical elements for optical beam shaping. Opt. Express 2021, 29, 31875–31890. [Google Scholar] [CrossRef]
  15. Gülses, A.A.; Jenkins, B.K. Cascaded diffractive optical elements for improved multiplane image reconstruction. Appl. Opt. 2013, 52, 3608–3616. [Google Scholar] [CrossRef]
  16. Deng, X.; Chen, R.T. Design of cascaded diffractive phase elements for three-dimensional multiwavelength optical interconnects. Opt. Lett. 2000, 25, 1046–1048. [Google Scholar] [CrossRef] [PubMed] [Green Version]
  17. Yan, T.; Wu, J.; Zhou, T.; Xie, H.; Xu, F.; Fan, J.O.; Fang, L.; Lin, X.; Dai, Q. Fourier-space Diffractive Deep Neural Network. Phys. Rev. Lett. 2019, 123, 023901. [Google Scholar] [CrossRef] [PubMed]
  18. Zheng, S.; Xu, S.; Fan, D. Orthogonality of diffractive deep neural network. Opt. Lett. 2022, 47, 1798–1801. [Google Scholar] [CrossRef]
  19. Chang, J.; Sitzmann, V.; Dun, X.; Heidrich, W.; Wetzstein, G. Hybrid optical-electronic convolutional neural networks with optimized diffractive optics for image classification. Sci. Rep. 2018, 8, 12324. [Google Scholar] [CrossRef] [Green Version]
  20. Liu, C.; Ma, Q.; Luo, Z.J.; Hong, Q.R.; Xiao, Q.; Zhang, H.C.; Miao, L.; Yu, W.M.; Cheng, Q.; Li, L.; et al. A programmable diffractive deep neural network based on a digital-coding metasurface array. Nat. Electron. 2022, 5, 113–122. [Google Scholar] [CrossRef]
  21. Chen, H.; Feng, J.; Jiang, M.; Wang, Y.; Lin, J.; Tan, J.; Jin, P. Diffractive deep neural networks at visible wavelengths. Engineering 2021, 7, 1483–1491. [Google Scholar] [CrossRef]
  22. Ferdman, B.; Saguy, A.; Xiao, D.; Shechtman, Y. Diffractive optical system design by cascaded propagation. Opt. Express 2022, 30, 27509–27530. [Google Scholar] [CrossRef]
  23. Kulce, O.; Mengu, D.; Rivenson, Y.; Ozcan, A. All-optical synthesis of an arbitrary linear transformation using diffractive surfaces. Light Sci. Appl. 2021, 10, 196. [Google Scholar] [CrossRef] [PubMed]
  24. Kingma, D.P.; Ba, J. Adam: A method for stochastic optimization. arXiv 2015, arXiv:1412.6980. [Google Scholar]
  25. Lecun, Y.; Bottou, L.; Bengio, Y.; Haffner, P. Gradient based learning applied to document recognition. Proc. IEEE 1998, 86, 2278–2324. [Google Scholar] [CrossRef]
Figure 1. Geometry of the problem of the design of a cascaded DOE.
Photonics 10 00766 g001
Figure 2. Required intensity distributions in the output plane for the incident beams of Equation (14).
Photonics 10 00766 g002
Figure 3. The calculated phase functions of the single DOE (first row) and of cascaded structures containing two (second row) and three (third row) DOEs.
Photonics 10 00766 g003
Figure 4. Calculated intensity distributions generated for each of the incident beams of Equation (23) by the designed single DOE (first row) and cascaded structures consisting of two (second row) and three (third row) DOEs.
Photonics 10 00766 g004
Figure 5. Regions G j in the output plane, in which maximum energies for the input images of different digits have to be generated.
Photonics 10 00766 g005
Figure 6. Phase functions of DOEs calculated using the quadratic error criterion (a) and the softmax cross entropy criterion (b).
Photonics 10 00766 g006
Figure 7. Confusion matrices and energy distribution matrices for the DOEs calculated using the quadratic error criterion (a,b) and the softmax cross entropy criterion (c,d).
Photonics 10 00766 g007
Figure 8. Input image of the digit “3” (a) and the corresponding energy distribution (b).
Photonics 10 00766 g008
Figure 9. Phase functions of the cascaded DOEs calculated using the quadratic error criterion (a,b) and the softmax cross entropy criterion (c,d).
Photonics 10 00766 g009
Figure 10. Confusion matrices and energy distribution matrices for cascaded DOEs calculated using the quadratic error criterion (a,b) and the softmax cross entropy criterion (c,d).
Photonics 10 00766 g010
Disclaimer/Publisher’s Note: The statements, opinions and data contained in all publications are solely those of the individual author(s) and contributor(s) and not of MDPI and/or the editor(s). MDPI and/or the editor(s) disclaim responsibility for any injury to people or property resulting from any ideas, methods, instructions or products referred to in the content.