Abstract
Liquid crystal tunable filters (LCTFs) are extensively used in hyperspectral imaging systems to obtain spectral information of target scenes. However, a typical LCTF can only filter linearly polarized light, greatly reducing the transmittance of the system and limiting its application in spectral and polarization imaging. In this paper, a spectropolarimeter using Mach–Zehnder structured LCTFs (MZ-LCTFs) combined with liquid crystal variable retarders (LCVRs) is proposed. The polarized beam splitter (PBS) can make full use of the two polarization components of the incident light to improve the transmittance of the system. Specifically, the results show that the mean pixel intensity (MPI) of spectral images is improved by 93.48% compared to a typical LCTF. Subsequently, the average signal to noise ratio (SNR) of filtered and unfiltered images when simultaneously using polarization S and P channels is increased by 2.59 dB compared to a single channel. In addition, the average Standard Deviations (STDs) of DoLP and DoCP are 0.016 and 0.018, respectively. The proposed method has the potential to be applied to obtain polarization information with high optical efficiency and a full spectrum in a wide band.
1. Introduction
Spectral polarization imaging (SPI) aims to obtain four-dimensional (4D) representation data of target scenes, consisting of two-dimensional (2D) spatial information, one-dimensional spectral information, and the polarization state information represented by full-Stokes parameters [1,2]. Due to the its ability to reveal and retrieve target information, e.g., material composition, surface texture and characteristic details, SPI has been extensively applied in many night-vision-related fields, such as anomaly detection, field reconnaissance, night navigation, and so on [3,4,5,6,7,8,9,10].
Currently, various SPI techniques, such as the dispersion type [11], Fourier transform type [12], computational tomography (CT) type [13], and optical filter type [14], have been primarily developed on the basis of spectrum imaging in order to accurately and rapidly extract the spectral polarization information of a target. Prisms and gratings are initially implemented in a dispersive SPI system to discriminate spectral components. Li et al. [15] proposed a polarization-difference channeled imaging spectropolarimeter (PDCISP) using a double Wollaston prism (DWP), which achieves low channel crosstalk and a high resolution. Zhang et al. [16] presented a broadband full-Stokes channeled modulated polarization imaging system based on a Mach–Zehnder grating interferometer (MZGI) with advantages such as a high optical efficiency and snapshot ability. However, the optical throughput of this type of SPI is limited by the structure of the slit. A static full-Stokes Fourier transform imaging spectropolarimeter incorporating a liquid crystal polarization modulator (LPM) and birefringent shearing interferometer (BSI) was designed by Bai et al. [17], which is able to provide high SNR image data. Fourier transform SPI with no slits and moving parts brings the advantages of a high optical throughput and easy alignment, but using the scanning method takes a long acquisition time to detect 4D hyperspectral polarized image information. A CTSPI can obtain the spectral polarized information of the image with a single measurement, but the spectral precision of CTSPI is reduced, and thus its use in complex applications is consequently limited.
An optical filtered SPI is a common alternative to other SPI techniques owing to the simple imaging principle; in other words, it is used to place an external filter in front of a monochromatic imager and acquire images at each spectral band sequentially. In addition to using a filter wheel [18] or color filter array [19], acousto-optic tunable filters (AOTF) [20] and LCTF [21] are frequently used because they can freely switch different spectral band at high speed (ms/or faster) and contain no mechanical moving components. However, the spatial resolution and the optical throughput of an optical filter SPI system are essentially limited by its filtering performance such as bandwidth and energy transmittance of light, respectively. A way to circumvent this issue is to optimize the optical configuration or insert additional narrow-band pass filters [22,23]. Messaadi et al. [24] presented the realization of a bulk optics birefringent Solc filter in a reflective geometry, which reduces the number of filters as well as enhances the spectral resolution. Tam et al. [25] proposed a novel design configuration of a double deformed helix ferroelectric liquid crystal (DHFLC) wave plate continuous tunable Lyot filter with a high-contrast ratio. Later, an AOTF-based imager design using both polarized components of the randomly input light was presented by Ramy et al. [26], which significantly improves the throughput of AOTF images. Furthermore, the compressive sensing (CS) theory [27,28] has been applied in LCTF-based SPI systems to achieve super-resolution rather than direct measurement. August et al. [29] proposed an approach using a single LCVR to modulate and achieve the reconstruction of hyperspectral images. Alternatively, AbuLeil et al. [30] explored the parallel spectroscopic extraction using spectral modulation and computational algorithms formed by LCVRs or multi-band pass filters. However, the drawback of this means is that it inadequately compresses the hyperspectral image data in the spatial domain. Wang et al. [31] presented a compressive sensing principle to improve both the spatial and spectral resolutions of the LCTF-based SPI system. Subsequently, Fan et al. [32] demonstrated a compressive imaging system to recover the 4D polarized hyperspectral images with full-Stokes parameters based on a quarter-wave plate (QWP) and LCTF. Thus, how to improve the inherent performance of an SPI system to obtain high spectral and spatial resolution without sacrificing its larger optical throughput is always the difficulty in this research field.
Enlightened by the afore-discussed problem, we develop an SPI system using Mach–Zehnder structured LCTFs (MZ-LCTFs) and LCVRs that significantly improves the optical transmittance in the case of low light applications by using both polarizations in this paper.
The main contributions of this paper can be summarized as follows: Light energy transmittance of MZ-LCTFs is proposed based on the dual polarization path so as to improve the optical throughput (measured by MPI) by 93.48% in practice when compared with the traditional single LCTF. The average SNR of filtered and unfiltered images when simultaneously using S and P channels is improved by 2.59 dB compared to a single channel. In addition, the average STDs of DoLP and DoCP are 0.016 and 0.018, respectively. SPI experiments verify that the proposed method can obtain spectral polarization information synchronously with high precision.
The remainder of this paper is organized as follows. Section 2 briefly introduces the system configuration and modulation principle. The spectral and polarimetric calibration are carried out in Section 3. To verify the imaging performance of the proposed scheme, the results of imaging experimental demonstrations are presented in Section 4. Finally, Section 5 summarizes and concludes this study.
2. System Configuration and Methodology
2.1. System Configuration
Experimental schematic of the proposed dual polarization LCTFs-LCVRs-based imaging spectropolarimeter is shown in Figure 1. The incident beam carries the target information collimated in parallel by the fore-optical system, which is a telescopic arrangement of an objective lens (L1, f = 25 mm, HN-2520-20M-C1/1X from IMAVISON), an aperture stop (AS, CP20D from Thorlabs), and a collimating lens (L2, f = 75 mm, GCL-010654 from DHC). The collimated light beam is then modulated by the LCVRs acting as a polarization state analyzer (PSA). The LCVR1 and LCVR2 consist of two glass substrates coated with a transparent ITO layer as electrode, alignment layers defines the molecular director of nematic liquid crystal layer (liquid crystal material E7 from Instec Inc, liquid crystal cell from JCOPTIX). Fast axes of two birefringent crystals, LCVR1 and LCVR2, are orientated at 0° and 45° relative to the horizontal x-axis. These are followed by an MZ-LCTFs-based imaging spectrometer, which is composed of two PBSs (PBS1 and PBS2, HCBS2-015-VIS from HY-OTIS), two LCTFs (LCTF1 and LCTF2), and two mirrors (M1 and M2, BB1-E02 from Thorlabs) oriented at 45° relative to z-axis. The nematic liquid crystal mixture E7 (with ne of 1.746 and no of 1.521) was filled into our designed LCTFs. The modulated beam is separated into two linearly polarized components with the orthogonal polarization direction by the PBS1, and then the two LCTFs of the same configuration are inserted in each of the optical transmission paths. Later, the filtered signal of both independent polarization parts at each different path are coupled at PBS2, which theoretically doubles the optical efficiency to ensure high transmittance. Finally, using an objective lens (L3, f = 75 mm, GCL-010654 from DHC), target images with different polarization modulation states at specific spectra are focused on the CMOS (Basler ac A1300—200 μm) placed on the back of plane of L3.
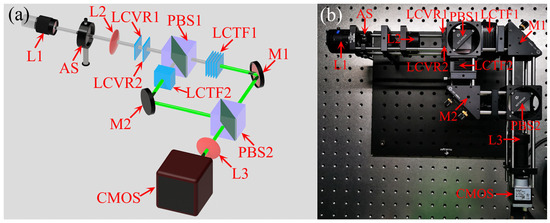
Figure 1.
(a) Experimental schematic of the dual polarization LCTFs-LCVRs-based SPI system. (b) Corresponding optical path of physical map.
2.2. Proposed Method
Using the principle of the Mueller matrices, the Stokes vectors of polarized transmitted P light or polarized reflected S light coupled from the PBS2 can be described as:
where MS/P, MLCVR1 and MLCVR2 are the Muller matrices of the polarized S light at horizontal x-axis or P light at vertical y-axis and the retarders LCVR1 and LCVR2, orientation at 0° and 45° relative to the horizontal x-axis.
Then according to the retardation and the orientation of the optic axes of polarized S or P light and LCVRs, the Mueller matrices of them can be written as:
where θS/P is the transmission-axis rotation angle of the polarization S or P beam, θR and δ are the orientation azimuth and phase of the LCVRs, respectively. Specifically, δ is a function of wavelength λ and the driving voltage V. In this study, electronically controlled Lyot type LCTF is used to implement central wavelength λ acquisition, which has the transmission functions as follows:
where n is the number of retarders, d is the thickness of the thinnest retarder, and Δn is the effective birefringence of the liquid crystal. The bandwidth of the ideal LCTF is considered infinitesimal; however, the actual bandwidth of the conventional LCTF is in the region of 10 nm to 30 nm. Therefore, LCVRs need to be individually calibrated under LCTFs filtering, which results in a device-specific function that maps drive voltage to a retardation. The tuning curves for LCVRs at 450 nm, 532 nm, and 632 nm are measured as shown in Figure 2.
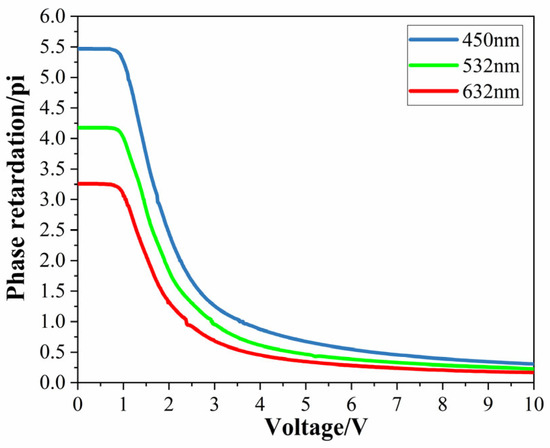
Figure 2.
LCVRs tuning curves at three wavelengths (450 nm, 532 nm, and 632 nm).
Since CMOS only responds to radiation intensity, only the first parameter of Sout can be measured. As a result, the radiation intensity of the two independent polarized lights IS and IP distributed on CMOS plane can be expressed as:
Within each spectral channel, the normalized S0−S3 fundamental Stokes parameters of the incoming signal detected by LCVRs are represented by:
where I (δLCVR1, δLCVR2) describes the different polarization modulation states based on the retardation LCVR1 and LCVR2.
Finally, the polarization information of the target is generally characterized by the parameters of degree of polarization (DoP), angle of polarization (AoP).
3. System Calibration
The calibration performance of the MZ-LCTFs-SPI instrument combined with LCVRs must be characterized. First, its optical transmittance was tested and compared to a single polarization LCTF setup. The system’s spectral response and polarization performance accuracy was then measured. Figure 3 illustrates the main stages for the spectral polarimetric calibration of the setup.
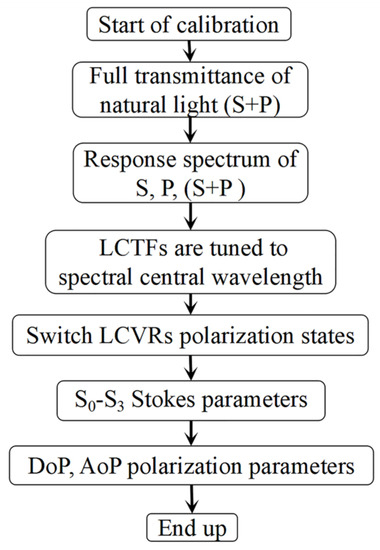
Figure 3.
Spectral and polarimetric calibration flow chart.
3.1. Spectral Calibration
The optical throughput of an SPI system is generally defined as the percentages of the output light at the appropriate wavelength of the input light. The main contribution of utilizing the MZ-LCTFs setup is the improvement in the throughput of the incoming randomly polarized signal. Therefore, a calibrated fiber-optic spectrometer (HR4000, Ocean Insight, Orlando, FL, USA) is used to measure the spectral response output with a standard white light source as the input. The experimental setup for the spectral calibration of MZ-LCTFs is shown in Figure 4.
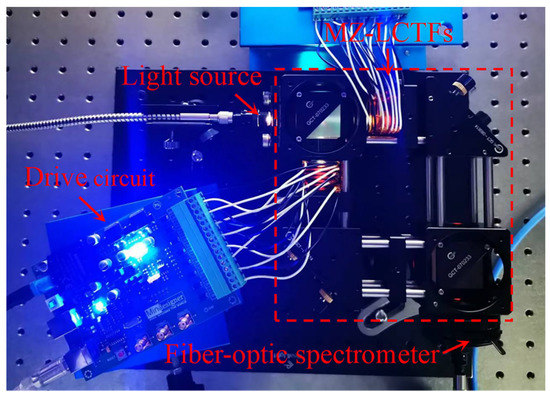
Figure 4.
Experimental setup for spectral calibration.
The angles of two PBSs and two mirrors need to be adjusted, and thus, this ensures that the polarized S light and P light with the same light intensity are coupled by PBS2 at the same position. Then, the natural light completely transmits through the MZ-LCTFs when simultaneously using S and P channels. Figure 5a shows the actual response spectrum of the entire SPI systems corresponding to different center wavelengths. The graph represents the system’s capability to distinguish between a full band of 400 nm to 700 nm. The relative optical transmittance of the system is about 8% to 38%. In addition to the combined beam (SP) throughput, the two polarization beams (S/P) were measured separately by locking one of the polarization paths. To better characterize the optical throughput enhancement, the histogram in Figure 5b illustrates the actual optical transmittance of the S single channel, P single channel, and SP double channels at representative bands (450 nm, 532 nm, and 632 nm).
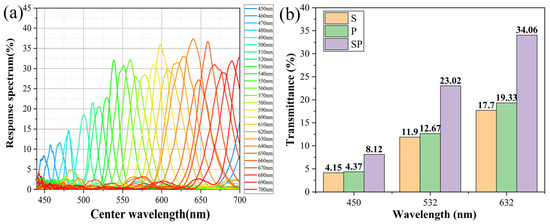
Figure 5.
Spectral calibration of MZ-LCTFs-based SPI system: (a) The response spectrum of MZ-LCTFs corresponding to different wavelengths; (b) the optical transmittance comparison of MZ-LCTFs system under single and dual channel conditions (filtered @ 450 nm, 532 nm, 632 nm).
The optical transmittance of the system using both double polarization paths is improved by 95.65% (@ 450 nm), 93.44% (@ 532 nm), and 92.42% (@ 632 nm) compared to single channel polarization transmittance (S). On average, the designed MZ-LCTFs system leads to a 93.87% improvement in throughput of the system. Theoretically, the optical transmittance should be double that of the conventional polarized type LCTF when compared. In fact, the spectral transmittance of the actual setup is constrained by the optical loss and two optical path alignments of LCTFs and other components, such as the PBSs and mirrors, and so on.
3.2. Polarimetric Calibration
In order to accurately determine the retardation of LCVRs corresponding to different wavelengths (δ(λ)LCVR1, δ(λ)LCVR2) and reconstruct the complete Stokes parameters from the scene by eliminating the background effects, such as camera relative radiation, the LCTFs filtering bandwidth, etc., a polarimetric calibration routine must be implemented. In this study, we carried out a polarization test demonstration experiment used by a reference beam calibration technique to prove the feasibility of the proposed method. The experimental setup for polarization light calibration is illustrated in Figure 6.
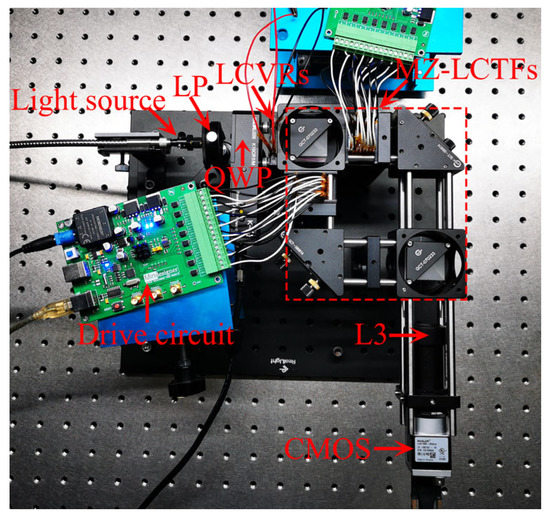
Figure 6.
Experiment setup for polarization light calibration.
A uniform and unpolarized polychromatic beam generated by a broadband (400 nm–700 nm) light source passes through the LCTFs and thus forms a monochromatic light relative to the known center wavelength λ. Then a polarization state generator (PSG) consisting of a linear polarizer (LP) and a quarter-wave plate (QWP) is used to provide standard controllable polarization states. Finally, the LCVRs as the polarization state analyzer (PSA) can provide different polarization modulation states by switching between LCVR1 and LCVR2 to acquire the basic S0–S3 Stokes parameters of the target. Figure 7 shows the polarization state calibration and degree of linear polarization (DoLP)/degree of circular polarization (DoCP) parameter measurement results of the system @ 532 nm. The QWP fast axis angle rotates every 15° in the range of 0°~180°.
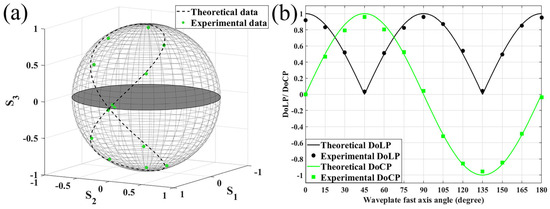
Figure 7.
Polarization calibration of the SPI system @ 532 nm: (a) Calibrated polarization states are shown on the Poincaré sphere; (b) calibration results of DoLP and DoCP.
The average errors of DoLP and DoCP measurement at 532 nm are 3.95% and 4.13%, respectively. This is only a slight deviation from the theoretical value, which is due to the effect of background noise and optical element error. Other wavelengths are similar. Notably, in the measurement process, further enhancement driving accuracy of LCVRs can recover the polarized spectral information with higher accuracy.
4. Experimental Verification
The imaging experiments are performed to test the performance of the MZ-LCTFs-LCVRs-based SPI system. Self-made LCVRs and LCTFs are used in this device. A monochrome CMOS (Basler ac A1300—200 μm) is used to measure the scene intensity, which has an imaging resolution of 1280 × 1024 pixels and a pixel size of 4.8 μm. The gain (raw) is 192 and the exposure time is set as 0.05 ms. The distance from our system to the objects is about 1.8 m. Under the transmitted illumination of the LED backlight board, the designed target scene is depicted in Figure 8. The red, green, and blue plastic sheets are used to demonstrate the spectral performance of LCTFs, and their optical transmittance curves corresponding to respective colors are shown in Figure 8b. The big STU pattern also consists of plastic. A polarization target applied to demonstrate the polarization characteristics of LCVRs is constructed of linear polarized arrays, circularly polarized arrays, and attenuator sheets. The linear arrows are provided to point to the pass axis for the linear polarizers, and the circular arrows are similar for the circular polarizers. Moreover, the polarization sheets cut into small letters of STU, a heart shape, an arrow, and a double arrow are mounted on the three colored plastic sheets.
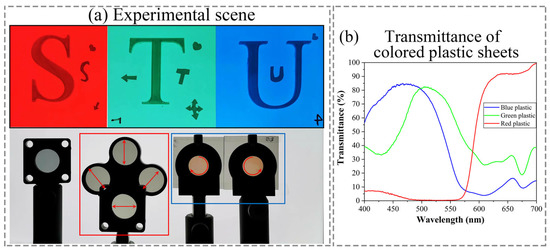
Figure 8.
Target scene: (a) experimental scene; (b) transmittance of different color plastic sheets.
The mean pixel intensity (MPI) is calculated as a measurement index to characterize the gain in intensity for the light flux of this setup. Images of polarization S, polarization P, and polarization coupling SP are shown in Figure 9. The MPI of unfiltered images and single/dual path spectral images corresponding to the different wavelengths are contrasted in Table 1.
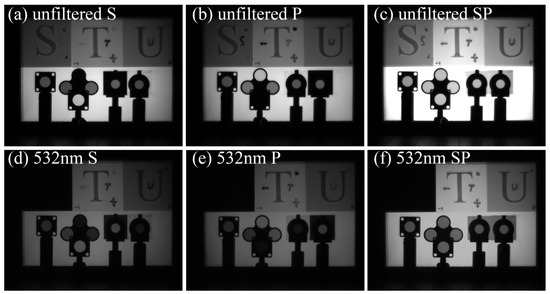
Figure 9.
S, P, and coupling SP images of unfiltered and filtered at 532 nm: (a) unfiltered image of S channel; (b) unfiltered image of P channel; (c) unfiltered image of coupling SP channel; (d) filtered image (@ 532 nm) of S channel; (e) filtered image (@ 532 nm) of P channel; (f) filtered image (@ 532 nm) of coupling SP channel.

Table 1.
MPI of S, P, coupling SP images relative to different wavelengths.
Compared to the traditional single path (S), LCTF and MZ-LCTFs with dual path (SP) configuration greatly improve the light throughput by about 93.48% ((SP-S)/S) in the case of unpolarized input.
A quantitative estimation of SNR for single- and dual-channel systems is necessarily measured. Then, the SNR of filtered (@ 450 nm, 532 nm, and 632 nm) and unfiltered images under S channel, P channel, and S + P channels is calculated, respectively. The results are shown in Table 2. Compared to the single channel (S), the SNR measurements of filtered and unfiltered images when simultaneously using S and P channels are 2.57 dB (@ 450 nm), 2.55 dB (@ 532 nm), and 2.65 dB (@ 632 nm).

Table 2.
SNR of filtered and unfiltered images under S, P, S + P channel relative to different wavelengths.
Several representative spectral images (filtered @ 450 nm, @ 532 nm, and @ 632 nm) were taken to verify the spectral filtering performance of the proposed MZ-LCTFs setup, as shown in Figure 10. It is apparent that the spectral features of the STU pattern made up of plastic sheets with different colors can be distinguished in these images. However, there are no obvious differences in the polarization array. Low light spectral intensities are acquired at 450 nm, while higher SNRs of the spectral images are obtained at 632 nm, which accurately characterizes the filtering performance of the LCTF at different wavelengths. In addition, the color fusion image is displayed in Figure 10d, which exhibits good consistency with the actual scene.
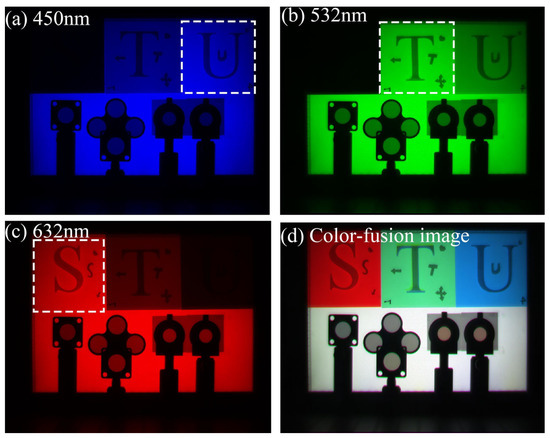
Figure 10.
Several spectral images and color fusion image: (a) spectral image (filtered @ 450 nm); (b) spectral image (filtered @ 532 nm); (c) spectral image (filtered @ 632 nm); (d) Color-fusion image.
Using the proposed method, six spectral images of each spectral channel corresponding to different polarization states modulated by LCVR1 and LCVR2 can be obtained. Notably, an image registration algorithm, such as a scale invariant feature transform algorithm [33], is required to solve the image mismatch caused by the inevitable slight deviation in the two optical transmission paths. Figure 11 illustrates the six polarization modulation images obtained at 532 nm, indicating the weak polarization characteristics of the colored plastic STU pattern by the lack of significant light intensity change among these images, while the polarization arrays (framed by the red dashed line) have strong polarization features, and as a result, their intensities vary dramatically with the LCVRs’ polarized modulation.
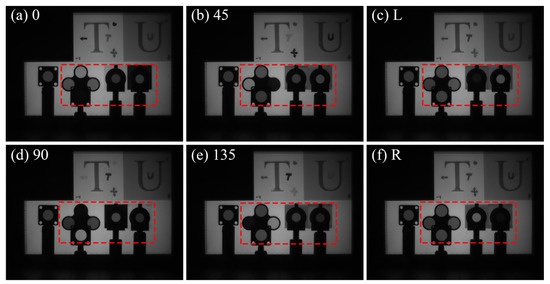
Figure 11.
Polarization images at 532 nm, corresponding to different LCVR polarization states: (a) polarization state of 0 degree linear polarizer; (b) polarization state of 45 degree linear polarizer; (c) polarization state of left-hand circular polarizer; (d) polarization state of 90 degree linear polarizer; (e) polarization state of 135 degree linear polarizer; (f) polarization state of right-hand circular polarizer.
To further verify the capability for LCVRs to recover polarimetric information, the four Stokes parameter images S0 − S3 at 532 nm calculated via Equations (7)–(10) are demonstrated in Figure 12.
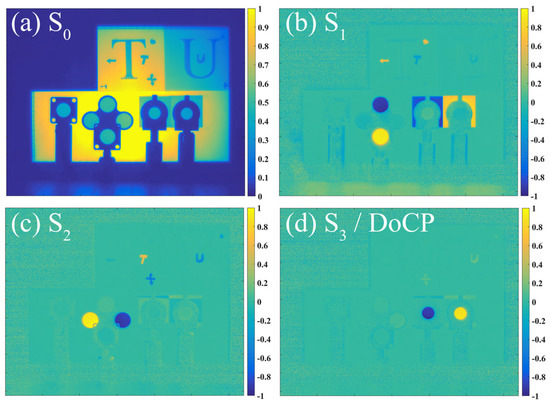
Figure 12.
Four Stokes vector images, S0 − S3, at 532 nm: (a) S0 vector image; (b) S1 vector image; (c) S2 vector image; (d) S3 vector image.
The light intensity of the polarization array region in the S1 − S3 polarization images varies significantly, while the attenuator region reveals no intensity. These results confirm that the polarization detection effectively compensates for the shortcoming of the traditional intensity detection. In addition, the region where a linear polarization is located contains obviously linearly polarized information is the S1 and S2 images. Similarly, the circular polarization array region in image S3 exhibits higher intensities, indicating that the circular polarization characteristic of this region is distinguishable. The linear polarization components with different angles can be further identified by comparing the S1 image with the S2 image.
Polarization information such as DoLP, DoP, and AoP are commonly used to accurately perform the polarization characteristics of an object or a scene, as shown in Figure 13. The comparison of DoLP and DoP polarization images illustrates that the linear polarization elements and circular polarization elements can be effectively separated from each other. The AoP pseudo-color images not only reflect the outline of the scene background, such as the shape of STU pattern highlights, but also provide the angles of the target with polarization.
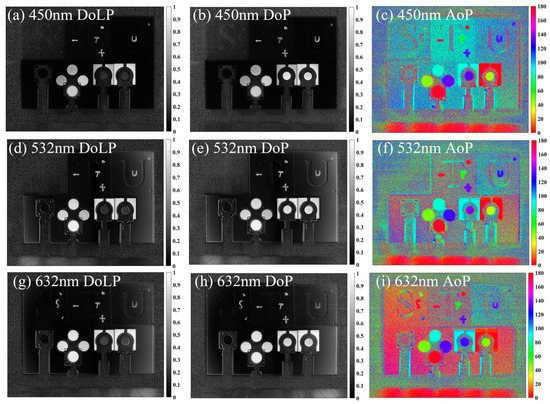
Figure 13.
DoLP, DoCP, and AoP images of the scene at different wavelengths: (a) DoLP image (@ 450 nm); (b) DoP image (@ 450 nm); (c) AoP image (@ 450 nm); (d) DoLP image (@ 532 nm); (e) DoP image (@ 532 nm); (f) AoP image (@ 532 nm); (g) DoLP image (@ 632 nm); (h) DoP image (@ 632 nm); (i) AoP image (@ 632 nm).
To verify the measurement robustness of the polarization results [34], the 11 × 11 region of DoLP and DoCP is selected to calculate the Stokes parameters, as shown in Figure 14. The measured DoLP values of the linear polarization region are 0.92 ± 0.02 (@ 450 nm), 0.94 ± 0.02 (@ 532 nm), and 0.90 ± 0.01 (@ 632 nm), and the average errors of the AoP are 1.97° (@ 450 nm), 1.86° (@ 532 nm), and 1.98° (@ 632 nm). The measured DoCP values are 0.91 ± 0.02 (@ 450 nm), 0.90 ± 0.02 (@ 532 nm), and 0.86 ± 0.02 (@ 632 nm). Although the transmittance and bandwidth of LCTFs affect the accuracy of polarization reconstruction, the results still effectively verify the reproducibility and applicability of the proposed method at other wavelengths.
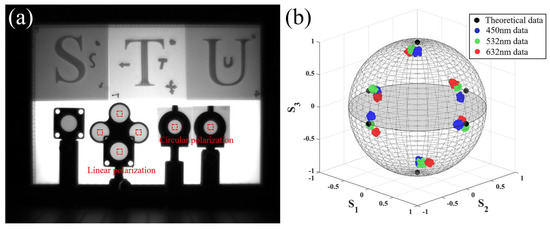
Figure 14.
(a) The selected region polarization measurements. (b) Measured polarization states (@ 450 nm, 532 nm, and 632 nm) are shown on the Poincaré sphere.
The Standard Deviations (STDs) of the DoLP and DoCP images corresponding to three wavelengths is used to evaluate the polarization SNR of LCVRs, as is shown in Table 3. The average STDs of DoLP and DoCP are 0.016 and 0.018, indicating that LCVRs can be used efficiently against noise and recover polarization information with high accuracy in a wide band.

Table 3.
STDs of DoLP and DoCP images relative to different wavelengths.
Edge intensity (EI) is calculated to confirm that the spectral polarization images can provide the advantage of prominent target features compared to conventional intensity images. As shown in Table 4, compared to the spectral intensity images, the EIs of the polarization images are improved by 54.60% (@ 450 nm), 60.60% (@ 532 nm), and 60.18% (@ 632 nm), indicating the ability of polarization detection to highlight target detail [35].

Table 4.
EIs of intensity and polarization images relative to different wavelengths.
Using imaging fusion [36] can enrich target or scene multidimensional information, as shown in Figure 15. Compared to the conventional intensity image, the STU pattern in the spectral image in Figure 15b can apparently be identified as a red S letter, green T letter, and blue U letter, showing the excellent ability of LCTFs to discriminate spectral components. In the polarization image in Figure 15c, the brightness of areas where the polarizer sheets with small STU letters, heart shape, arrow and double arrow, linear polarized arrays, and circularly polarized arrays are located are highlighted. However, the areas where attenuator sheets and large STU letters composed of plastic are located are completely hidden in the background. It presents the interesting situation that STU patterns made up of different materials can be distinguished from polarized light and unpolarized light. The addition of LCVRs provides a full-Stokes polarimetric capability to LCTF spectral images, which could enhance the task of preventing detection even more in situations where spectral signatures are of limited value. The spectral polarization fusion image in Figure 15d not only maintains the information of each spectral channel of the scene, but also highlights the edge detail information of the target with different polarization features. Reasonable and flexible use of spectral polarization information can greatly enrich the scene content and achieve rapid recognition of targets.
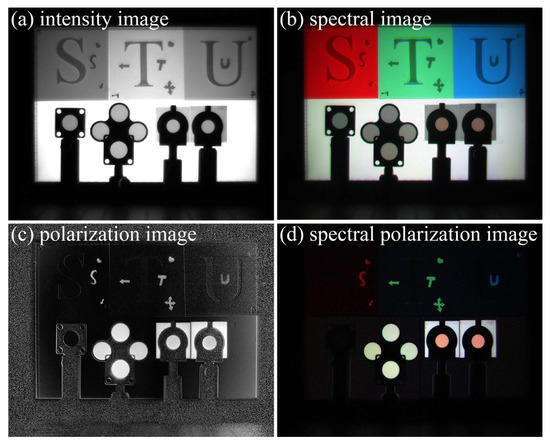
Figure 15.
Different information images: (a) intensity image; (b) spectral image; (c) polarization image; (d) spectral polarization image.
The experimental results are extremely consistent with the actual configuration, indicating that experimental apparatus and the proposed measuring method can ensure the simultaneous acquisition of 4D information with high SNR of the target at high bright flux. The spectral polarization imaging capability of this system can be improved in several aspects, such as precise calibration of the optical path, LCVRs’ dispersion compensation, and optimization of the LCTFs, bandwidth.
5. Conclusions
In conclusion, we proposed a high transmittance spectral polarization imaging method by combining Mach–Zehnder structured LCTFs and LCVRs. The MZ-LCTF’s configuration improves the optical throughput (measured by MPI) by 93.48% compared to the traditional single channel LCTF. The average SNR increment of filtered and unfiltered images when simultaneously using polarization S and P channels is 2.59 dB compared to a single channel. The imaging experiment results verify the proposed MZ-LCTF-LCVR’s configuration is a feasible and efficient tool to simultaneously obtain the image, spectral, and polarization information of a target in low-lighting scenes. Further research will focus on improving the spectral resolution of LCTFs and optimizing the characteristics of LCVRs, such as stability and transmittance.
Author Contributions
Conceptualization, L.C. and S.Z.; methodology, L.C. and W.Z.; validation, L.C., W.Z. and S.Z.; formal analysis, L.C. and S.Z.; investigation, L.C.; resources, L.Y.; data curation, L.C.; writing—original draft preparation, L.C.; writing—review and editing, S.Z.; supervision and funding acquisition, L.Y. All authors have read and agreed to the published version of the manuscript.
Funding
National Key Research and Development Program of China (No.2021YFB3600300); Natural Science Foundation of Guangdong Province (No.2021A1515011931); Special Projects in Key Fields of Colleges and Universities of Guangdong Province (No.2021ZDZX1051); Open Funding Project of State Key Laboratory of Applied Optics (No.SKLAO2021001A15); STU Scientific Research Initiation Grant (NTF.22022; NTF19038); and Engineering Research Center of digital graphic and next-generation printing, Jiangsu Province, Soochow University (SDGC2248).
Institutional Review Board Statement
Not applicable.
Informed Consent Statement
Not applicable.
Data Availability Statement
Data underlying the results presented in this paper are not publicly available at this time but may be obtained from the author upon reasonable request.
Conflicts of Interest
The authors declare no conflict of interest.
References
- Gorbunov, G.G.; Drichko, N.M.; Starichenkova, V.D.; Taganov, O.K. Polarization hyperspectrometers: A review. J. Opt. Technol. 2018, 85, 291–295. [Google Scholar] [CrossRef]
- Bieszczad, G.; Gogler, S.; Swiderski, J. Review of design and signal processing of polarimetric imaging cameras. Opto-Electron. Rev. 2021, 29, 5–12. [Google Scholar]
- Si, Y.; Lu, Q.; Zhang, X.; Hu, X.; Fu, W.; Li, L.; Gu, S. A review of advances in the retrieval of aerosol properties by remote sensing multi-angle technology. Atmos. Environ. 2021, 244, 117928. [Google Scholar] [CrossRef]
- Dremin, V.; Marcinkevics, Z.; Zherebtsov, E.; Popov, A.; Grabovskis, A.; Kronberga, H.; Geldnere, K.; Doronin, A.; Meglinski, L. Skin complications of diabetes mellitus revealed by polarized hyperspectral imaging and machine learning. IEEE Trans. Med. Imaging 2021, 40, 1207–1216. [Google Scholar] [CrossRef] [PubMed]
- Martínez-Domingo, M.Á.; Calero Castillo, A.I.; Vivar García, E.; Valero, E.M. Evaluation of cleaning processes using colorimetric and spectral data for the removal of layers of limewash from medieval plasterwork. Sensors 2020, 20, 7147. [Google Scholar] [CrossRef] [PubMed]
- Kudenov, M.W.; Lowenstern, M.E.; Craven, J.M.; LaCasse, C.F. Field deployable pushbroom hyperspectral imaging polarimeter. Opt. Eng. 2017, 56, 103107. [Google Scholar] [CrossRef]
- Zhu, W.; Li, J.; Li, L.; Wang, A.; Wei, X.; Mao, H. Nondestructive diagnostics of soluble sugar, total nitrogen and their ratio of tomato leaves in greenhouse by polarized spectra–hyperspectral data fusion. Int. J. Agric. Biol. Eng. 2020, 13, 189–197. [Google Scholar] [CrossRef]
- Zhao, J.; Zhou, B.; Wang, G.; Ying, J.; Liu, J.; Chen, Q. Spectral Camouflage Characteristics and Recognition Ability of Targets Based on Visible/Near-Infrared Hyperspectral Images. Photonics 2022, 9, 957. [Google Scholar] [CrossRef]
- Li, N.; Zhao, Y.; Pan, Q.; Kong, S.G.; Chan, J.C.W. Illumination-invariant road detection and tracking using LWIR polarization characteristics. ISPRS J. Photogramm. Remote Sens. 2021, 180, 357–369. [Google Scholar] [CrossRef]
- Rodríguez, C.; Van Eeckhout, A.; Garcia-Caurel, E.; Lizana, A.; Campos, J. Automatic pseudo-coloring approaches to improve visual perception and contrast in polarimetric images of biological tissues. Sci. Rep. 2022, 12, 18479. [Google Scholar] [CrossRef]
- Zhang, X.; Huang, L.; Zhu, J.; Zhang, N.; Zong, K.; Zhai, L.; Zhang, Y.; Cai, Y.; Wang, H. Exact optical path difference and complete performance analysis of a spectral zooming imaging spectrometer. Opt. Express 2022, 30, 39479–39491. [Google Scholar] [CrossRef] [PubMed]
- Liu, Q.; Bai, C.; Liu, J.; He, J.; Li, J. Fourier transform imaging spectropolarimeter using ferroelectric liquid crystals and Wollaston interferometer. Opt. Express 2017, 25, 19904–19922. [Google Scholar] [CrossRef] [PubMed]
- Bo, J.; Gu, Y.; Xing, W.; Ju, X.; Yan, C.; Wang, X. Spatially modulated snapshot computed tomographic polarization imaging spectrometer. Appl. Opt. 2021, 60, 5860–5866. [Google Scholar] [CrossRef] [PubMed]
- Song, H.; Mehdi, S.R.; Wu, C.; Li, Z.; Gong, H.; Ali, A.; Huang, H. Underwater spectral imaging system based on liquid crystal tunable filter. J. Mar. Sci. Eng. 2021, 9, 1206. [Google Scholar] [CrossRef]
- Li, Q.; Lu, F.; Wang, X.; Zhu, C. Low crosstalk polarization-difference channeled imaging spectropolarimeter using double-Wollaston prism. Opt. Express 2019, 27, 11734–11747. [Google Scholar] [CrossRef]
- Zhang, N.; Zhu, J.; Zhang, Y.; Zong, K. Snapshot broadband polarization imaging based on Mach-Zehnder-grating interferometer. Opt. Express 2020, 28, 33718–33730. [Google Scholar] [CrossRef] [PubMed]
- Bai, C.; Li, J.; Zhang, W.; Xu, Y.; Feng, Y. Static full-Stokes Fourier transform imaging spectropolarimeter capturing spectral, polarization, and spatial characteristics. Opt. Express 2021, 29, 38623–38645. [Google Scholar] [CrossRef]
- Martínez-Domingo, M.Á.; Nieves, J.L.; Valero, E.M. Eight-channel multispectral image database for saliency prediction. Sensors 2021, 21, 970. [Google Scholar] [CrossRef]
- Murakami, Y.; Yamaguchi, M.; Ohyama, N. Hybrid-resolution multispectral imaging using color filter array. Opt. Express 2012, 20, 7173–7183. [Google Scholar] [CrossRef]
- Zhang, R.; Wen, T.; Wang, Y.; Wang, Z.; Li, K. Spectropolarimetric detection using photoelastic modulators and acousto-optic tunable filter. Appl. Opt. 2015, 54, 8686–8693. [Google Scholar] [CrossRef]
- Yang, Q.; Sun, T.; Wu, X.; Cui, G.; Yang, M.; Bai, Z.; Wang, L.; Li, H.; Chen, W.; Leng, Q.; et al. Fast Tunable Biological Fluorescence Detection Device with Integrable Liquid Crystal Filter. Crystals 2021, 11, 272. [Google Scholar] [CrossRef]
- Shinatake, K.; Ishinabe, T.; Shibata, Y.; Fujikake, H. High-speed Tunable Multi-Bandpass Filter for Real-time Spectral Imaging using Blue Phase Liquid Crystal Etalon. ITE Trans. Media Technol. Appl. 2020, 8, 202–209. [Google Scholar] [CrossRef]
- Abuleil, M.; Abdulhalim, I. Narrowband multispectral liquid crystal tunable filter. Opt. Lett. 2016, 41, 1957–1960. [Google Scholar] [CrossRef] [PubMed]
- Messaadi, A.; Vargas, A.; Sanchez-Lopez, M.M.; Garcia-Martinez, P.; Kula, P.; Bennis, N.; Moreno, L. Solc filters in a reflective geometry. J. Opt. 2017, 19, 045703. [Google Scholar] [CrossRef]
- Tam, A.M.W.; Qi, G.; Srivastava, A.K.; Wang, X.Q.; Wang, F.F.; Chigrinov, V.G.; Kwok, H.S. Enhanced performance configuration for fast-switching deformed helix ferroelectric liquid crystal continuous tunable Lyot filter. Appl. Opt. 2014, 53, 3787–3795. [Google Scholar] [CrossRef]
- Abdlaty, R.; Orepoulos, J.; Sinclair, P.; Berman, R.; Fang, Q. High throughput AOTF hyperspectral imager for randomly polarized light. Photonics 2018, 5, 3. [Google Scholar] [CrossRef]
- Oiknine, Y.; August, I.; Stern, A. Along-track scanning using a liquid crystal compressive hyperspectral imager. Opt. Express 2016, 24, 8446–8457. [Google Scholar] [CrossRef]
- Fan, A.; Xu, T.; Ma, X.; Li, J.; Wang, X.; Zhang, Y.; Xu, C. Four-dimensional compressed spectropolarimetric imaging. Signal Process. 2022, 195, 108437. [Google Scholar] [CrossRef]
- August, I.; Oiknine, Y.; AbuLeil, M.; Abdulhalim, I.; Stern, A. Miniature compressive ultra-spectral imaging system utilizing a single liquid crystal phase retarder. Sci. Rep. 2016, 6, 23524. [Google Scholar] [CrossRef]
- AbuLeil, M.J.; Pasha, D.; August, I.; Pozhidaev, E.P.; Barbashov, V.A.; Tkachenko, T.P.; Kuznetsov, A.V.; Abdulhalim, I. Helical nanostructures of ferroelectric liquid crystals as fast phase retarders for spectral information extraction devices: A comparison with the nematic liquid crystal phase retarders. Materials 2021, 14, 5540. [Google Scholar] [CrossRef]
- Wang, X.; Zhang, Y.; Ma, X.; Xu, T.; Arce, G.R. Compressive spectral imaging system based on liquid crystal tunable filter. Opt. Express 2018, 26, 25226–25243. [Google Scholar] [CrossRef] [PubMed]
- Fan, A.; Xu, T.; Li, J.; Teng, G.; Wang, X.; Zhang, Y.; Xu, C. Compressive full-Stokes polarization and flexible hyperspectral imaging with efficient reconstruction. Opt. Lasers Eng. 2023, 160, 107256. [Google Scholar] [CrossRef]
- Liu, Y.; Tian, J.; Hu, R.; Yang, B.; Liu, S.; Yin, L.; Zheng, W. Improved Feature Point Pair Purification Algorithm Based on SIFT During Endoscope Image Stitching. Front. Neurorobotics 2022, 16, 840594. [Google Scholar] [CrossRef] [PubMed]
- Aguilar-Fernández, E.; Bruce, N.C.; Rodríguez-Herrera, O.G.; Espinosa-Luna, R. Calibration and data extraction in a Stokes polarimeter employing three wavelengths simultaneously. Appl. Opt. 2021, 60, 5153. [Google Scholar] [CrossRef] [PubMed]
- Fu, Q.; Yang, W.; Si, L.; Zhang, M.; Zhang, Y.; Luo, K.; Zhan, J.; Zhang, S. Study of multispectral polarization imaging in sea fog environment. Front. Phys. 2023, 11, 1129517. [Google Scholar] [CrossRef]
- Karim, S.; Tong, G.; Li, J.; Qadir, A.; Farooq, U.; Yu, Y. Current advances and future perspectives of image fusion: A comprehensive review. Inf. Fusion 2023, 90, 185–217. [Google Scholar] [CrossRef]
Disclaimer/Publisher’s Note: The statements, opinions and data contained in all publications are solely those of the individual author(s) and contributor(s) and not of MDPI and/or the editor(s). MDPI and/or the editor(s) disclaim responsibility for any injury to people or property resulting from any ideas, methods, instructions or products referred to in the content. |
© 2023 by the authors. Licensee MDPI, Basel, Switzerland. This article is an open access article distributed under the terms and conditions of the Creative Commons Attribution (CC BY) license (https://creativecommons.org/licenses/by/4.0/).