1. Introduction
Explosive devices carried covertly can be identified by a number of unmasking signs, which include trace amounts of explosive substances on the hands of a person and various surfaces that have come into contact with these substances (for example, clothing, the surface of hand luggage, covers, packaging elements, body lock handles, etc.). Objects that had gas-air or direct contact with an explosive device or explosive substance can adsorb explosive particles on their surface and retain them for quite a long time. Attempts to get rid of such traces do not always achieve their goal. Traces of explosives on a person’s hands last up to several hours, and even a single washing of hands with soap cannot guarantee getting rid of their presence.
The aim of the study presented in the publication was to develop a method for visualizing traces of explosives in sweat-fat fingerprints and using macrophotography to quantify surface concentration. These studies complement a large cycle of works carried out by the authors in recent years on the remote detection of traces by the LF/LIF method. That is why the results of the macrophotographic polarization method are compared with the results of the LF/LIF method, which is well known to the authors from previous works.
Briefly, the essence of the LF/LIF method is to use the effect of photodissociation (photofragmentation, photolysis) of optically inactive molecules in order to form characteristic fragments that are highly efficient in the LIF process. The choice of a functional group (or part of it) of the initial compound as a characteristic fragment makes it possible to reliably determine whether it belongs to a particular class of compounds. For example, for all nitro compounds, the presence of nitro or nitroso groups in their structure is common. The nitric oxide molecules (NO-fragments) formed during the photofragmentation of nitro compounds can obviously serve as markers of the initial compounds [
1,
2,
3,
4,
5,
6,
7,
8,
9,
10,
11,
12,
13,
14,
15,
16,
17].
2. Microstructure of RDX Traces in Fingerprints
To simulate contact with explosives, the index finger of the hand was pressed to a surface with powdered cyclotrimethylenetrinitramine (RDX). The pressure force (2.2 ± 0.2 N) in this case corresponded to the minimum grip force F required to hold an object weighing 200 g with two fingers at a friction coefficient of 0.5.
After the explosive particles were transferred to the finger of the hand, it was repeatedly applied to a clean surface, leaving sweat-fat prints with explosive particles on it. A glass slide was used as a trace-receiving surface. Glasses with the first, tenth, twentieth, thirtieth, fortieth, fiftieth, sixtieth, seventieth, eightieth, ninetieth, and hundredth fingerprints were used for the subsequent study of the microstructure of traces of explosives and experimental study of the possibility of their remote detection by the LF/LIF method.
It is known that RDX crystalline particles possess natural optical activity [
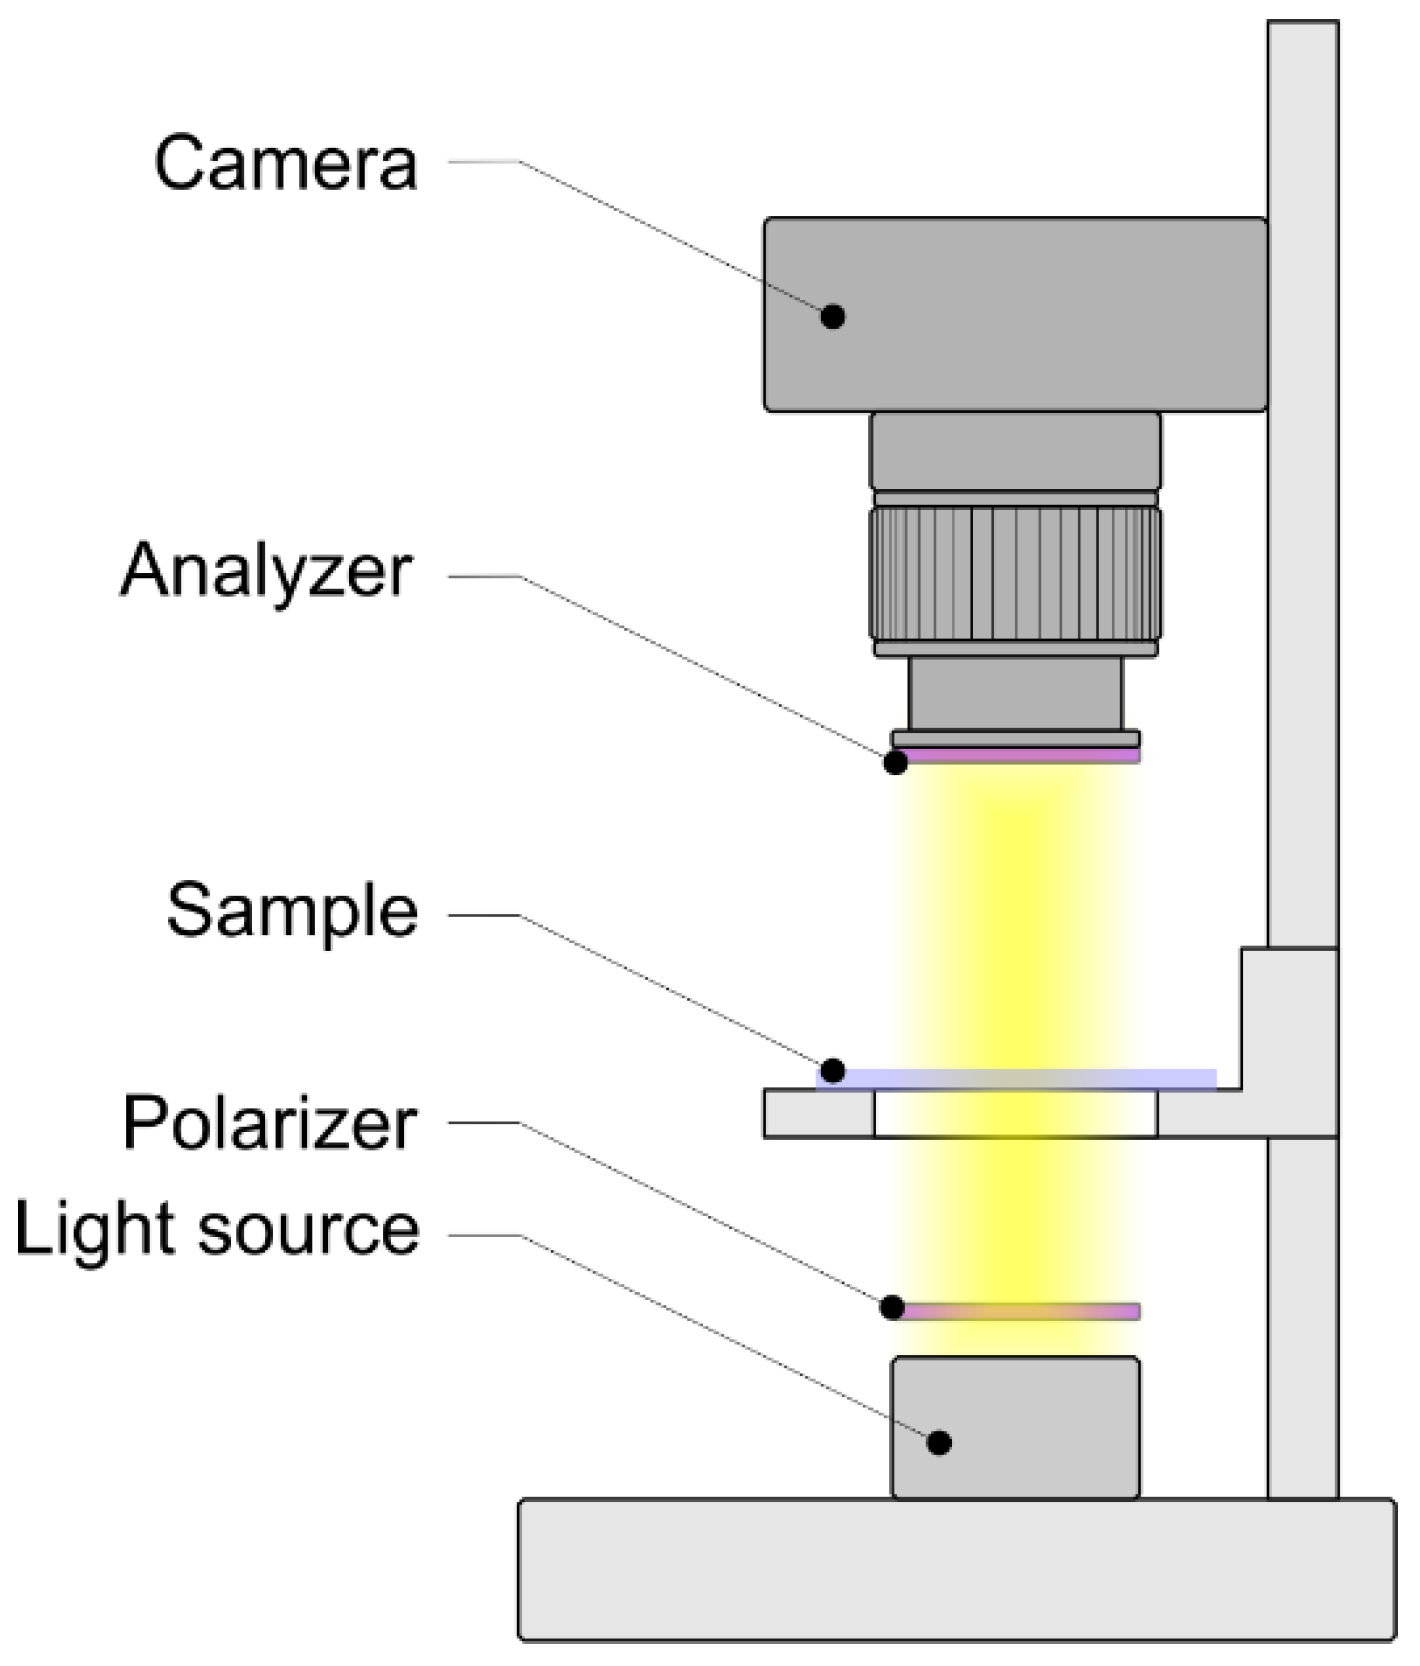
18]. When linearly polarized light passes through such substances, the polarization plane of light turns out to be rotated relative to its initial position. The phenomenon of the polarization plane rotation can be used to increase the contrast in the recognition of crystalline RDX particles against the background of a sweat-fat fingerprint consisting of an amorphous substance. To do this, the preparation must be placed in transmitted light between two crossed polarizers.
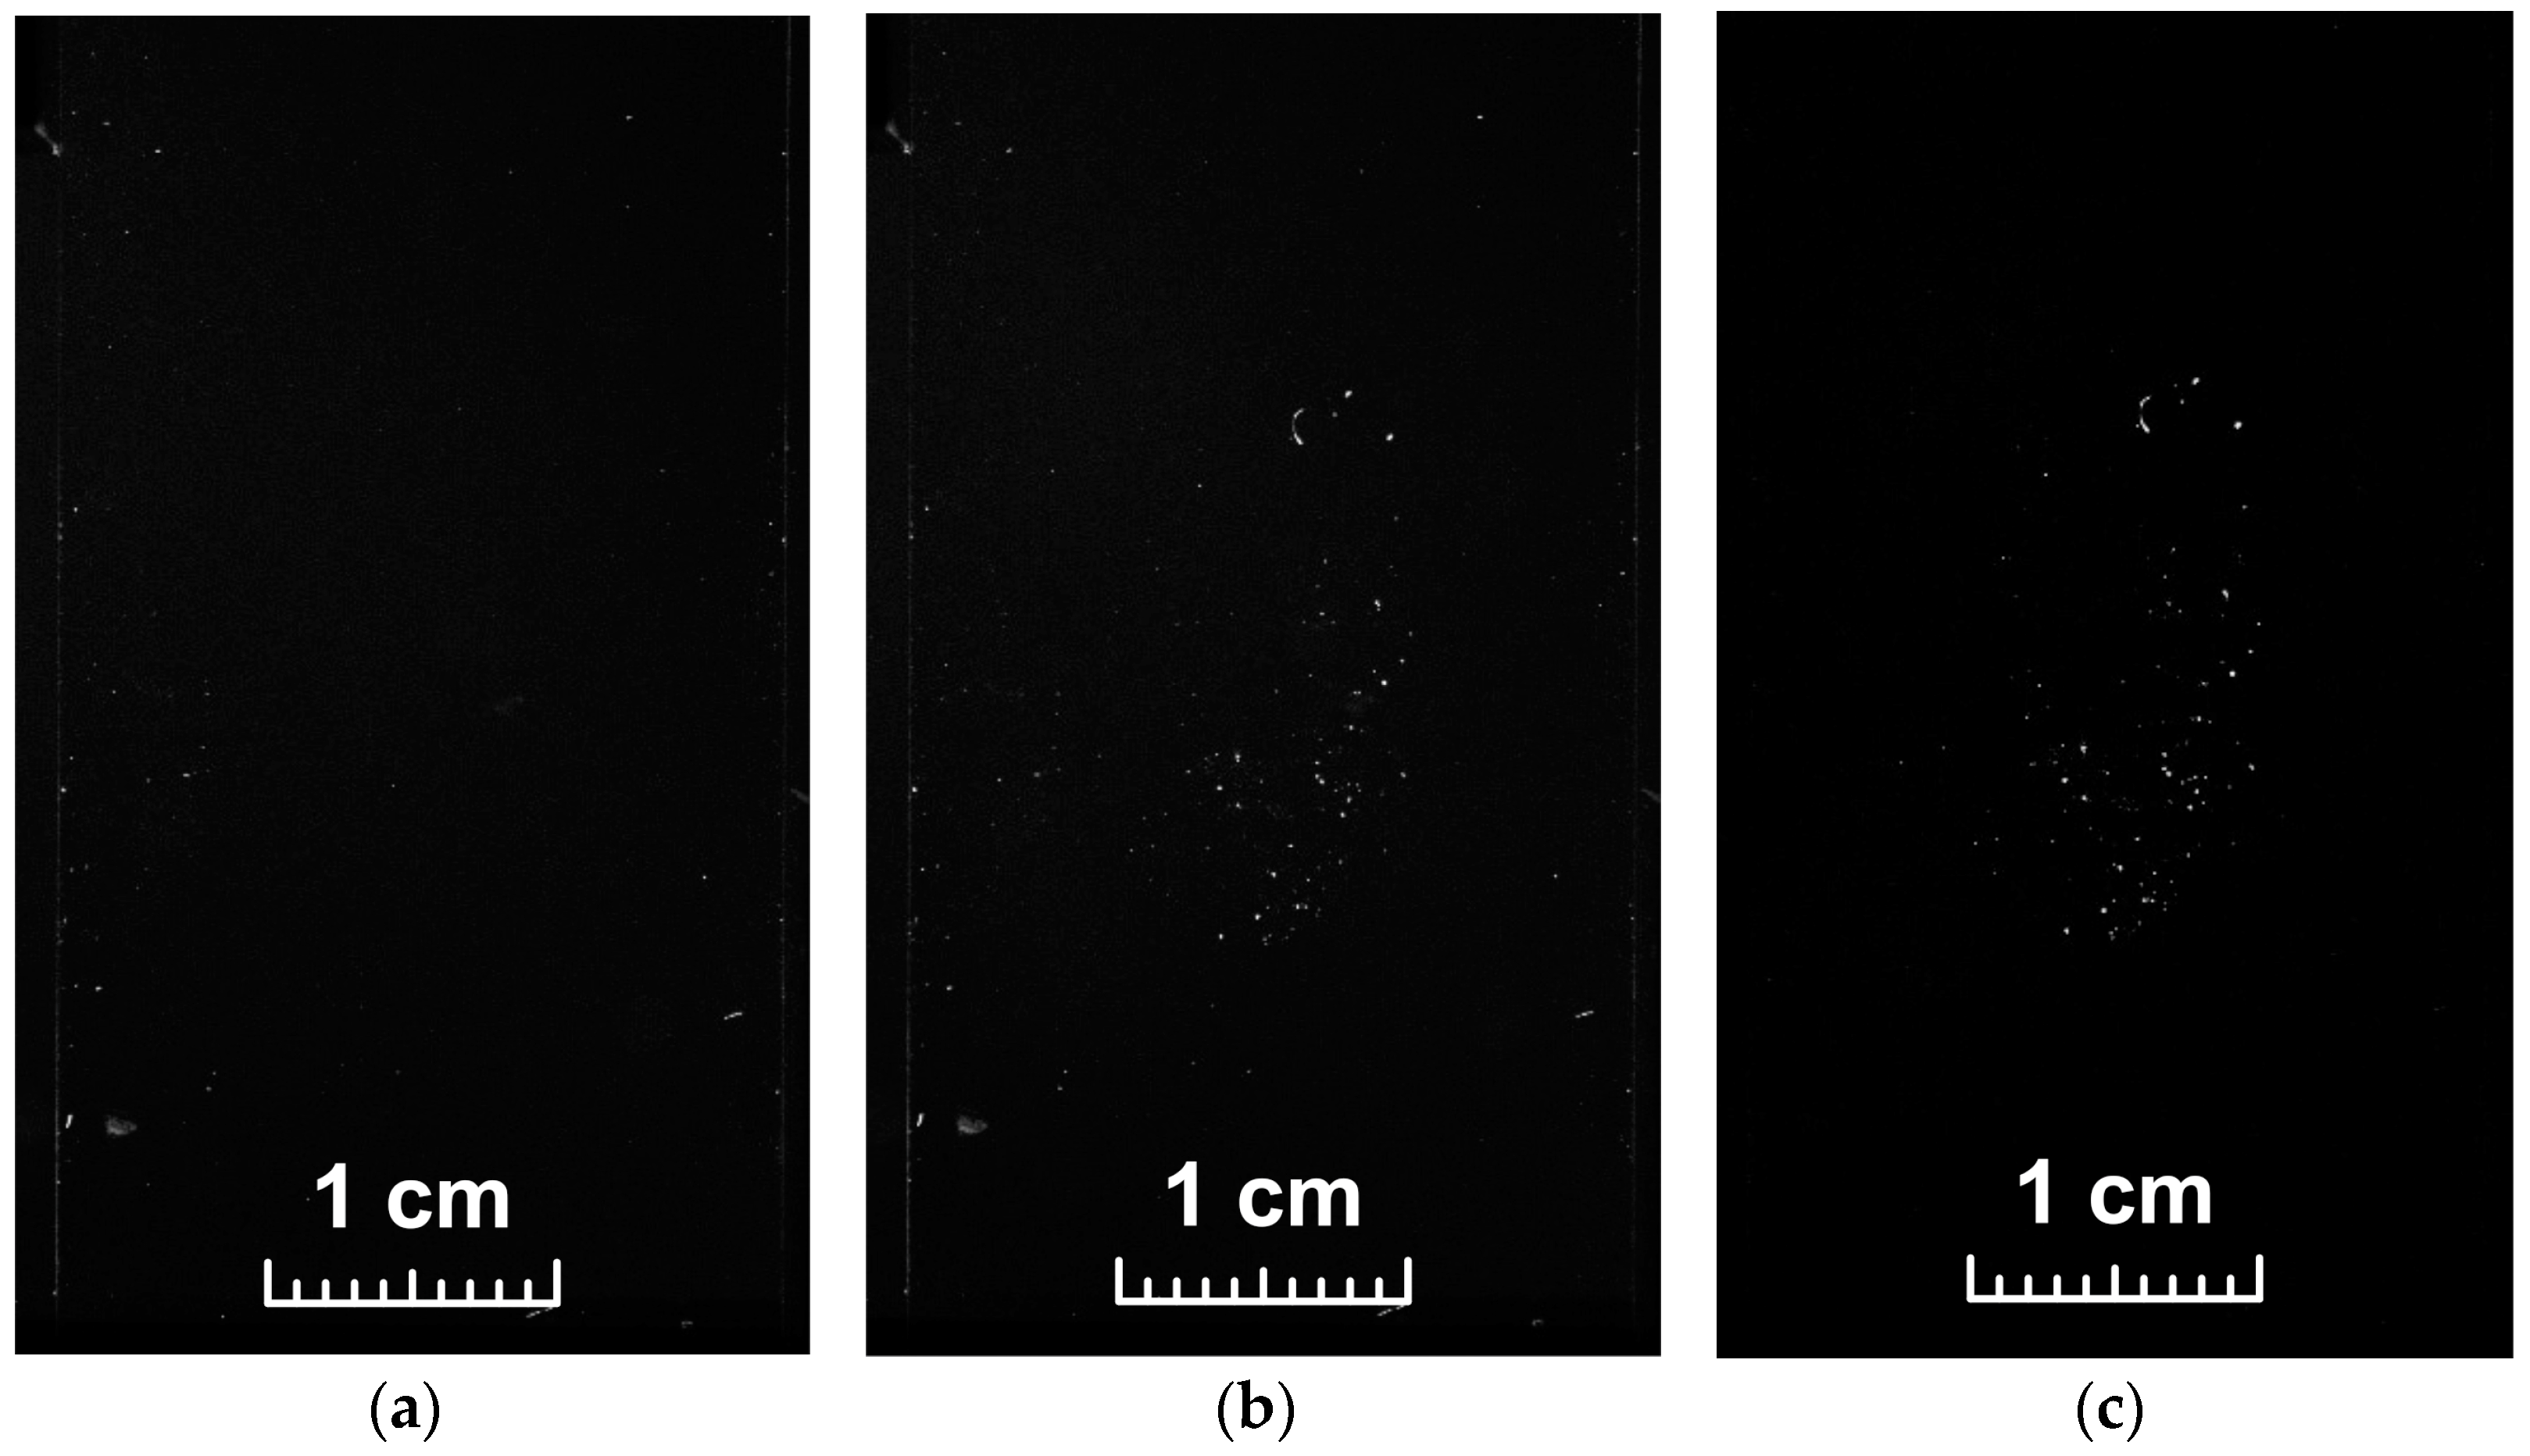
Figure 1 shows a layout of stand for macrophotography of explosive traces in transmitted light using a Canon EOS 500D camera with an EF-S 18-55 f/3.5-5.6 IS lens. Digital images of a glass slide placed between two crossed polarizers (Edmund Optics, Stock #45-668) before and after the 50th fingerprint was applied are shown in
Figure 2a and 2b, respectively.
Figure 2a shows that the image of a “clean” glass slide contains bright blotches—a sign of unintentional contamination of the glass surface with particles of a “foreign” substance that rotates the plane of polarization of the transmitted radiation. As expected, their presence persists even after the application of the target substance to the same surface (
Figure 2b). The exclusion of such artifacts was carried out by pixel-by-pixel “subtraction” of the image (a) from the image (b) during digital processing using the
ImageJ program (
https://imagej.nih.gov/ij/ (accessed on14 November 2022)) and obtaining a difference image as a result. The result of such image processing is shown in
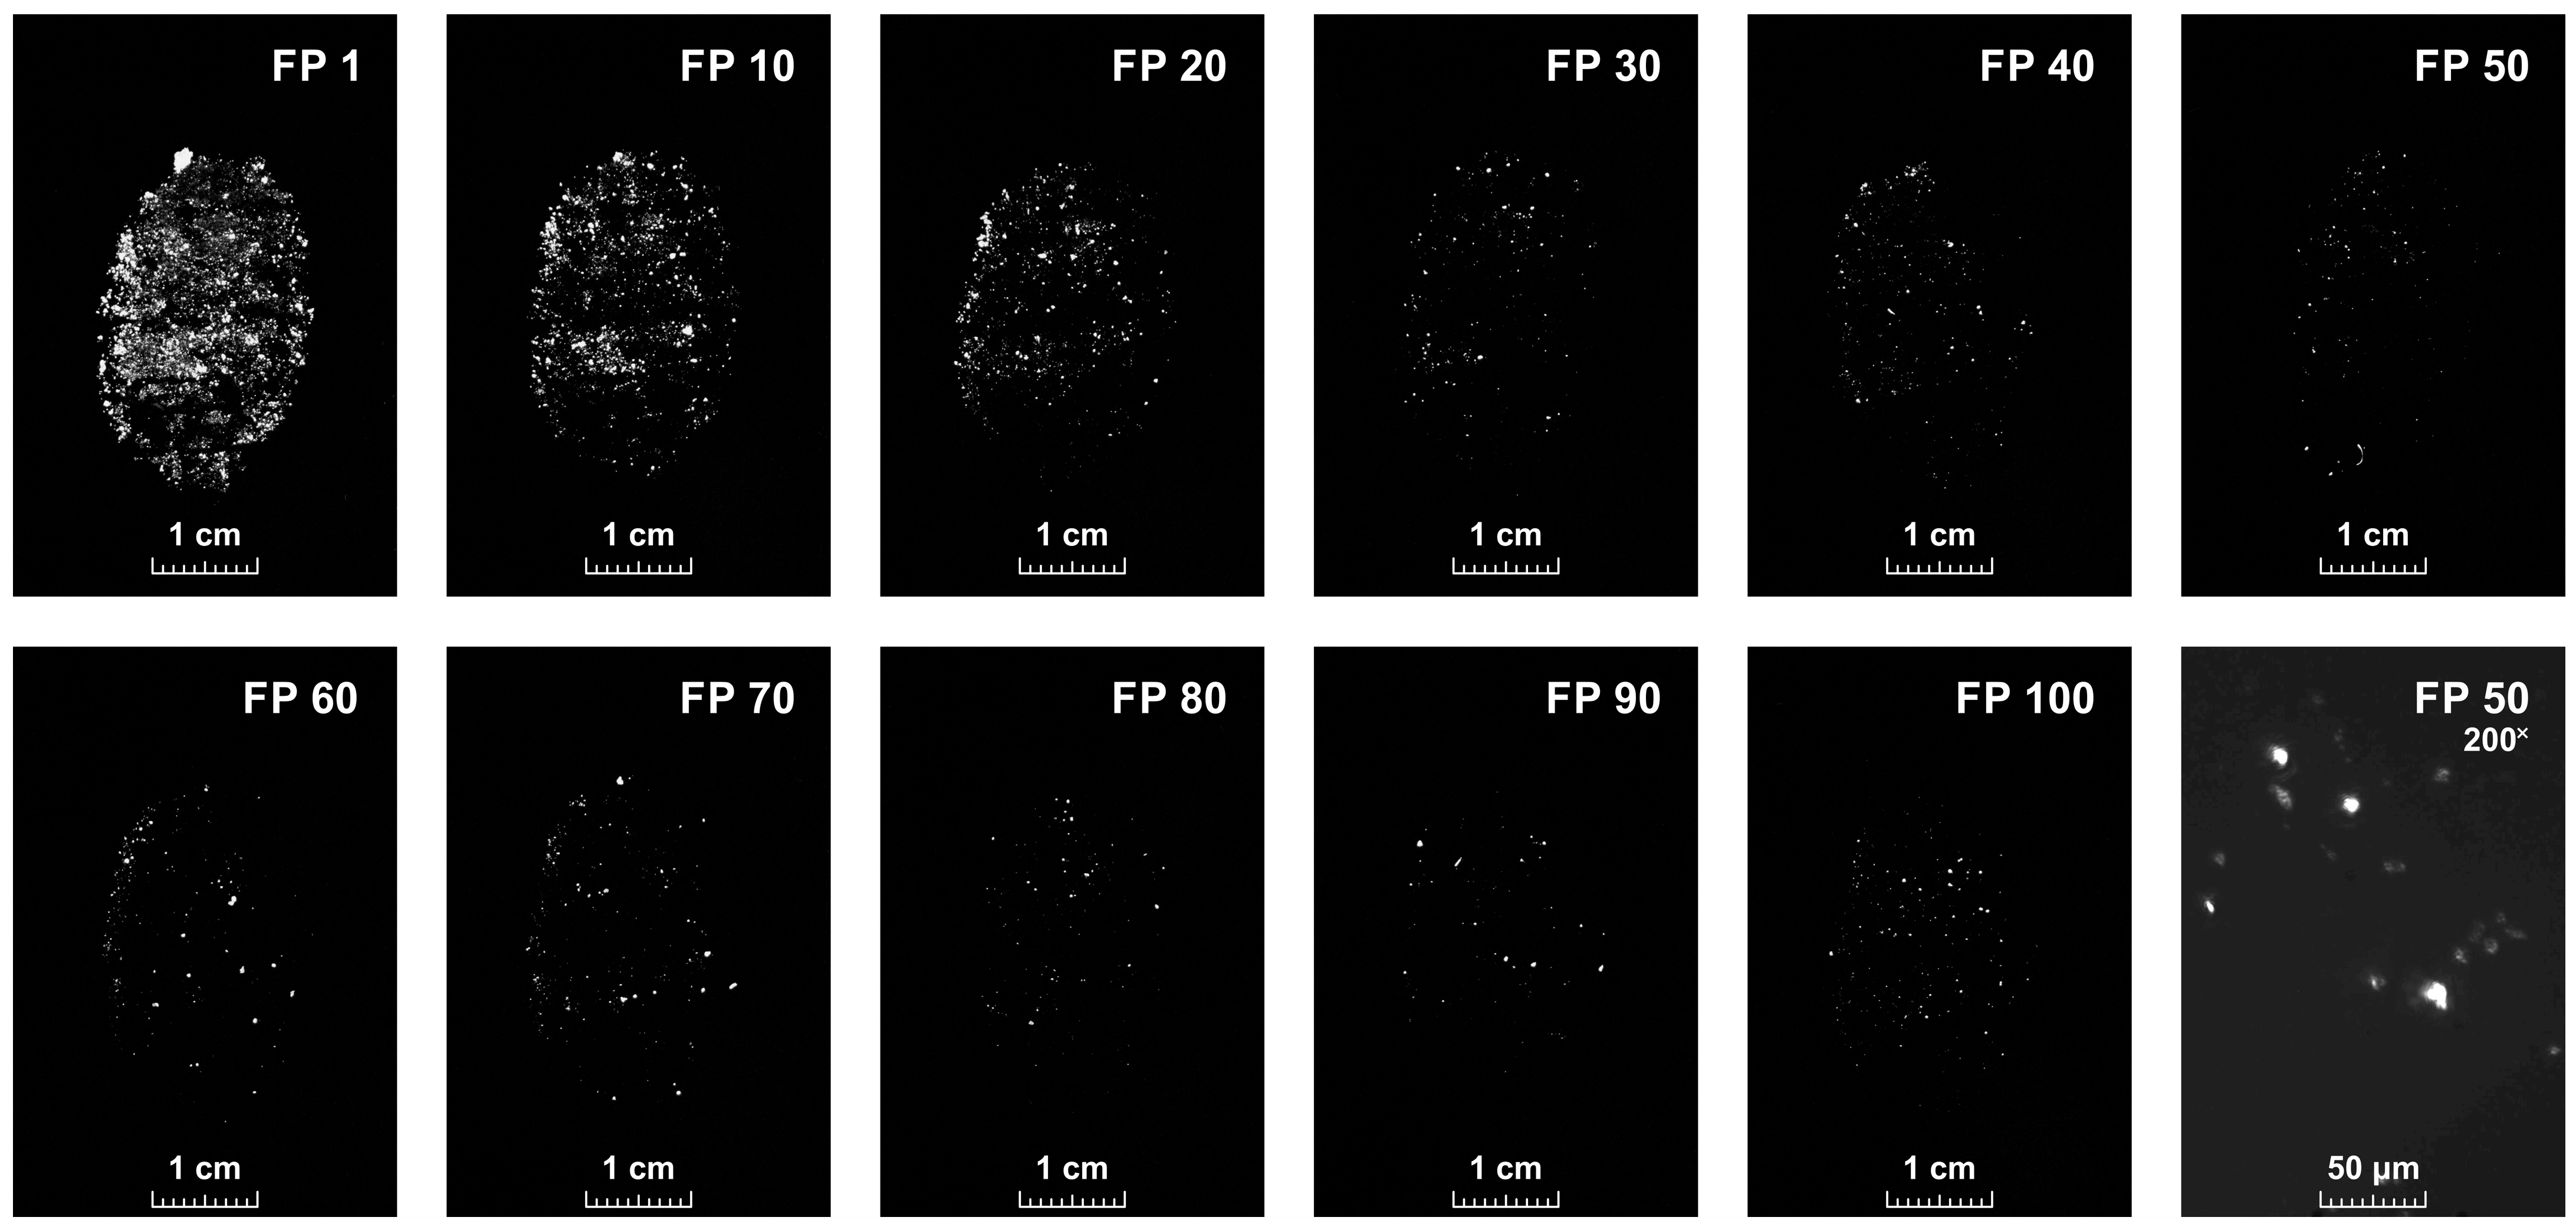
Figure 2c. Difference images of all samples are shown in
Figure 3.
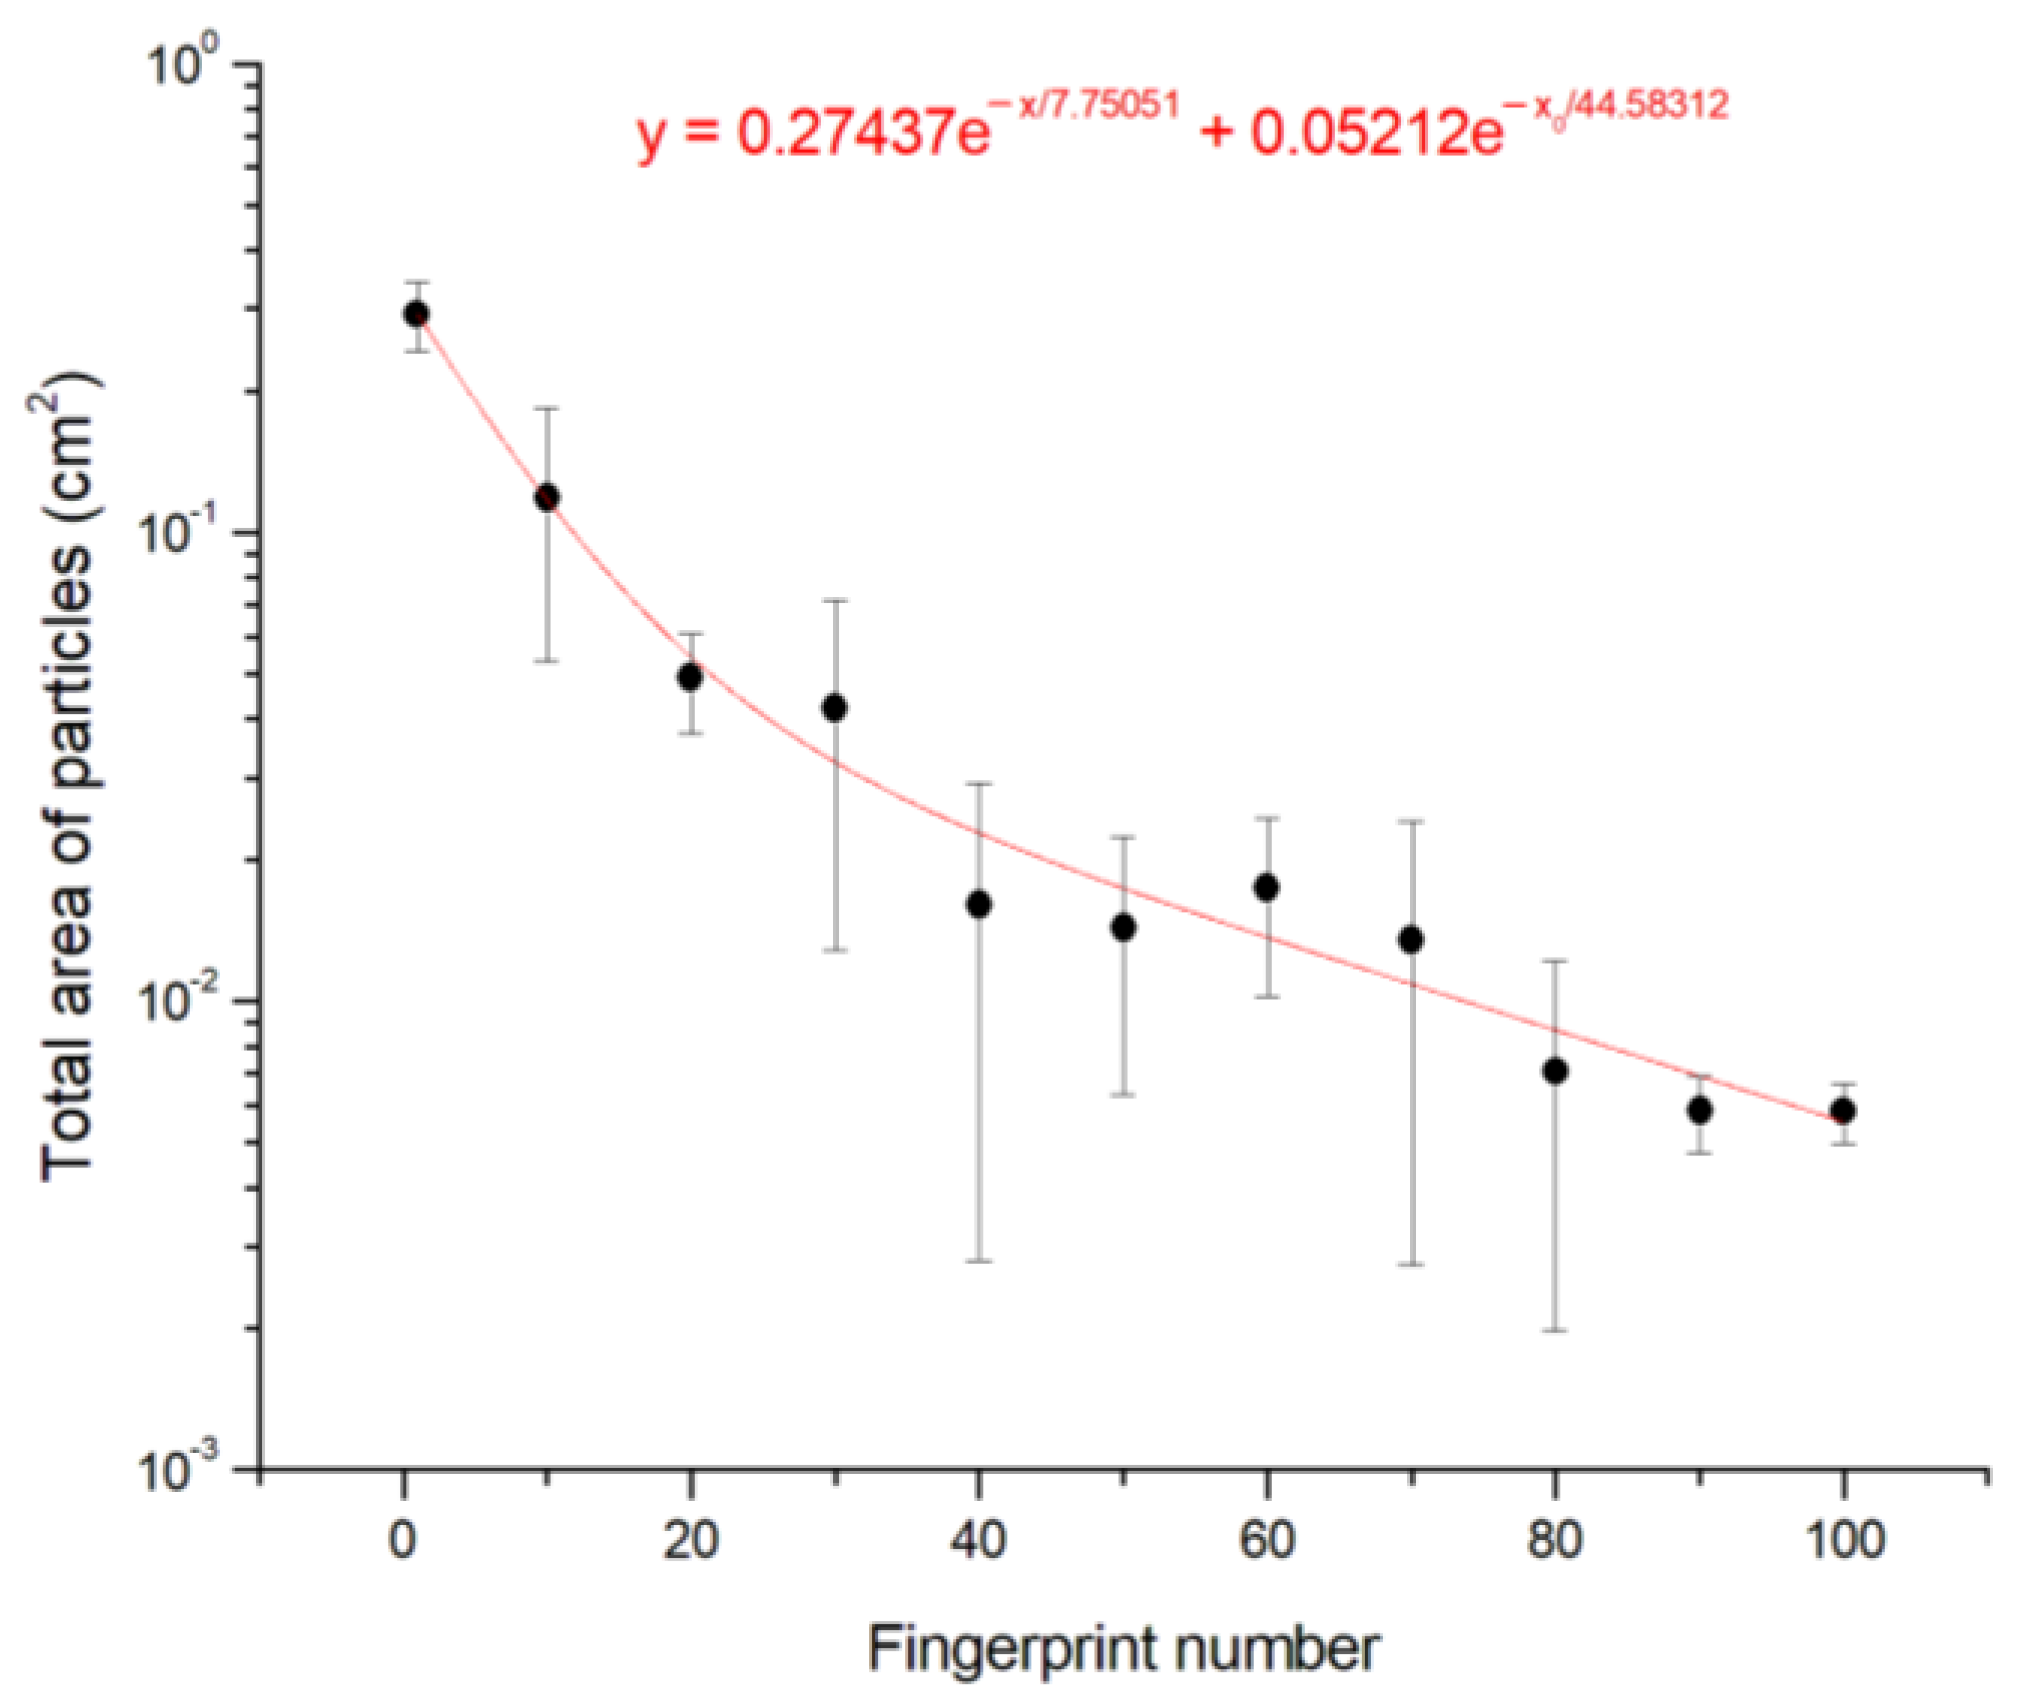
As can be seen from the figure, the trace area decreases significantly when moving from the 1st to the 100th fingerprint. Quantitative pixel-by-pixel analysis of macrophotographs showed that the decrease in the trace area occurs monotonically, and for the 100th fingerprint, this area is approximately two orders of magnitude smaller than the initial one (
Figure 4).
Analysis of the trace macrophotographs shows that the projections of RDX particles onto the substrate plane have various shapes (
Figure 5a–c). In this case, we are dealing with flat figures, the size of which can be characterized using some equivalent parameters. These can be the maximum and minimum diameters (linear size), Feret and Martin diameters, etc., each of which determines the effective particle size.
To determine the effective volume of particles, one can use an approximation that assumes the replacement of real particles by equivalent particles of a regular geometric shape. In [
18], to estimate the volume
V of RDX microscopic particles in fingerprints, it was proposed to use the expression
where
deq is the surface-equivalent diameter—the diameter of a circle, the area of which is equal to the area of the surface projection of the original particle (
Figure 5d) and
h ≈ 0.31
deq is the particle thickness.
Thus, knowing the volume of particles and the density of RDX (1.858 g/cm
3), one can estimate the total mass of explosives in fingerprints. The results of such calculations showed that the mass of the transferred explosive at the first touch is ~3 mg and decreases to ~30 µg in a hundredth fingerprint.
Figure 6 shows the calculated dependence of the surface concentration of RDX in fingerprints with an area of ~3 cm
2.
3. Remote Detection of Traces of Explosives in Fingerprints Using the LF/LIF Method
The block diagram of the setup for experimental studies is shown in
Figure 7.
To perform the fragmentation of the RDX molecules and excite the fluorescence of their NO-fragments, we used a tunable KrF-laser with a narrow generation line of ~5 pm in the region of the bandhead of the
P12 branch of the absorption band
A2Σ
+ (
v′ = 0) −
X2Π (
v″ = 2) of the NO molecule (247.867 nm) [
19].
With the help of rotary mirrors M1 and M2, the output laser beam was directed to the detection area. To provide the necessary energy density of laser radiation on the surface of the object, a two-lens L1–L2 system was used. Synchronous triggering of the laser and the photodetection system was carried out using a pulse generator PG controlled by a PC.
The optical response of the object surface to laser radiation was partially collected by the receiving optical system of a double diffraction spectrometer on concave holographic gratings. The spectrometer carried out spectral separation of the γ(0, 0) fluorescence band of NO-fragments of nitro compounds in the wavelength range of 222–227 nm with a transmission of ~25% and an unshifted scattering line suppression level of 12 orders of magnitude. A time-gated intensified CCD camera (Andor iStar DH-712) was used to record the selected part of the spectrum in the full binning mode.
The experiments were carried out according to the following scheme (
Figure 7). In the detection zone, at a distance of 5 m from the model of the remote detector of traces of explosives, an object was installed with a sample with RDX traces fixed on its surface. Next, a pulsed laser action was performed on the surface of the sample, followed by registration of the optical response from it. The optical response was recorded in the photon counting mode. At a signal accumulation volume of 50 laser pulses and a laser pulse repetition rate of 20 Hz, the time of one measurement was 2.5 s. All measurements were carried out in a laboratory room at a temperature of 23 °C. The energy density in the laser pulse was ~30 mJ/cm
2.
4. Experimental Results
The results of experiments on the detection of trace amounts of RDX in fingerprints on a glass slide are presented in
Table 1. The developed experimental layout of the equipment reliably recorded the response to the presence of RDX in the 100th fingerprint.
The LIF intensity of NO-fragments of RDX, normalized to the intensity of those from the first fingerprint, is shown in
Figure 8. Here, for comparison, the dependence of the trace area on the number of the fingerprint is shown (
Figure 4).
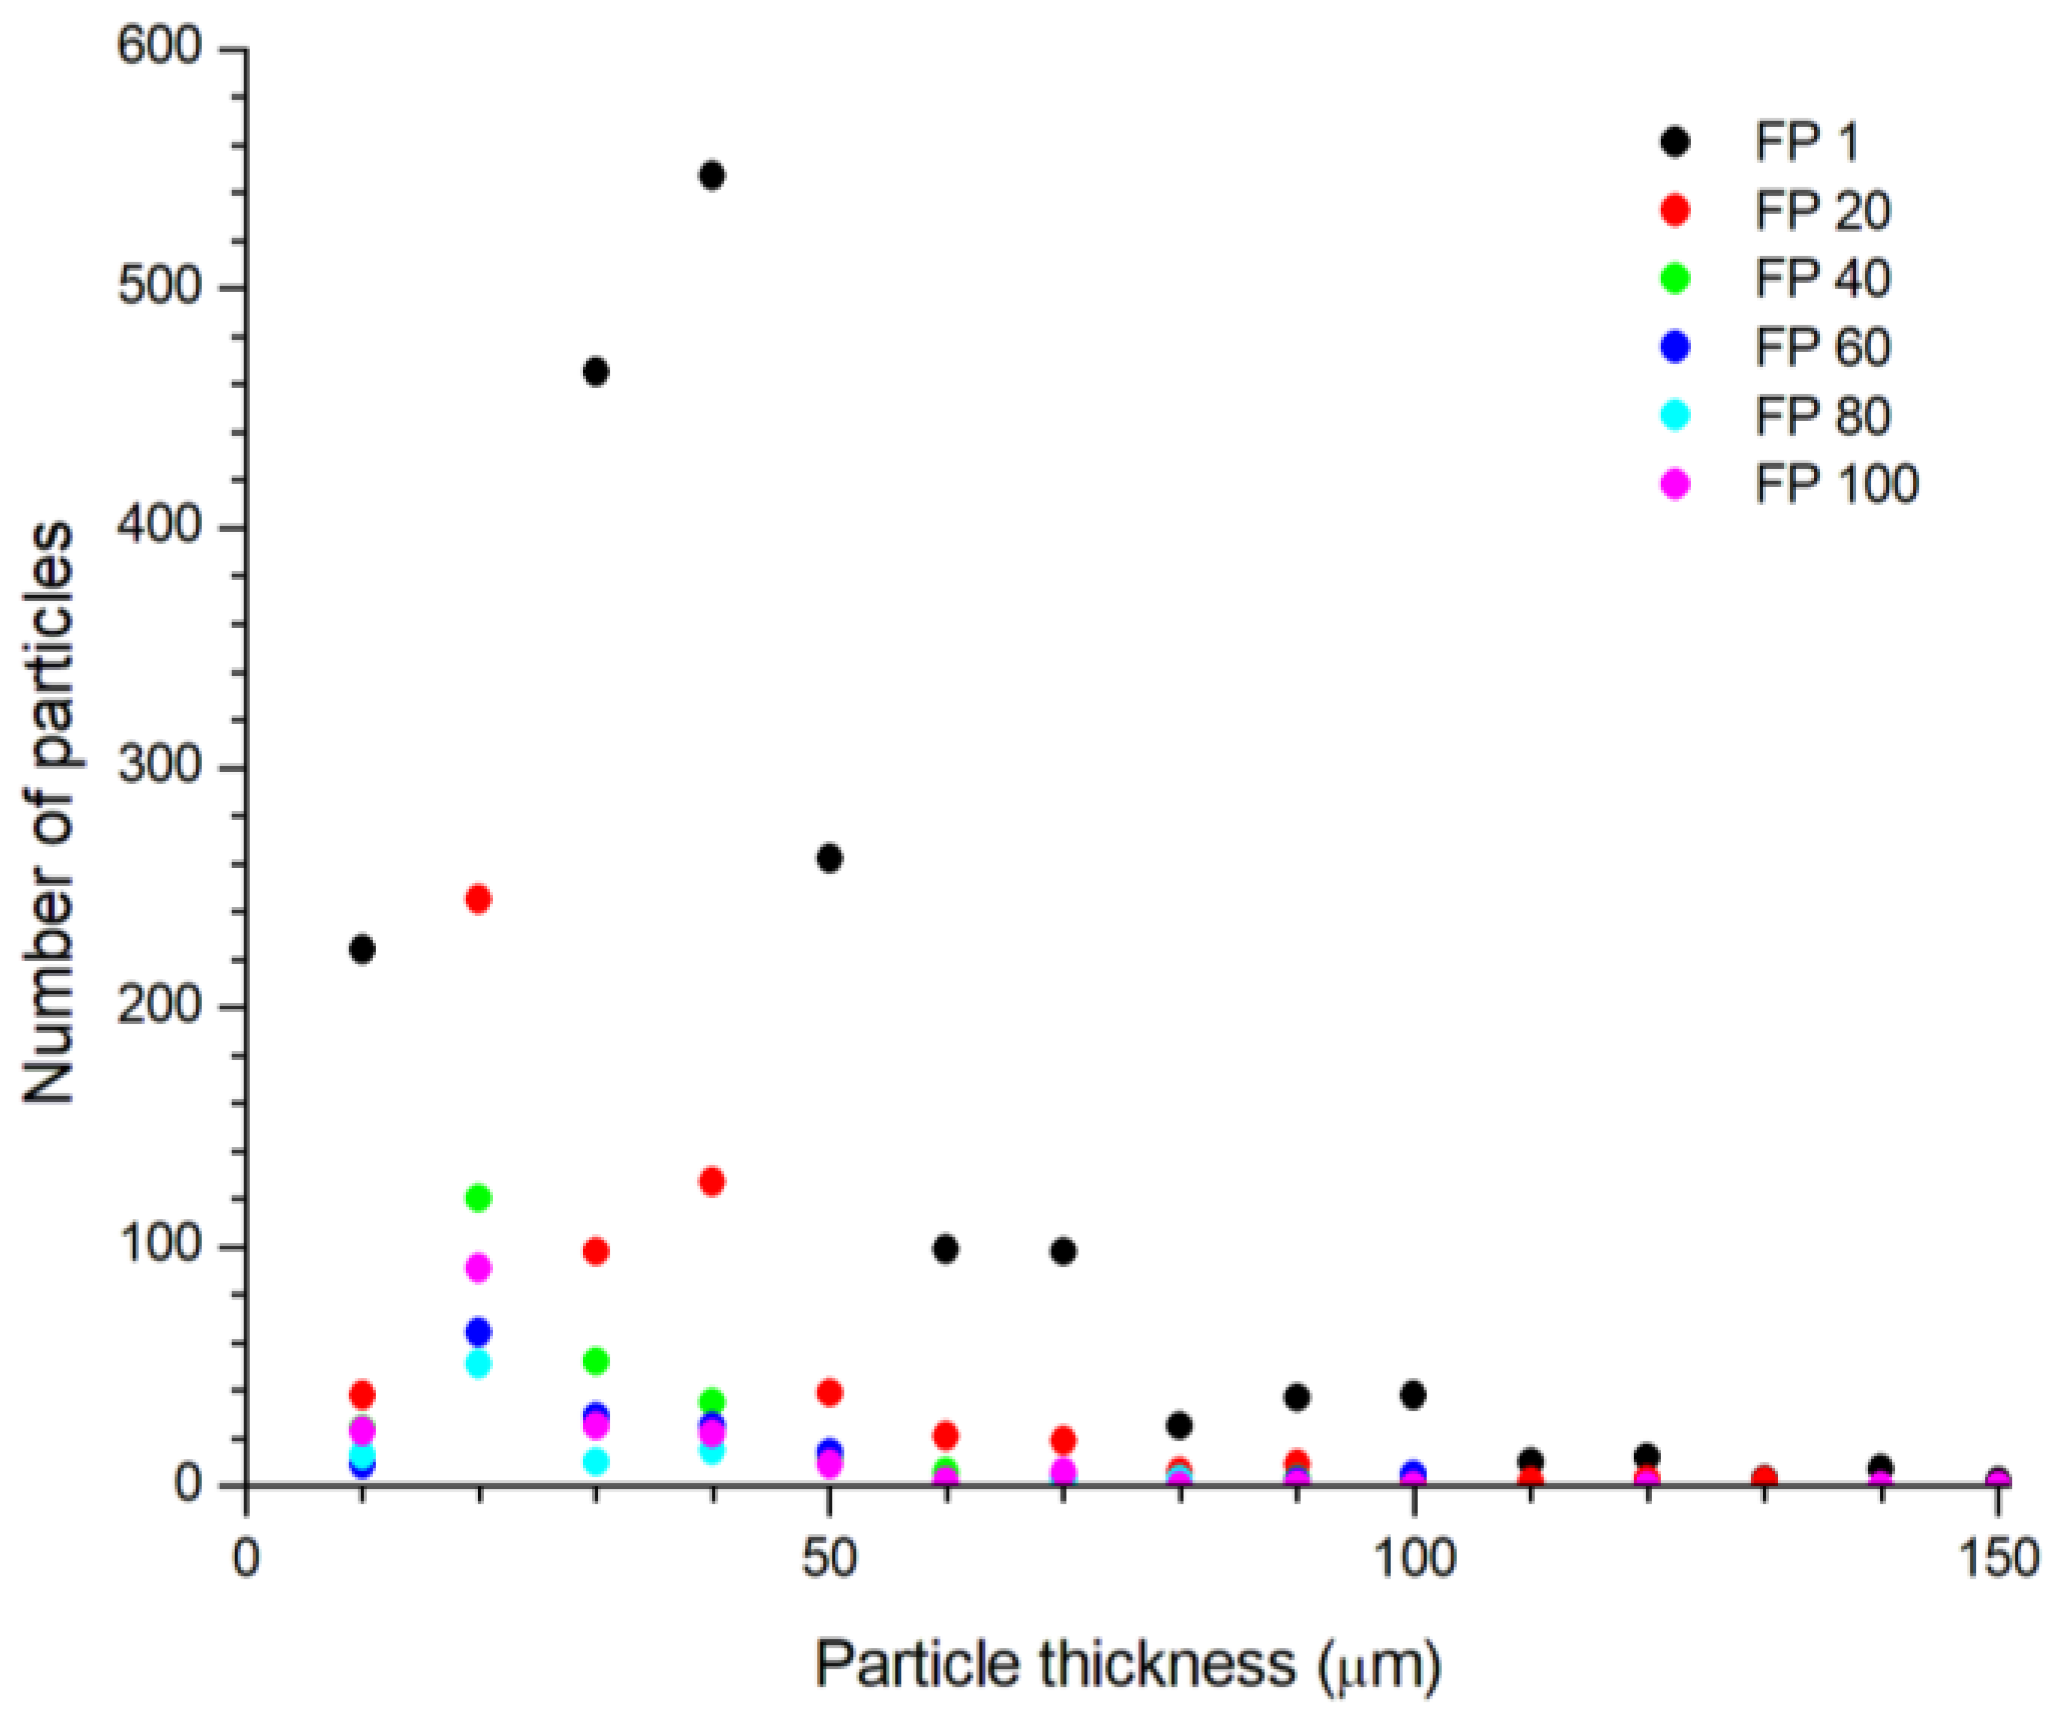
It can be seen that both dependences are in good agreement with each other. This is probably due to the fact that radiation with a wavelength of ~248 nm weakly penetrates into the volume of RDX particles (the penetration depth of the radiation pulse is ~55 nm). For a series of 50 laser pulses, the layer of substance interacted with the radiation will be no thicker than 3 μm. The distribution of RDX particles over the parameter
h in the prepared samples (
Figure 9) shows that the fraction of particles with
h ≤ 10 μm is about 9% of the total number of particles. Thus, when evaluating the effectiveness of using the LF/LIF method, the trace area, and not the mass of the substance in it, will be of decisive importance. Given this feature, it is obvious that the sensitivity of the method in terms of surface concentration (µg/cm
2) will depend on the trace structure.
5. Conclusions
Thus, the use of high-resolution macrophotography in polarized light made it possible to study the evolution of the process of transferring the RDX microparticle trace from the 1st to 100th sweat-fat fingerprints. The pressure force during each act of fingerprint transfer was controlled and amounted to 2 N. This approach made it possible to stabilize the fingerprint transfer process and increase the repeatability of the result.
Pixel-by-pixel analysis of the trace macrophotographs made it possible to quantify the evolution of the total area of the particle contour projection onto the substrate plane and, within the framework of the model of flattened spheroids, to determine the mass of the trace in each fingerprint. The results of the experiments made it possible to plot the dependence of the trace mass on the fingerprint number. Analysis of the dependence shows that the decrease in the mass of the trace substance during transfer occurs according to an exponential law up to the 40th fingerprint, and then, the transfer process slows down significantly and, possibly, enters saturation. This phenomenon confirms the hypothesis of high trace preservation in the fingerprint and requires additional research.
A comparison shows that the data of direct measurements of the total trace area are in good agreement with the data of the LF/LIF responses.
Author Contributions
Conceptualization, S.B. and E.G.; methodology, E.G. and S.B.; validation, V.Z. and S.M.; formal analysis, E.G. and S.M.; resources, E.G., S.M., V.Z. and A.S.; data curation, E.G., V.Z. and S.M.; writing—original draft preparation, E.G.; writing—review and editing, S.B.; visualization, E.G. and S.M.; supervision, S.B.; project administration, A.V. All authors have read and agreed to the published version of the manuscript.
Funding
This study was supported by the Tomsk State University Development Programme (Priority-2030).
Institutional Review Board Statement
Not applicable.
Informed Consent Statement
Not applicable.
Data Availability Statement
Conflicts of Interest
The authors declare no conflict of interest.
References
- Rodgers, M.O.; Davis, D.D. A UV-Photofragmentation/Laser-Induced Fluorescence Sensor for the Atmospheric Detection of HONO. Environ. Sci. Technol. 1989, 23, 1106–1112. [Google Scholar] [CrossRef]
- Galloway, D.B.; Bartz, J.A.; Huey, L.G.; Crim, F.F. Pathways and kinetic energy disposal in the photodissociation of nitrobenzene. J. Chem. Phys. 1993, 98, 2107–2114. [Google Scholar] [CrossRef]
- Lemire, G.W.; Simeonsson, J.B.; Sausa, R.C. Monitoring of vapor-phase nitro compounds using 226-nm radiation: Fragmentation with subsequent NO resonance-enhanced multiphoton ionization detection. Anal. Chem. 1993, 65, 529–533. [Google Scholar] [CrossRef]
- Galloway, D.B.; Glenewinkel-Meyer, T.; Bartz, J.A.; Huey, L.G.; Crim, F.F. The Kinetic and Internal Energy of NO from the Photodissociation of Nitrobenzene. J. Chem. Phys. 1994, 100, 1946–1952. [Google Scholar] [CrossRef]
- Wu, D.D.; Singh, J.P.; Yueh, F.Y.; Monts, D.L. 2,4,6-Trinitrotoluene detection by laser-photofragmentation–laser-induced fluorescence. Appl. Opt. 1996, 35, 3998–4003. [Google Scholar] [CrossRef] [PubMed]
- Simeonsson, J.B.; Sausa, R.C. A critical review of laser photofragmentation/fragment detection techniques for gas phase chemical analysis. Appl. Spectrosc. Rev. 1996, 31, 1–72. [Google Scholar] [CrossRef]
- Swayambunathan, V.; Singh, G.; Sausa, R.C. Laser photofragmentation–fragment detection and pyrolysis–laser-induced fluorescence studies on energetic materials. Appl. Opt. 1999, 38, 6447–6454. [Google Scholar] [CrossRef] [PubMed]
- Daugey, N.; Shu, J.; Bar, I.; Rosenwaks, S. Nitrobenzene detection by one-color laser photolysis/laser induced fluorescence of NO (v = 0–3). Appl. Spectrosc. 1999, 53, 57–64. [Google Scholar] [CrossRef]
- Shu, J.; Bar, I.; Rosenwaks, S. Dinitrobenzene Detection by Use of One-color Laser Photolysis and Laser-Induced Fluorescence of Vibrationally Excited NO. Appl. Opt. 1999, 38, 4705–4710. [Google Scholar] [CrossRef] [PubMed]
- Shu, J.; Bar, I.; Rosenwaks, S. NO and PO photofragments as trace analyte indicators of nitrocompounds and organophosphonates. Appl. Phys. B 2000, 71, 665–672. [Google Scholar] [CrossRef]
- Shu, J.; Bar, I.; Rosenwaks, S. The use of rovibrationally excited NO photofragments as trace nitrocompounds indicators. Appl. Phys. B 2000, 70, 621–625. [Google Scholar] [CrossRef]
- Arusi-Parpar, T.; Heflinger, D.; Lavi, R. Photodissociation Followed by Laser-Induced Fluorescence at Atmospheric Pressure and 24 °C: A Unique Scheme for Remote Detection of Explosives. J. Appl. Opt. 2001, 40, 6677–6681. [Google Scholar] [CrossRef] [PubMed]
- Heflinger, D.; Arusi-Parpar, T.; Ron, Y.; Lavi, R. Application of a unique scheme for remote detection of explosives. Opt. Commun. 2002, 204, 327–331. [Google Scholar] [CrossRef]
- Wynn, C.M.; Palmacci, S.; Kunz, R.R.; Rothschild, M. Noncontact detection of homemade explosive constituents via photodissociation followed by laser-induced fluorescence. Opt. Express. 2010, 18, 5399–5406. [Google Scholar] [CrossRef] [PubMed]
- Wynn, C.M.; Palmacci, S.; Kunz, R.R.; Aernecke, M. Noncontact optical detection of explosive particles via photodissociation followed by laser-induced fluorescence. Opt. Express. 2011, 19, 18671–18677. [Google Scholar] [CrossRef] [PubMed]
- Bobrovnikov, S.M.; Gorlov, E.V. Lidar method for remote detection of vapors of explosives in the atmosphere. Atmos. Ocean Opt. 2011, 24, 235–241. [Google Scholar]
- Bobrovnikov, S.M.; Vorozhtsov, A.B.; Gorlov, E.V.; Zharkov, V.I.; Maksimov, E.M.; Panchenko, Y.N.; Sakovich, G.V. Lidar detection of explosive vapors in the atmosphere. Russ. Phys. J. 2016, 58, 1217–1225. [Google Scholar] [CrossRef]
- Verkouteren, J.R.; Coleman, J.L.; Cho, I. Automated Mapping of Explosives Particles in Composition C-4 Fingerprints. J. Forensic Sci. 2010, 55, 334–340. [Google Scholar] [CrossRef] [PubMed]
- Panchenko, Y.; Puchikin, A.; Yampolskaya, S.; Bobrovnikov, S.; Gorlov, E.; Zharkov, V. Narrowband KrF Laser for Lidar Systems. IEEE J. Quantum Electron. 2021, 57, 1500105. [Google Scholar] [CrossRef]
| Disclaimer/Publisher’s Note: The statements, opinions and data contained in all publications are solely those of the individual author(s) and contributor(s) and not of MDPI and/or the editor(s). MDPI and/or the editor(s) disclaim responsibility for any injury to people or property resulting from any ideas, methods, instructions or products referred to in the content. |
© 2023 by the authors. Licensee MDPI, Basel, Switzerland. This article is an open access article distributed under the terms and conditions of the Creative Commons Attribution (CC BY) license (https://creativecommons.org/licenses/by/4.0/).

 ,
, 


