SOA-MZI Differential Transformation Approach Applied on Simultaneous Electro-Optical Mixing


Abstract
1. Introduction
2. SOA-MZI Differential Transformation Principle of the Simultaneous Electro-Optical Mixing
3. Performance of the Simultaneous Electro-Optical Mixing System for Up Mixing Using a SOA-MZI Transformation Configuration
3.1. Experimental Setup
3.2. Optical Characteristic Attributes
- (a)
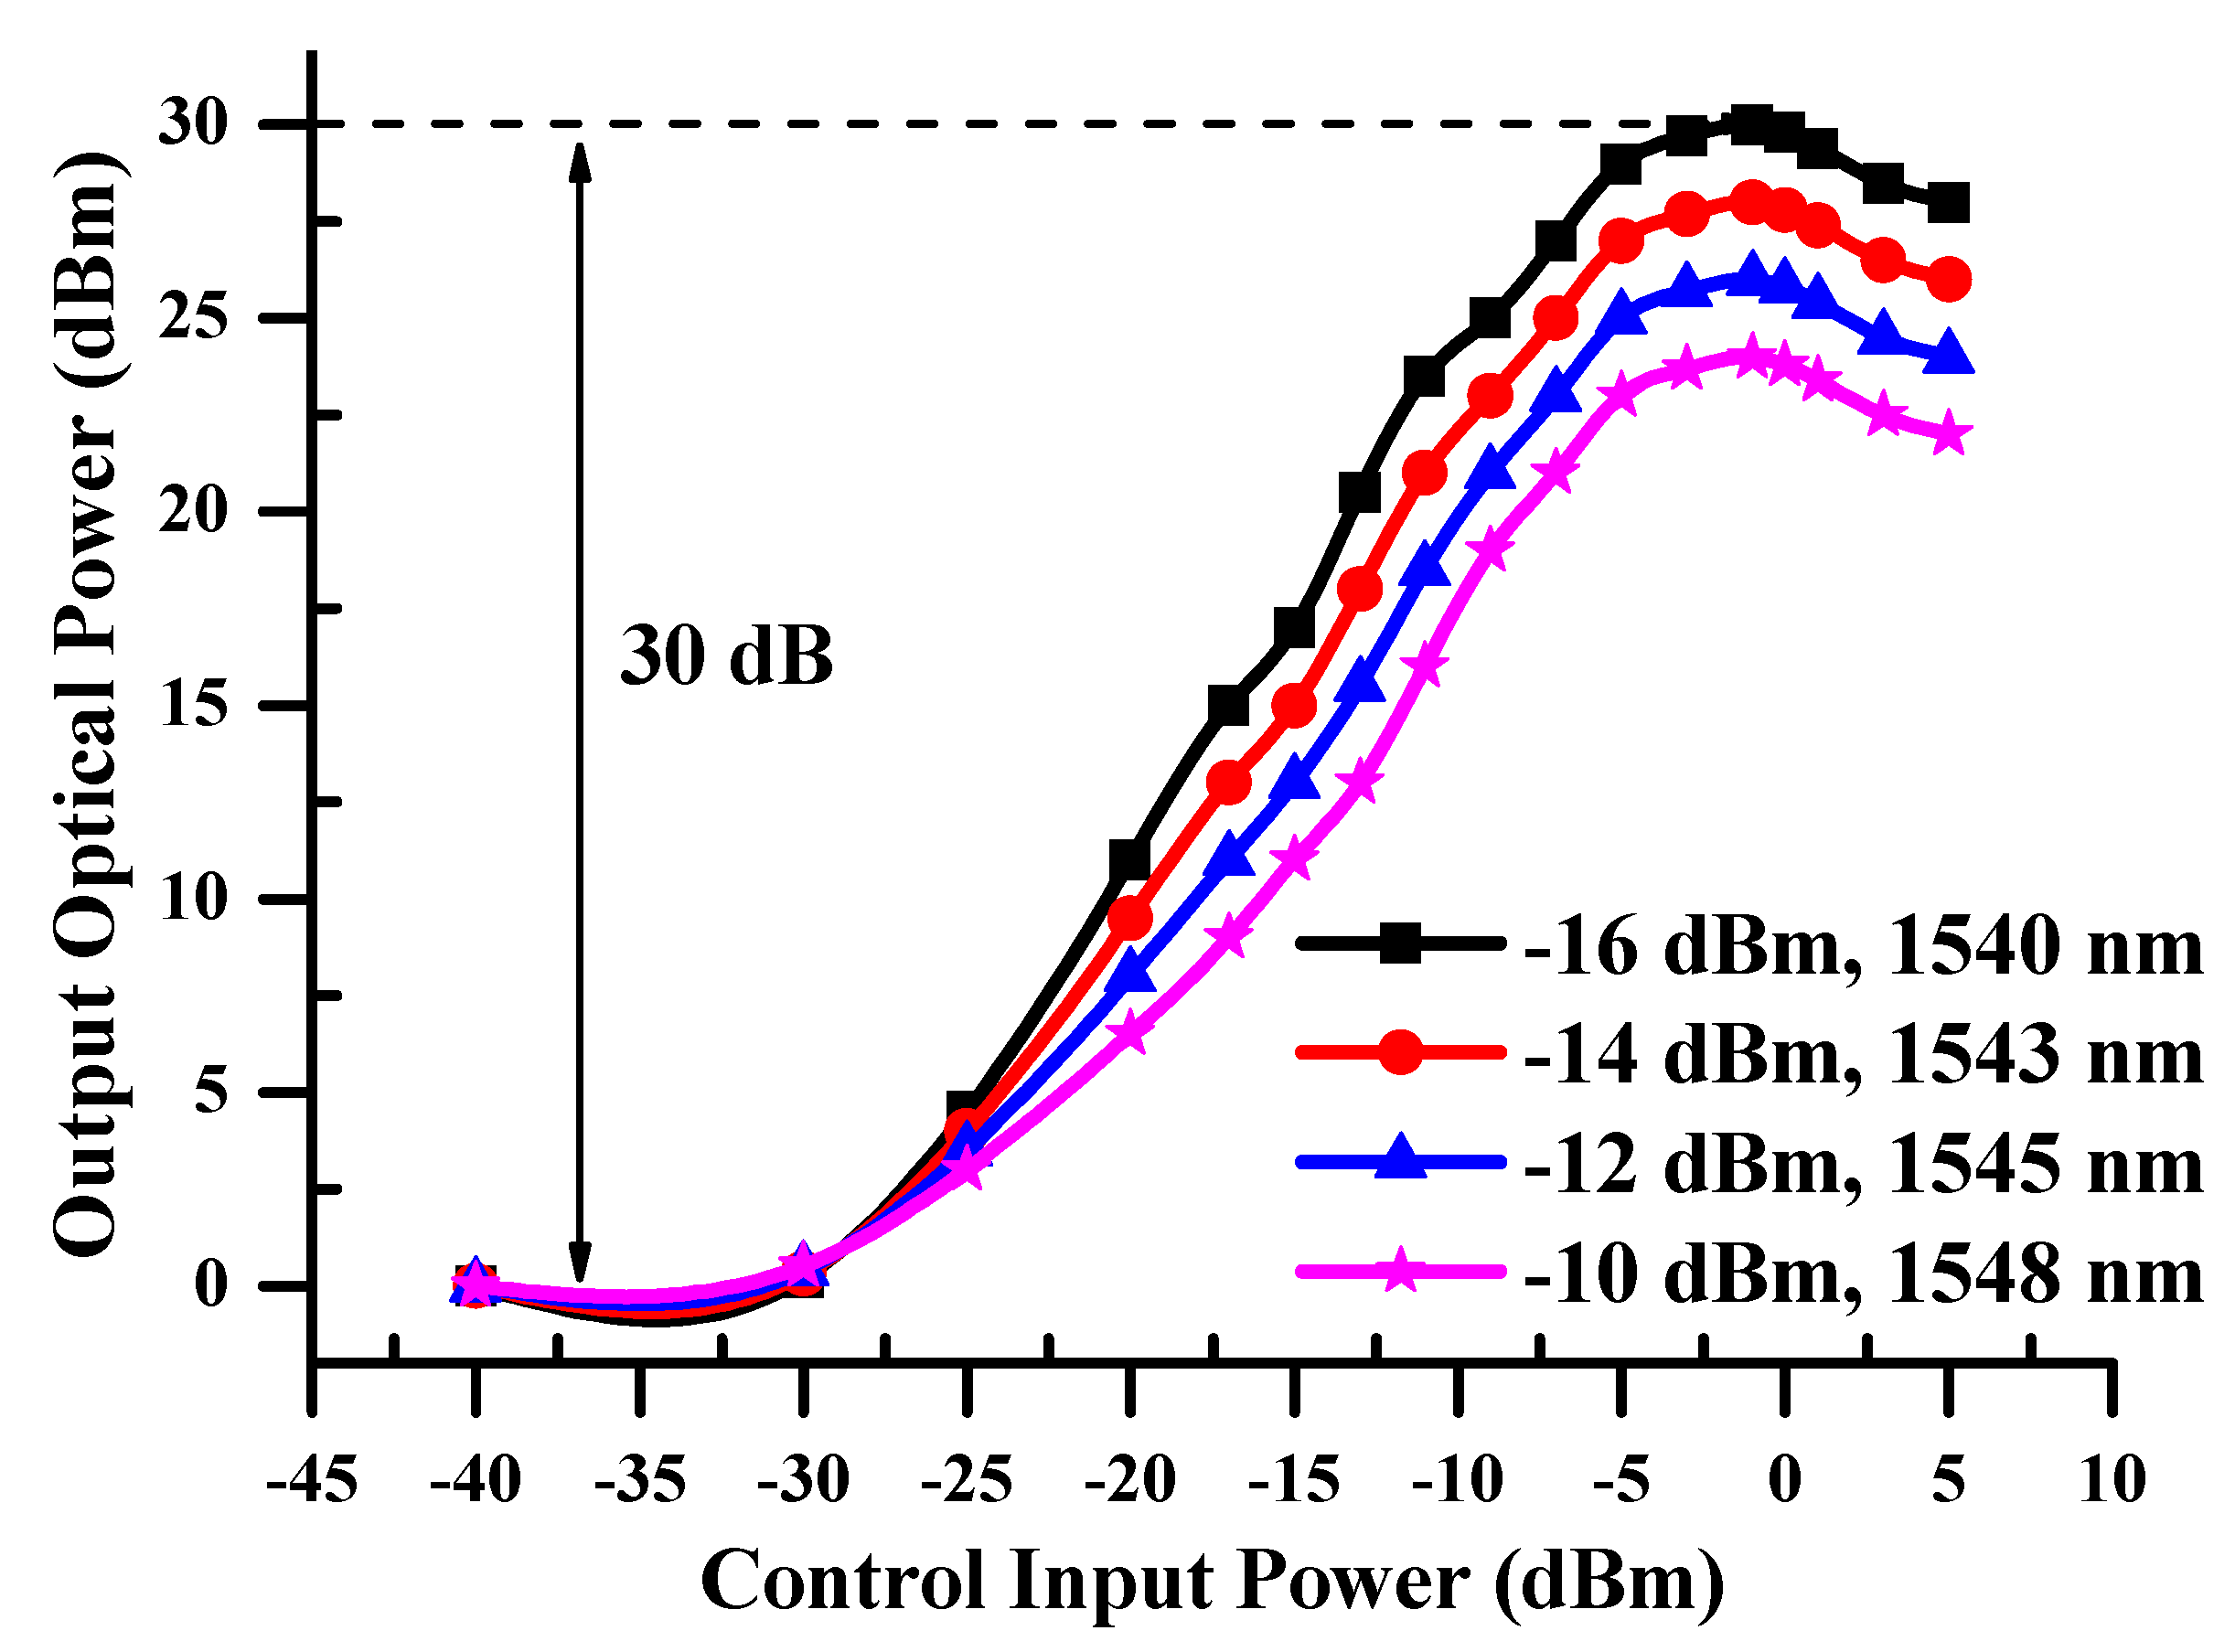
- Output Power Characterizations
- (b)
- Optical Conversion Gain
- (c)
- Output Power Stabilization
- (d)
- Signal to Noise Ratio
- (e)
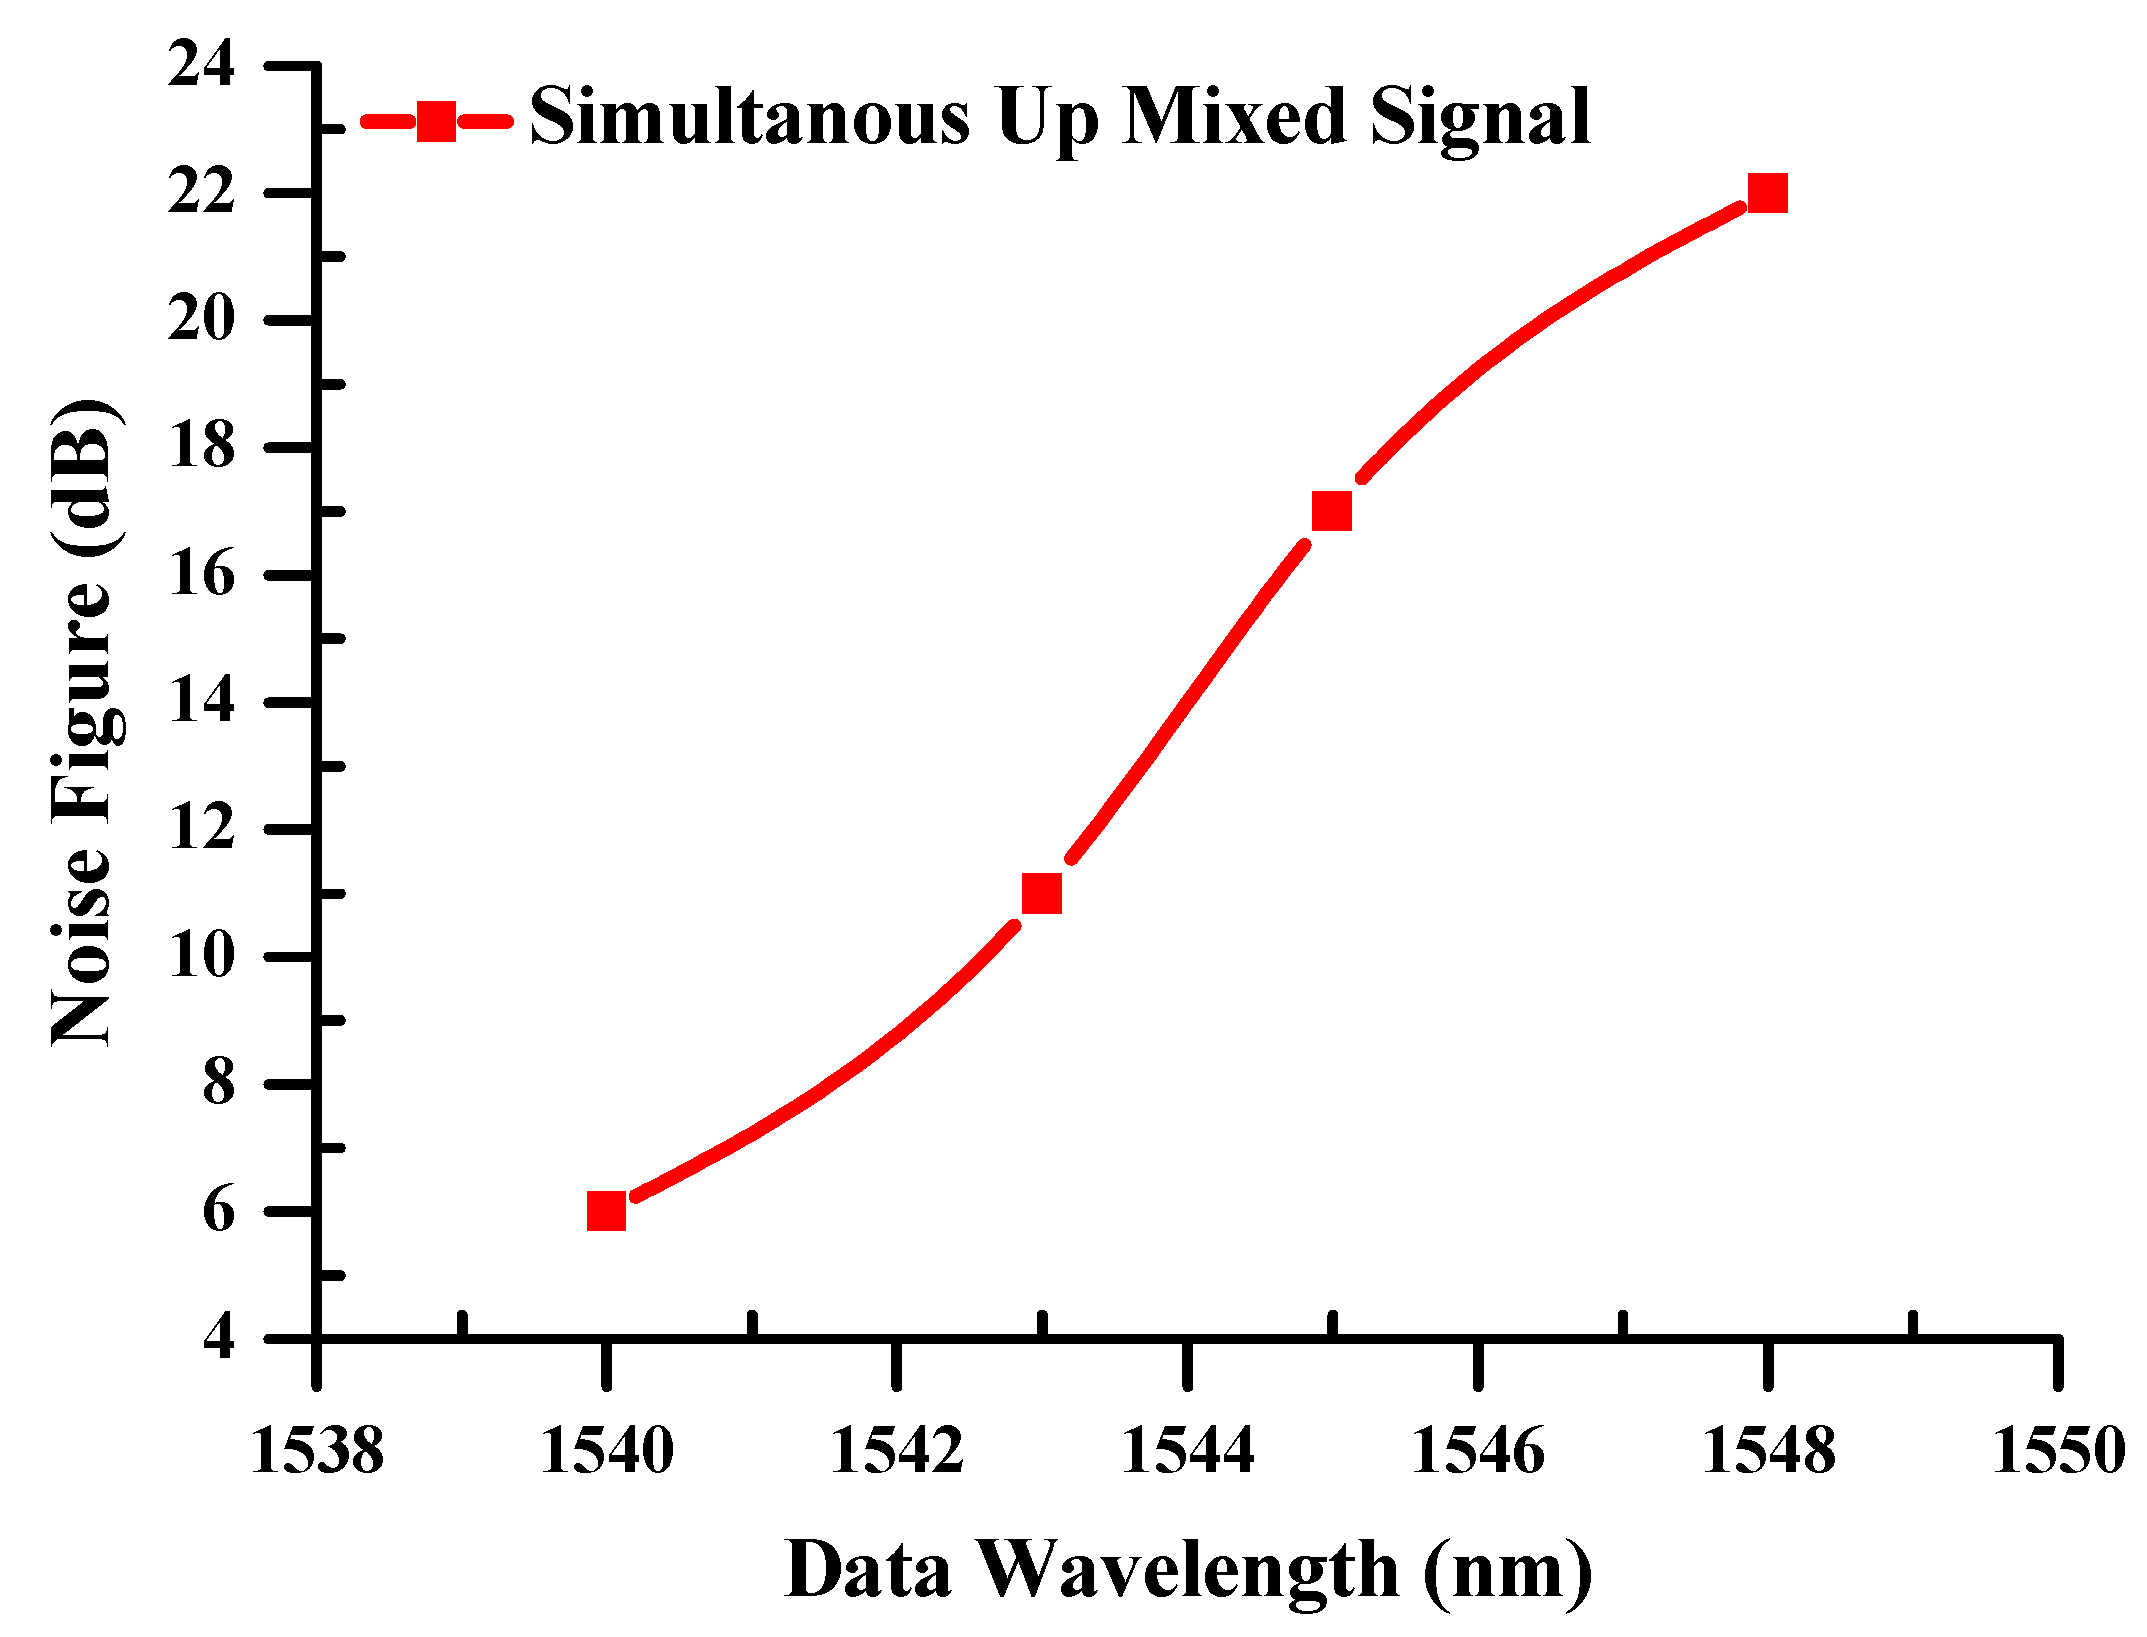
- Noise Figure
- (f)
- Optical Spectrum
3.3. Electrical Characteristic Attributes
- (a)
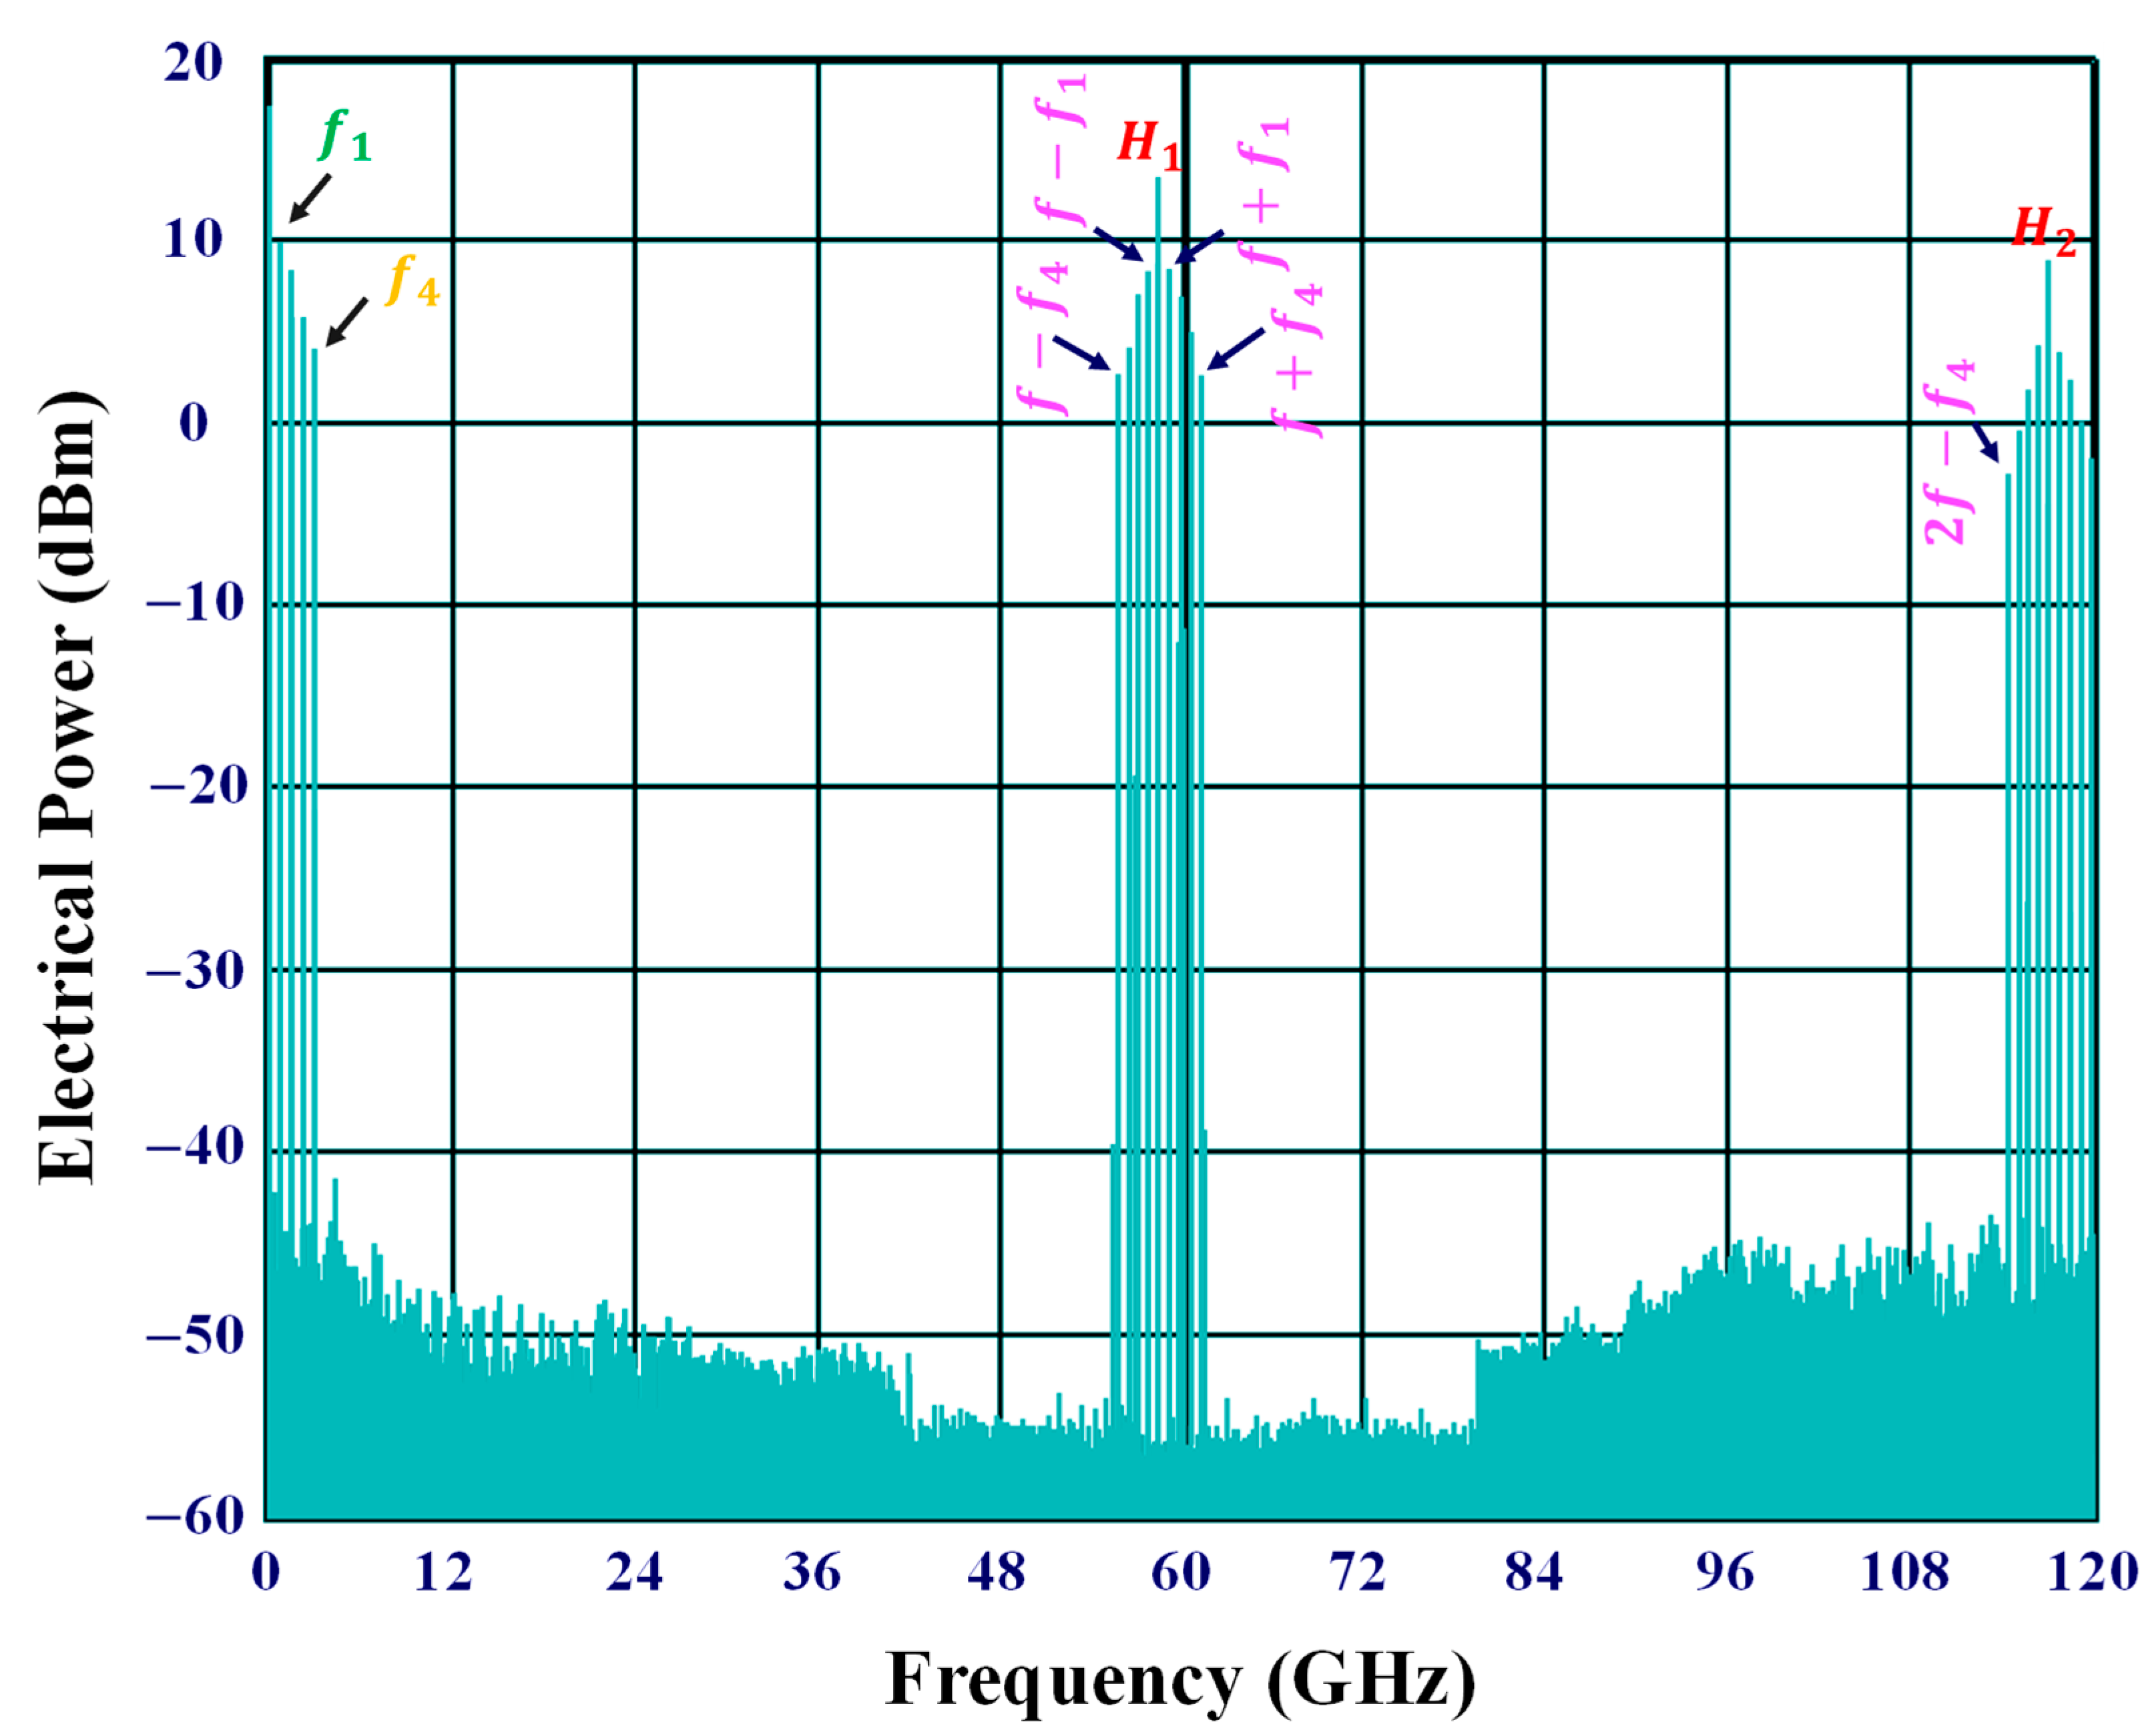
- Electrical Spectrum
- (b)
- Electrical Conversion Gain
- (c)
- Isolation
- (d)
- Phase Noise
- (e)
- Error Vector Magnitude
4. Conclusions
Author Contributions
Funding
Institutional Review Board Statement
Informed Consent Statement
Data Availability Statement
Conflicts of Interest
References
- Kleine-Ostmann, T.; Nagatsuma, T. Review on Terahertz Communications Research. J. Infrared Millim. Terahertz Waves 2011, 32, 143–171. [Google Scholar] [CrossRef]
- Gomes, N.J.; Monteiro, P.P.; Gameiro, A. Next Generation Wireless Communications Using Radio over Fiber; Wiley: West Sussex, UK, 2012. [Google Scholar]
- Rouvalis, E.; Renaud, C.; Moodie, D.G.; Robertson, M.J.; Seeds, A.J. Traveling-wave Uni-Traveling Carrier Photodiodes for continuous wave THz generation. Opt. Express 2010, 18, 11105–11110. [Google Scholar] [CrossRef] [PubMed]
- Preu, S.; Döhler, G.H.; Malzer, S.; Wang, L.J.; Gossard, A.C. Continuous-wave Terahertz photomixer sources and applications. J. Appl. Phys 2011, 109, 061301. [Google Scholar] [CrossRef]
- Thomas, V.A.; El-Hajjar, M.; Hanzo, L. Millimeter-Wave Radio Over Fiber Optical Upconversion Techniques Relying on Link Nonlinearity. IEEE Commun. Surv. Tutor. 2016, 18, 29–53. [Google Scholar] [CrossRef]
- Schilling, M.; Daub, K.; Idler, W.; Baums, D.; Koerner, U.; Lach, E.; Laube, G.; Wünstel, K. Wavelength converter based on integrated all-active three-port Mach- Zehnder interferometer. Electron. Lett. 1994, 30, 2128–2130. [Google Scholar] [CrossRef]
- Dong, H.; Sun, H.; Wang, Q.; Dutta, N.K.; Jaques, J. All optical logic and operation at 80 Gb/s using semiconductor optical amplifier based on the Mach-Zehnder interferometer. Microw. Opt. Technol. Lett. 2006, 48, 1672–1675. [Google Scholar] [CrossRef]
- Dimitriadou, E.; Zoiros, K.E. On the design of reconfigurable ultrafast all-optical NOR and NAND gates using a single quantum-dot semiconductor optical amplifier-based Mach- Zehnder interferometer. J. Opt. 2012, 14, 105401. [Google Scholar] [CrossRef]
- Houbavlis, T.; Zoiros, K.E.; Kanellos, G.; Tsekrekos, C. Performance analysis of ultrafast all-optical Boolean XOR gate using semiconductor optical amplifier-based Mach-Zehnder Interferometer. Opt. Commun. 2004, 232, 179–199. [Google Scholar] [CrossRef]
- Kim, S.H.; Kim, J.H.; Yu, B.G.; Byun, Y.T.; Jeon, Y.M.; Lee, S.; Woo, D.H. All-optical NAND gate using cross-gain modulation in semiconductor optical amplifiers. Electron. Lett. 2005, 41, 1027–1028. [Google Scholar] [CrossRef]
- Dong, H.; Sun, H.; Wang, Q.; Dutta, N.K.; Jaques, J. 80 Gb/s All-optical logic AND operation using Mach-Zehnder interferometer with differential scheme. Opt. Commun. 2006, 265, 79–83. [Google Scholar] [CrossRef]
- Lee, S.; Park, J.; Lee, K.; Eom, D.; Lee, S.; Kim, J.H. All-optical exclusive NOR logic gate using Mach-Zender Interferometer. Jpn. J. Appl. Phys. 2002, 41, 1155–1157. [Google Scholar] [CrossRef]
- Kang, B.-K.; Kim, J.H.; Park, Y.H.; Lee, S.; Jhon, Y.M.; Woo, D.H.; Kim, S.H.; Park, S.-H. All-optical logic AND in a SOA-based Mach-Zehnder all-optical wavelength converter. In Proceedings of the 13th Laser and Electro-Optics Society, Rio Grande, TX, USA, 13–16 November 2000; Volume 1, pp. 117–118. [Google Scholar]
- Pan, X.; Wiesenfeld, J.M.; Perino, J.S.; Koch, T.L.; Raybon, G.; Koren, U.; Chien, M.; Young, M.; Miller, B.I.; Burrus, C.A. Dynamic operation of a three-port, integrated Mach-Zehnder wavelength converter. IEEE Photonics Technol. Lett. 1995, 7, 995–997. [Google Scholar] [CrossRef] [PubMed]
- Sun, H.; Wang, Q.; Dong, H.; Dutta, N.K. XOR performance of a quantum dot semiconductor optical amplifier based Mach-Zehnder interferometer. Opt. Express 2005, 13, 1892–1899. [Google Scholar] [CrossRef]
- Wang, Q.; Zhu, G.; Chen, H.; Jaques, J.; Leuthold, J.; Piccirilli, A.; Dutta, N. Study of All-Optical XOR using Mach-Zehnder Interferometer and Differential Scheme. IEEE J. Quantum Electron. 2004, 40, 703–710. [Google Scholar] [CrossRef]
- Termos, H.; Mansour, A. Real & Simulated QPSK Up-Converted Signals by a Sampling Method Using a Cascaded MZMs Link. Photonics 2022, 9, 34. [Google Scholar]
- Chul, S.P.; Choong, K.; Chung, G.L.; Dong-Hwan, K.; Chang-Soo, P.A. photonic up-converter for a WDM radio-over-fiber system using cross-absorption modulation in an EAM. IEEE Photonics Technol. Lett. 2005, 17, 1950–1952. [Google Scholar] [CrossRef]
- Thouras, J.; Benazet, B.; Leblond, H.; Aupetit-Berthelemot, C. Photonic radio frequency down-converter based on parallel electro-absorption modulators in Ku/Ku band for space applications. In Proceedings of the 2016 21st OptoElectronics and Communications Conference (OECC) Held Join, Niigata, Japan, 3–7 July 2016. [Google Scholar]
- Mohammad, A.W.; Shams, H.; Liu, C.-P.; Graham, C.; Natrella, M.; Seeds, A.J.; Renaud, C.C. 60-GHz Transmission link using uni-traveling carrier photodiodes at the transmitter and the receiver. J. Light. Technol. 2018, 36, 4507–4513. [Google Scholar] [CrossRef]
- Rouvalis, E.; Fice, M.; Renaud, C.; Seeds, A.J. Millimeter-Wave Optoelectronic Mixers Based on Uni-Traveling Carrier Photodiodes. IEEE Trans. Microw. Theory Tech. 2012, 60, 686–691. [Google Scholar] [CrossRef]
- Termos, H.; Mansour, A. Quadrature amplitude modulation frequency up-and down-conversions using a positive-intrinsic-negative photodiode sampling mixer. Opt. Eng. 2022, 61, 096103. [Google Scholar] [CrossRef]
- Kim, H.J.; Song, J.I. Simultaneous WDM RoF Signal Generation Utilizing an All-Optical Frequency Upconverter Based on FWM in a SOA. IEEE Photonics Technol. Lett. 2011, 23, 828–830. [Google Scholar]
- Contestabile, G.; Presi, M.; Ciaramella, E. Multiple Wavelength Conversion for WDM Multicasting by FWM in an SOA. IEEE Photonics Technol. Lett. 2004, 16, 1775–1777. [Google Scholar] [CrossRef]
- Seo, Y.K.; Choi, C.S.; Choi, W.Y. All-Optical Signal Up-Conversion for Radio-on-Fiber Applications Using Cross-Gain Modulation in Semiconductor Optical Amplifiers. IEEE Photonics Technol. Lett. 2002, 14, 1448–1450. [Google Scholar] [CrossRef]
- Contestabile, G.; Maruta, A.; Sekiguchi, S.; Morito, K.; Sugawara, M.; Kitayama, K. 80 Gb/s Multicast Wavelength Conversion by XGM in a QDSOA. In Proceedings of the 36th European Conference and Exhibition on Optical Communication, Turin, Italy, 19–23 September 2010; pp. 1–3. [Google Scholar]
- Song, H.J.; Lee, J.S.; Song, J.I. Signal Up-Conversion by Using a Cross-Phase Modulation in All-Optical SOA-MZI Wavelength Converter. IEEE Photonics Technol. Lett. 2004, 16, 593–595. [Google Scholar] [CrossRef]
- Song, H.J.; Song, J.I. Simultaneous All-Optical Frequency Downconversion Technique Utilizing an SOA-MZI for WDM Radio Over Fiber (RoF) Applications. J. Light. Technol. 2006, 24, 3028–3034. [Google Scholar] [CrossRef]
- Song, J.I.; Song, H.J. Simultaneous Frequency Conversion Technique Utilizing an SOA-MZI For Full-Duplex WDM Radio over Fiber Applications. IEICE Trans. Electron. 2007, E90-C, 351–358. [Google Scholar] [CrossRef]
- Kim, H.J.; Lee, S.H.; Song, J.I. Generation of a 100-GHz optical SSB signal using XPM-based all-optical frequency up-conversion in an SOAMZI. Microw. Opt. Technol. Lett. 2014, 57, 35–38. [Google Scholar] [CrossRef]
- Kim, D.H.; Lee, J.Y.; Choi, H.J.; Song, I.J. All-optical single sideband frequency up conversion utilizing the XPM effect in an SOAMZI. Opt. Express. 2016, 24, 20309–20317. [Google Scholar] [CrossRef] [PubMed]
- Termos, H.; Rampone, T.; Sharaiha, A.; Hamié, A.; Alaeddine, A. All-Optical Radiofrequency Sampling Mixer Based on a Semiconductor Optical Amplifier Mach–Zehnder Interferometer Using a Standard and a Differential Configuration. J. Light. Technol. 2016, 34, 4688–4695. [Google Scholar] [CrossRef]
- Termos, H.; Rampone, T.; Sharaiha, A.; Hamié, A.; Alaeddine, A. Up and down frequency conversion of a QPSK signal by an all-optical radiofrequency sampling mixer based on a semiconductor optical amplifier Mach-Zehnder interferometer. In Proceedings of the 2015 International Topical Meeting on Microwave Photonics (MWP), Paphos, Cyprus, 25–29 October 2015; pp. 1–4. [Google Scholar]
- Termos, H.; Rampone, T.; Sharaiha, A.; Hamié, A.; Alaeddine, A. OFDM signal up and down frequency conversions by a sampling method using a SOA-MZI. In Proceedings of the 2017 29th International Conference on Microelectronics (ICM), Beirut, Lebanon, 10–13 December 2017; pp. 1–5. [Google Scholar]
- Termos, H.; Rampone, T.; Sharaiha, A. Sampling rate influence in up and down mixing of QPSK and OFDM signals using an SOA-MZI in a differential configuration. Electron. Lett. 2018, 54, 990–991. [Google Scholar] [CrossRef]
- Termos, H.; Mansour, A.; Nasser, A. Simultaneous up- and down-frequency mixing based on a cascaded SOA-MZIs link. Appl. Opt. 2021, 60, 8336–8348. [Google Scholar] [CrossRef]
- Termos, H.; Mansour, A.; Nasser, A. Simultaneous Up-Conversion Based on a Co- & Counter-Directions SOA-MZI Sampling Mixer with Standard & Differential Modulation Modes. Photonics 2022, 9, 109. [Google Scholar]
- Termos, H.; Mansour, A. OFDM signal down frequency conversion based on a SOA-MZI sampling mixer using differential modulation and switching architectures. Optik 2021, 245, 167761. [Google Scholar] [CrossRef]
- Termos, H.; Mansour, A. Sampling Parallel SOA-MZIs Configuration for All-Optical Simultaneous Frequency Down-Conversion. Photonics 2022, 9, 745. [Google Scholar] [CrossRef]
- Termos, H.; Tharthar, A.; Mansour, A. All-Optical Simultaneous Frequency Metamorphose Con-tin-gent on a Three Parallel SOA-MZIs Copula. Optics 2022, 9, 745. [Google Scholar]
- Termos, H. Study of Up and Down Conversion Technique by all Optical Sampling Based on a SOA-MZI. Ph.D. Dissertation, ED SICMA. University de Bretagne Occidentale, Brest, France, February 2017. [Google Scholar]
- Fernandez, A.; Chao, L.; Chi, J.W.D. All-optical clock recovery and pulse reshaping using semiconductor optical amplifier and dispersion compensating fiber in a ring cavity. IEEE Photonics Technol. Lett. 2008, 20, 1148–1150. [Google Scholar] [CrossRef]
- Stasyuk, V. Test Data and Operation Manual of Ultrafast Optical Clock. Available online: www.pritel.com (accessed on 4 March 2023).
- Capmany, J.; Sales, S.; Pastor, D.; Ortega, B. Optical mixing of microwave signals in a nonlinear semiconductor laser amplifier modulator. Opt. Express 2002, 10, 183–189. [Google Scholar] [CrossRef]
- Bohe, C.; Sharaiha, A.; Khaleghi, T.R. Electro-optical radiofrequency mixer based on semiconductor optical amplifier, H. Electron. Lett. 2011, 47, 331–333. [Google Scholar]
- Rampone, T.; Zulma, R. Electro-optical radiofrequency up-converter based on a semiconductor optical amplifier. In Proceedings of the 2011 International Topical Meeting on Microwave Photonics Jointly Held with the 2011 Asia-Pacific Microwave Photonics Conference, Singapore, 18–21 October 2011; Volume 31, pp. 145–148. [Google Scholar]
- Termos, H.; Mansour, A. Frequency Alteration Built on an Electro-Optical Sampling SOA–MZI Using a Differential Modulation Schema. Optics 2022, 3, 225–233. [Google Scholar] [CrossRef]
- Vaughan, R.G.; Scott, N.L.; White, D.R. The theory of band pass sampling. IEEE Trans. Signal Process. 1991, 39, 1973–1984. [Google Scholar] [CrossRef]
- Runge, P.; Bunge, C.A.; Petermann, K. All-Optical Wavelength Conversion with Extinction Ratio Improvement of 100 Gb/s RZ-Signals in Ultralong Bulk Semiconductor Optical Amplifiers. IEEE J. Quantum Electron. 2010, 46, 937–944. [Google Scholar] [CrossRef]
- Leuthold, J.; Marom, D.M.; Cabot, S.; Jaques, J.J.; Ryf, R.; Giles, C.R. All-optical wavelength conversion using a pulse reformatting optical filter. J. Light. Technol. 2004, 22, 186–192. [Google Scholar] [CrossRef]
- Liu, Y.; Tangdiongga, E.; Li, Z.; De Waardt, H.; Koonen, A.M.; Khoe, G.D.; Dorren, H.J.; Shu, X.; Bennion, I. Error-free 320 Fb/s SOA-Based Wavelength Conversion Using Optical Filtering. In Proceedings of the 2006 Optical Fiber Communication Conference and the National Fiber Optic Engineers Conference, Anaheim, CA, USA, 5–10 March 2006. [Google Scholar]
- Spyropoulou, M.; Pleros, N.; Miliou, A. SOA-MZI-based nonlinear optical signal processing: A frequency domain transfer function for wavelength conversion, clock recovery, and packet envelope detection. IEEE J. Quantum Electron. 2010, 47, 40–49. [Google Scholar] [CrossRef]
- Termos, H.; Mansour, A.; Ebrahim-Zadeh, M. Establishment of an Electro-Optical Mixing Design on a Photonic SOA-MZI Using a Differential Modulation Arrangement. Sensors 2023, 23, 4380. [Google Scholar] [CrossRef]
- Maker, V.P.T.; Manual, U. Photonic Modules Reference Manuals. VPI Photonics Official Website. Available online: http://www.vpiphotonics.com (accessed on 1 February 2023).
- Ito, H.; Furuta, T.; Kodama, S.; Ishibashi, T. InP/InGaAs uni-travelling-carrier photodiode with 310 GHz bandwidth. Electron. Lett. 2000, 36, 1809–1810. [Google Scholar] [CrossRef]
- Rouvalis, E.; Fice, M.J.; Renaud, C.C.; Seeds, A.J. Optoelectronic detection of millimeter-wave signals with travelling-wave uni-travelling carrier photodiodes. Opt. Express 2011, 19, 2079–2084. [Google Scholar] [CrossRef]
- Shafik, R.A.; Rahman, S.; Islam, A.R. On the Extended Relationships among EVM, BER and SNR as Performance Metrics. In Proceedings of the 2006 International Conference on Electrical and Computer Engineering, Dhaka, Bangladesh, 19–21 December 2006; pp. 408–411. [Google Scholar]
- Agrawal, G.P. Fiber-Optic Communications Systems; Wiley: New York, NY, USA, 1997. [Google Scholar]
- Walker, G.; Steele, R.; Walker, N. Optical amplifier noise figure in a coherent optical transmission system. J. Light. Technol. 2002, 8, 1409–1413. [Google Scholar] [CrossRef]
- Crottini, A.; Salleras, F.; Moreno, P.; Dupertuis, M.A.; Deveaud, B.; Brenot, R. Noise Figure Improvement in Semiconductor Optical Amplifiers by Holding Beam at Transparency Scheme. IEEE Photonics Technol. Lett. 2005, 17, 977–979. [Google Scholar] [CrossRef]
- Picard, R.B.; Alouini, M.; Lopez, J.; Vodjdani, N.; Simon, J.-C. Impact of the Gain Saturation Dynamics in Semiconductor Optical Amplifiers on the Characteristics of an Analog Optical Link. J. Light. Technol. 2005, 23, 2420–2426. [Google Scholar] [CrossRef]
- Eriksson, P.; Tenhunen, H. The noise figure of a sampling mixer: Theory and measurement. In Proceedings of the ICECS’99 6th IEEE International Conference on Electronics, Circuits and Systems, Paphos, Cyprus, 5–8 September 1999; Volume 2, pp. 899–902. [Google Scholar]
- Movassaghi, M.; Jackson, M.K.; Smith, V.M.; Young, J.F.; Hallam, W.J. Noise figure of saturated erbium-doped fiber amplifiers. In Proceedings of the Optical Fiber Communication Conference, Dallas, TX, USA, 16–21 February 1997; Volume 6, pp. 104–105. [Google Scholar]
- Baney, D.M.; Jungerman, R.L. Optical Noise Standard for the Electrical Method of Optical Amplifier Noise Figure Measurement. In Optical Amplifiers and Their Applications; Optical Society of America: Washington, WA, USA, 1997. [Google Scholar]
- Razavi, B. Design considerations for direct-conversion receivers. IEEE Trans. Circuits Syst. 1997, 44, 428–435. [Google Scholar] [CrossRef]
- Nelson, C.W.; Hati, A.; Howe, D.A. A collapse of the cross-spectral function in phase noise metrology. Rev. Sci. Instrum. 2014, 85, 024705. [Google Scholar] [CrossRef]
- Grove, J.; Hein, J.; Retta, J.; Schweiger, P.; Solbrig, W.; Stein, S.R. Direct-digital phase-noise measurement. In Proceedings of the 2004 IEEE International Frequency Control Symposium and Exposition, Montreal, QC, Canada, 23–27 August 2004; pp. 287–291. [Google Scholar]
- Parker, S.R.; Ivanov, E.N.; Hartnett, J.G. Extending the Frequency Range of Digital Noise Measurements to the Microwave Domain. IEEE Trans. Microw. Theory Tech. 2014, 62, 368–372. [Google Scholar] [CrossRef]
- ARMStrong, J. OFDM for Optical Communications. J. Light. Technol. 2009, 27, 189–204. [Google Scholar] [CrossRef]
- Schmogrow, R.; Nebendahl, B.; Winter, M.; Josten, A.; Hillerkuss, D.; Koenig, S.; Meyer, J.; Dreschmann, M.; Huebner, M.; Koos, C.; et al. Error Vector Magnitude as a Performance Measure for Advanced Modulation Formats. IEEE Photonics Technol. Lett. 2011, 24, 61–63. [Google Scholar] [CrossRef]
- Mestre, M.A.; Mardoyan, H.; Caillaud, C.; Rios-Müller, R.; Renaudier, J.; Jennevé, P.; Blache, F.; Pommereau, F.; Decobert, J.; Jorge, F. Compact InP-based DFB-EAM enabling PAM-4 112 Gb/s transmission over 2 km. J. Light. Technol. 2016, 34, 1572–1578. [Google Scholar] [CrossRef]
- Li, G.; Li, J.Q.; Chen, G.J.; Huang, X.G. SOA-based AOWC of 128-QAM Using Gaussian Pulse Shaping for Transmission System with 227 Gbps. Microw. Opt. Technol. Lett. 2018, 60, 2204–2216. [Google Scholar] [CrossRef]


| Input Data Signals (Powers (dBm) and Wavelengths (nm)) | OBPF Wavelength (nm) | Output Optical Power of the Simultaneous Up Mixed Signal (dBm) |
|---|---|---|
| Data Signal 1: −16, 1540 | 1540 | 30 |
| Data Signal 2: −14, 1543 | ||
| Data Signal 3: −12, 1545 | ||
| Data Signal 4: −10, 1548 | ||
| Data Signal 1: −16, 1540 | 1543 | 25 |
| Data Signal 2: −14, 1543 | ||
| Data Signal 3: −12, 1545 | ||
| Data Signal 4: −10, 1548 | ||
| Data Signal 1: −16, 1540 | 1545 | 20 |
| Data Signal 2: −14, 1543 | ||
| Data Signal 3: −12, 1545 | ||
| Data Signal 4: −10, 1548 | ||
| Data Signal 1: −16, 1540 | 1548 | 15 |
| Data Signal 2: −14, 1543 | ||
| Data Signal 3: −12, 1545 | ||
| Data Signal 4: −10, 1548 |
| Aim Frequency (GHz) | Replicas Power (dBm) | Data Power (dBm) | ECG (dB) | |
|---|---|---|---|---|
| Simultaneous Up-Mixed Signal at | 59.25 | 8 | 40 | 48 |
| 60 | 7 | 35 | 42 | |
| 60.75 | 5.5 | 30 | 35.5 | |
| 61.5 | 3.5 | 25 | 28.5 | |
| Simultaneous Up-Mixed Signal at 2 | 117.75 | 4 | 40 | 44 |
| 118.5 | 3 | 35 | 38 | |
| 119.25 | 0 | 30 | 30 | |
| 120 | 3 | 25 | 22 |
Disclaimer/Publisher’s Note: The statements, opinions and data contained in all publications are solely those of the individual author(s) and contributor(s) and not of MDPI and/or the editor(s). MDPI and/or the editor(s) disclaim responsibility for any injury to people or property resulting from any ideas, methods, instructions or products referred to in the content. |
© 2023 by the authors. Licensee MDPI, Basel, Switzerland. This article is an open access article distributed under the terms and conditions of the Creative Commons Attribution (CC BY) license (https://creativecommons.org/licenses/by/4.0/).
Share and Cite
Termos, H.; Mansour, A. SOA-MZI Differential Transformation Approach Applied on Simultaneous Electro-Optical Mixing. Photonics 2023, 10, 649. https://doi.org/10.3390/photonics10060649
Termos H, Mansour A. SOA-MZI Differential Transformation Approach Applied on Simultaneous Electro-Optical Mixing. Photonics. 2023; 10(6):649. https://doi.org/10.3390/photonics10060649
Chicago/Turabian StyleTermos, Hassan, and Ali Mansour. 2023. "SOA-MZI Differential Transformation Approach Applied on Simultaneous Electro-Optical Mixing" Photonics 10, no. 6: 649. https://doi.org/10.3390/photonics10060649
APA StyleTermos, H., & Mansour, A. (2023). SOA-MZI Differential Transformation Approach Applied on Simultaneous Electro-Optical Mixing. Photonics, 10(6), 649. https://doi.org/10.3390/photonics10060649