Communication

Single Photon Approach for Chirality Sensing

by
Fabrizio Sgobba
1,
Arianna Elefante
1,
Stefano Dello Russo
1,
Mario Siciliani de Cumis
1,2 and
Luigi Santamaria Amato
1,3,*
1
Italian Space Agency (ASI), Centro Spaziale ‘Giuseppe Colombo’, Località Terlecchia, 75100 Matera, Italy
2
Istituto Nazionale di Ottica, Consiglio Nazionale delle Ricerche, L.go E. Fermi 6, 50125 Firenze, Italy
3
Istituto Nazionale di Ottica, CNR-INO, Via Campi Flegrei n. 34 Pozzuoli (NA), 80078 Pozzuoli, Italy
*
Author to whom correspondence should be addressed.
Photonics 2023, 10(5), 512; https://doi.org/10.3390/photonics10050512
Submission received: 20 March 2023 / Revised: 19 April 2023 / Accepted: 25 April 2023 / Published: 28 April 2023
(This article belongs to the Topic Advances in Optical Sensors)

Abstract

:
We developed a high sensitivity optical sensor for circular birefringence using a heralded photon source. The sensor can be employed for chirality measurements and, being based on single photons, can be exploited for fragile biological sample or in metrological applications where the light intensity must be kept as low as possible. We found the best operational condition; then, we calibrated the sensor and tested its performance up to a very long acquisition time, obtaining excellent stability and a sub-ppm birefringence detection limit (for a 100 μm sample), thus paving the way for fundamental physics test as well.

1. Introduction

Chirality in nature can be found at any scale, from the world of subatomic particles all the way up to the cosmological scales.
An object is referred to as chiral if its structure is non-superimposable with its own mirror image. The natural occurrence of chirality can be associated with the laws of parity-invariance [1], whose violation, demonstrated experimentally by Wu et al. [2] in 1957, represented a milestone for the development of modern physics of elementary particles and their interactions.
At the molecular scale, chirality manifests itself with the formation of enantiomers, molecules with the same chemical structure but opposite chirality. Parity invariance suggests that molecular energy levels have to be identical for both enantiomers. However, an energy discrepancy between the two ground states in the order of magnitude of 0.1–1 feV is expected to occur due to parity violation.
The experimental observation of the predicted energy discrepancy between enantiomers ground states still represents one of the greatest challenges to contemporary stereochemistry [3,4].
Chirality also plays an important role in the field of biochemistry and pharmacology because of the paradigm of ‘homochirality’ [5], i.e., the exclusive preference of one specific enantiomeric form of certain molecules to constitute the building blocks of all forms of life. Moreover, since its detection could be a strong evidence for the existence of extraterrestrial life, homochirality has a vital role in astrobiology [6,7].
Far from being confined to academia and fundamental research, the study and detection of chirality has an important role in widely applicative fields such as pharmacology or food and the beverage industry [8].
Approximately 56 % of the pharmaceuticals currently produced and commercialized involve chiral molecules, and 88 % of those are administered through racemic proportions [9]. Despite having the same chemical structure, in racemic drugs, the enantiomers usually show different biological effects (such as toxicity) [10,11]; therefore, the American Food and Drug Administration (FDA) requires new compounds to be produced as single enantiomers, whereas non-abiding cases are usually addressed one by one [12,13]. Moreover, chirality detection and sensing is involved in biomedical applications, being helpful in the diagnosis of kidney diseases [14], infectious diseases [15] or mental disorders [16].
Chiral structures’ interaction with light is polarisation-dependent (a phenomenon known as optical activity). High-sensitivity optical techniques are therefore well-suited to be among the best performing chirality sensing techniques [17,18].
A first way optical activity may present itself is through dichroism [19], i.e, a polarisation dependency of the imaginary part of the refractive index, resulting in a polarisation-dependent absorption.
If the optical activity affects the real part of the refractive index (the propagation velocity of light through the medium), the phenomenon is called birefringence [19] instead.
Optical rotatory dispersion (ORD) is an optical technique that senses chiral objects employing birefringence [20]. When a linearly polarized light (LPL), that can be seen as composed of equal amount of left (LCP) and right circular polarized (RCP) light, impinges on the sample, the LCP and RCP components are de-phased since these propagate at different velocities inside the sample (circular birefringence). The induced RCP-LCP dephasing can therefore be measured outside the sample as a rotation in the linear polarization of a certain angle θ , which results in:
θ = π l λ [ n L C n R C ]
where l is the length of the sample, λ the test laser beam wavelength and n L C n R C the optical circular birefringence ( n L C , n R C is the refrective index for Left, Right polarized light) [21,22].
Since such birefringence is usually as weak as one part on 10 6 , the most common way to improve the detection limit relies either on employing high-power lasers to enhance the signal-to-noise ratio (SNR) or on increasing the optical path length inside the sample, for example, by means of optical cavities [22]. Another approach consists in employing balanced heterodyne detection to average out common noise [21].
Unfortunately, for biological samples, where the high source intensities may trigger undesired reactions [23], the laser power must be kept as low as possible to avoid degradation, especially for long acquisition times. The same holds true in meteorological applications [24], where the source must be kept as low-power as possible to avoid system perturbation. These application needs inspired the development of quantum meteorological techniques for birefringence detection in the recent past.
These quantum approaches, which aim to improve the precision while keeping the probe beam in the regime of low intensity (down to single-photon levels) [25], enable promising performances [26,27] and, in principle, the possibility to overcome the standard quantum limit [28,29]. Moreover, the employment of a twin correlated photon source greatly reduces the dark counts, which are not negligible, especially in the long wavelength range [27,30].
In quantum polarimetry, as in its high intensity counterpart, the sample chirality is detected by measuring the transmittance of a linearly polarised light passing through the analyte resolved in its polarised components. The presence of the chiral medium rotates the quantum state polarisation and induces a change in the trasmitted intensity, de facto mapping a polarisation rotation into a trasmission intensity measurement. Since the defined Fock states | N > carry no uncertainty in intensity, these states are the best possible choice for transmission intensity measurement [31].
In this paper, we develop a sensor to measure the polarisation rotation induced by a birefringent sample using correlated single photon states in telecom range produced via spontaneous parametric down conversion (SPDC).
Our work extends the results recently obtained at shorter wavelenght to the telecom range [32,33], paving the way for quantum-metrological birefringence measurement in fully fibre-cabled setups, according to similar developments in the field of Hong-Ou-Mandel interferometry [34,35].

2. Materials and Methods
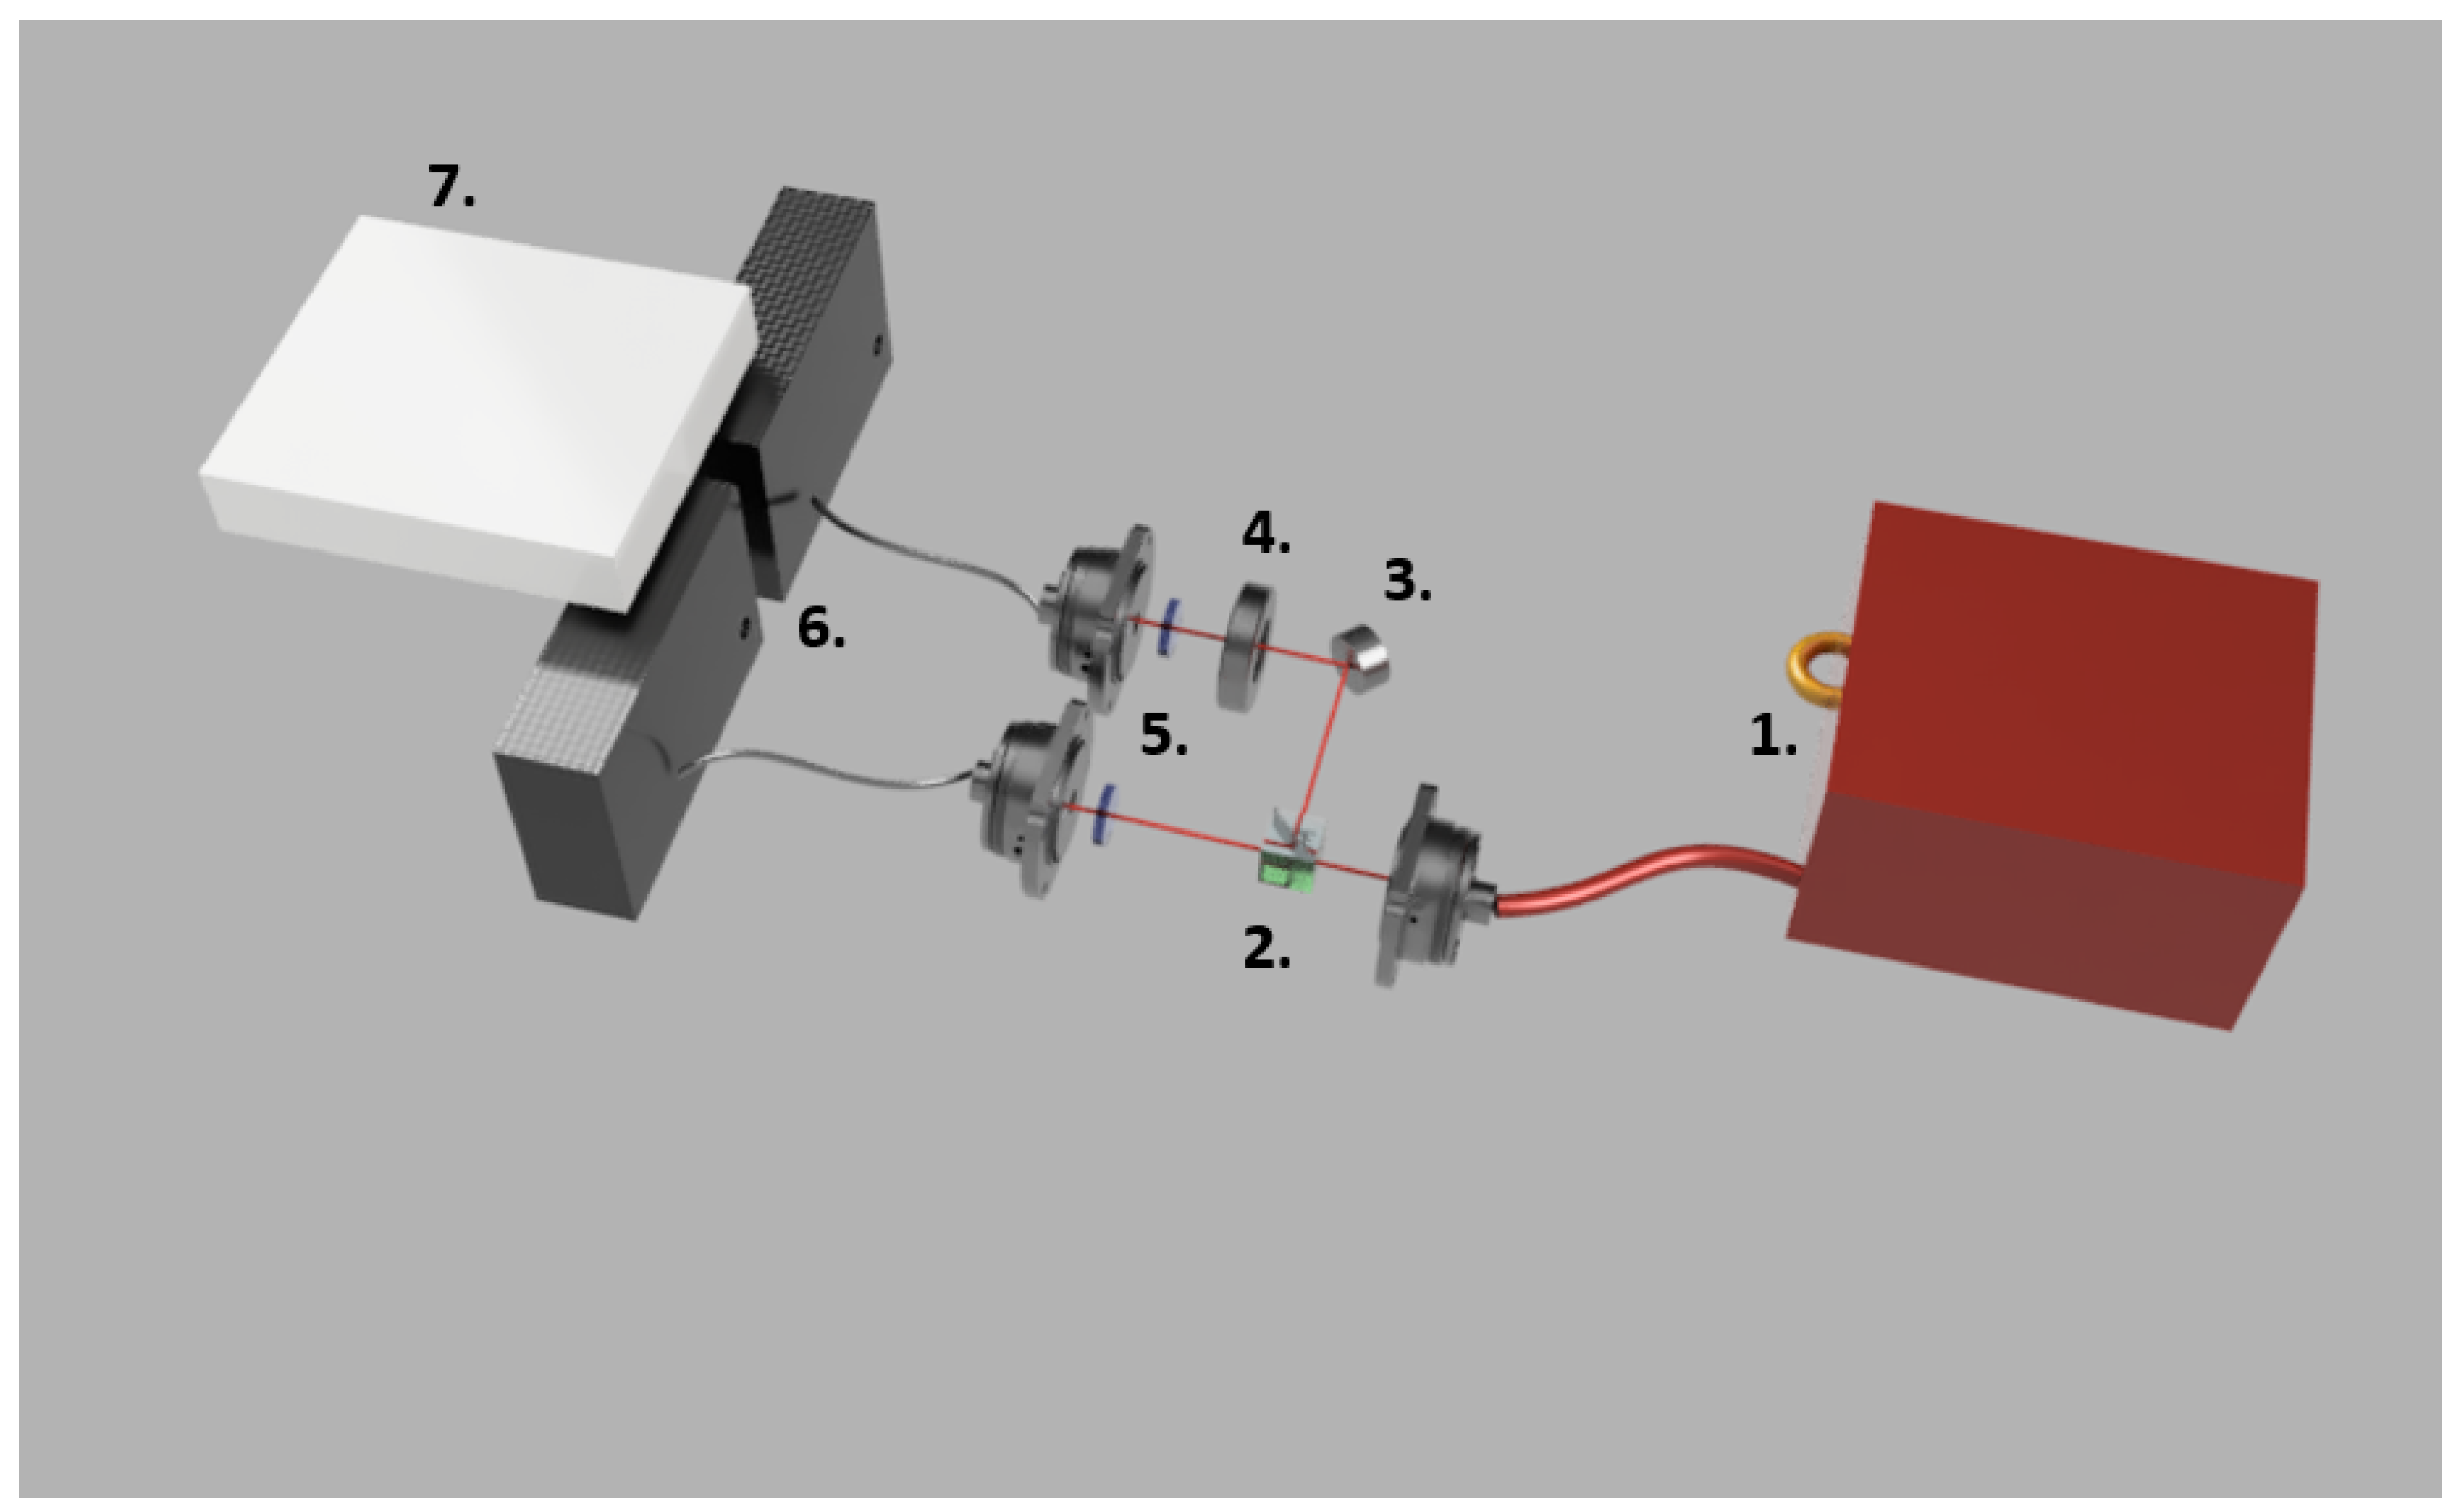
Experimental Setup

The proposed sensor employs a twin photon source (TPS, 1. with respect to Figure 1) equipped with an internal continuous wave (CW) laser pump with center emission wavelength at 775 nm illuminating a periodically poled litium-niobate (PPLN) crystal optimized to achieve the best performances for type-II spontaneous parametric down conversion (SPDC) at 1550 nm when stabilised in temperature at 33.9 C.
Each twin photon pair impinges on a balanced beam splitter (BS); therefore, each photon undergoes one of the two output paths with equal probability. Two near-infrared absorbing linear polarisers (extinction ratio of 10 5 ) are then used to post-select the desired measurement base on the block sphere right before each beam is coupled back into fibres by means of collimating fibre-coupling ports.
The sample is represented by a half-wave plate (HWP, 4. in Figure 1) able to emulate the polarization rotation of a chiral medium with great accuracy and repeatability (the employed HWP introduces retardance of 0.5 λ with an error of ± 0.01 λ within the signal-idler emission bandwidth). The plate is mounted on a rotational stage and placed on one of the two arms, which will be hereafter referred to as “test arm”.
Coupled beams are sent to termo-electrically cooled single photon avalanche diode (SPAD) detectors (6. in Figure 1) connected to a time-tagging device to record single counts on each detector and coincidence counts between detectors (7. in Figure 1). Both SPADs detectors were kept at a 20 % detection efficiency and 5 μs dead time, which resulted in D K 1 3300 dark counts per 2 s on channel 1 and D K 2 5300 dark counts per 2 s on channel 2. It is worth noting, however, that the meaningful measurements involve the coincidence counting. Dark counts on coincidence events, given mostly by spurious electric signals triggering one channel within the same coincidence window of a true event on the other channel, are found to be negligible. The overall resolution of the system composed of the two detectors and the time tagger is ≈100 ps, which is why a coincidence window of 200 ps has been chosen for the experiment.
The introduction of a balanced beam splitter to separate incoming photon pairs into a test beam and a reference beam, instead of a polarising beam splitter, halves the total amount of obtainable coincidences. On the other hand, it ensures that both arms are identical and enables the sampling of all polarization directions in both arms. It avoids systematic errors that may occur for samples (cuvette, optics) with different responses for the vertical and horizontal axes, whereas pure circular birefringence has identical responses for the vertical and horizontal axes.

3. Results and Discussion

3.1. Characterisation of Twin Photon Pairs Mixture

In order to infer the best operative range for the proposed sensor, a first characterisation without a sample has been carried out. The coincidence counts C ( θ 1 , θ 2 ) have been mapped as a function of the angle the transmission axis of each polariser forms with the horizontal plane ( θ 1 and θ 2 for test and reference arm respectively). Since each polariser has been mounted on a motorised rotational stage, the processes of angle assignment, data acquisition and extraction have been automated using LabVieW software. The nested for-loops were designed to operate identical N s = 91 steps of δ θ = 2 , for an acquisition time of 2 s per single step. The whole measurement lasted ≈4.5 h.
The resulting map is shown in Figure 2.
From Figure 2, it can be observed that θ 1 = 90 represents the 1D projection with the highest peak-to-throat excursion in C ( θ 2 ) . Thus, in the following, it has been kept fixed: θ 1 = 90 .

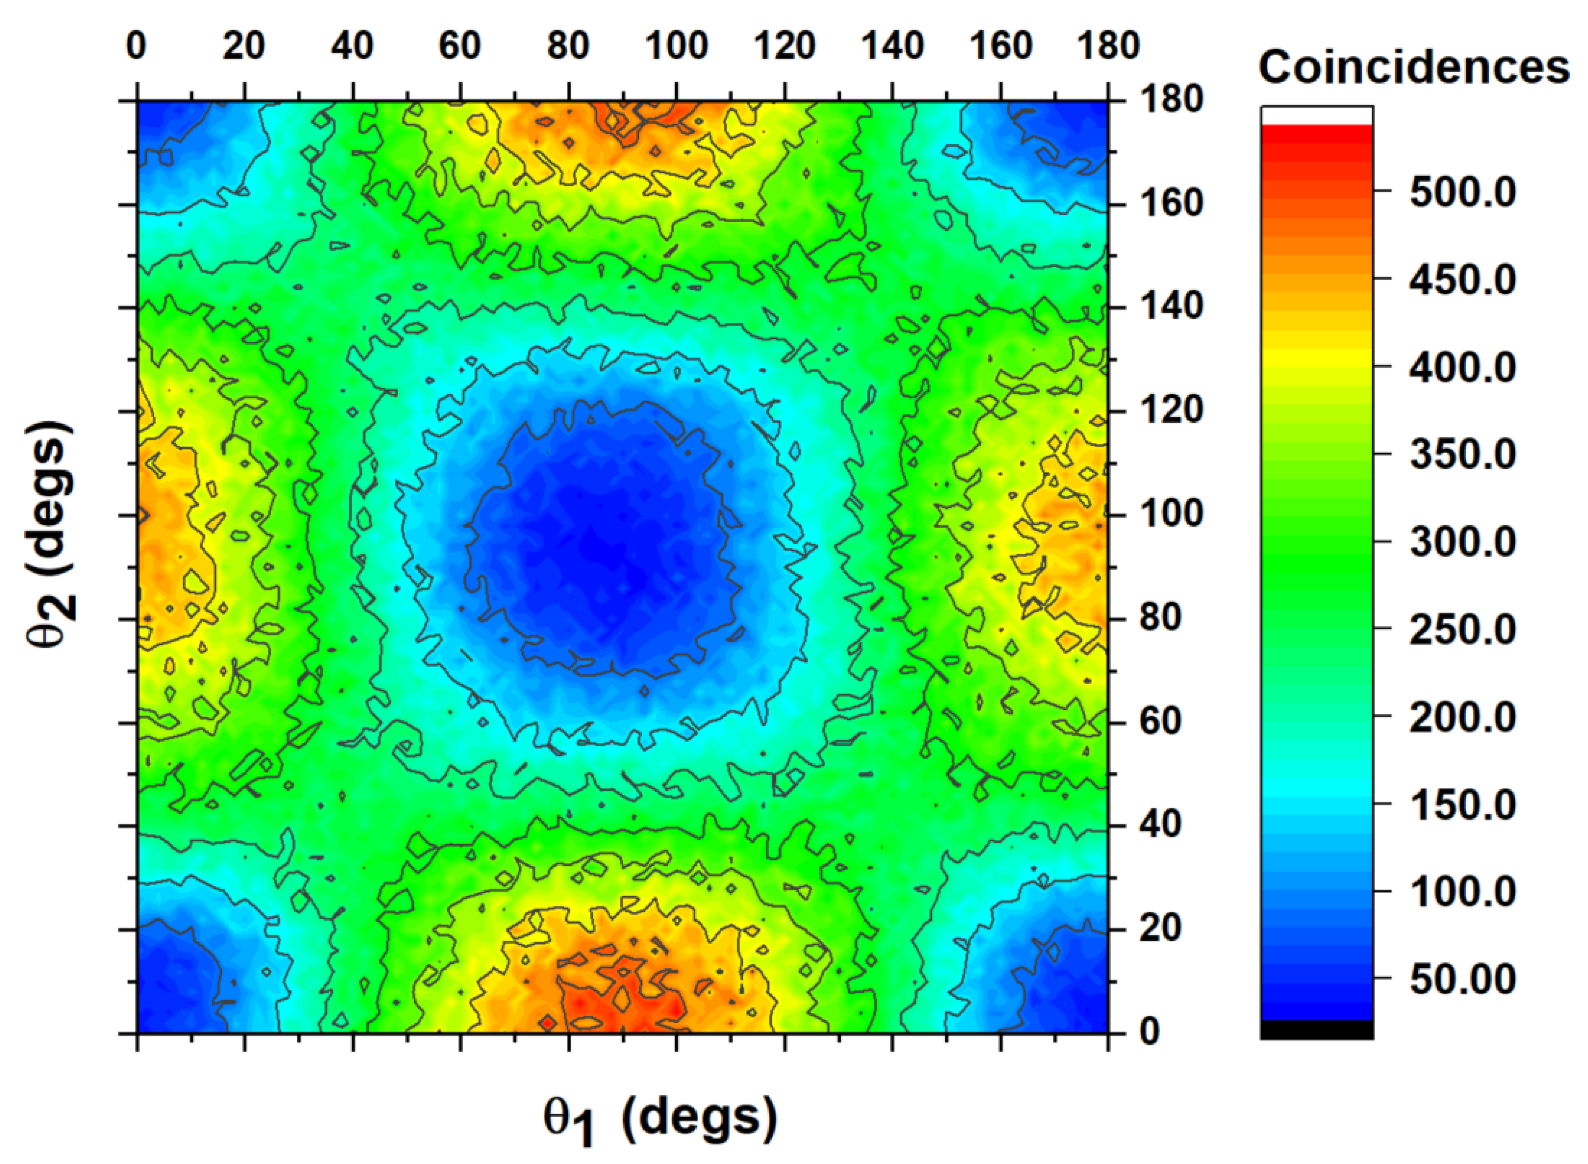
3.2. Calibration of Polarisation Sensor

The proper calibration of the polarisation sensor has been performed, keeping the polariser on the reference arm fixed at θ 1 = 90 , and the polariser placed in the target arm fixed at θ 2 = 0 . A motorised half-wave plate (HWP) has been placed in the target arm, acting as a birefringence sample (4. in Figure 1). To avoid confusion, θ E will be identified from now as the angle that the electric field forms with the horizontal axis once a horizontally polarised photon has passed the HWP. Such an angle is twice the angle that the HWP forms with the same axis.
Similarly to the previous step, the process of rotation and acquisition has been automated, acquiring N s = 91 steps of δ θ E = 2 , for an acquisition time of 2 s per single step, repeating the process for N r = 100 consecutive loops. This measurement session lasted ≈5 h.
The coincidence counts in correspondence with each HWP angle have been averaged over the 100 loops, and plotted in Figure 3 with their uncertainty (standard deviation over square root of loops number). To calibrate the sensor, the following polynomial function has been employed:
C ( θ E ) = C 0 + k = 1 6 C k π ( θ E θ E 0 ) 180 k
The calibration curve allows one to retrieve the induced rotation of the polarisation as an estimation parameter θ E ( C ) , a function of the coincidences measured. The contributions to the offset C 0 are mostly given by fibers and HWP-induced elliptical distortions.
The statistical error committed in the estimation of the chosen parameter at the acquisition time τ a = 2 s can be inferred using the following equation:
σ θ ( τ a ) θ E C δ C ( τ a ) θ E C σ C ( τ a )
σ C ( τ a ) has been evaluated as the standard deviation of the measured coincidences at a fixed θ E . Since C ( θ E ) is not injective in the whole 180 range, being symmetrical with respect to its center θ E 0 = 86 , the function has been inverted (numerically) piecewise for θ E < θ E 0 and θ E θ E 0 .
The statistical error σ θ ( τ a ) on the estimated parameter, evaluated using Equation (2), is presented in Figure 4 as a function of the actual angles reproduced with the rotational mount ( θ E ).

3.3. Minimum Detection Limit

As can be observed in Figure 4, one of the minima for σ θ falls at θ E 1 56 , where σ θ ( 2 s ) < 2 . This value is therefore ideal to perform a long-term measurement. The system has been kept running, acquiring coincidence counts and tilting the motorised HWP between θ E 1 = 56 and θ E 2 = 56 . 1 , for >60 h over the weekend, acquiring 108,600 datapoints, 54,300 for each angle at τ = 2 s acquisition time. The Δ θ has been chosen as the minimum rotation possible outside the sensibility error of the motorised rotational stage itself.
The acquired coincidence counts C ( θ E 1 , t i ) and C ( θ E 2 , t i + τ ) have been converted to the estimation parameter via the inverted function θ E ( C ) . The integral average of the estimation parameter θ E 1 / 2 can be defined as follows:
Θ E 1 / 2 ( T ) = 1 T t = 0 T θ E 1 / 2 ( C ( t ) )
In addition, it is reported in Figure 5.
As can be observed from Figure 5, the sensor is capable of detecting the variation in polarisation angle after 2 h (i.e., after 2 h, Θ E 1 and Θ E 2 no longer intersect with each other).

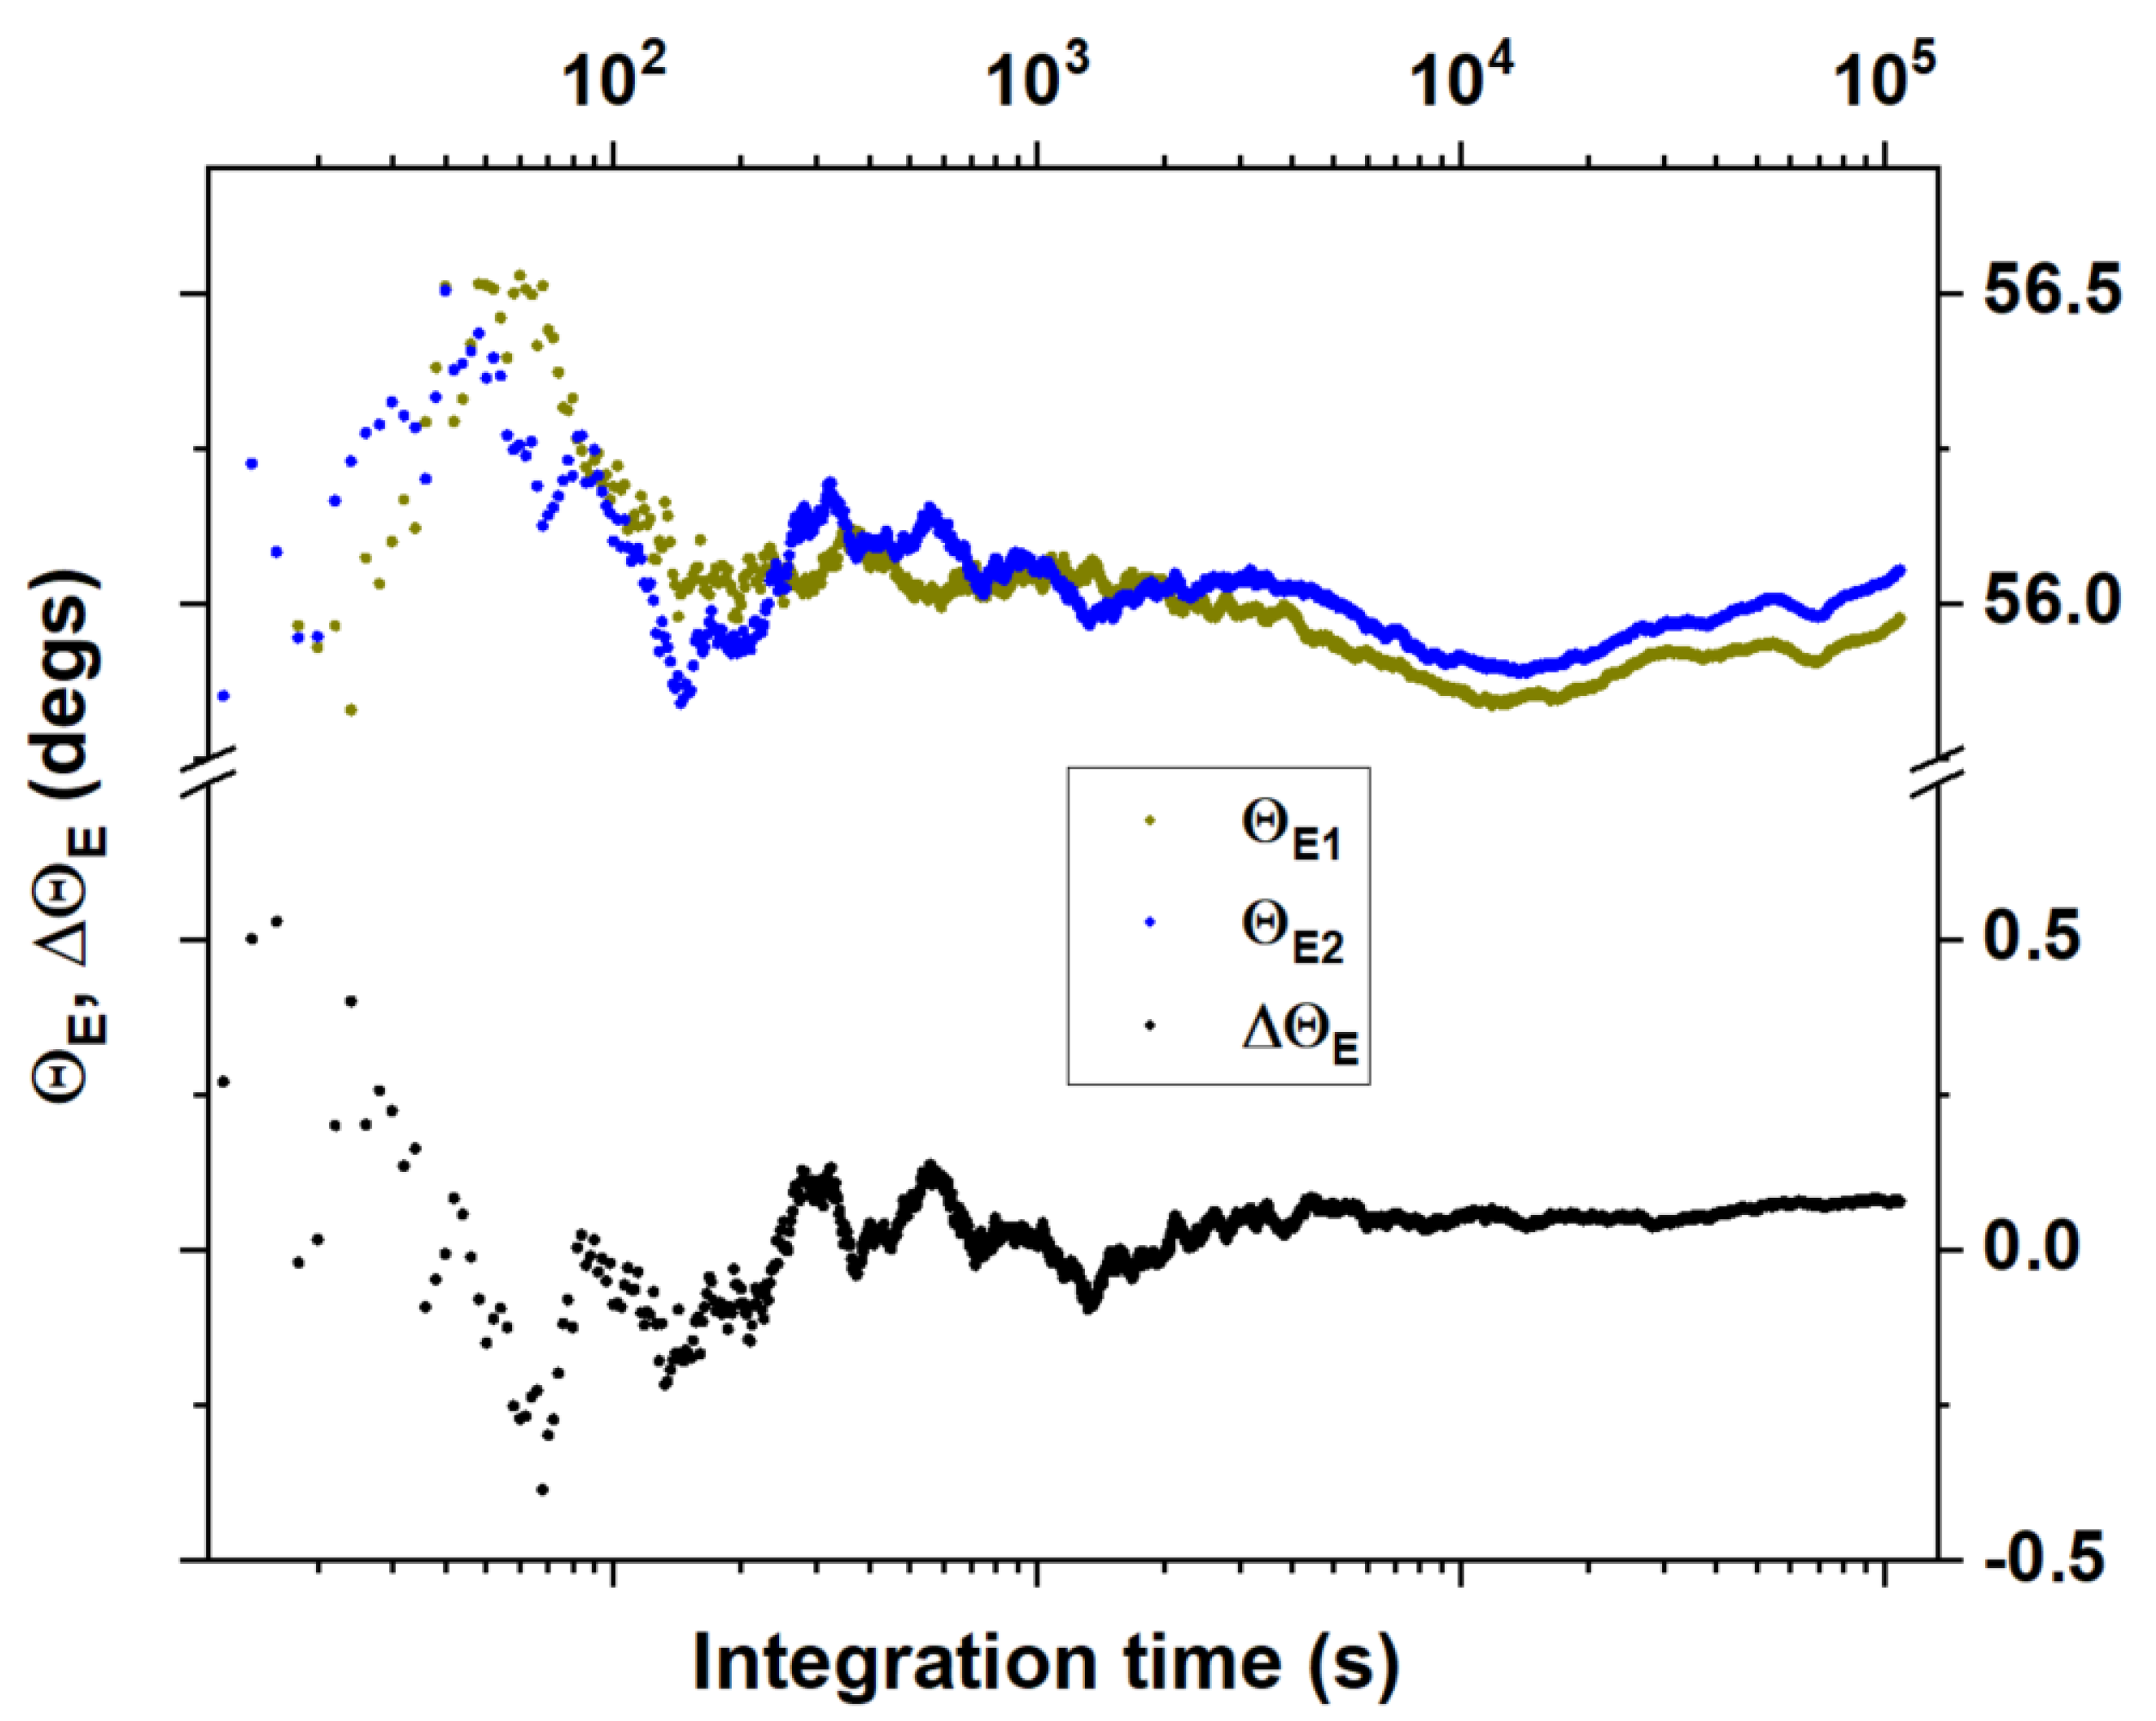
3.4. Allan Deviation Analysis and Minimum Detection Limit

The most rigorous way to determine the sensor stability at different integration times is to perform a non-overlapping Allan deviation analysis that allows one to infer how the standard deviation of a signal varies at different integration times starting from a single long-term acquisition.
The non-overlapping Allan deviation analysis has therefore been performed over the 53,400 samples of Δ θ E collected over the 60-h-long acquisition. Since this sensor has been devised and designed to measure the optical activity (OA) of circularly birefringent samples, the standard deviation has been converted to optical activity detection limit (OADL), defined as the OA giving unitary signal to noise ratio. From Equation (1), it follows:
O A D L = λ σ θ E l π
In Figure 6, the OADL per unit length (black straight curve), is reported as a function of the average coincidence events acquired, roughly 216 per τ 0 , where τ 0 = 2 s. Average coincidence events are a better indicator than integration time since these do not rely on detectors performances. Better detection systems, for example superconducting nanowires single photon detectors (SNSPDs), usually have far lower dead time and higher accuracy levels with respect to SPADs, allowing one to achieve comparable OADL at significantly inferior integration times. The Allan deviation analysis of Θ E 1 , Θ E 2 is also reported in Figure 6, here multiplied by a factor λ π for comparison (blue and dark yellow straight curves). As can be observed, for sufficiently high numbers of coincidence events acquired, the Allan deviations of Θ E 1 and Θ E 2 show a long-term rise significantly deviating from the theoretical limit baseline ( σ N c ). This rise is associated in the literature (see for example [36]) with long-term fluctuations of the optical pump. The comparative measurement, σ Δ Θ (black straight curve), proves to be capable of averaging out this noise contribution.
To offer a straightforward comparison with the existing literature, in [21], using high-power sources, an O A D L 8.5 × 10 10 has been reached employing an optical path length of l = 100   μ m. Our sensor shows detection limit three orders of magnitude larger employing a sample with the same path length. It is noteworthy, however, how these results are obtained in the single-photon regime, which makes the proposed sensor extremely attractive especially when used in combination with more efficient and fast detectors (e.g., SPSDC) that are capable to reduce integration times by up to two orders of magnitude.

4. Conclusions

In this paper, we have proposed a highly stable, high-performing sensor based on a twin photon source capable to detect a linear polarisation rotation as low as in the range of hundreds of μrad, taking advantage of the high stability offered by the coincidence counting together with the dual arm configuration.
Having been designed and implemented to operate in the telecom range, the devised sensor represents a significantly innovative step towards fibre-cabled portable twin-photon source-based meteorology devices meant to offer ultra-high precision measurements of chemical or biological samples in a laboratory-controlled environment. Moreover, the sensor has shown to be capable of reaching an accuracy in the measurement of Δ n within three orders of magnitude with respect to the one obtained in the literature employing high power sources, in an optical range less suitable to photonics integration.

Author Contributions

Conceptualization, F.S. and L.S.A.; methodology, L.S.A.; software, F.S.; validation, L.S.A. and M.S.d.C.; formal analysis, F.S.; investigation, F.S. and L.S.A.; resources, S.D.R. and A.E.; data curation, F.S.; writing—original draft preparation, F.S. and L.S.A.; writing—review and editing, F.S., L.S.A. and M.S.d.C.; supervision, L.S.A. and M.S.d.C. All authors have read and agreed to the published version of the manuscript.

Funding

This research was partially supported by the QUANCOM project (MUR PON Ricerca e Innovazione 2014–2020 ARS01 00734) and the project MOlecular spectroscopy for Space science and quantum physics Test (MOST) funded by Italian Space Agency.

Institutional Review Board Statement

Not applicable.

Informed Consent Statement

Not applicable.

Data Availability Statement

The data that support the findings of this study are available from the corresponding author L.S.A. upon reasonable request.

Acknowledgments

We wish to acknowledge Vincenzo Buompane and Graziano Spinelli for technical support.

Conflicts of Interest

The authors declare no conflict of interest.

References

  1. Barron, L.D. From Cosmic Chirality to Protein Structure: Lord Kelvin’s Legacy. Chirality 2012, 24, 879–893. [Google Scholar] [CrossRef]
  2. Wu, C.S.; Ambler, E.; Hayward, R.W.; Hoppes, D.D.; Hudson, R.P. Experimental Test of Parity Conservation in Beta Decay. Phys. Rev. 1957, 105, 1413–1415. [Google Scholar] [CrossRef]
  3. Quack, M.; Seyfang, G.; Wichmann, G. Perspectives on parity violation in chiral molecules: Theory, spectroscopic experiment and biomolecular homochirality. Chem. Sci. 2022, 13, 10598–10643. [Google Scholar] [CrossRef]
  4. Quack, M. How Important is Parity Violation for Molecular and Biomolecular Chirality? Angew. Chem. Int. Ed. 2002, 41, 4618–4630. [Google Scholar] [CrossRef] [PubMed]
  5. Walker, S.I. Homochirality. In Encyclopedia of Astrobiology; Springer: Berlin/Heidelberg, Germany, 2014; pp. 1–3. [Google Scholar] [CrossRef]
  6. Glavin, D.P.; Burton, A.S.; Elsila, J.E.; Aponte, J.C.; Dworkin, J.P. The Search for Chiral Asymmetry as a Potential Biosignature in our Solar System. Chem. Rev. 2019, 120, 4660–4689. [Google Scholar] [CrossRef]
  7. Avnir, D. Critical review of chirality indicators of extraterrestrial life. New Astron. Rev. 2021, 92, 101596. [Google Scholar] [CrossRef]
  8. Nunez, M.; Garcia-Rubino, M.; Conejo-Garcia, A.; Cruz-Lopez, O.; Kimatrai, M.; Gallo, M.; Espinosa, A.; Campos, J. Homochiral Drugs: A Demanding Tendency of the Pharmaceutical Industry. Curr. Med. Chem. 2009, 16, 2064–2074. [Google Scholar] [CrossRef] [PubMed]
  9. Ceramella, J.; Iacopetta, D.; Franchini, A.; Luca, M.D.; Saturnino, C.; Andreu, I.; Sinicropi, M.S.; Catalano, A. A Look at the Importance of Chirality in Drug Activity: Some Significative Examples. Appl. Sci. 2022, 12, 10909. [Google Scholar] [CrossRef]
  10. Drayer, D.E. Pharmacodynamic and pharmacokinetic differences between drug enantiomers in humans: An overview. Clin. Pharmacol. Ther. 1986, 40, 125–133. [Google Scholar] [CrossRef]
  11. Patočka, J.; Dvořák, A. Biomedical aspects of chiral molecules. J. Appl. Biomed. 2004, 2, 95–100. [Google Scholar] [CrossRef]
  12. Calcaterra, A.; D’Acquarica, I. The market of chiral drugs: Chiral switches versus de novo enantiomerically pure compounds. J. Pharm. Biomed. Anal. 2018, 147, 323–340. [Google Scholar] [CrossRef] [PubMed]
  13. Daniels, J.M.; Nestmann, E.R.; Kerr, A. Development of Stereoisomers (Chiral) Drugs: A Brief Review Of Scientific and Regulatory Considerations. Drug Inf. J. 1997, 31, 639–646. [Google Scholar] [CrossRef]
  14. Kimura, T.; Hamase, K.; Miyoshi, Y.; Yamamoto, R.; Yasuda, K.; Mita, M.; Rakugi, H.; Hayashi, T.; Isaka, Y. Chiral amino acid metabolomics for novel biomarker screening in the prognosis of chronic kidney disease. Sci. Rep. 2016, 6, 26137. [Google Scholar] [CrossRef]
  15. Batalla, P.; Martín, A.; López, M.Á.; González, M.C.; Escarpa, A. Enzyme-Based Microfluidic Chip Coupled to Graphene Electrodes for the Detection of D-Amino Acid Enantiomer-Biomarkers. Anal. Chem. 2015, 87, 5074–5078. [Google Scholar] [CrossRef] [PubMed]
  16. MacKay, M.A.B.; Kravtsenyuk, M.; Thomas, R.; Mitchell, N.D.; Dursun, S.M.; Baker, G.B. D-Serine: Potential Therapeutic Agent and/or Biomarker in Schizophrenia and Depression? Front. Psychiatry 2019, 10, 11–17. [Google Scholar] [CrossRef] [PubMed]
  17. Chen, Y.H.; Yang, J.T. A new approach to the calculation of secondary structures of globular proteins by optical rotatory dispersion and circular dichroism. Biochem. Biophys. Res. Commun. 1971, 44, 1285–1291. [Google Scholar] [CrossRef]
  18. Gogoi, A.; Konwer, S.; Zhuo, G.Y. Polarimetric Measurements of Surface Chirality Based on Linear and Nonlinear Light Scattering. Front. Chem. 2021, 8, 21–25. [Google Scholar] [CrossRef]
  19. Nakanishi, K.; Berova, N.; Woody, R.W. Circular Dichroism: Principles and Applications. VCH Publishers, Inc., New York, NY. 1994. xvii + 576 pp. 15.5 × 23.5 cm. $125.00. ISBN 1-56081-618-X. J. Nat. Prod. 1996, 59, 1219. [Google Scholar] [CrossRef]
  20. Eyring, H.; Liu, H.C.; Caldwell, D. Optical rotatory dispersion and circular dichroism. Chem. Rev. 1968, 68, 525–540. [Google Scholar] [CrossRef]
  21. Chou, C.; Tsai, H.M.; Liao, K.Y.; Chou, L.D.; Huang, P.H. Optical activity measurement by use of a balanced detector optical heterodyne interferometer. Appl. Opt. 2006, 45, 3733. [Google Scholar] [CrossRef]
  22. Vollmer, F.; Fischer, P. Ring-resonator-based frequency-domain optical activity measurements of a chiral liquid. Opt. Lett. 2006, 31, 453. [Google Scholar] [CrossRef] [PubMed]
  23. Neuman, K.C.; Chadd, E.H.; Liou, G.F.; Bergman, K.; Block, S.M. Characterization of Photodamage to Escherichia coli in Optical Traps. Biophys. J. 1999, 77, 2856–2863. [Google Scholar] [CrossRef] [PubMed]
  24. Taylor, M.A.; Bowen, W.P. Quantum metrology and its application in biology. Phys. Rep. 2016, 615, 1–59. [Google Scholar] [CrossRef]
  25. Roccia, E.; Cimini, V.; Sbroscia, M.; Gianani, I.; Ruggiero, L.; Mancino, L.; Genoni, M.G.; Ricci, M.A.; Barbieri, M. Multiparameter approach to quantum phase estimation with limited visibility. Optica 2018, 5, 1171. [Google Scholar] [CrossRef]
  26. Giovannetti, V.; Lloyd, S.; Maccone, L. Advances in quantum metrology. Nat. Photonics 2011, 5, 222–229. [Google Scholar] [CrossRef]
  27. Russo, S.D.; Elefante, A.; Dequal, D.; Pallotti, D.K.; Amato, L.S.; Sgobba, F.; de Cumis, M.S. Advances in Mid-Infrared Single-Photon Detection. Photonics 2022, 9, 470. [Google Scholar] [CrossRef]
  28. Giovannetti, V.; Lloyd, S.; Maccone, L. Quantum-Enhanced Measurements: Beating the Standard Quantum Limit. Science 2004, 306, 1330–1336. [Google Scholar] [CrossRef]
  29. Wolfgramm, F.; Vitelli, C.; Beduini, F.A.; Godbout, N.; Mitchell, M.W. Entanglement-enhanced probing of a delicate material system. Nat. Photonics 2012, 7, 28–32. [Google Scholar] [CrossRef]
  30. Elefante, A.; Russo, S.D.; Sgobba, F.; Amato, L.S.; Pallotti, D.K.; Dequal, D.; de Cumis, M.S. Recent Progress in Short and Mid-Infrared Single-Photon Generation: A Review. Optics 2023, 4, 13–38. [Google Scholar] [CrossRef]
  31. Adesso, G.; Dell’Anno, F.; Siena, S.D.; Illuminati, F.; Souza, L.A.M. Optimal estimation of losses at the ultimate quantum limit with non-Gaussian states. Phys. Rev. A 2009, 79, 040305. [Google Scholar] [CrossRef]
  32. Tischler, N.; Krenn, M.; Fickler, R.; Vidal, X.; Zeilinger, A.; Molina-Terriza, G. Quantum optical rotatory dispersion. Sci. Adv. 2016, 2. [Google Scholar] [CrossRef]
  33. Yoon, S.J.; Lee, J.S.; Rockstuhl, C.; Lee, C.; Lee, K.G. Experimental quantum polarimetry using heralded single photons. Metrologia 2020, 57, 045008. [Google Scholar] [CrossRef]
  34. Harnchaiwat, N.; Zhu, F.; Westerberg, N.; Gauger, E.; Leach, J. Tracking the polarisation state of light via Hong-Ou-Mandel interferometry. Opt. Express 2020, 28, 2210. [Google Scholar] [CrossRef] [PubMed]
  35. Sgobba, F.; Pallotti, D.K.; Elefante, A.; Russo, S.D.; Dequal, D.; de Cumis, M.S.; Amato, L.S. Optimal Measurement of Telecom Wavelength Single Photon Polarisation via Hong-Ou-Mandel Interferometry. Photonics 2023, 10, 72. [Google Scholar] [CrossRef]
  36. Giglio, M.; Patimisco, P.; Sampaolo, A.; Scamarcio, G.; Tittel, F.K.; Spagnolo, V. Allan deviation plot as a tool for quartz-enhanced photoacoustic sensors noise analysis. IEEE Trans. Ultrason. Ferroelectr. Freq. Control 2015, 63, 555–560. [Google Scholar] [CrossRef]
Figure 1. Pictorial 3D representation of the polarisation rotation sensor. (1.) Twin photon source, (2.) balanced beam splitter, (3.) gold-coated plane mirror, (4.) half-wave plate (HWP) mounted on motorized rotational stage, acting as polarisation tilting sample, (5.) linear polarisers, (6.) single photon avalanche diodes detectors (SPADs). (7.) Time tagger for coincidence detection. This figure was obtained via Fusion 360.
Photonics 10 00512 g001
Figure 2. Contour map employed to infer sensor’s best operative range. Coincidence counts are mapped as function of polarisation angle of each polariser with respect to horizontal axes, namely θ 1 , θ 2 .
Photonics 10 00512 g002
Figure 3. Averaged value of C ( θ E ) (black dots) and its uncertainty. The polynomial function employed for calibration is also resported (red curve).
Photonics 10 00512 g003
Figure 4. Plot of the statistical error on the estimation parameter σ θ ( 2 s ) (black dots) as a function of the actual angles reproduced with the rotational mount ( θ E ).
Photonics 10 00512 g004
Figure 5. Integral average of Θ E 1 ( T ) (blue dots), Θ E 2 ( T ) (dark yellow dots), and their difference Δ Θ E ( T ) (black dots) as a function of integration time, expressed in logarithmic scale.
Photonics 10 00512 g005
Figure 6. OADL per unit length as a function of the average coincidence events (black curve). The Allan deviation of the single Θ E is also reported for comparison, respecting the same legend as in Figure 5.
Photonics 10 00512 g006
Disclaimer/Publisher’s Note: The statements, opinions and data contained in all publications are solely those of the individual author(s) and contributor(s) and not of MDPI and/or the editor(s). MDPI and/or the editor(s) disclaim responsibility for any injury to people or property resulting from any ideas, methods, instructions or products referred to in the content.

