Communication

Measurement of the Temperature Dependence of Polarization Switching in Gain-Switched VCSELs for Quantum Random Number Generation

Instituto de Física de Cantabria (CSIC-Univ. Cantabria), Avda. Los Castros s/n, E39005 Santander, Spain
*
Author to whom correspondence should be addressed.
Photonics 2023, 10(4), 474; https://doi.org/10.3390/photonics10040474
Submission received: 23 March 2023 / Revised: 18 April 2023 / Accepted: 18 April 2023 / Published: 20 April 2023
(This article belongs to the Special Issue Advancements in Semiconductor Lasers)

Abstract

:
We report an experimental study of the effect of the temperature of the VCSEL on the probability of excitation of a linearly polarized mode when gain-switching the device. We consider different modulation frequencies and amplitudes. We show that the probability of excitation of a linearly polarized mode significantly changes with the value of the temperature of the device. We also show that for low values of the temperature the probability of excitation saturates to a constant value as the amplitude of the modulation increases. This extends our previous results obtained at larger temperatures for which that saturation was not observed. We identify situations in which the distributions of the linearly polarized signals at a sampling time are approximately uniform. For these cases we evaluate the quality of the random numbers by using statistical test.

1. Introduction

Theoretical and experimental understanding of the fluctuations of laser light began shortly after the invention of the laser [1,2,3,4,5]. Special attention has been paid to fluctuations of the light emitted by semiconductor lasers [6,7,8,9] due to their vast variety of applications. In most of these applications the effect of laser noise is detrimental. For instance, spontaneous emission noise causes enhancement of the lasing optical spectrum [8], timing jitter fluctuations during the laser turn-on [10,11,12], or random excitation of different longitudinal lasing modes [13]. However, novel applications are emerging in which the fluctuating character of laser light is beneficial. One example is the random number generation (RNG) using semiconductor lasers.
Random numbers are a vital resource for numerous applications, including cryptography, Monte Carlo simulations, quantitative finance, massive data processing, etc. [14,15,16]. Quantum random number generators (QRNGs) stand out from RNGs because their randomness stems from quantum processes, this being the best guarantee for offering optimum privacy and security while maintaining high performance [15,16]. QRNG have advantages in quantum computation and quantum communications [17,18,19,20,21,22]. QRNGs have emerged as certifiable source of true random numbers, being basic elements in practical quantum key distribution (QKD) systems [23]. Device-independent randomness expansion using entangled photons [24] and source-independent QRNGs [25] have been recently demonstrated. QRNGs based on the detection of single-photon events [26,27,28,29,30] and multiphoton QRNGs [31,32,33,34,35,36,37,38,39,40,41,42,43,44,45,46,47] have been demonstrated.
One of the most common multiphoton tecniques for QRNG is based on the phase fluctuations of the light emitted by pulsed semiconductor laser diodes [34,37,38,39,40,43,45]. These fluctuations are caused by spontaneous emission photons. Spontaneous emission is a useful mechanism to generate quantum fluctuations, as it can be ascribed to the vacuum fluctuations of the optical field [34,48]. In these QRNGs, light pulses with similar amplitudes and randomized phases are generated by repetitive gain-switching of a single-mode semiconductor laser from below to above its threshold. One way of converting those phase fluctuations into amplitude fluctuations is by using an unbalanced Mach–Zehnder interferometer. From these amplitude fluctuations, random numbers are obtained after proper digitization. Advantages of this type of generators include simplicity, fast operation at Gbps rates (up to 68 Gbps [39]), robustness, low cost, multiclock frequency flexibility, and full integration on an InP platform [40]. Gain-switched single-mode semiconductor lasers and QRNGs based on this system have been recently used for state preparation in QKD [23,49].
Gain-switching of multimode semiconductor lasers, in particular vertical-cavity surface-emitting lasers (VCSELs), has also been used for QRNG. VCSELs usually show two orthogonal linearly polarized modes in such a way that polarization switching (PS) between them can be observed when changing the bias current or the temperature of the device [50,51]. When the VCSEL’s bias current is modulated from below to above the threshold value, the linear polarization mode that is preferably excited is random because it is determined by the sequence of spontaneous emission noise events. This randomness is the basis of the QRNGs using gain-switched VCSELs that have been proposed [46,52,53,54,55,56]. QRNGs based on VCSELs have the advantages of low fabrication costs, small size, compactness, and simplicity (coherent detection is not required). VCSELs also offer advantages such as on-wafer testing capability, fast operation, high energy efficiency, and ease of 2D array packaging [51].
Using VCSEL’s polarization behavior for random number generation was firstly proposed by Chizhevsky [52]. He experimentally demonstrated random bit generation of up to 2 Mbps by using the polarization bistable behavior arising in some of the PS in VCSELs [52]. Polarization bistability has also been used in subsequent theoretical analysis [53,54,56]. Although bistable operation is desirable for obtaining that, given a particular pulse, most of the total power is emitted in one of the two linearly polarized modes, it can be a drawback if we want to achieve unbiased operation of the QRNG (that is, equal probability for “0” and “1” generated bits). In fact, equal probability of occurrence of pulses with orthogonal polarizations has only been obtained for specific values of some internal laser parameters: the photon lifetime and the linear birefringence [54] or different fractions of spontaneous emission noise coupled to each polarization mode [53]. One simple way of obtaining similar probabilities of excitation of both linearly polarized modes was experimentally achieved by adjusting the modulation conditions and the sampling time in a VCSEL having PS under continuous wave operation [55]. This VCSEL has a very narrow bistable region, so bistable operation is not essential for generating random numbers when gain-switching this device [55]. In fact, a QRNG based on the random excitation of the linearly polarized modes of this gain-switched VCSEL was experimentally demonstrated [46]. In [46], we obtained a large random bit stream that, after appropriate post-processing, fully passed all tests in the standard test suite for RNGs provided by the National Institute of Standards and Technology (NIST) [57].
It has been shown that the laser substrate temperature has a large impact on the polarization properties of VCSELs, and in particular on the PS of VCSELs [50,51,58,59]. This is due to the large effect of the temperature on the laser parameters determining the VCSEL’s polarization, such as material gain, optical losses, effective dichroism, and nonlinear dichroism [50,51,58,59]. It is therefore expected that the temperature has a large impact on the probability of excitation of a linear polarization mode when gain-switching the VCSEL, affecting, then, the characteristics of QRNGs based on this system. In this paper, we perform a systematic experimental analysis of the effect of the temperature on the linear polarization mode emitted by the VCSEL when modulating the bias current from below to above the threshold value. Different modulation frequencies and amplitudes are considered in our analysis. We show that for low values of the temperature, the probability of excitation of a linearly polarized mode saturates to a constant value as the amplitude of the modulation increases. This extends our previous results obtained at larger temperatures in which that saturation was not observed [55]. We also identify modulation conditions and sampling times for which the distributions of the signals for each linearly polarized mode are approximately uniform. This situation is of interest because a minimum post-processing of the raw data when using the system for QRNG would be expected. Evaluation of the quality of the randomness of the numbers distributed in that way is performed by using NIST statistical test.
The paper is organized as follows. In Section 2 we describe the experimental setup and the device characterization. Section 3 is devoted to describing the dependence of the probability of excitation of a linearly polarized mode in gain-switched VCSELs on the temperature of the device. Finally, in Section 4, a discussion and a summary are presented.

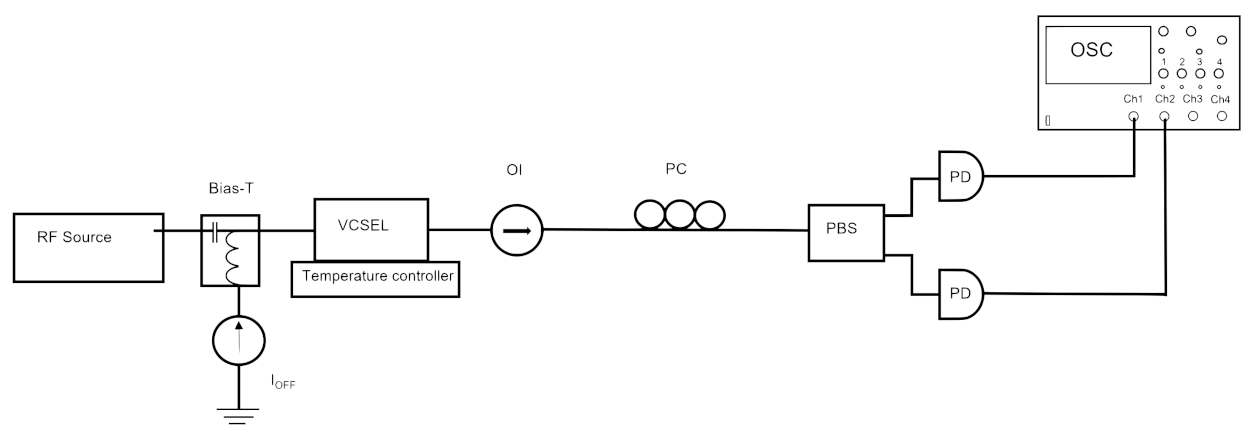
2. Experimental Setup and Device Characterization

The experimental setup is shown in Figure 1. A quantum-well long-wavelength (1550 nm) VCSEL (RayCan) is used in the experiments. The same device was used in [46,55]. The laser is mounted in a laser mount that includes a bias-tee. The VCSEL is gain-switched by applying a superposition of two electrical signals: a constant bias current ( I off ) and an RF square signal provided by a pulse pattern generator. The control of the temperature of the VCSEL is performed using a temperature controller. An optical isolator (OI) is used to minimize optical feedback effects in the laser. A polarization controller (PC) and a polarization beamsplitter (PBS) are used to separate the two linearly polarized modes of the VCSEL. Two fast-photodiodes (9 GHz bandwidth) are used to detect the signal corresponding to each linearly polarized mode. These signals are recorded in a real-time oscilloscope (13 GHz bandwidth) to obtain the temporal profiles of the power of each linearly polarized mode. A more detailed description of the elements of the setup can be found in [55].
The VCSEL operates in a single transverse and longitudinal mode over the whole bias current range. However, the emitted polarization changes when changing the bias current, as shown in Figure 2. This figure shows the polarization-resolved light–current curve for two different temperatures of the VCSEL. PS from the short-wavelength (labeled as y) to the long-wavelength (x) linearly polarized mode is observed for both temperatures. The optical frequency splitting between the y and the x linear polarizations is 29.8 GHz [55]. The current at which the PS is observed slightly decreases when increasing the temperature (from 6.81 mA at  T = 20 ° C to 6.73 mA at  T = 25 ° C).
Narrow polarization hysteresis cycles are observed: PS is observed at 6.38 mA and 6.50 mA when decreasing the bias current in Figure 2a,b, respectively. The width of bistable regions are 0.43 and 0.23 mA for  T = 20 ° C and  T = 25 ° C, respectively. The threshold current of the VCSEL,  I th , slightly increases with the temperature:  I th  changes from 2.39 mA ( T = 20 ° C) to 2.51 mA ( T = 25 ° C). In this work we will consider  I off = 0.92 I th , since a switch-off bias current value below the threshold is required for the VCSEL to operate as a QRNG.

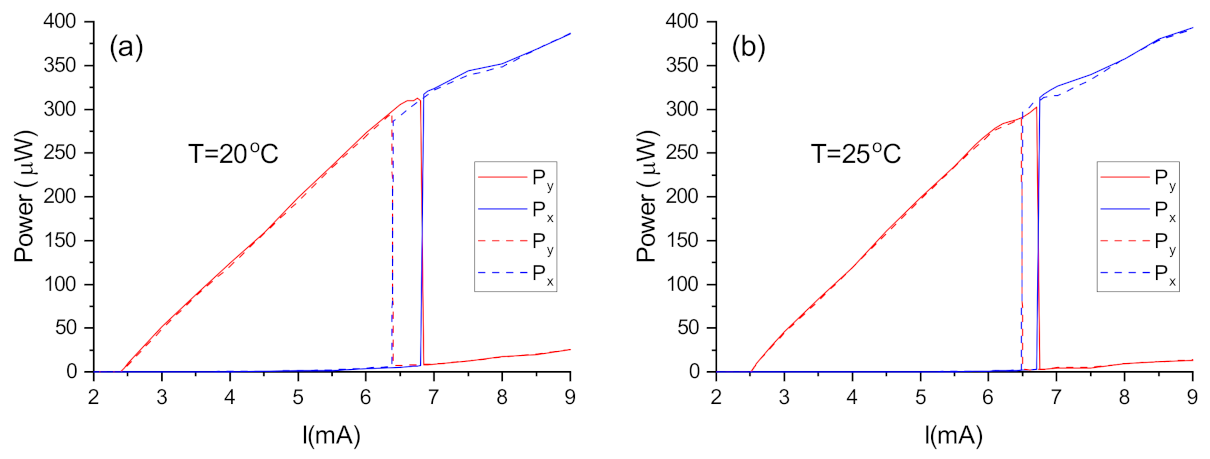
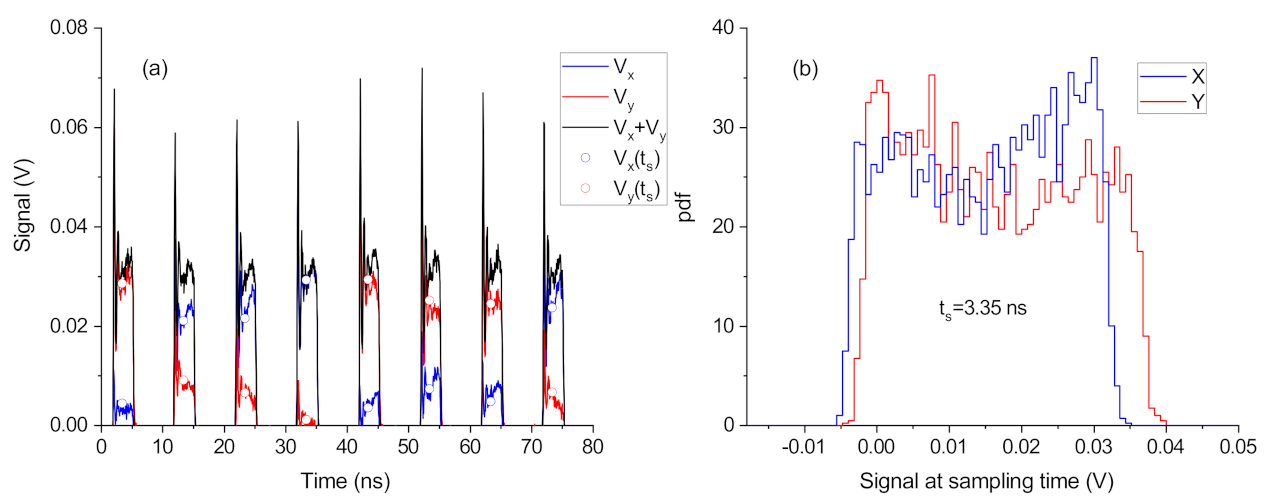
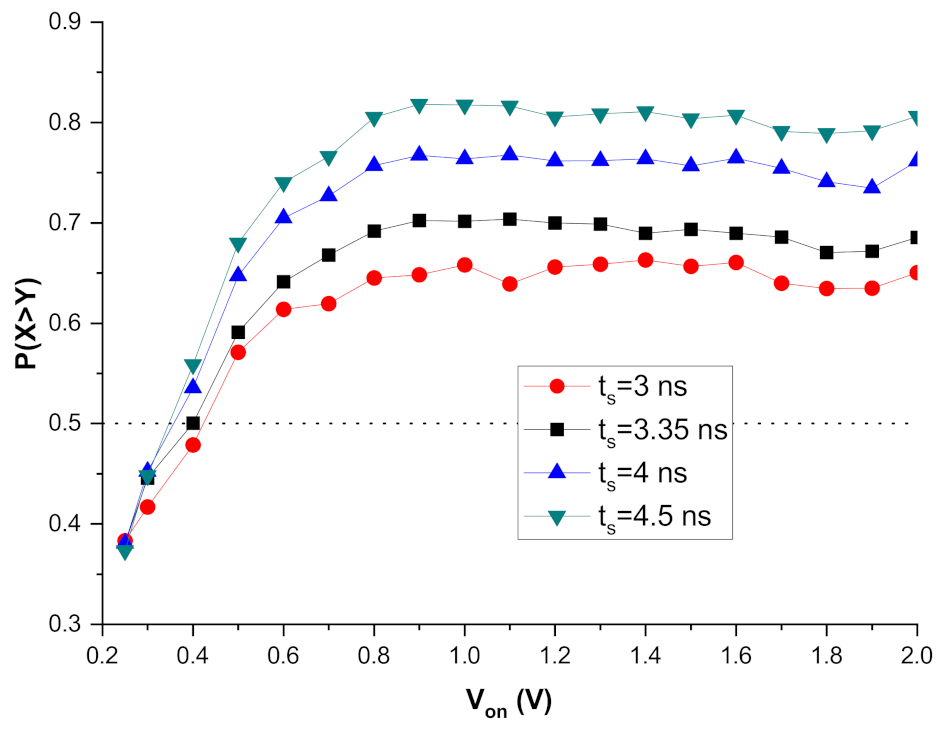
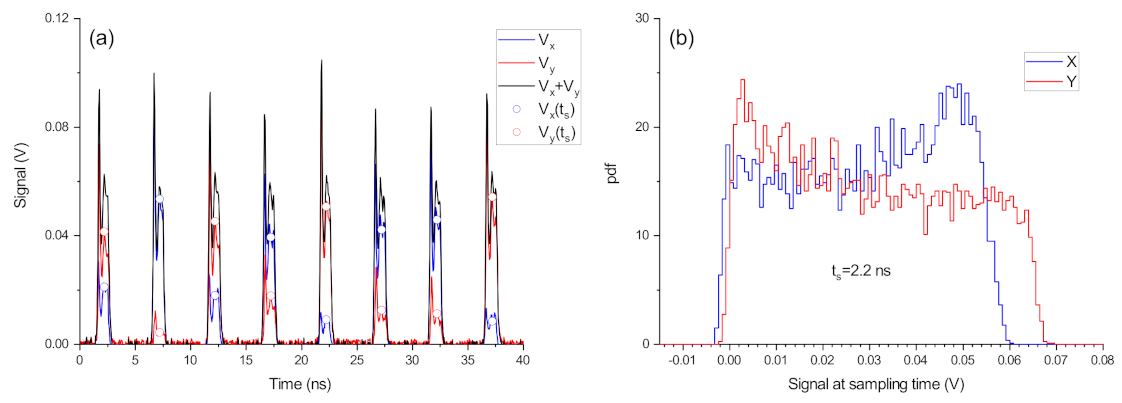
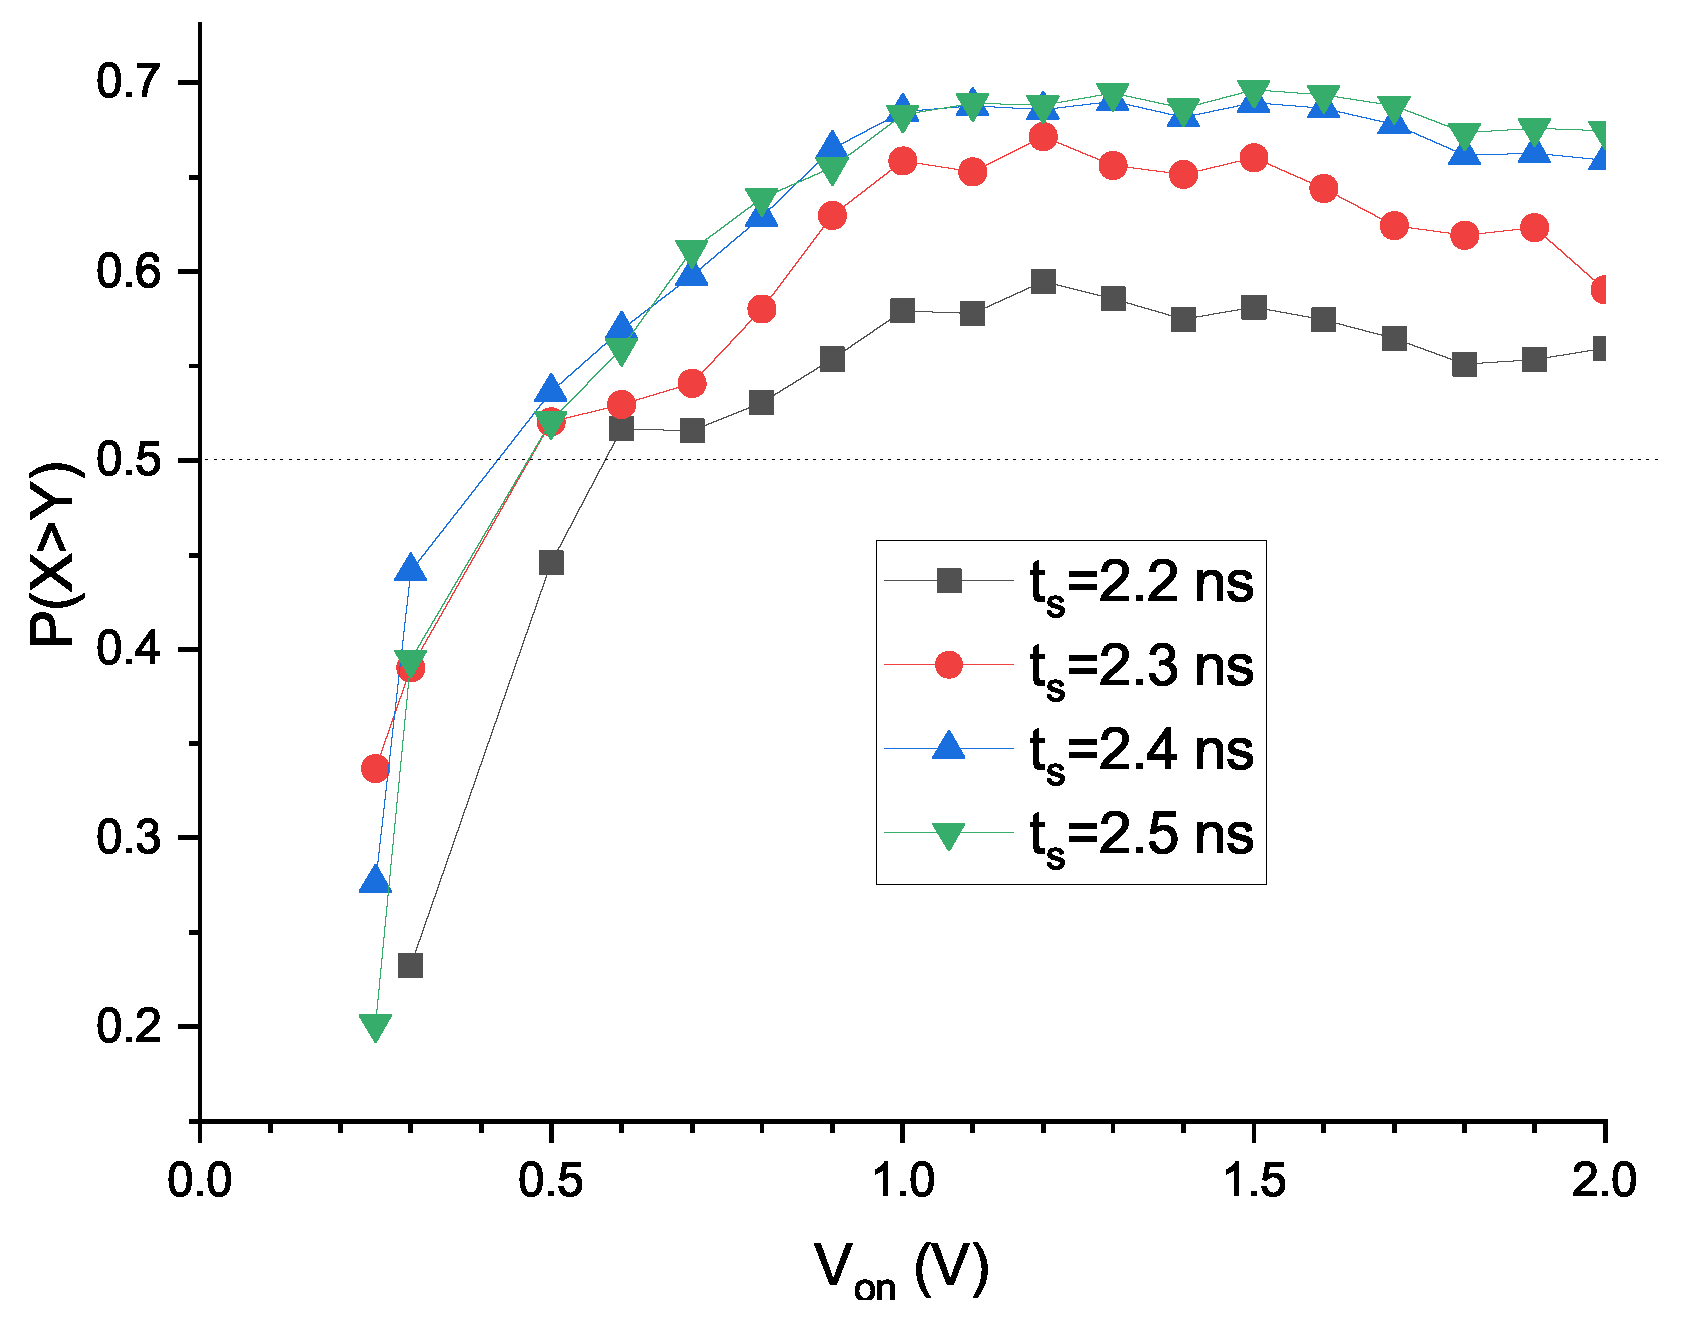
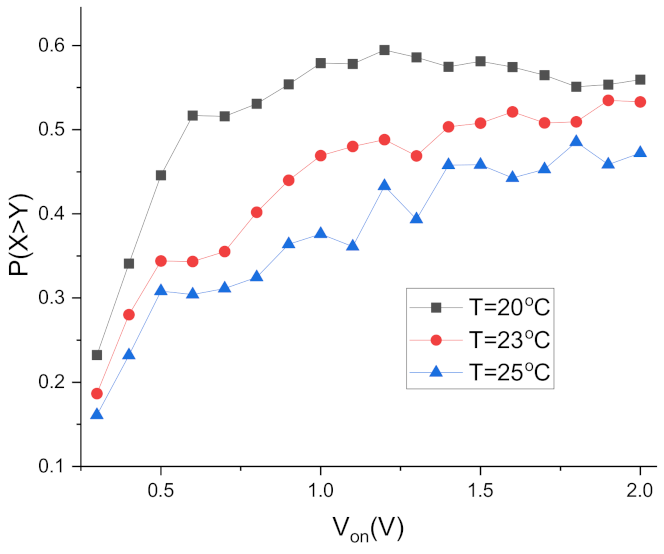
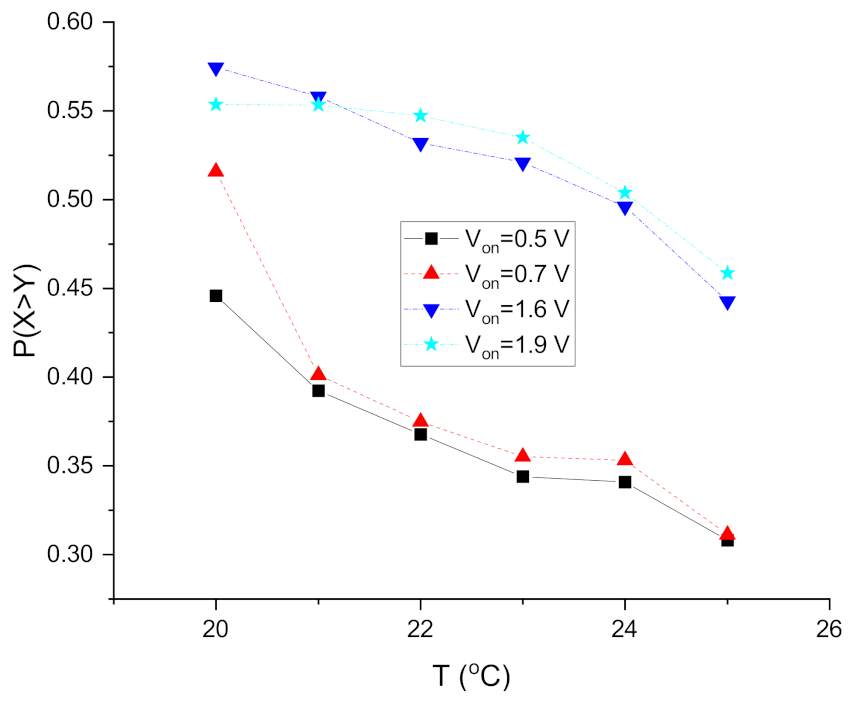
3. Experimental Results

A square wave modulation is applied to our VCSEL in which  I off  is below the threshold value during  P / 2 , and a voltage pulse of constant amplitude  V on  is applied during the rest of the period, P. The temporal waveforms of the x- and y-signals measured at the oscilloscope,  V x  and  V y , are shown in Figure 3a when the temperature is 20  ° C,  I off  = 2.2 mA,  V on  = 0.4 V. The modulation frequency,  f mod , is 100 MHz since P = 10 ns. The signal corresponding to the total power,  V x + V y , is also shown in the figure. The VCSEL switches off in all the periods in such a way that there is a random excitation of both linear polarization modes induced by spontaneous emission noise. The total power fluctuates much less than the individual linear polarizations [55,60]. One way of obtaining random numbers from the fluctuations of both linear polarizations is by regularly sampling the x- and y-signals at a sampling time,  t s , measured with respect to the beginning of each modulation cycle, that is, the time at which  V on  is applied ( t = 0  in the figure for the first cycle). In this way, for the m cycle, the signals are sampled at  t m = t s + m P , where m = 0, 1, … is an integer. We show in Figure 3a, with symbols, the signals sampled with  1 / P  frequency,  V x ( t s )  and  V y ( t s ) . The comparison between  V x ( t s )  and  V y ( t s )  is one way to determine the obtained random bit. We considered that if  V x ( t s ) > V y ( t s )  ( V x ( t s ) V y ( t s ) )  then we obtain a “0” (“1”) bit, similarly to [55].
Figure 3b shows the the probability density functions (pdfs) of the x- and y-polarized signals at  t s =  3.35 ns. These normalized histograms are obtained with  10 4  data. The temperature of the VCSEL is different to that considered in [55]. In addition, the modulation parameters and sampling time were chosen in order to obtain pdfs of  V x ( t s )  and  V y ( t s )  with a shape closer to that corresponding to a uniform distribution. This contrasts with the shapes obtained in [55] in which both pdfs had clear local maxima close to the maximum and minimum values of the signals in such a way that the probability of obtaining values in the central part of the histograms was low.
In order to analyze the effect of the temperature on our system, we consider the probability of excitation of the x-polarization,  P ( X > Y ) , as the probability of obtaining  V x ( t s ) > V y ( t s ) , that is, the probability of obtaining a “0” bit. As an example,  P ( X > Y ) = 0.501  for the case analyzed in Figure 3. In [55], we analyzed the dependence of  P ( X > Y )  on the amplitude of the voltage pulse. We found that  P ( X > Y )  increases with  V on  for the considered operation temperature,  T = 25 ° C. This is also shown in Figure 4, in which  P ( X > Y )  is shown as a function of  V on  for  T = 25 ° C. However, the situation changes when decreasing the value of T, as can be seen in Figure 4 for the case of  T = 20 ° C. After an initial increase of  P ( X > Y )  when  V on  is small, a clear saturation of the values of  P ( X > Y )  is obtained for a very wide range of values of  V on . We also note that the change of  P ( X > Y )  when the temperature changes in 5  ° C can be very large. For instance, for  V on = 0.6  V,  P ( X > Y )  decreases from 0.641 to 0.361 when T changes from 20  ° C to 25  ° C.
Figure 5 shows the histograms of the signals corresponding to both linear polarization modes at  t s =  3.35 ns for several values of  V on  when  T = 20 ° C. Figure 5 shows that for small values of  V on , both pdfs are close to those corresponding to uniform distributions. As  V on  increases, both pdfs evolve in such a way that the distribution corresponding to  V x ( t s )  develops a clear peak close to the maximum value of the signal, while the pdf of  V y ( t s )  develops a clear peak close to zero. Figure 5 shows that the shapes of both pdfs do not change significantly while 0.9 V  V on  1.8 V, which is precisely the region in which saturation is observed in Figure 4 for  T = 20 ° C. In fact, due to the small fluctuations of the total power,  V x ( t s ) + V y ( t s ) C , where C is constant for a given value of  V on . C increases from 0.075 V to 0.1 V when  V on  changes from 0.9 V to 1.8 V. In this way, we can write that  P ( X > Y ) = P ( V x ( t s ) > C / 2 ) , which remains constant in the range 0.9 V  V on  1.8 V, in this way explaining the region of saturation of  P ( X > Y )  in Figure 4.
The previous saturation behavior is also observed when changing the sampling time, as demonstrated in Figure 6. This behavior can be explained in a similar way to that reported in Figure 5 in terms of the evolution of the pdfs of  V x ( t s )  and  V y ( t s )  for different values of  t s  (not shown).
We now discuss the results obtained when increasing the pulse repetition frequency to 200 MHz, which corresponds to  P = 5  ns. Figure 7a shows the time traces corresponding to both linearly polarized modes when  T = 20 ° C,  f mod = 200  MHz, and  V on = 0.6  V. The random excitation of both polarization modes illustrated in Figure 7a is quantified in Figure 7b, where the histograms of  V x ( t s )  and  V y ( t s )  are plotted for  t s = 2.2  ns. As shown in Figure 3, the modulation parameters and  t s  were chosen in order to obtain pdfs of  V x ( t s )  and  V y ( t s )  with a shape close to that of a uniform distribution in such a way that  P ( X > Y )  = 0.517.
The dependence of  P ( X > Y )  on  V on  for several values of  t s  when  f mod = 200  MHz and the temperature is 20  ° C is shown in Figure 8. This figure shows that we obtain a similar qualitative behavior to that described in Figure 6 for a modulation frequency of 100 MHz. These similarities also appear when measuring  P ( X > Y )  as a function of  V on  for several values of the temperature, as shown in Figure 9. Again, a clear saturation behavior appears when  T = 20 ° C. In addition,  P ( X > Y )  increases in the considered  V on  range when  T = 25 ° C, similarly to the results included in Figure 4.
The dependence of  P ( X > Y )  on the temperature is analyzed in Figure 10 for several values of the amplitude of the modulation for the same conditions of Figure 9. This figure shows that the probability of excitation of the x-polarization decreases with the temperature. The reasons for this dependence are discussed in the next section.

4. Discussion and Summary

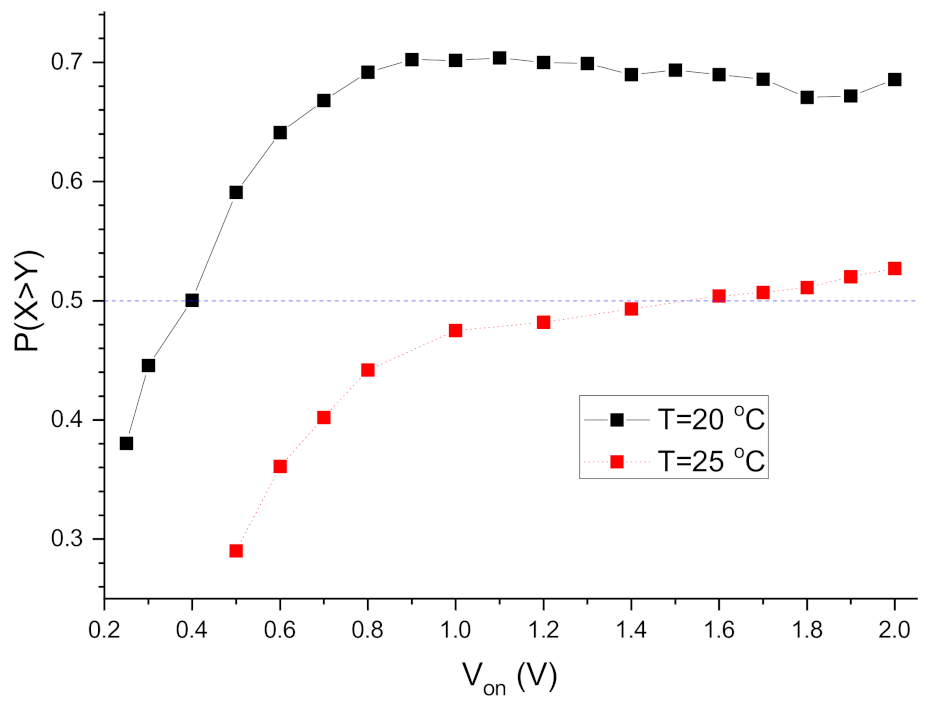
4.1. Discussion of Experimental Results

As discussed in the introduction, we expected to observe a significant effect of the temperature on the probability of excitation of a linearly polarizated mode when gain-switching the VCSEL, as the temperature of the device has a large impact on its polarization properties [50,51,58,59]. This is precisely what we observed in our measurements. In addition, we showed in Figure 10 that the probability of excitation of the x-polarized mode decreases with the temperature. This dependence can be explained by considering the dependence of the effective dichroism,  γ 0 , on the temperature. Our VCSEL has a Type I PS (from the shorter to the longer optical wavelength) [51] similar to those observed in [59,61] for similar devices. We recently showed that the experimental dependence of  P ( X > Y )  on  V on  is theoretically well described with the model of [61] only when a dependence of the effective dichroism on the bias current, I, is considered [62]. This dependence has been experimentally observed [59,61] in such a way that it is approximately linear around the PS current. Wetheoretically obtained that  P ( X > Y )  decreases when  d γ 0 / d I  decreases [62]. We experimentally observed that  d γ 0 / d I  decreases from −660 MHz/mA to −980 MHz/mA when increasing the temperature from  T = 15 ° C [59] to  T = 25 ° C [61], respectively. This explains why  P ( X > Y )  decreases with the temperature.
The dependence of  P ( X > Y )  on the pump current at a given  t s  can be explained as follows. The usual situation is that  P ( X > Y )  increases with the bias current because the x-polarized mode is favored as the current increases, as seen in Figure 2. This is, for instance, the situation observed in Figure 4 for  T = 25 ° C. A good agreement between experiments and theory is found at that temperature when we consider in the model a linear dichroism,  γ a , that decreases linearly with the bias current [62]. This situation is found in experiments for a similar device at the same temperature in the range of currents where polarization switching is observed [61]. The detailed dependence of  γ a  on the current is therefore essential in determining  P ( X > Y ) . A possible explanation for the saturation observed at  T = 20 ° C of  P ( X > Y )  as the current increases is that  γ a  reaches a constant value in the saturation region since we theoretically obtained that  P ( X > Y )  changes only slightly with the current when  γ a  is independent of the current [62]. This could be experimentally confirmed by measuring the dependence of  γ a  on the current at  T = 20 ° C following the procedure explained in [61].
Since the considered modulation frequencies are well below the small signal modulation bandwidth of the VCSEL, we used the V–I curve to relate the values of  V on  to the value of the current when  V on  is applied,  I on  [55,62].
The dependence of  P ( X > Y )  on  t s  at a given pump current appears because random bits are obtained in each period before the steady state is reached. We proceeded in this way in order to obtain situations in which  P ( X > Y )  is close to 0.5 at high modulation frequencies. As mentioned above, the detailed dependence of  P ( X > Y )  on  t s  can be described when considering the dependence of the linear birefringence on the injected current in a rate equation model. High frequencies have been considered for obtaining fast bit rates. The situation would change if much smaller modulation frequencies are considered in such a way that the VCSEL is able to reach the steady state. For the VCSEL considered in this work, in which the bistable region is very narrow, if  V on  is large enough for the x-polarization to be the only one that emits with non-negligible power,  P ( X > Y )  would be close to 1 if  t s  is chosen when the laser has reached the steady state. In this case, no dependence would be observed on  t s , but the VCSEL would not be useful to generate random numbers. At these low frequencies, using VCSELs with large bistable regions, as suggested in [52,53,54,56], is more interesting because  P ( X > Y )  has an intermediate value between 0 and 1 that is independent of  t s , providing that the steady state has been reached. Future work is planned in this direction.

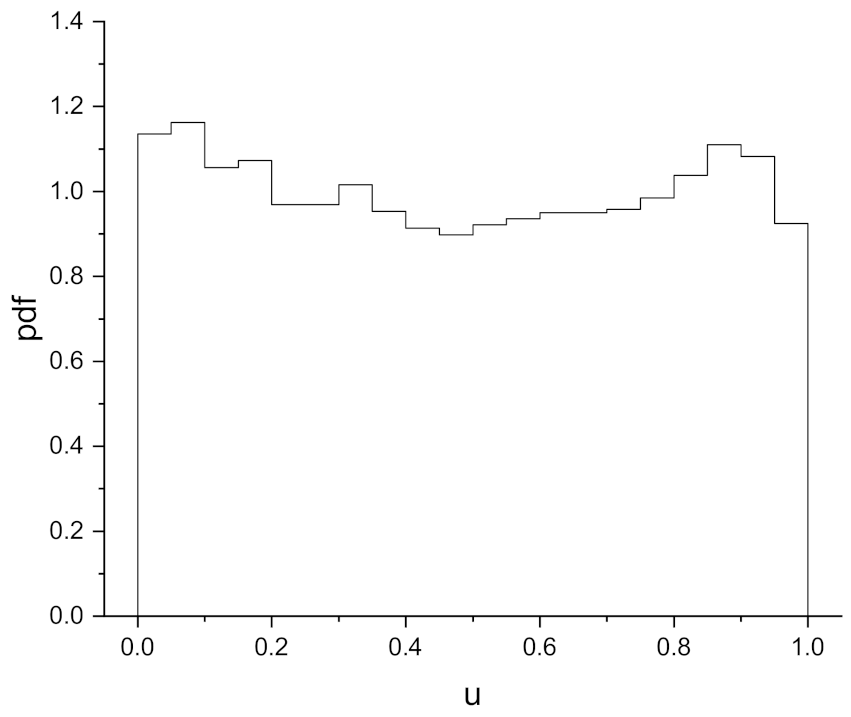
4.2. Digitization and Post-Processing of the Data

Post-processing is necessary in RNGs because raw outputs of physical generators show deviations from the mathematical ideal of statistically independent and uniformly distributed bits [14,15]. We showed, in [46], that post-processing of the complete set of raw bits was required in order to fully pass the NIST tests. We now propose a method of obtaining the raw bits that is different to those described in [46,55]. Using this new method, the post-processing is greatly reduced. The method is based on choosing the situations for which the distributions of  V x ( t s )  and  V y ( t s )  are approximately uniform. Some examples have been already identified: Figure 3 and Figure 5 for  V on  = 0.3 V, and Figure 7. The method consists of obtaining random numbers, u, between 0 and 1 in the following way. We consider  V x , 2  ( V x , 1 ) as a value that is slightly smaller (larger) than the maximum (minimum) value of  V x ( t s ) . If  V x , 1 < V x ( t s ) < V x , 2 , we calculate  u = V x ( t s ) / ( V x , 2 V x , 1 ) ; otherwise, we do not use  V x ( t s )  to calculate u. We also obtain u numbers from  V y ( t s ) , exchanging x for y in the previous expressions.
The results of this procedure are shown in Figure 11, where the pdf corresponding to the u-values obtained from the data of Figure 7 is shown. In obtaining this figure, we used  ( V x , 1 , V x , 2 ) = ( 0.00076 , 0.054 ) ( V y , 1 , V y , 2 ) = ( 0.00016 , 0.065 ) 10 4  values of  V x ( t s ) , and  10 4  values of  V y ( t s ) . In this way, 19,236 u-values were used to plot the histogram of Figure 11 (only 3.8% of the data were discarded). Figure 11 shows that the distribution of u-values is approximately uniform. We obtained digital bits from the u-data by converting the integer part of  u 2 27  into a binary number. In this way, we obtained 519,372 bits. Defining the bias, e, as  e = p ( 0 ) 1 / 2 , where  p ( 0 )  is the probability of obtaining a “0” bit in the string, we obtained  e = 3.44 × 10 4  for our data.
Table 1 shows the results obtained with the NIST statistical test applied to our bit string. Each test was performed using 519 sequences of 1000 bits, each with a statistical significance level  α = 0.01 . If the bits are random, mean p-values must be close to 0.5 and the proportions of sequences that pass the test must be in the interval [0.9768, 1] [57]. Table 1 shows that our bits are sufficiently random for passing the considered statistical test of NIST. We did not consider all the NIST test because our bit number was small. In this way, we only calculated the proportions of sequences for those tests that can work with short bit strings. Our results try to demonstrate that certain levels of randomness can be achieved when directly using the raw data and a minimum level of post-processing. In our case, the post-processing consisted just of evaluating if the raw data were in a certain interval. For our bit string, we obtained a high accepted bit rate of 96.2%.
Our number of bits was small so the question of whether all the NIST tests are fully passed with sufficient number of data still remains. We showed in this paper that the probability of excitation of a linear polarization significantly depends on the VCSEL temperature. This means that some bias can appear due to unwanted and slight variations of the temperature. The situation is similar with respect to slight variations of the modulation parameters. Taking into account that uniform distributions such as those observed in Figure 3, Figure 5, and Figure 7 only appear for rather specific values of parameters such as the applied current, temperature, and sampling time, we would expect that NIST tests could be only fully passed if a large stability of those parameters over long periods of operation is achieved. We note that NIST tests were not fully passed when using low-bias raw bits obtained with a different method [46]. In the same way, we would expect the same result with the method proposed in this section. Regardless, usual post-processing of the raw bits can be applied for fully passing the NIST test, as carried out in [46,56]. In any case, we remark that passing the NIST test is not a confirmation of true randomness or “quantumness”. There is, however, an advantage of obtaining random bits as we achieved in this section. The bit rate obtained, 10.4 Gbps ( 2 × 27 × 2 · 10 8 × 0.962 , corresponding to the number of polarizations, bits/data,  f m o d , and accepted bit rate, respectively) is larger than 0.1–0.2 Gbps in [46,55], in which only one bit per period was obtained.
The method described in this work to obtain a uniform pdf is not a randomness extractor. The random bits obtained in this way can be used in Monte Carlo simulations. The use of these bits for cryptographic purposes would require further post-processing, for instance, such as that performed in [56]. We note that the choice of a uniform distribution density of the raw sequence may not be the best choice for cryptographic applications. The probability of intermediate values of the signal is appreciable, the proportion of pulses affected by classical (nonquantum) noises of the detector can be significative, and “0”-s and “1”-s resulting from the digitization of such pulses can be considered as “untrusted” bits [56]. The quantum reduction factor, which contains information on the amount of classical noise falling into the digitized random sequence due to fluctuations in the photodetector [56], would increase. The value of the quantum reduction factor also determines how much the raw random sequence should be “compressed” using a randomness extractor [56]. A better choice to -decrease the quantum reduction factor would be using pdfs with two well-defined maxima, similar to those obtained in [55], for a better operation of the VCSEL in the context of QRNG [56]. Future work will be devoted to measurements using VCSELs with a large polarization bistable region for which a small quantum reduction factor is expected. In any case, post-processing of the raw bits is required for cryptographic applications. For instance, a combination of an FIR-filtering method [38,56] with random Boolean Toeplitz matrices was recently proposed in [56].
In summary, we experimentally analyzed the effect of the temperature on the probability of excitation of a linearly polarized mode when gain-switching the VCSEL. We showed that this probability significantly depends on the value of the temperature of the device. We also showed that for low values of the temperature, the probability of excitation saturates to a constant value as the amplitude of the modulation increases. We identified situations in which the distributions of the linearly polarized signals at a sampling time are approximately uniform. For these situations, we discussed the randomness of our data by using the NIST statistical test.

Funding

This research was funded by Ministerio de Ciencia e Innovación, Spain, under grant PID2021-123459OB-C22 MICN/AEI/10.13039/501100011033/FEDER, UE. A. Quirce acknowledges financial support from Beatriz Galindo program, Ministerio de Ciencia, Innovación y Universidades (Spain).

Conflicts of Interest

The authors declare no conflict of interest.

Abbreviations

The following abbreviations are used in this manuscript:
QRNGQuantum random number generation
QKDQuantum key distribution
VCSELVertical-cavity surface-emitting laser
PDFProbability density function
RNGRandom number generation
RFRadio frequency
PSPolarization switching
NISTNational Institute of Standards and Technology

References

  1. Lax, M. Quantum noise. IV. Quantum theory of noise sources. Phys. Rev. 1966, 145, 110. [Google Scholar] [CrossRef]
  2. Lax, M.; Louisell, W. Quantum noise. XII. Density-operator treatment of field and population fluctuations. Phys. Rev. 1969, 185, 568. [Google Scholar] [CrossRef]
  3. Risken, H. Fokker-Planck equation. In The Fokker-Planck Equation; Springer: Berlin/Heidelberg, Germany, 1996. [Google Scholar]
  4. Henry, C.H.; Kazarinov, R.F. Quantum noise in photonics. Rev. Mod. Phys. 1996, 68, 801. [Google Scholar] [CrossRef]
  5. Arecchi, F.; Degiorgio, V.; Querzola, B. Time-dependent statistical properties of the laser radiation. Phys. Rev. Lett. 1967, 19, 1168. [Google Scholar] [CrossRef]
  6. Coldren, L.A.; Corzine, S.W.; Mashanovitch, M.L. Diode Lasers and Photonic Integrated Circuits; John Wiley & Sons: Hoboken, NJ, USA, 2012; Volume 218. [Google Scholar]
  7. Agrawal, G.P.; Dutta, N.K. Semiconductor Lasers; Springer Science & Business Media: Berlin/Heidelberg, Germany, 2013. [Google Scholar]
  8. Henry, C. Phase noise in semiconductor lasers. J. Light. Technol. 1986, 4, 298–311. [Google Scholar] [CrossRef]
  9. Balle, S.; De Pasquale, F.; Abraham, N.; San Miguel, M. Statistics of the transient frequency modulation in the switch-on of a single-mode semiconductor laser. Phys. Rev. A 1992, 45, 1955. [Google Scholar] [CrossRef]
  10. Spano, P.; D’Ottavi, A.; Mecozzi, A.; Daino, B. Experimental observation of time jitter in semiconductor laser turn-on. Appl. Phys. Lett. 1988, 52, 2203–2204. [Google Scholar] [CrossRef]
  11. Mecozzi, A.; Piazzolla, S.; D’Ottavi, A.; Spano, P. Passage time statistics in semiconductor laser turn on. Phys. Rev. A 1988, 38, 3136. [Google Scholar] [CrossRef]
  12. Obermann, K.; Kindt, S.; Petermann, K. Turn-on jitter in zero-biased single-mode semiconductor lasers. IEEE Photonics Technol. Lett. 1996, 8, 31–33. [Google Scholar] [CrossRef]
  13. Mecozzi, A.; Sapia, A.; Spano, P.; Agrawal, G.P. Transient multimode dynamics in nearly single-mode lasers. IEEE J. Quantum Electron. 1991, 27, 332–343. [Google Scholar] [CrossRef]
  14. Stipčević, M.; Koç, Ç.K. True random number generators. In Open Problems in Mathematics and Computational Science; Springer: Berlin/Heidelberg, Germany, 2014; pp. 275–315. [Google Scholar]
  15. Herrero-Collantes, M.; Garcia-Escartin, J.C. Quantum random number generators. Rev. Mod. Phys. 2017, 89, 015004. [Google Scholar] [CrossRef]
  16. Mannalath, V.; Mishra, S.; Pathak, A. A comprehensive review of quantum random number generators: Concepts, classification and the origin of randomness. arXiv 2022, arXiv:2203.00261. [Google Scholar]
  17. Lucamarini, M.; Yuan, Z.L.; Dynes, J.F.; Shields, A.J. Overcoming the rate–distance limit of quantum key distribution without quantum repeaters. Nature 2018, 557, 400–403. [Google Scholar] [CrossRef]
  18. Bhaskar, M.K.; Riedinger, R.; Machielse, B.; Levonian, D.S.; Nguyen, C.T.; Knall, E.N.; Park, H.; Englund, D.; Lončar, M.; Sukachev, D.D.; et al. Experimental demonstration of memory-enhanced quantum communication. Nature 2020, 580, 60–64. [Google Scholar] [CrossRef] [PubMed]
  19. Xie, Y.M.; Lu, Y.S.; Weng, C.X.; Cao, X.Y.; Jia, Z.Y.; Bao, Y.; Wang, Y.; Fu, Y.; Yin, H.L.; Chen, Z.B. Breaking the rate-loss bound of quantum key distribution with asynchronous two-photon interference. PRX Quantum 2022, 3, 020315. [Google Scholar] [CrossRef]
  20. Clivati, C.; Meda, A.; Donadello, S.; Virzì, S.; Genovese, M.; Levi, F.; Mura, A.; Pittaluga, M.; Yuan, Z.; Shields, A.J.; et al. Coherent phase transfer for real-world twin-field quantum key distribution. Nat. Commun. 2022, 13, 157. [Google Scholar] [CrossRef]
  21. Gu, J.; Cao, X.Y.; Fu, Y.; He, Z.W.; Yin, Z.J.; Yin, H.L.; Chen, Z.B. Experimental measurement-device-independent type quantum key distribution with flawed and correlated sources. Sci. Bull. 2022, 67, 2167–2175. [Google Scholar] [CrossRef]
  22. Yin, H.L.; Fu, Y.; Li, C.L.; Weng, C.X.; Li, B.H.; Gu, J.; Lu, Y.S.; Huang, S.; Chen, Z.B. Experimental quantum secure network with digital signatures and encryption. Natl. Sci. Rev. 2022, nwac228. [Google Scholar] [CrossRef]
  23. Paraïso, T.K.; Woodward, R.I.; Marangon, D.G.; Lovic, V.; Yuan, Z.; Shields, A.J. Advanced Laser Technology for Quantum Communications (Tutorial Review). Adv. Quantum Technol. 2021, 4, 2100062. [Google Scholar] [CrossRef]
  24. Shalm, L.K.; Zhang, Y.; Bienfang, J.C.; Schlager, C.; Stevens, M.J.; Mazurek, M.D.; Abellán, C.; Amaya, W.; Mitchell, M.W.; Alhejji, M.A.; et al. Device-independent randomness expansion with entangled photons. Nat. Phys. 2021, 17, 452–456. [Google Scholar] [CrossRef]
  25. Liu, W.B.; Lu, Y.S.; Fu, Y.; Huang, S.C.; Yin, Z.J.; Jiang, K.; Yin, H.L.; Chen, Z.B. Source-independent quantum random number generator against tailored detector blinding attacks. Opt. Express 2023, 31, 11292–11307. [Google Scholar] [CrossRef]
  26. Jennewein, T.; Achleitner, U.; Weihs, G.; Weinfurter, H.; Zeilinger, A. A fast and compact quantum random number generator. Rev. Sci. Instrum. 2000, 71, 1675–1680. [Google Scholar] [CrossRef]
  27. Stipčević, M.; Rogina, B.M. Quantum random number generator based on photonic emission in semiconductors. Rev. Sci. Instrum. 2007, 78, 045104. [Google Scholar] [CrossRef] [PubMed]
  28. Wei, W.; Guo, H. Bias-free true random-number generator. Opt. Lett. 2009, 34, 1876–1878. [Google Scholar] [CrossRef]
  29. Fürst, H.; Weier, H.; Nauerth, S.; Marangon, D.G.; Kurtsiefer, C.; Weinfurter, H. High speed optical quantum random number generation. Opt. Express 2010, 18, 13029–13037. [Google Scholar] [CrossRef]
  30. Durt, T.; Belmonte, C.; Lamoureux, L.P.; Panajotov, K.; Van den Berghe, F.; Thienpont, H. Fast quantum-optical random-number generators. Phys. Rev. A 2013, 87, 022339. [Google Scholar] [CrossRef]
  31. Guo, H.; Tang, W.; Liu, Y.; Wei, W. Truly random number generation based on measurement of phase noise of a laser. Phys. Rev. E 2010, 81, 051137. [Google Scholar] [CrossRef]
  32. Shen, Y.; Tian, L.; Zou, H. Practical quantum random number generator based on measuring the shot noise of vacuum states. Phys. Rev. A 2010, 81, 063814. [Google Scholar] [CrossRef]
  33. Qi, B.; Chi, Y.M.; Lo, H.K.; Qian, L. High-speed quantum random number generation by measuring phase noise of a single-mode laser. Opt. Lett. 2010, 35, 312–314. [Google Scholar] [CrossRef]
  34. Jofre, M.; Curty, M.; Steinlechner, F.; Anzolin, G.; Torres, J.; Mitchell, M.; Pruneri, V. True random numbers from amplified quantum vacuum. Opt. Express 2011, 19, 20665–20672. [Google Scholar] [CrossRef]
  35. Argyris, A.; Pikasis, E.; Deligiannidis, S.; Syvridis, D. Sub-Tb/s physical random bit generators based on direct detection of amplified spontaneous emission signals. J. Light. Technol. 2012, 30, 1329–1334. [Google Scholar] [CrossRef]
  36. Xu, F.; Qi, B.; Ma, X.; Xu, H.; Zheng, H.; Lo, H.K. Ultrafast quantum random number generation based on quantum phase fluctuations. Opt. Express 2012, 20, 12366–12377. [Google Scholar] [CrossRef] [PubMed]
  37. Abellán, C.; Amaya, W.; Jofre, M.; Curty, M.; Acín, A.; Capmany, J.; Pruneri, V.; Mitchell, M. Ultra-fast quantum randomness generation by accelerated phase diffusion in a pulsed laser diode. Opt. Express 2014, 22, 1645–1654. [Google Scholar] [CrossRef]
  38. Yuan, Z.; Lucamarini, M.; Dynes, J.; Fröhlich, B.; Plews, A.; Shields, A. Robust random number generation using steady-state emission of gain-switched laser diodes. Appl. Phys. Lett. 2014, 104, 261112. [Google Scholar] [CrossRef]
  39. Nie, Y.Q.; Huang, L.; Liu, Y.; Payne, F.; Zhang, J.; Pan, J.W. The generation of 68 Gbps quantum random number by measuring laser phase fluctuations. Rev. Sci. Instrum. 2015, 86, 063105. [Google Scholar] [CrossRef] [PubMed]
  40. Abellan, C.; Amaya, W.; Domenech, D.; Muñoz, P.; Capmany, J.; Longhi, S.; Mitchell, M.W.; Pruneri, V. Quantum entropy source on an InP photonic integrated circuit for random number generation. Optica 2016, 3, 989–994. [Google Scholar] [CrossRef]
  41. Marangon, D.G.; Plews, A.; Lucamarini, M.; Dynes, J.F.; Sharpe, A.W.; Yuan, Z.; Shields, A.J. Long-term test of a fast and compact quantum random number generator. J. Light. Technol. 2018, 36, 3778–3784. [Google Scholar] [CrossRef]
  42. Septriani, B.; de Vries, O.; Steinlechner, F.; Gräfe, M. Parametric study of the phase diffusion process in a gain-switched semiconductor laser for randomness assessment in quantum random number generator. AIP Adv. 2020, 10, 055022. [Google Scholar] [CrossRef]
  43. Shakhovoy, R.; Sych, D.; Sharoglazova, V.; Udaltsov, A.; Fedorov, A.; Kurochkin, Y. Quantum noise extraction from the interference of laser pulses in an optical quantum random number generator. Opt. Express 2020, 28, 6209–6224. [Google Scholar] [CrossRef]
  44. Shakhovoy, R.; Sharoglazova, V.; Udaltsov, A.; Duplinskiy, A.; Kurochkin, V.; Kurochkin, Y. Influence of Chirp, Jitter, and Relaxation Oscillations on Probabilistic Properties of Laser Pulse Interference. IEEE J. Quantum Electron. 2021, 57, 1–7. [Google Scholar] [CrossRef]
  45. Lovic, V.; Marangon, D.G.; Lucamarini, M.; Yuan, Z.; Shields, A.J. Characterizing Phase Noise in a Gain-Switched Laser Diode for Quantum Random-Number Generation. Phys. Rev. Appl. 2021, 16, 054012. [Google Scholar] [CrossRef]
  46. Valle-Miñón, M.; Quirce, A.; Valle, A.; Gutiérrez, J. Quantum random number generator based on polarization switching in gain-switched VCSELs. Opt. Contin. 2022, 1, 2156–2166. [Google Scholar] [CrossRef]
  47. Alarcón, A.; Argillander, J.; Spegel-Lexne, D.; Xavier, G. Dynamic generation of photonic spatial quantum states with an all-fiber platform. Opt. Express 2023, 31, 10673–10683. [Google Scholar] [CrossRef]
  48. Loudon, R. The Quantum Theory of Light; OUP Oxford: Oxford, UK, 2000. [Google Scholar]
  49. Aldama, J.; Sarmiento, S.; Etcheverry, S.; Valivarthi, R.; Grande, I.L.; Vidarte, L.T.; Pruneri, V. Small-form-factor Gaussian-modulated coherent-state transmitter for CV-QKD using a gain-switched DFB laser. Opt. Express 2023, 31, 5414–5425. [Google Scholar] [CrossRef]
  50. Choquette, K.D.; Schneider, R.P.; Lear, K.L.; Leibenguth, R.E. Gain-dependent polarization properties of vertical-cavity lasers. IEEE J. Sel. Top. Quantum Electron. 1995, 1, 661–666. [Google Scholar] [CrossRef]
  51. Michalzik, R. VCSELs: Fundamentals, Technology and Applications of Vertical-Cavity Surface-Emitting Lasers; Springer: Berlin/Heidelberg, Germany, 2012; Volume 166. [Google Scholar]
  52. Chizhevsky, V. Bistable vertical cavity laser with periodic pump modulation as a random bits generator. Opt. Spectrosc. 2010, 108, 343–346. [Google Scholar] [CrossRef]
  53. Zhao, J.; Li, P.; Zhang, X.; Gao, Z.; Jia, Z.; Bogris, A.; Shore, K.A.; Wang, Y. Fast all-optical random number generator. arXiv 2022, arXiv:2201.07616. [Google Scholar]
  54. Shakhovoy, R.; Maksimova, E.; Sharoglazova, V.; Puplauskis, M.; Kurochkin, Y. Fast and compact VCSEL-based quantum random number generator. J. Phys. Conf. Ser. 2021, 1984, 012005. [Google Scholar] [CrossRef]
  55. Quirce, A.; Valle, A. Random polarization switching in gain-switched VCSELs for quantum random number generation. Opt. Express 2022, 30, 10513–10527. [Google Scholar] [CrossRef]
  56. Shakhovoy, R.; Maksimova, E. Gain-switched VCSEL as a quantum entropy source: The problem of quantum and classical noise. St. Petersburg Polythechnic Univ. J. Phys. Math. 2022, 15, 201–205. [Google Scholar]
  57. Rukhin, A.; Soto, J.; Nechvatal, J.; Smid, M.; Barker, E.; Leigh, S.; Levenson, M.; Vangel, M.; Banks, D.; Heckert, A.; et al. NIST Special Publication 800-22: A statistical test suite for the validation of random number generators and pseudo random number generators for cryptographic applications. NIST Spec. Publ. 2010, 800, 22. [Google Scholar]
  58. Ryvkin, B.; Georgievski, A. Effect of photon-energy-dependent loss and gain mechanisms on polarization switching in vertical-cavity surface-emitting lasers. JOSA B 1999, 16, 2106–2113. [Google Scholar] [CrossRef]
  59. Quirce, A.; Valle, A.; Pesquera, L.; Thienpont, H.; Panajotov, K. Measurement of temperature-dependent polarization parameters in long-wavelength VCSELs. IEEE J. Sel. Top. Quantum Electron. 2015, 21, 636–642. [Google Scholar] [CrossRef]
  60. Valle, A.; Sciamanna, M.; Panajotov, K. Irregular pulsating polarization dynamics in gain-switched vertical-cavity surface-emitting lasers. IEEE J. Quantum Electron. 2008, 44, 136–143. [Google Scholar] [CrossRef]
  61. Pérez, P.; Valle, A.; Pesquera, L. Polarization-resolved characterization of long-wavelength vertical-cavity surface-emitting laser parameters. J. Opt. Soc. Am. B 2014, 31, 2574–2580. [Google Scholar] [CrossRef]
  62. Quirce, A.; Valle, A.; Valle-Miñón, M.; Gutiérrez, J. Characterizing polarization switching in gain-switched vertical-cavity surface-emitting lasers for quantum random number generation. In Proceedings of the European Quantum Electronics Conference, Virtual, 26–30 June 2023; p. EB-P.8. [Google Scholar]
Figure 1. Experimental setup. OI: optical isolator, PC: polarization controller, PBS: polarization beam splitter, PD: photodetector, OSC: oscilloscope.
Photonics 10 00474 g001
Figure 2. Polarization-resolved light–current characteristics when increasing (solid lines) and decreasing the current (dashed lines) for a temperature of (a) 20  ° C and (b) 25  ° C.
Photonics 10 00474 g002
Figure 3. (a) Time traces of the signals corresponding to the x-polarization (blue line), y-polarization (red line), and total power (black line). The signals at the sampling time, 3.35 ns, are also plotted with symbols. (b) Histograms of x and y signals at the sampling time. In this figure,  T = 20 ° C,  f mod = 100  MHz,  V on = 0.4  V, and  I off = 2.2  mA.
Photonics 10 00474 g003
Figure 4. Probability of excitation of the x-polarization as a function of  V on  for two different values of the temperature. In this figure,  f mod = 100  MHz,  I off = 0.92 I th , and  t s = 3.35  ns.
Photonics 10 00474 g004
Figure 5. Histograms of the signals corresponding to (a) x- and (b) y-polarizations at the sampling time for several values of  V on . In this figure,  T = 20 ° C,  f mod = 100  MHz,  I off = 2.2  mA, and  t s = 3.35  ns.
Photonics 10 00474 g005
Figure 6. Probability of excitation of the x-polarization as a function of  V on  for different values of the sampling time. In this figure,  T = 20 ° C,  f mod = 100  MHz, and  I off = 2.2  mA.
Photonics 10 00474 g006
Figure 7. (a) Time traces of the signals corresponding to the x-polarization (blue line), y-polarization (red line), and total power (black line). (b) Histograms of x and y signals at the sampling time. The signals at the sampling time are plotted with circles. In this figure,  T = 20 ° C,  f mod = 200  MHz,  V on = 0.6  V,  I off = 2.2  mA, and  t s = 2.2  ns.
Photonics 10 00474 g007
Figure 8. Probability of excitation of the x-polarization as a function of  V on  for different values of the sampling time. In this figure,  T = 20 ° C,  f mod = 200  MHz, and  I off = 2.2  mA.
Photonics 10 00474 g008
Figure 9. Probability of excitation of the x-polarization as a function of  V on  for different values of the temperature. In this figure,  f mod = 200  MHz,  I off = 0.92 I th , and  t s = 2.2  ns.
Photonics 10 00474 g009
Figure 10. Probability of excitation of the x-polarization as a function of the temperature for different values of  V on . In this figure,  f mod = 200  MHz,  I off = 0.92 I th , and  t s = 2.2  ns.
Photonics 10 00474 g010
Figure 11. Normalized histogram of data corresponding to Figure 7b.
Photonics 10 00474 g011
Table 1. Output of NIST test.
TestMean p-ValueProportion Pass
Frequency0.4790.985
Block frequency0.4900.992
Run0.4880.990
Longest run0.4860.990
DFT0.4900.979
Cumulative sums forw.0.5070.988
Cumulative sums back.0.4950.990
Disclaimer/Publisher’s Note: The statements, opinions and data contained in all publications are solely those of the individual author(s) and contributor(s) and not of MDPI and/or the editor(s). MDPI and/or the editor(s) disclaim responsibility for any injury to people or property resulting from any ideas, methods, instructions or products referred to in the content.

