Article

The Effect of Spectral Resolution on the Quantification of OP-FTIR Spectroscopy

1
Anhui Institute of Optics and Fine Mechanics, Hefei Institutes of Physical Science, Chinese Academy of Sciences, Hefei 230031, China
2
Science Island Branch, Graduate School of USTC, Hefei 230026, China
*
Author to whom correspondence should be addressed.
Photonics 2023, 10(4), 475; https://doi.org/10.3390/photonics10040475
Submission received: 14 March 2023 / Revised: 18 April 2023 / Accepted: 19 April 2023 / Published: 21 April 2023
(This article belongs to the Special Issue Environmental Optical Detection)

Abstract

:
Open-path Fourier Transform infrared spectroscopy (OP-FTIR) is widely used in polluted gas monitoring. The spectral resolution, as a key parameter of FTIR detection technology, affects the quantitative analysis of gas concentration. In OP-FTIR, the nonlinear least square (NLLS) method based on a synthetic background spectrum is used to quantitatively analyze the gas concentration, and the influence of the spectral resolution is studied. It is found that the influence of the spectral resolution on quantitative gas analysis is related to the full width at half maximum (FWHM) of the gas spectrum. The concentration of gases with different spectral FWHMs were quantitatively analyzed using infrared spectra with different resolutions (1, 2, 4, 8, 16 cm−1). The experimental results show that the relatively optimal spectral resolution for propane (C3H8) with a broad FWHM is 16 cm−1, where the standard deviation is 0.661 and the Allan deviation is only 0.015; the relatively optimal spectral resolution for ethylene (C2H4) with a narrow FWHM is 1 cm−1, where the standard deviation is 0.492 and the Allan deviation is only 0.256. Therefore, for the NLLS quantitative analysis method based on the synthetic background spectrum, which is used in OP-FTIR, gas with a narrow FWHM at high resolutions or gas with a broad FWHM at low resolutions is most effective for performing quantitative analyses.

1. Introduction

The gaseous pollutants from industrial emissions, transportation, and agricultural activities have caused serious environmental damage [1]. Among the various methods for monitoring gas pollutants, the OP-FTIR method is one of the most effective [2]. OP-FTIR spectroscopy is a powerful and versatile technique that allows for remote and on-site analyses of atmospheric pollutants, trace gases, and other chemical species. Thus, it provides valuable information for environmental monitoring, industrial process control, and air quality management. Many methods can be employed to quantitatively analyze OP-FTIR spectroscopy. The key aspects of these approaches include obtaining a reliable background spectrum for OP-FTIR and developing accurate quantification models for FTIR spectra [3]. Several techniques have been proposed to establish a suitable background spectrum, such as upwind, side-wind, and synthetic background spectra [4,5,6]. The primary quantitative analysis methods encompass peak height or peak area analysis, the classical least squares (CLS) method, the partial least squares (PLS) method, and the non-linear least squares (NLLS) method [7,8,9,10]. The influence of spectral resolution varies across these different analysis techniques. For example, while the peak height or peak area analysis method may be more sensitive to spectral resolution changes, the PLS and NLLS methods may offer more robust spectral resolution variations by utilizing multivariate regression techniques and complex mathematical models.
According to relevant studies, the effect of spectral resolution varies depending on the measurement target and method of quantitative analysis. Ticová et al. examined how commercial spectrometers with different spectral resolutions affected the way rare earth elements were found [11]. Lu et al. studied the effect of near-infrared spectral data with different spectral resolutions and band ranges on the prediction performance of the PLS model [12]. Their results showed that the PLS’s prediction performance of the available nitrogen in coco-peat substrates was improved by increasing the resolution of the spectrometer. Wang et al. studied the effect of the PLS model on the quantitative analysis of liquid samples under different spectral resolutions [13]. Their results show that the quantitative analysis models of benzene, toluene, and benzaldehyde are improved under high spectral resolution, while the model of chlorobenzene is improved under low resolution. Ladan et al. used three different spectral resolutions (4 cm−1, 8 cm−1, 16 cm−1) when exploring alternative methods for the determination of antioxidants in buckwheat samples. Their results showed that an accurate prediction model could be obtained using a lower resolution (16 cm−1) alongside appropriate spectral pretreatment methods [14]. Zhao et al. studied the effect of the PLS model on the precision of quantitative analyses of CO, CO2, and NO under different resolutions, finding that the resolution has a significant effect on the precision of quantitative gas analysis and that the model can achieve a more accurate prediction effect under the appropriate resolution [15]. In the existing research, the effects of spectral resolution are mainly examined via the PLS model, while hardly any research has been conducted on the NLLS analysis method based on the synthetic background spectrum, which is used in OP-FTIR. In addition, little research has been conducted on the quantitative analysis of different gaseous pollutants under different spectral resolutions. Therefore, it is important to study the effect of spectral resolution on the quantification of OP-FTIR spectroscopy and address this gap in the research. It is essential to understand the specific requirements and characteristics of each application when selecting the appropriate quantitative analysis method and spectral resolution level. In doing so, researchers and practitioners can optimize the performance of OP-FTIR systems and ensure accurate and reliable results for environmental monitoring, industrial process control, and other critical applications. Further research is required, both to explore the nuanced effects of spectral resolution on various quantitative analysis methods and to develop advanced techniques that can better adapt to the challenges of spectral resolution optimization in OP-FTIR spectroscopy.
In this paper, the NLLS quantitative analysis method based on a synthetic background spectrum is applied to OP-FTIR, and the effect of the spectral resolution on the quantitative analysis method is studied. First, the effect is analyzed theoretically. Then, taking into consideration that propane (C3H8) and ethylene (C2H4) are important environmental monitoring gases in the petroleum chemical industry, they are selected as sample gases for the study. These two gases also have a large difference in spectral FWHM, making them appropriate sample selections. C3H8 gas with a broad FWHM and C2H4 gas with a narrow FWHM are quantitatively analyzed using the established NLLS method based on a synthetic background spectrum to calculate the concentration of each component gas. The precision of concentration results is then used to evaluate the effect of spectral resolution on OP-FTIR. The research provides a basis for the selection of spectral resolution parameters in the quantitative analysis of OP-FTIR.

2. Theoretical Analysis

In the self-developed OP-FTIR spectroscopy, the nonlinear least squares (NLLS) analysis method based on a synthetic background spectrum is used to analyze concentrations of propane (C3H8) and ethylene (C2H4). The analytical method involves obtaining the background spectrum and conducting the NLLS analysis [16].

2.1. Synthetic Background Spectrum

The background spectrum used to calculate absorbance is an essential component affecting OP-FTIR quantitative analysis. Under laboratory conditions, it is not difficult to measure the background spectra for an FTIR spectrometer in a closed absorption cell; it is only necessary to fill the closed sample cell with N2 to obtain an ideal background spectrum. However, in OP-FTIR measurements, it is difficult to directly remove the target gas from the open path due to the presence of a large number of interfering gases and environmental background noise. Therefore, alternative methods are required to reduce this interference. One commonly used method is the synthetic background spectrum method [4,17]. The synthetic background spectrum method used in this paper is a filtering method based on moving average filtering.
The basic principle of obtaining the background spectrum is to treat the background spectrum as a slowly changing baseline superimposed on the absorption spectrum structure. Then, extract the background spectrum from the measurement spectrum through filtering and smoothening. Moving average filtering is a classic filtering method, which smoothens spectral data to remove noise and obtain a background spectrum. The specific operation process is as follows:
(1)
Perform moving average filtering on the spectral data S, as shown in Equation (1):
S 1 ( i ) = i = m m S ( i m ) N
where S(i) is the spectral data and N = 2m + 1 is the width of the filter, m represents the number of smoothening points.
(2)
After filtering and smoothening, the spectral data S1 is obtained.
(3)
Replace the values in S that are less than S1 with S1 to construct a new relative intensity vector S0, that is,
S 0 i = m a x S i ,   S 1 i
where S1 is the synthesized background spectrum, S is the measured spectrum, and S0 is the target iteration spectrum.
(4)
Repeat the above process for S0 until the filtering loop stops (after satisfying the pre-set number of iterations). The synthetic background spectrum S1 is thus obtained.
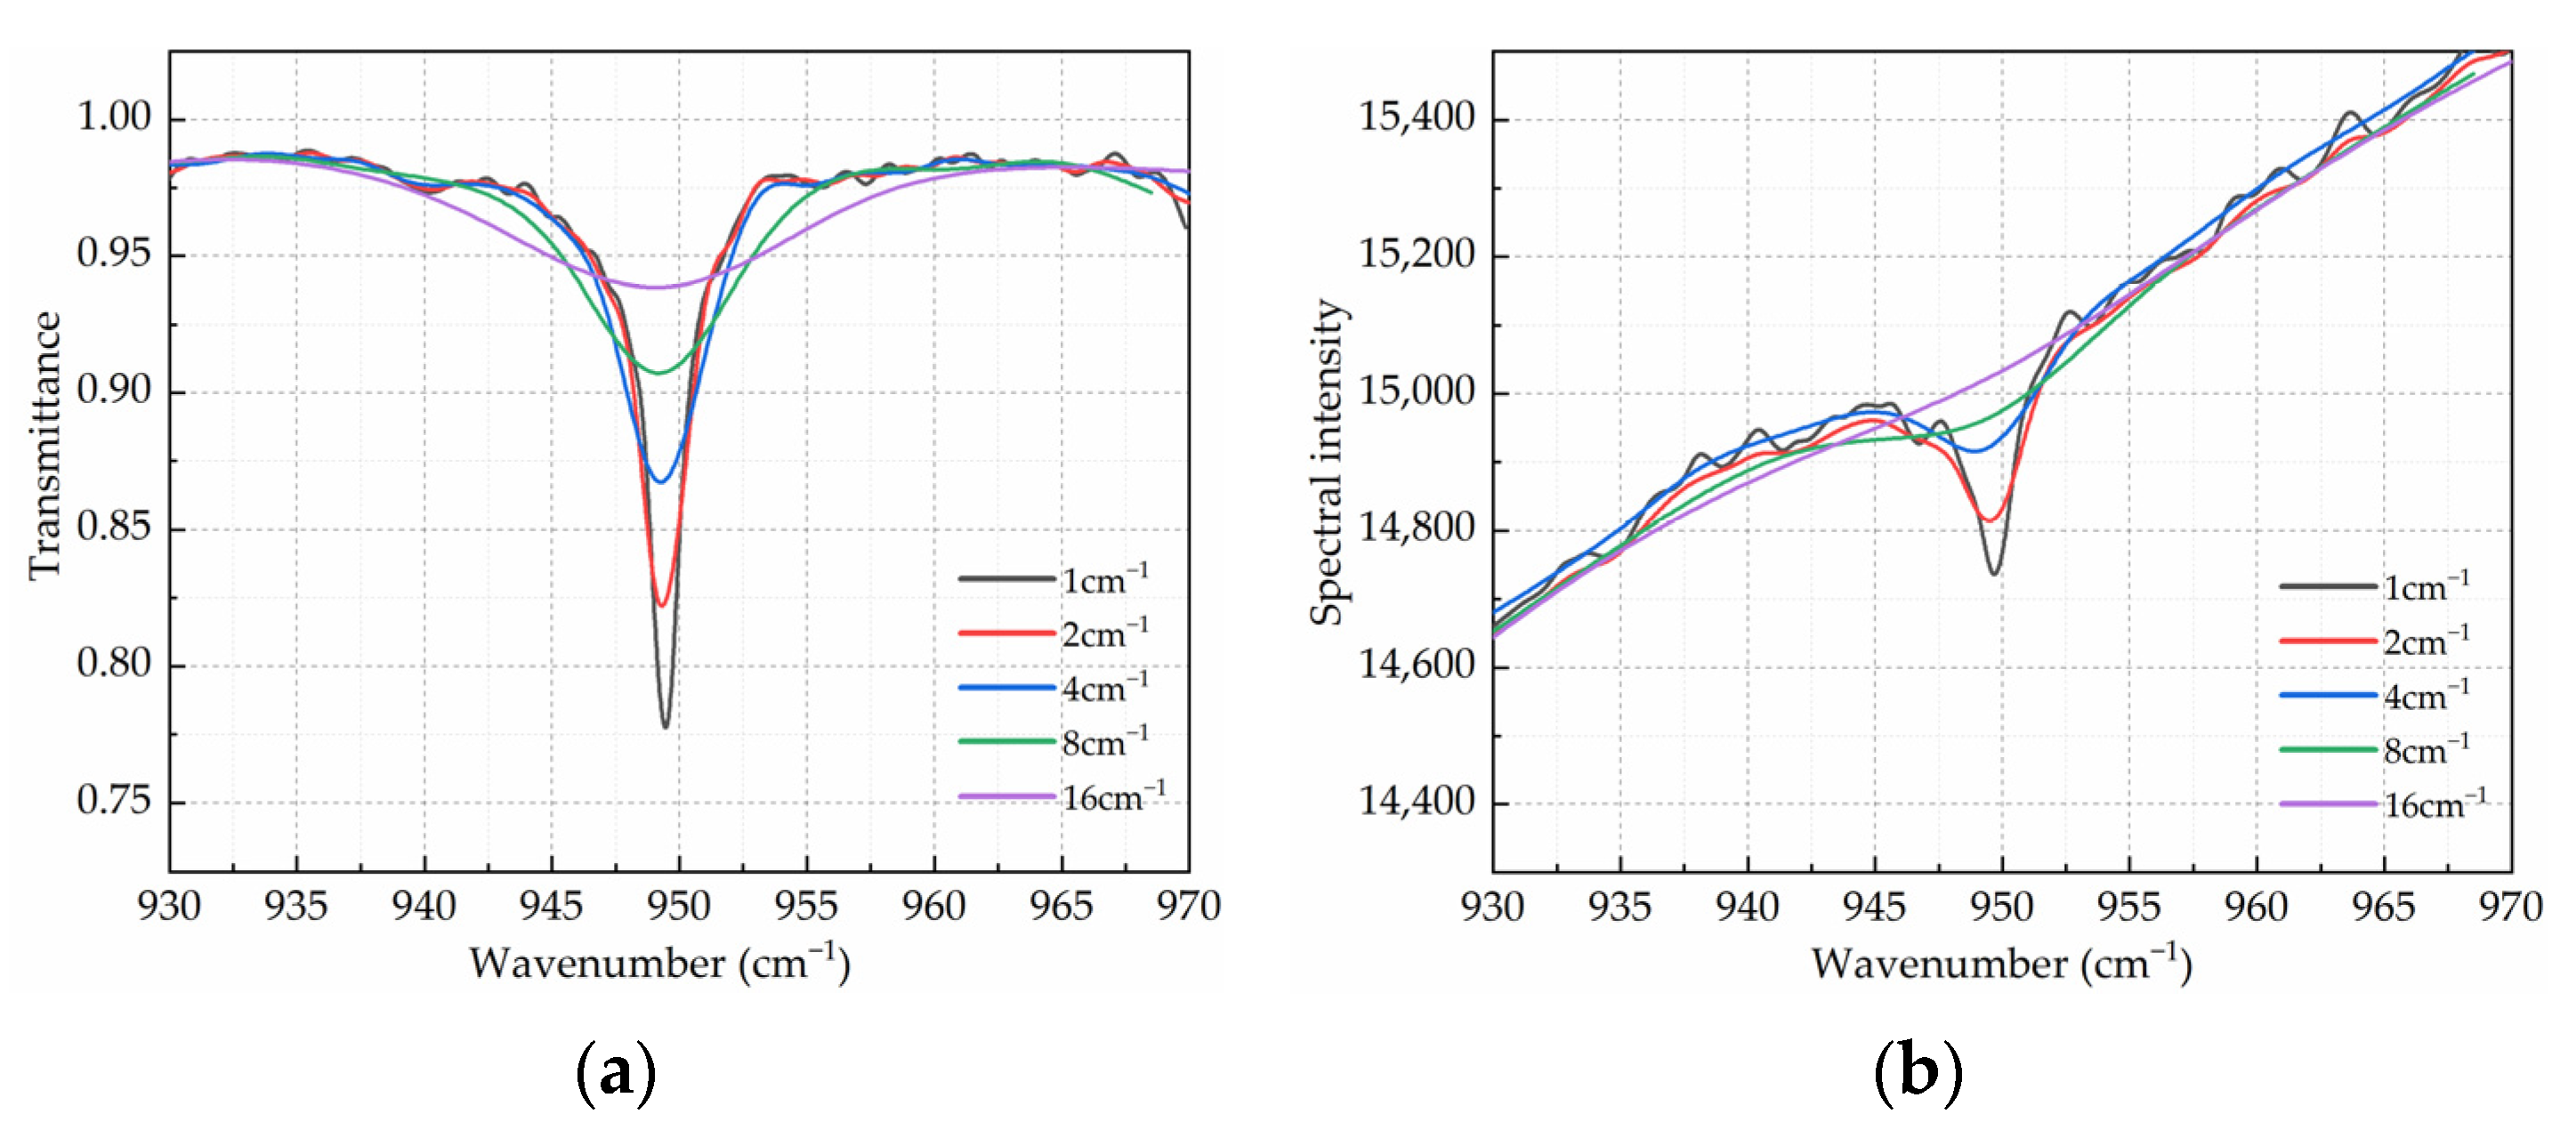
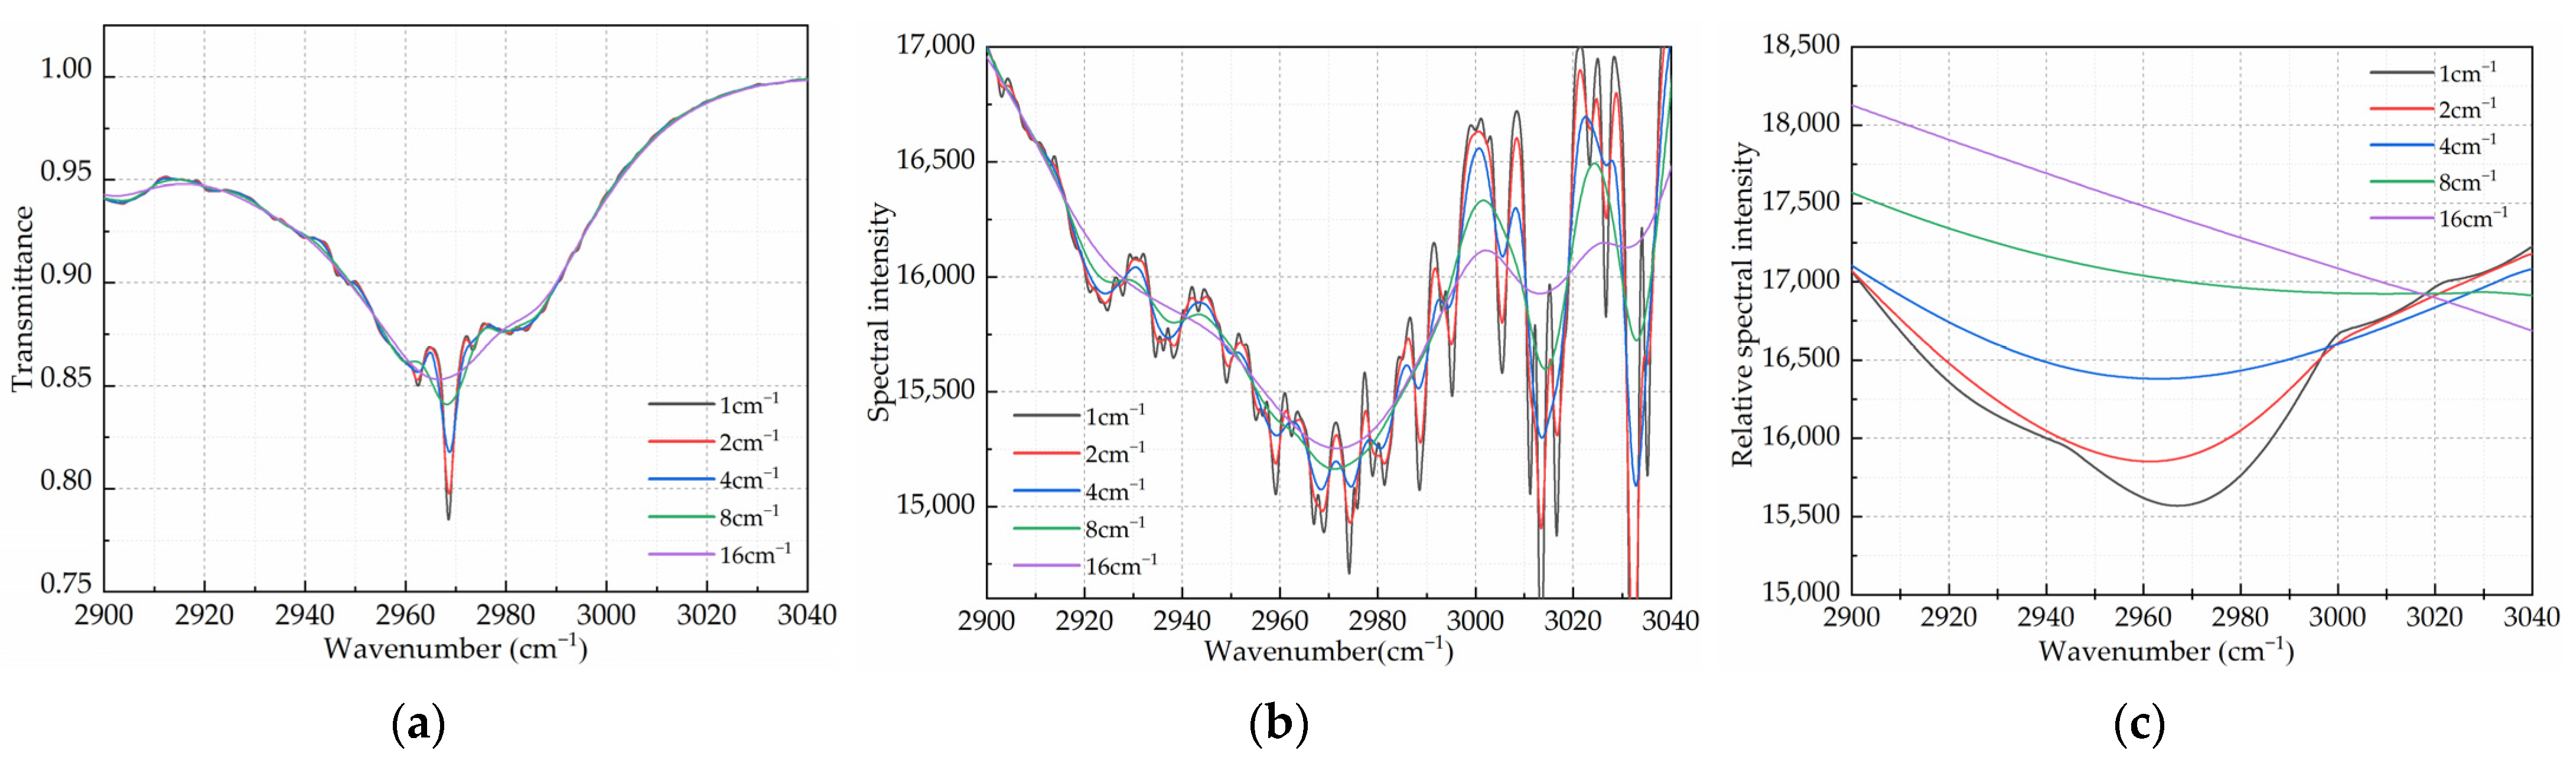
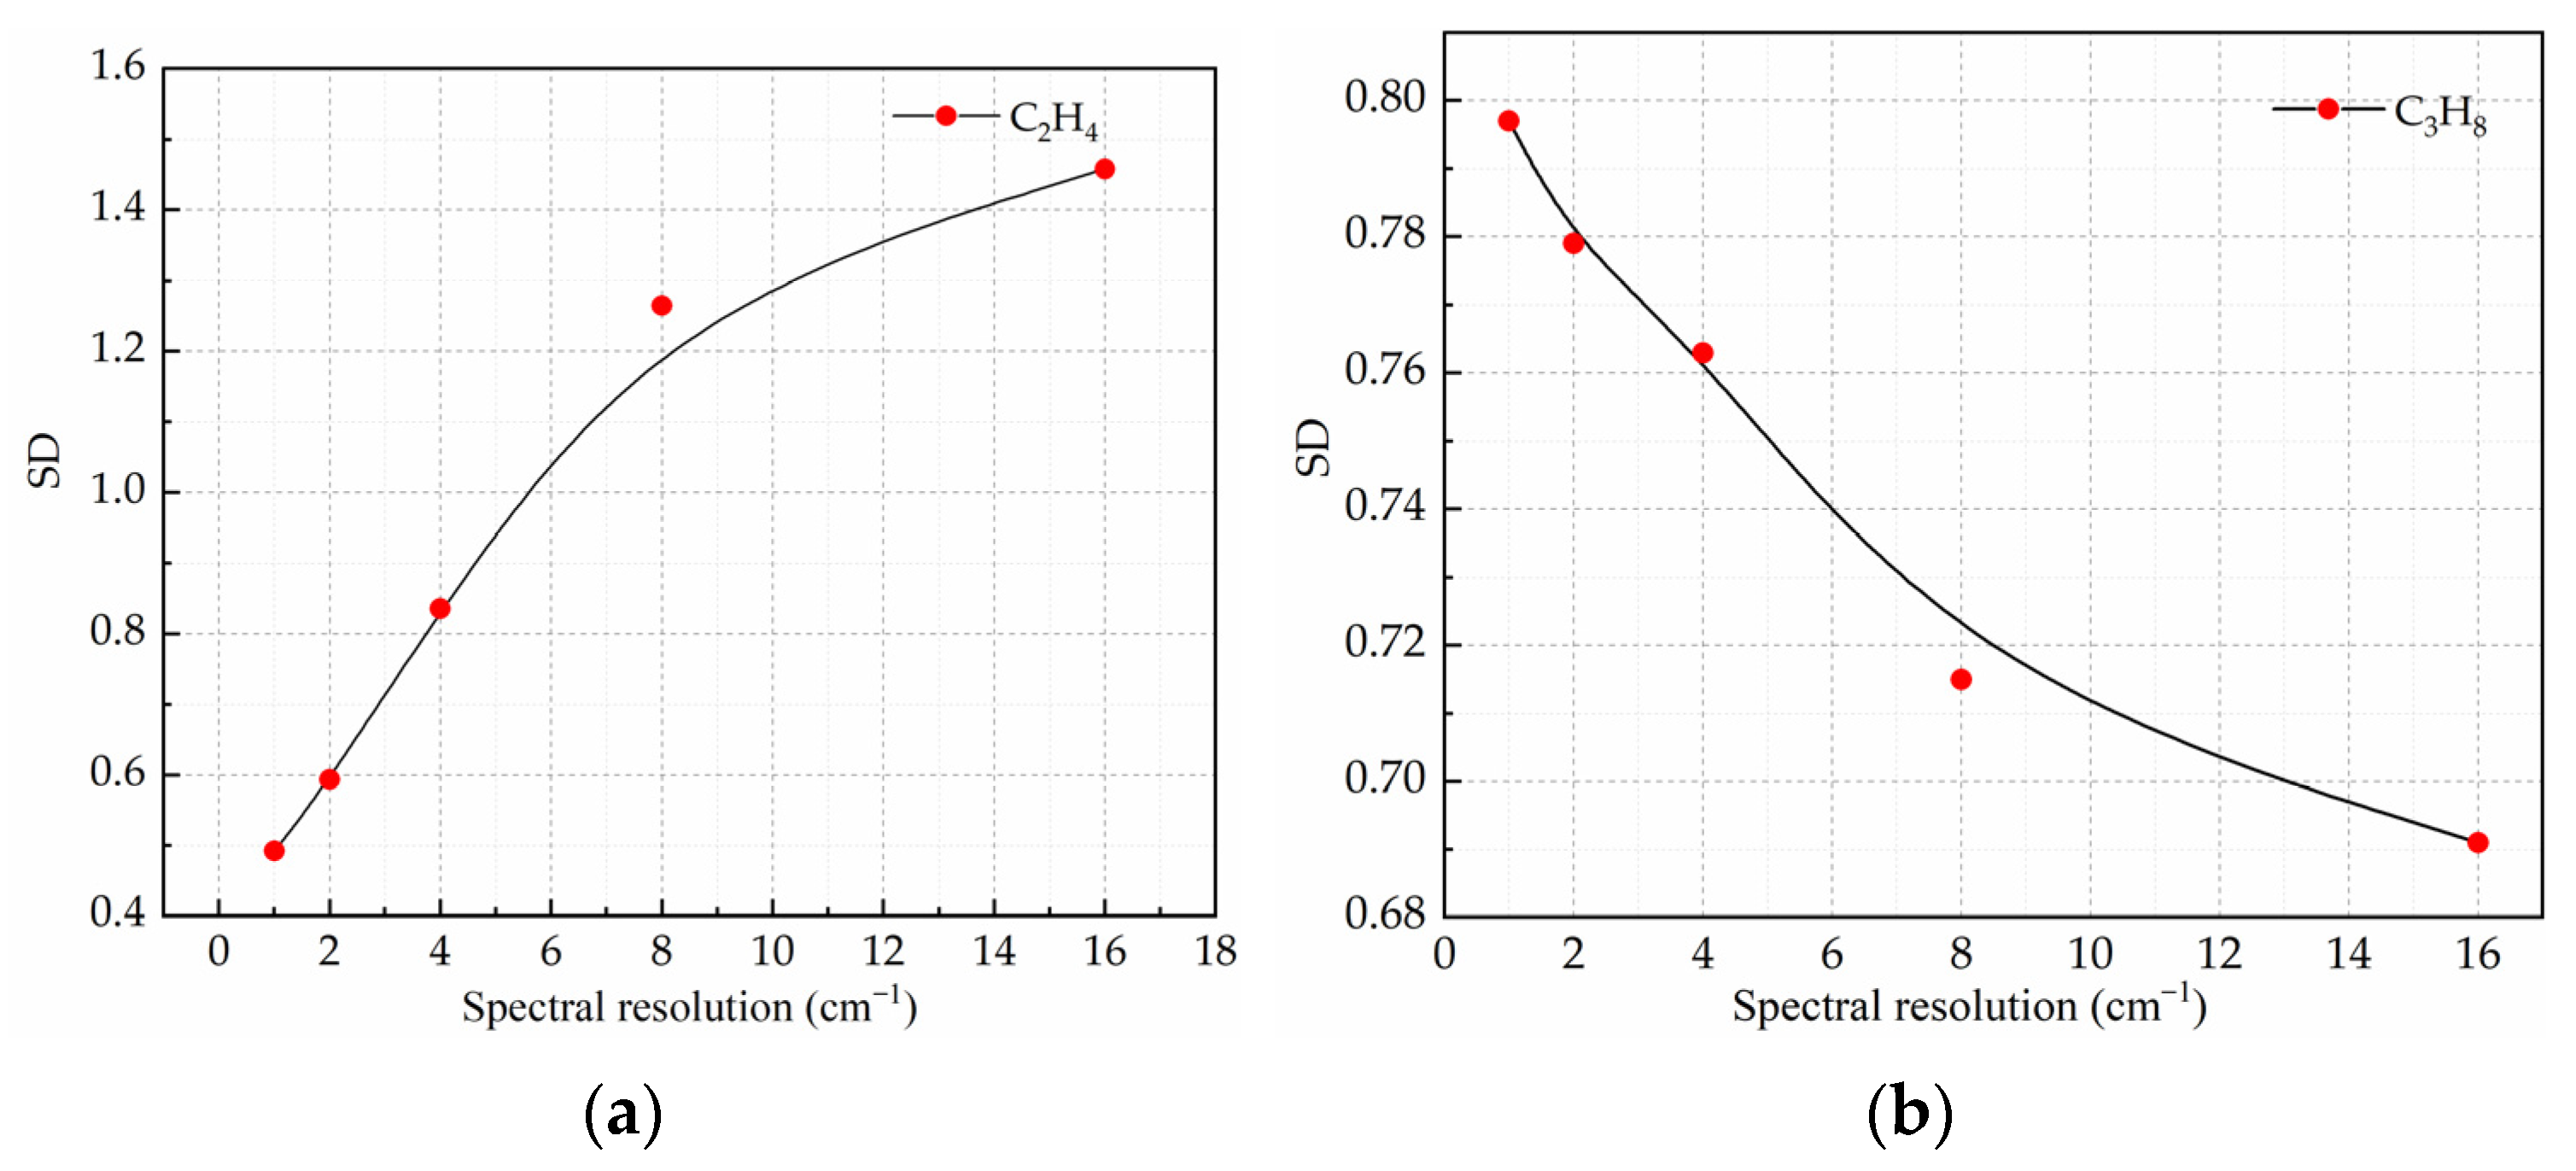
The accuracy of the synthetic background spectrum depends on the absorption peak width and height of the gas spectrum and filter type [17]. For certain gases, the absorption peak width and height of the gas spectrum depend on the spectral resolution. Therefore, when using the same filtering method, spectral resolution is an important factor that affects the synthetic background spectrum.
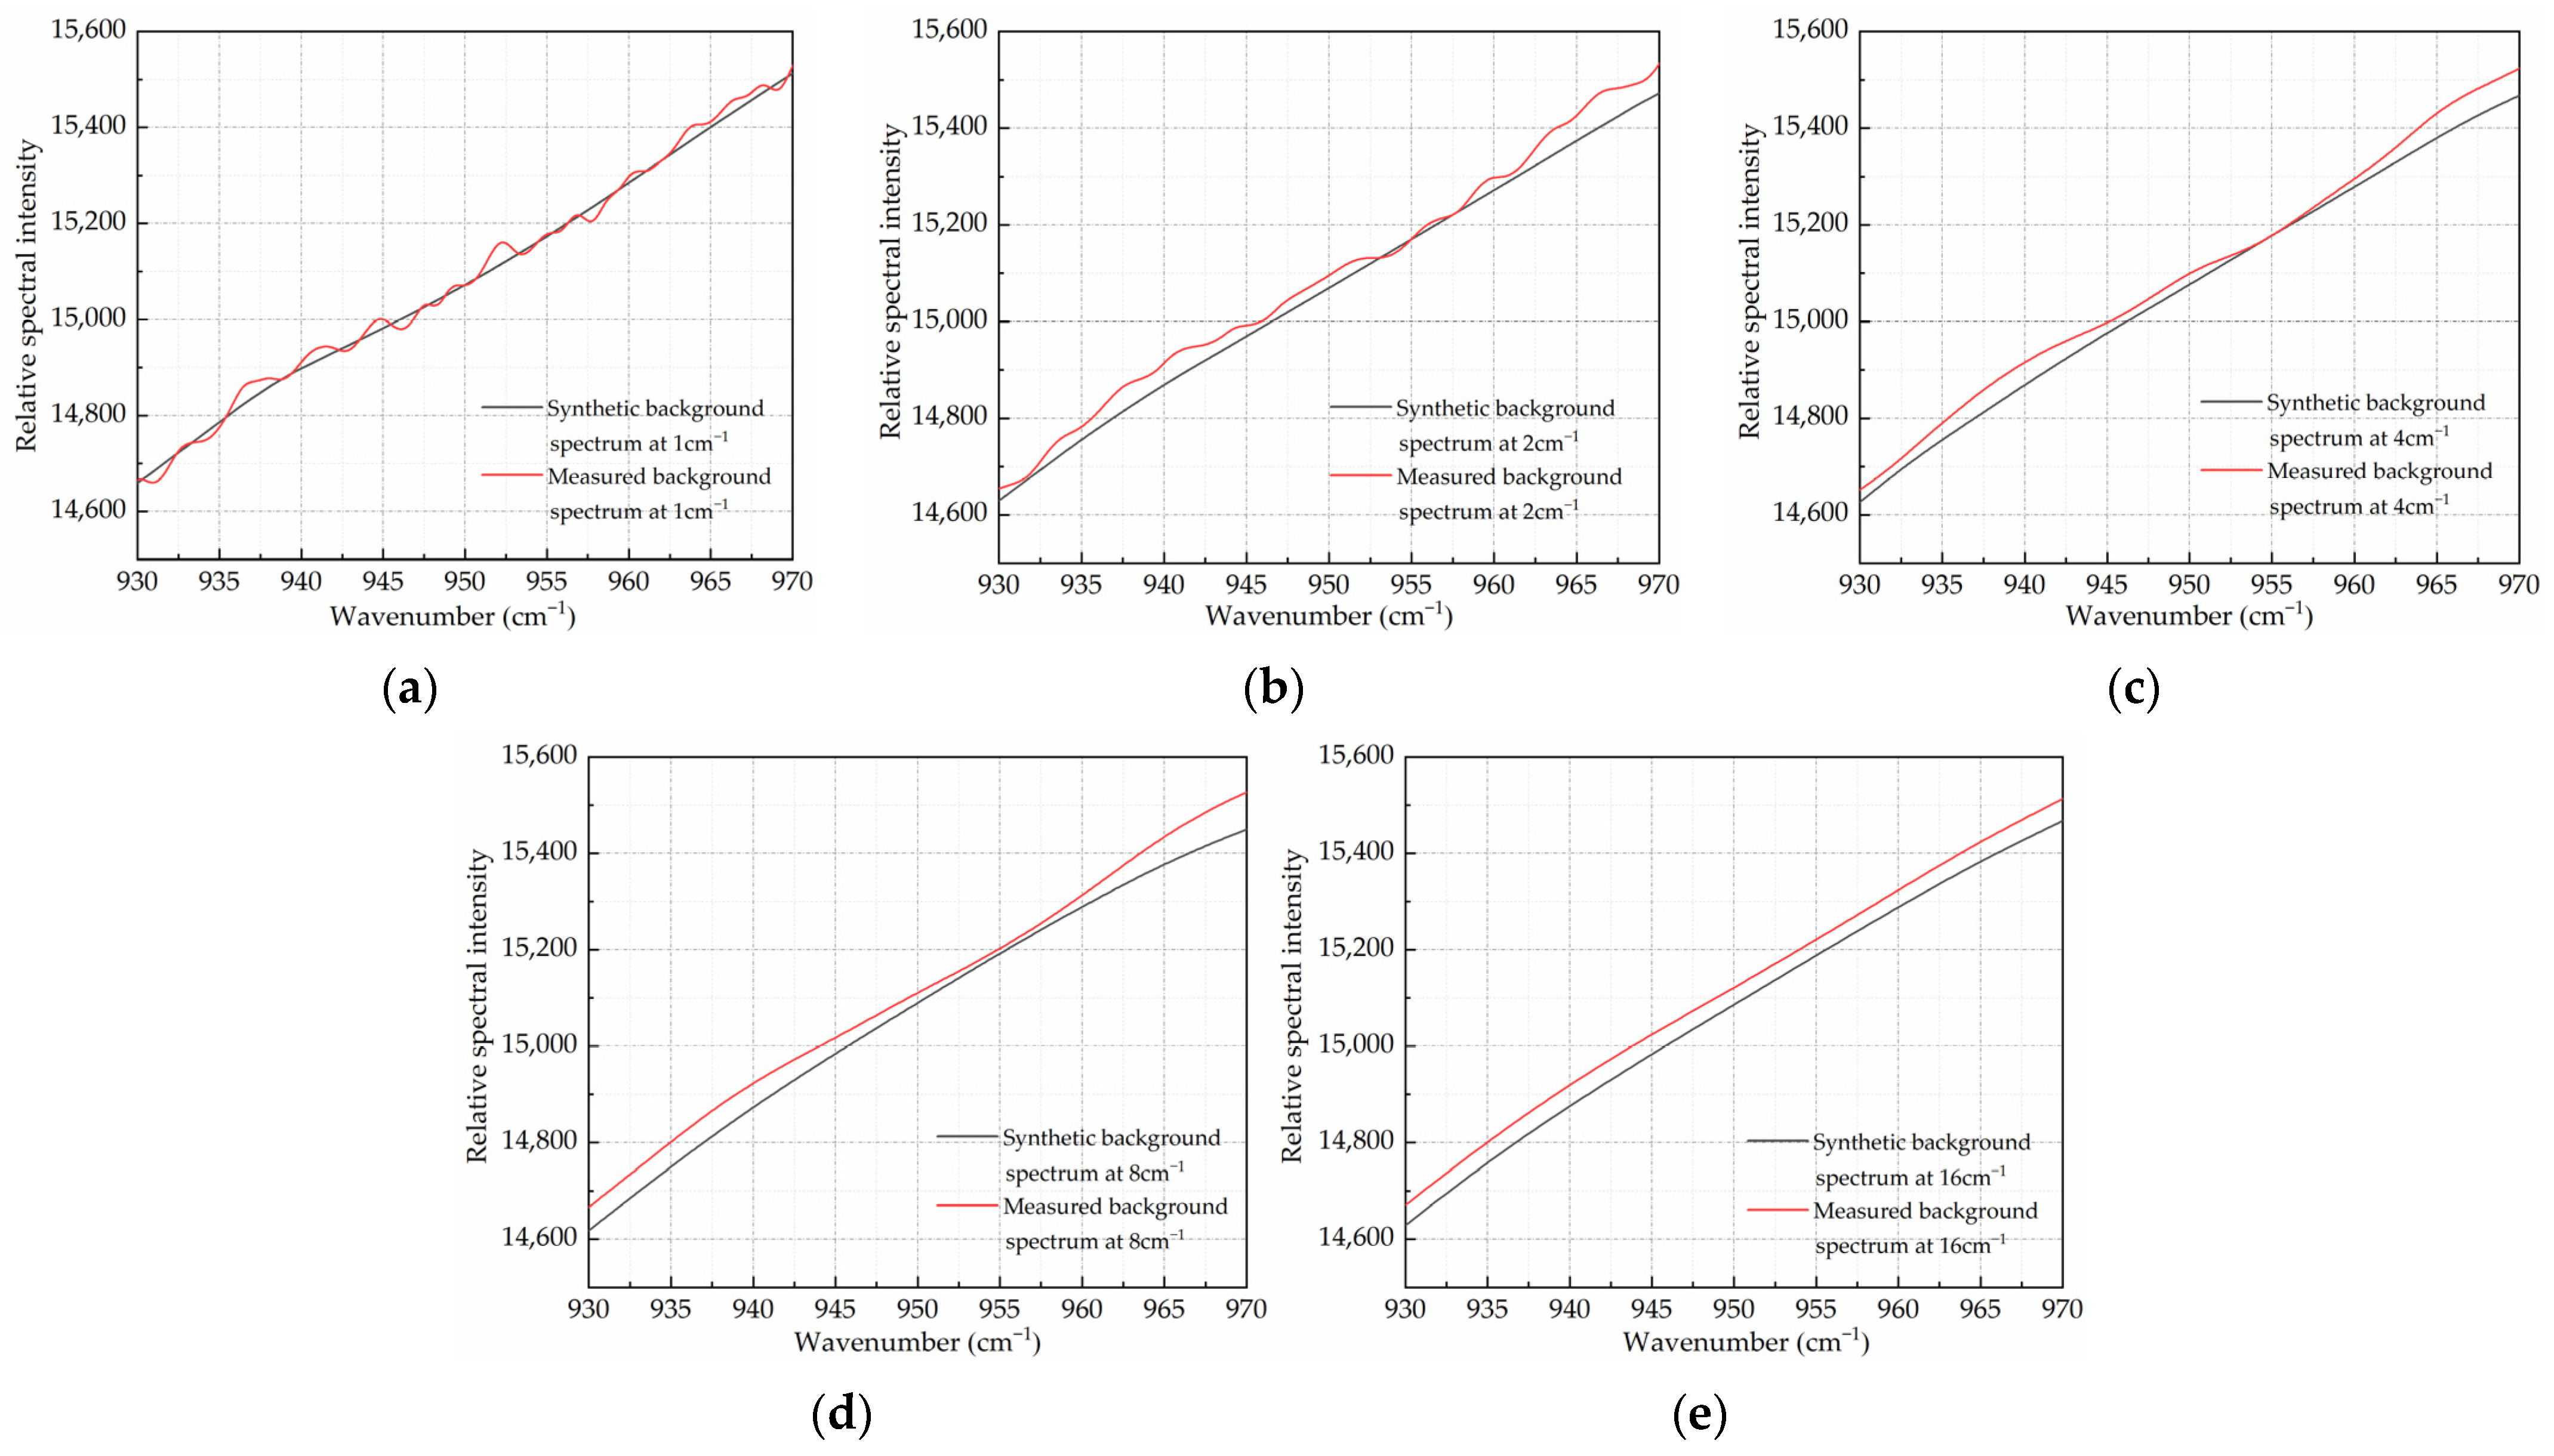
The value function E1 is used to represent the error of the synthesized background spectrum in this paper, as shown in Equation (3):
E 1 = S 1 ( i ) S a ( i ) + ϖ i 2 + λ 1 S i 2
where Sa is the actual background spectrum, S1 is the synthesized background spectrum, S is the measured spectrum, S″ is the second derivative of the measured spectrum, ϖ(i) is the noise signal, and λ1 is the impact parameter of spectral resolution.
In Equation (3), the second derivative of the measured spectrum is used to represent the spectral resolution, the impact of which can be quantified on the synthesized background spectrum. The gas spectrum characteristics are dependent on the spectral FWHM (both narrow and broad), which is mainly affected by the characteristics of the gas. Gas spectra with different FWHM are also affected differently by the resolution and have different impacts on the synthesized background.
For gas spectra with a narrow FWHM, the signal-to-noise ratio (SNR) is improved at low resolutions, which means that the value of ϖ(i) decreases. However, gas spectra with a narrow FWHM may be drowned out by the background spectrum and thus the background spectrum cannot be effectively extracted (this makes the value of λ1 increase). Therefore, the influence of spectral resolution on the value function is significantly increased in the synthesized background spectrum, which in turn makes the value of E1 increase.
For gas spectra with a broad FWHM, not only is the spectral SNR improved at low resolutions, but the spectral information can also be effectively preserved. In other words, the value of λ1 and ϖ(i) make E1 decrease. Therefore, even with a lower spectral resolution, a thorough filtering and smoothening effect can be obtained, which is favorable for improving the accuracy of the synthesized background spectrum.

2.2. NLLS

Considering the nonlinear relationship between spectral response and concentration, the NLLS method [18,19,20,21] was introduced to correct the nonlinear behavior of the spectrum and improve its quantitative accuracy. This section will analyze the impact of spectral resolution on NLLS.
The absorption coefficient σ(ν) is expressed as
σ ( ν ) = σ 0 ( ν ) f L ( ν ) f G ( ν ) ILS ( ν )
where σ0(ν) is the absorption coefficient from the standard database, fL is pressure broadening, fG is temperature broadening, and ILS(ν) is Instrumental Line Shape effects (including resolution, window function, Field of View, etc.).
Gas concentration inversion can be represented as a multi-parameter NLLS fitting process, which can be represented by the best fitting function as follows:
χ 2 = i = 1 n I m I 0 ( ν ) e L i σ i C i ) 2
where Im represents the measured spectral intensity, I0 represents the intensity of the synthesized background spectrum, L is the optical path length, σi is the absorption coefficient of component i, Ci is the concentration of component i, and ν is the wavenumber.
For simplicity, a is used to represent the coefficient vector, which is comprised of the concentration, environmental parameters, and instrument parameters. Then Equation (5) can be rewritten as follows:
χ 2 ( a ) = i = 1 n I i I v i ; a 2
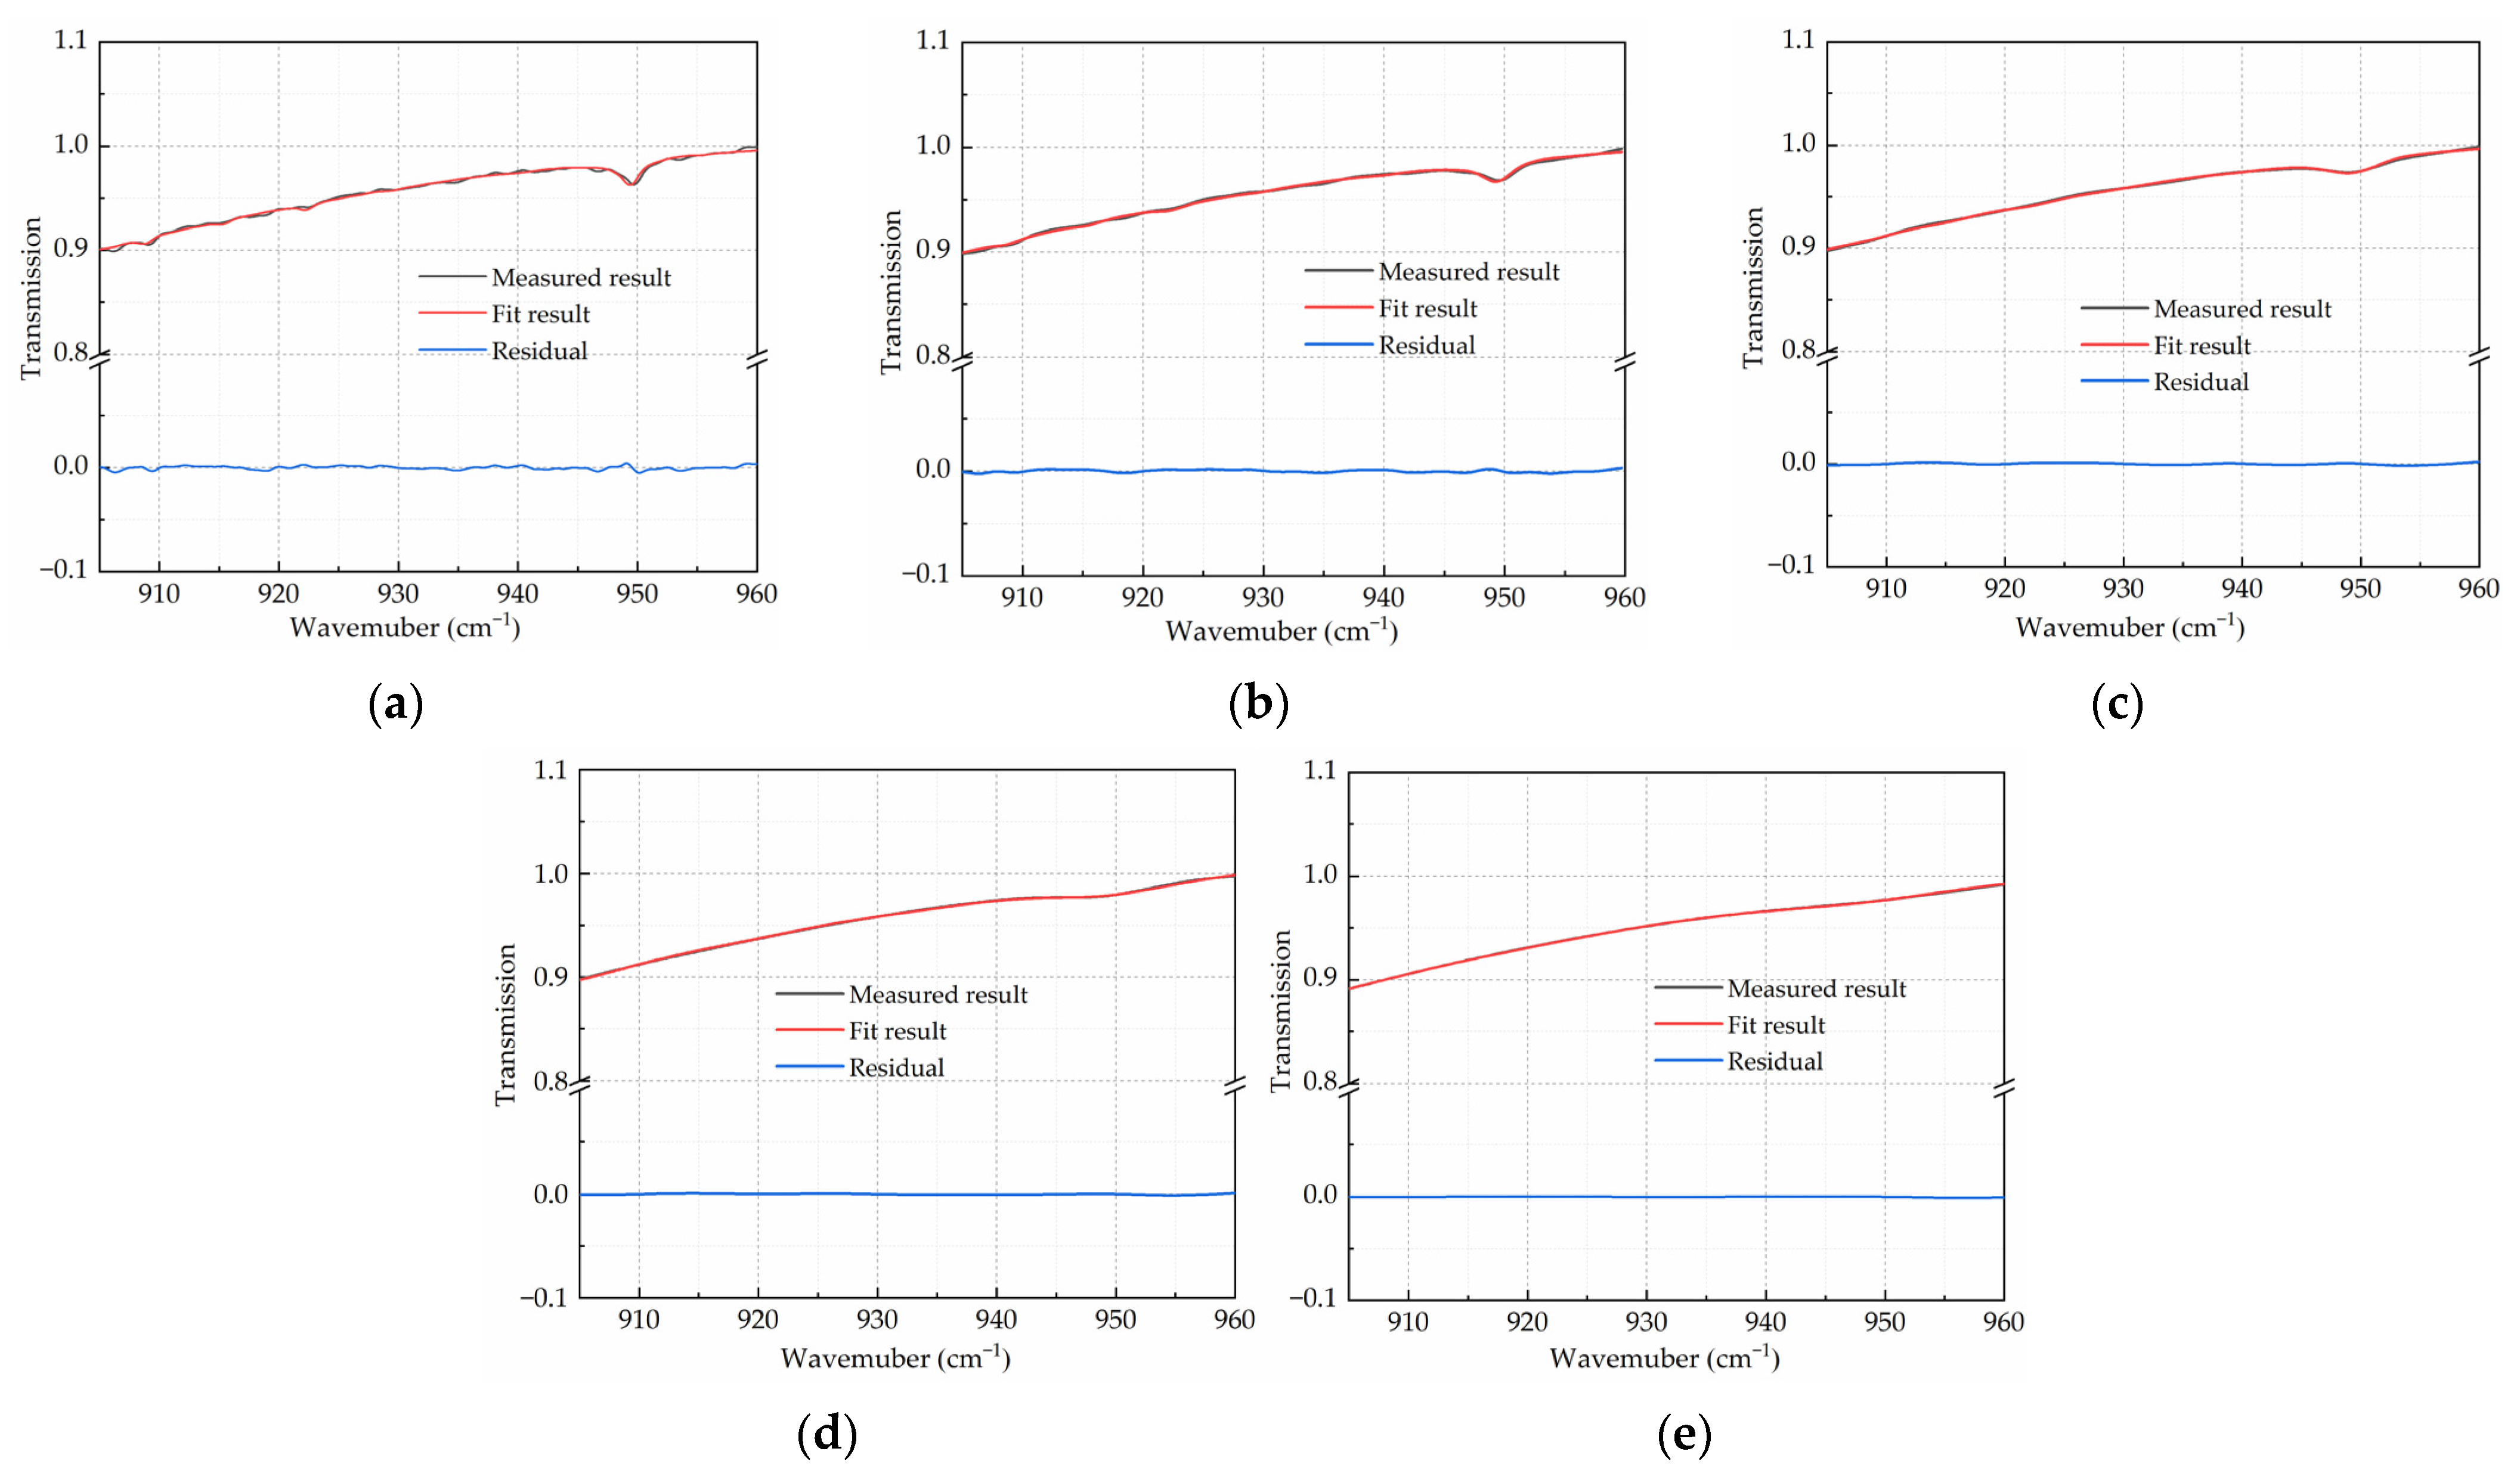
The purpose of NLLS fitting is to minimize the difference between the fitting data and the actual data. Typically, this difference can be represented by the value function E2, that is:
E 2 = S F ( v ) S M ( v ) 2
where SF is the fitting spectrum represented, and SM is the measured spectrum.
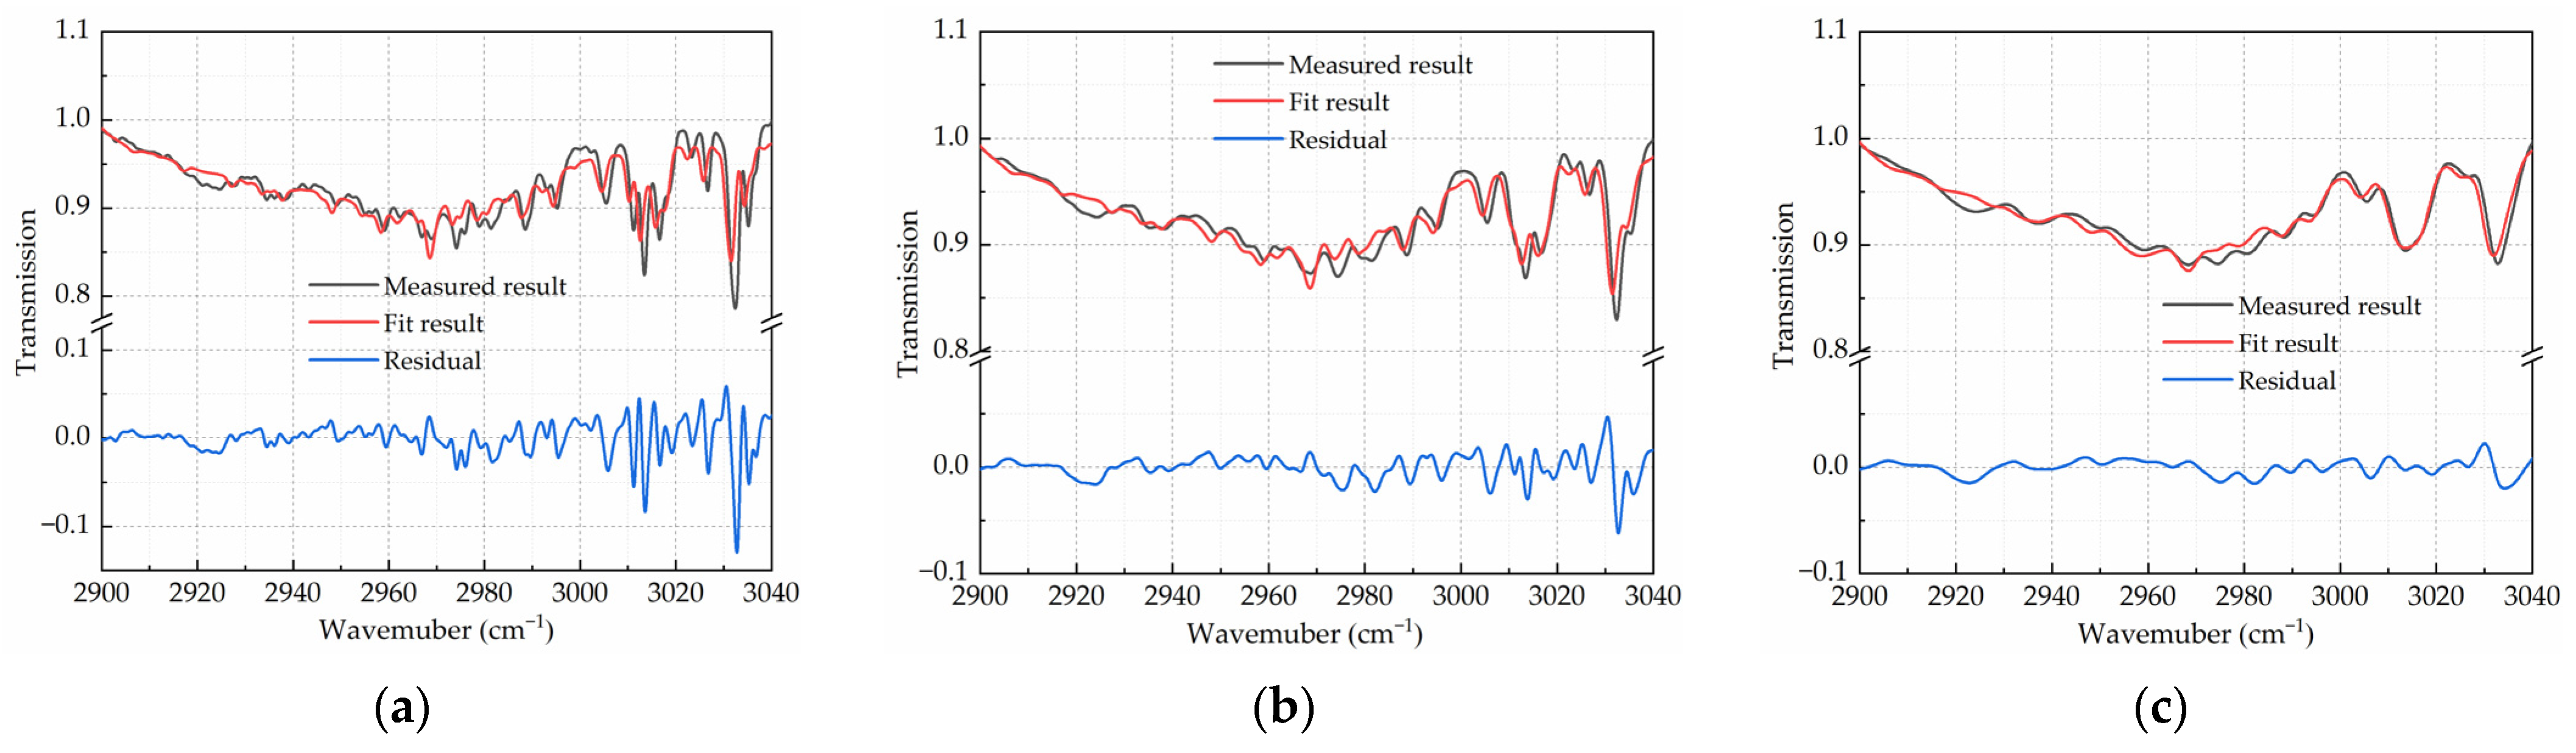
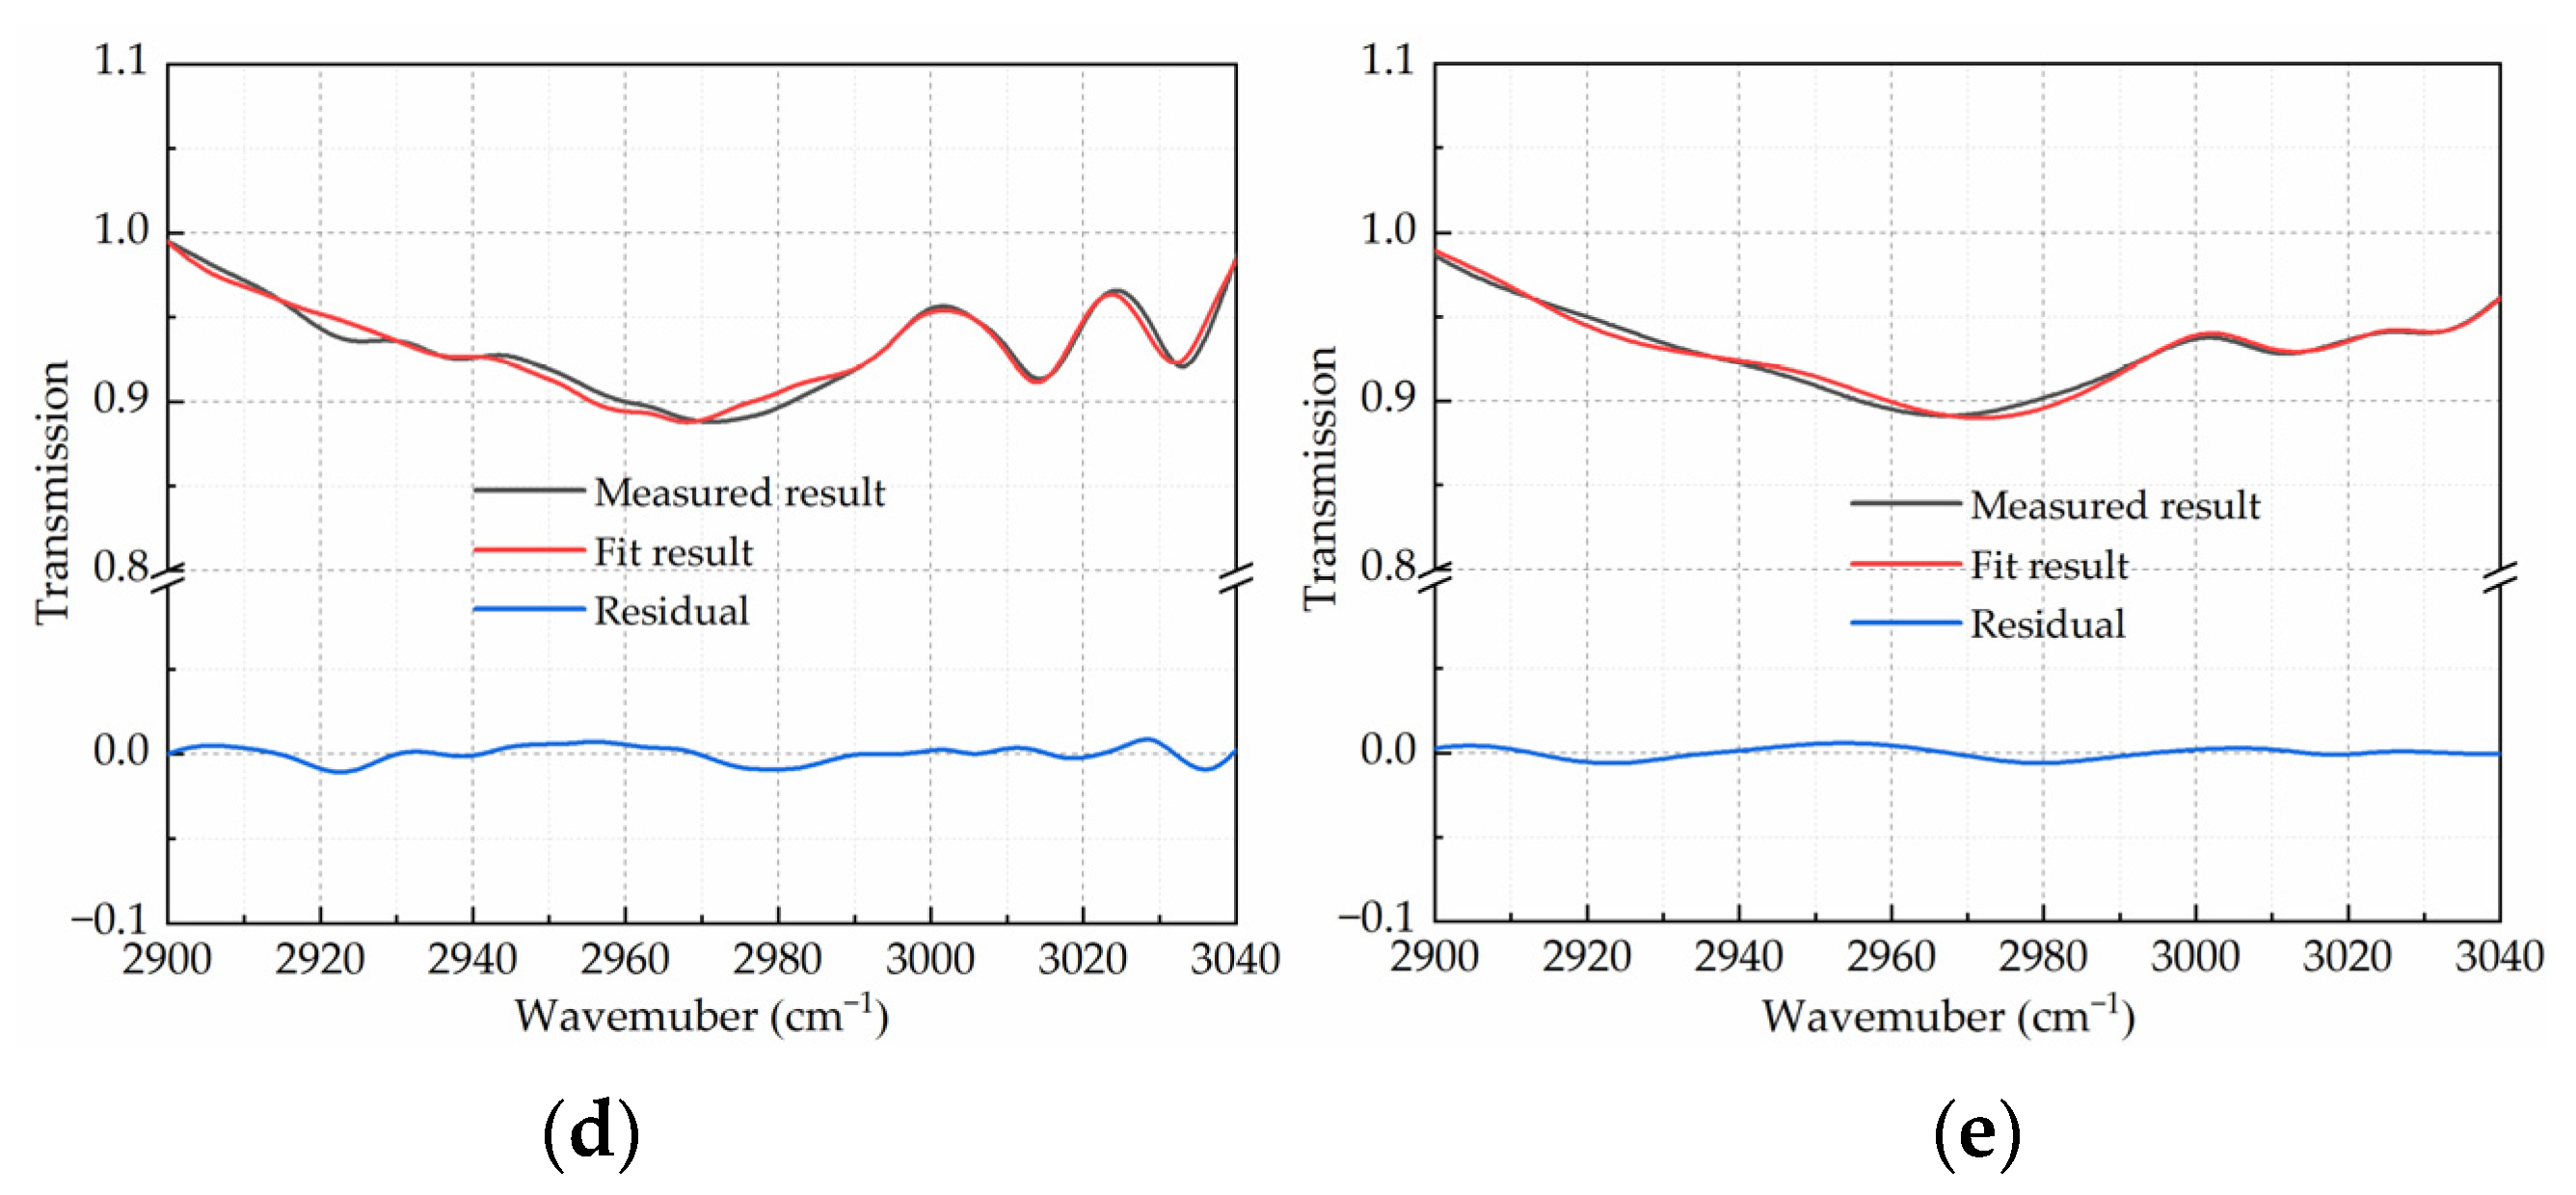
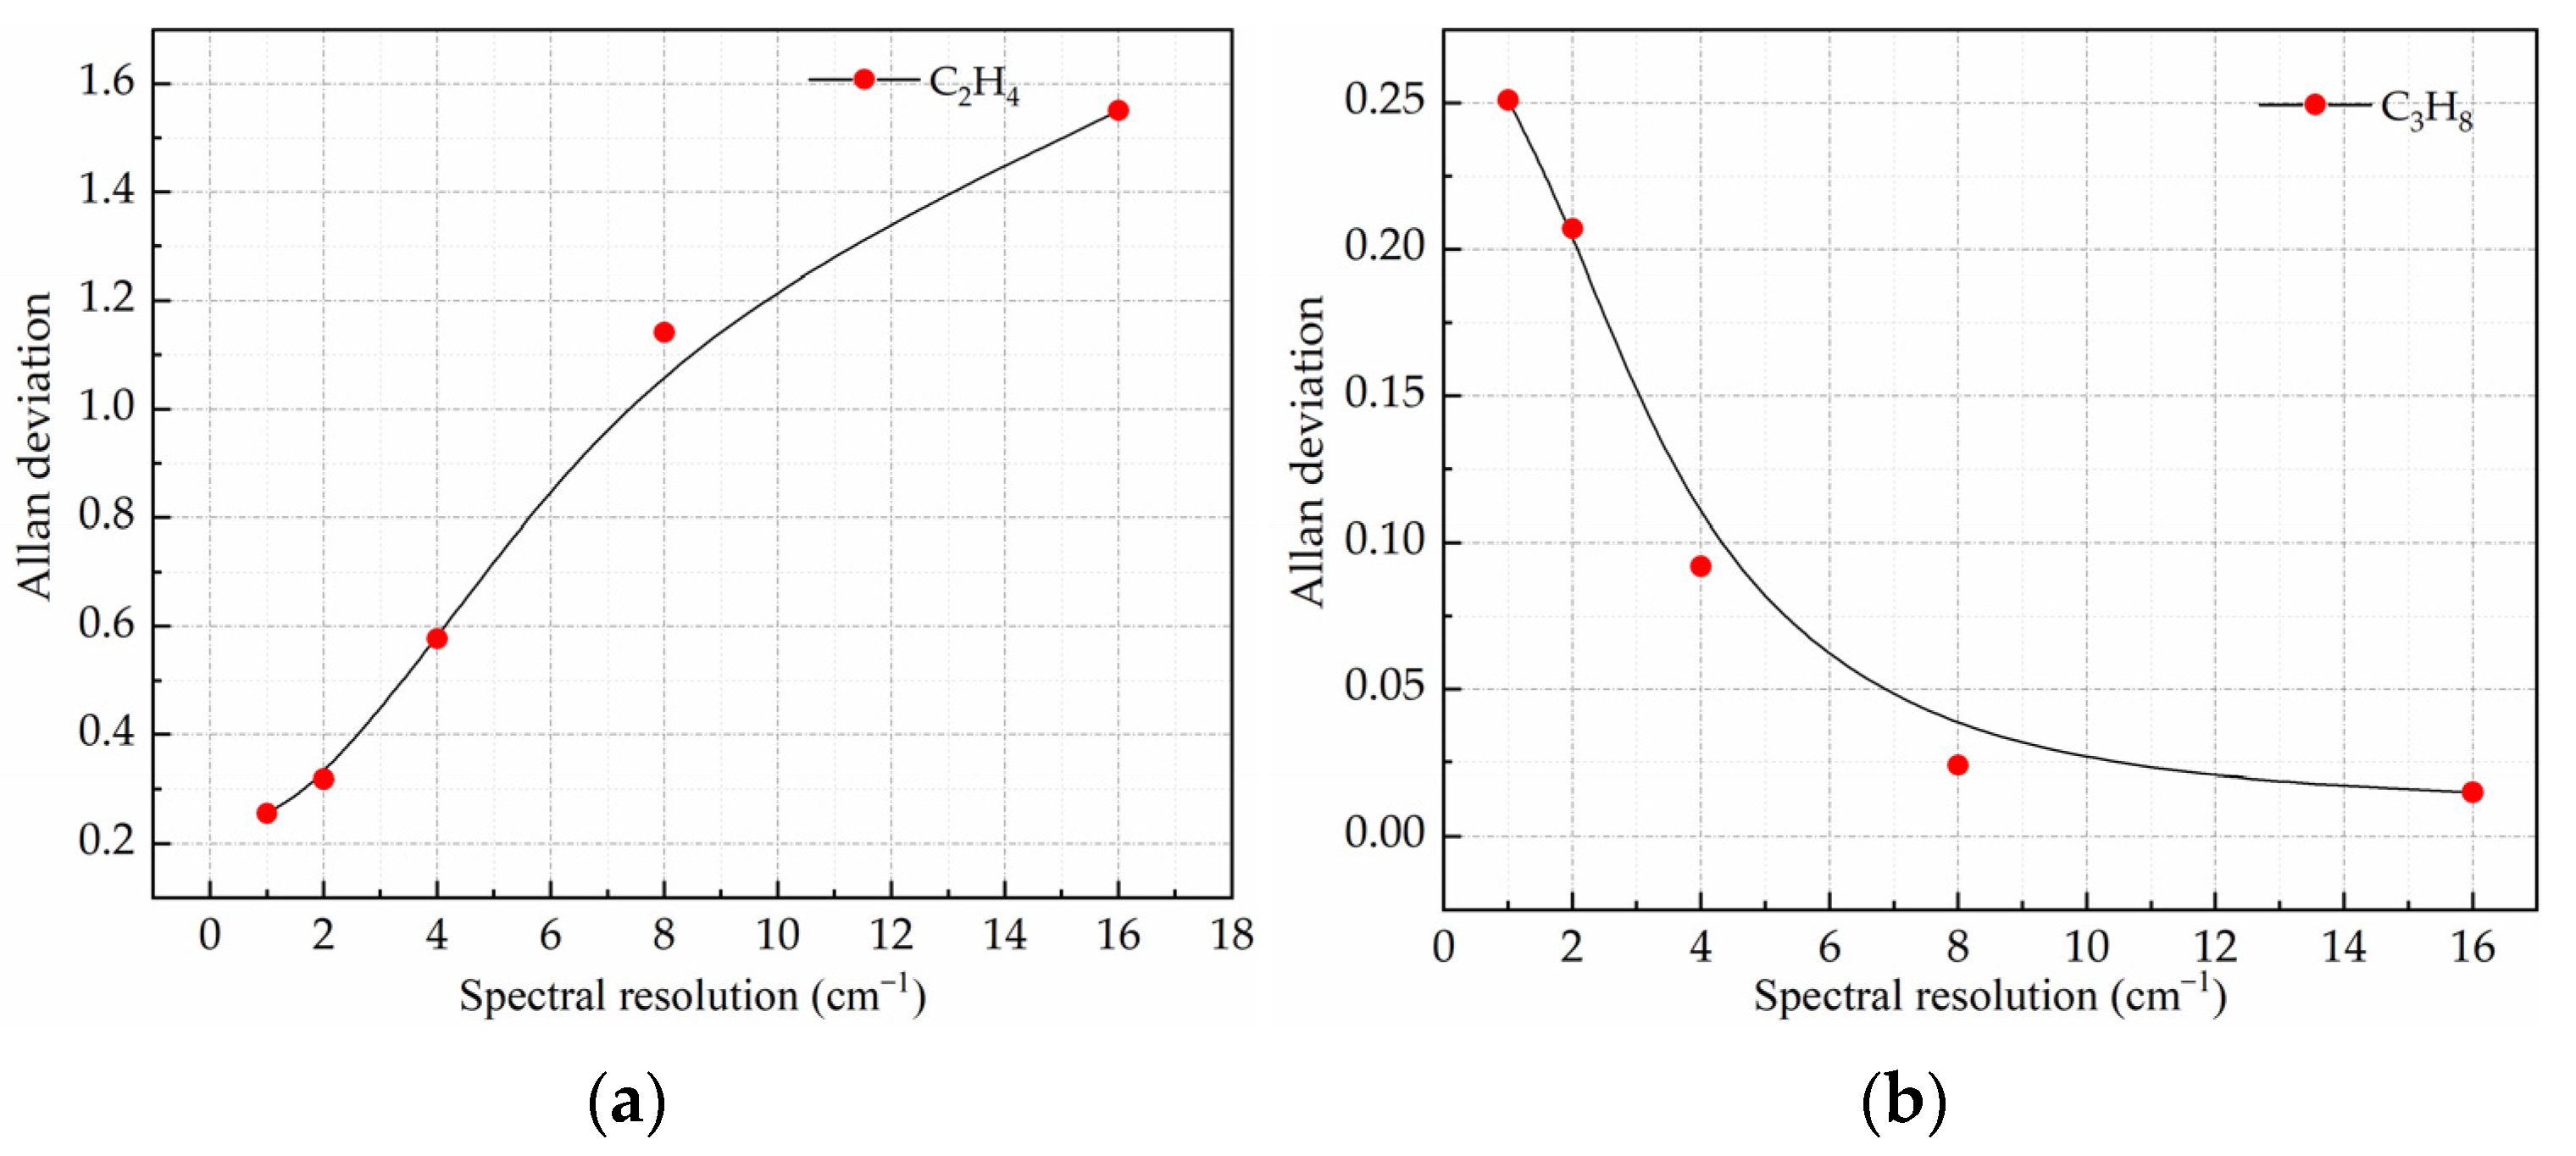
The size of this difference is mainly affected by the SNR. For an FTIR spectrometer, the SNR is proportional to the square root of observation time t and spectral resolution SNR t × Δ ν , where Δν represents the spectral resolution. When the resolution causes a change in the SNR, the SNR becomes the main impact on the NLLS fitting. The noise in the spectral data can interfere with the recognition of features, thus reducing the fitting accuracy. However, for some gas spectra, low resolution will also interfere with feature recognition. Therefore, an analysis of the impact of spectral resolution must also take into account the specific characteristics of the gas spectrum.
Therefore, Equation (7) is modified to the form of Equation (8), as follows:
E 2 = S F ( v ) S M ( v ) + ϖ v 2 λ 2 S M v 2
where SF is the fitting spectrum represented, SM is the measured spectrum, S M is the second derivative of the measured spectrum. ϖ(ν) is the noise signal, and λ2 is the impact parameter of spectral resolution.
In Equation (8), the second derivative of the measured spectrum is used to represent the spectral resolution, thus quantifying its impact on the synthetic background spectrum. In nonlinear least squares (NLLS) quantitative analyses, resolution and SNR represent a pair of opposite parameters. In SNR-centric analyses, higher resolution may provide more spectral information, thereby reducing the impact of SNR. Therefore, a negative relationship is expressed using a minus sign to denote the contradictory nature of these parameters.
The fitting difference is analyzed with the SNR as the main influence, where a higher SNR at low resolution indicates a more accurate fitting. However, for gas spectra with different FWHM, the influence of resolution is different, which requires separate discussion.
For gas spectra with a narrow FWHM, high spectral resolution leads to a larger second derivative of the spectrum, making the spectral peaks sharper and allowing for more accurate identification of the spectral features. Thus, the impact of the SNR on the NLLS fitting accuracy is reduced to some extent.
For gas spectra with a broad FWHM, high spectral resolution results in smoother spectral peaks and a smaller second derivative of the spectrum. The improvement of the spectral features at high resolution is limited, and the fitting accuracy is primarily affected by the changes in the SNR, which are themselves caused by changes in the resolution.

2.3. Resolution Effect

In this paper, “broad” or “narrow” refers to the relative spectral width of the gas spectrum compared to the instrumental resolution. When the FWHM of the gas spectrum is smaller than or comparable to the instrumental resolution, it is considered “narrow”. When the FWHM of the gas spectrum greatly exceeds the instrumental resolution, it is considered “broad”.
From the above process of OP-FTIR gas concentration quantification, it can be inferred that the impact of spectral resolution is related to the FWHM of the gas spectrum. For gas spectra with a narrow FWHM, high spectral resolution is more suitable for OP-FTIR quantification analysis, while for gas spectra with a broad FWHM, low spectral resolution is more suitable.

3. Experiment

3.1. Experimental Device and Data

3.1.1. Experimental Device

To study the effect of spectral resolution on the quantitative analytical method, propane (C3H8) gas with a broad FWHM and ethylene (C2H4) gas with a narrow FWHM were selected as experiment sample gases. The samples were a mixture of C3H8 and C2H4, where the C3H8 concentration was 209 ppm and the C2H4 concentration was 199 ppm.
The working principle of the OP-FTIR system is shown in Figure 1. First, the infrared light beam is collimated by the emission telescope and passes through the contaminated gas in the open environment. Then, it is received by the telescope, focused, and converged in the interferometer. Through the movement of the mirror and the collection of the interference information by the detector, the collected interference signal is sent to the computer. Finally, the computer converts the interference signal into a spectrum signal, which contains information on the concentration of the measured gas and uses the NLLS algorithm based on the synthetic background spectrum to invert the concentration information.
To control and calibrate the gas concentration conveniently, OP-FTIR with a commissioning structure (which has a light source and a small internal gas pool) is used for experiments, as shown in Figure 2. The main parameters of the OP-FTIR are as follows: The spectral range was 500 to 5000 cm−1, the scanning velocity was 0.2875 cm/s, the maximum optical path difference was 0.01 m, and the length of the gas pool was 0.02 m. The detector was mercury cadmium telluride (MCT), and the refrigeration mode was liquid nitrogen.
The experimental procedure is described as follows: initially, a certain concentration of standard gas was introduced into the gas pool at a flow rate of 2 L/min, and the process was maintained for a duration of 2 min. Subsequently, the gas inlet was closed, and the gas outlet was closed when the pressure inside the gas pool reached atmospheric pressure. Next, the spectrum of the sample gas was measured, and the average value of ten sets of spectral data was utilized as the representative spectrum for this resolution. Ultimately, a total of 30 sets of spectral data for the sample gas were acquired.

3.1.2. Experimental Data

The spectral resolution of the original data is 1 cm−1, with 208 data points per 100 cm−1 spectral range. The original spectrum is resampled with 2, 4, 8, and 16 cm−1 of spectral resolution. The data points per 100 cm−1 spectral range after resampling and the spectral resolution after resampling are shown in Table 1.
In the gas calibration storage tank, the C3H8 concentration was 209 ppm and the C2H4 concentration was 199 ppm. However, because the length of the gas pool was 0.02 m in the experiment, the actual concentration of C3H8 was 4.18 ppm*m and that of the C2H4 was 3.98 ppm*m.
The precision of quantification formula is used to evaluate the results of the gas quantitative analysis. The standard deviation (SD) is one method used to calculate the precision of quantification (meaning the degree of consistency in repeated quantitative analyses under the same conditions), shown in Equation (9):
S D = 1 N i = 1 N y i y ¯ i 2
where yi is the measured concentration, and y ¯ i is the average value of the measured concentration.
The precision of the gas concentration quantification results can also be evaluated by calculating the Allan deviation [22]. The Allan deviation was determined using Equation (10):
σ 2 ( y ) = 1 2 ( N 1 ) i = 1 N 1 y i + 1 y i 2
where yi is the gas concentration value, and N is the number of samples.

3.2. Spectrum Analysis

3.2.1. Spectral Analysis

(1)
C2H4 gas with a narrow FWHM
The quantitative analysis of C2H4 gas concentration is set at 940–970 cm−1, as shown in Figure 3. Figure 3a shows that when the spectral resolution is 1 cm−1 (from the NIST Quantitative Infrared Database), the FWHM of the C2H4 transmission spectrum is about 1.24 cm−1, which is considered a narrow FWHM.
The other standard transmission spectra at different resolutions are obtained as follows:
First, the standard absorbance spectra from the database are transformed into interferograms using Fast Fourier Transform (FFT). Next, the interferograms are truncated to obtain absorbance spectra at different resolutions. Finally, the absorbance spectra are converted into transmittance spectra using the Equation (11):
T = 10 A
where A represents absorbance and T represents transmittance.
Figure 3b shows that when using a low-resolution spectrum for quantitative gas analysis, the absorption spectrum of C2H4 is overwhelmed by the background spectrum.
We compared the synthetic background spectra at different resolutions with the measured background spectra, as shown in Figure 4. To maintain the method of controlling variables in the experiment, the same filtering parameters are adopted. The corresponding synthetic background spectrum error has been calculated using Equation (12):
E r r o r = 1 N i = 1 N ( S 1 ( i ) S a ( i ) ) 2
where Sa is the actual background spectrum, and S1 is the synthesized background spectrum.
It can be observed that the error of the synthesized background spectrum of C2H4 at high resolution is relatively small, as shown in Table 2.
(2)
C3H8 gas with a broad FWHM
The quantitative analysis of C3H8 gas concentration is set at 2900–3040 cm−1. This band partially overlaps with the water vapor absorption band, and the effect of water vapor has been deducted in the same way in the concentration inversion process, as shown in Figure 5. Figure 5a shows that when the spectral resolution is 1 cm−1 (from the NIST Quantitative Infrared Database), the FWHM of the C3H8 spectrum is about 32.32 cm−1, which is considered a broad FWHM. The transmittance spectra of C3H8 with different resolutions was obtained using the same method as above.
Figure 5b show that when there is a low-resolution spectrum, the main absorption information of the C3H8 spectrum is still clearly visible.
Due to the large amount of water vapor in the measured spectrum of the C3H8 absorption band, it is impossible to accurately obtain the measured background spectrum, which is another advantage of the synthesized background spectrum. In quantitative analyses, water vapor and C3H8 are treated as two independent gases, and the ideal background spectrum should not absorb these two gases. At this time, the ideal background spectrum can be considered a curve that approximates blackbody radiation, because the curvature at the maximum absorption point of propane is close to 0, without absorption features.
Figure 5c shows that the filtering does not completely remove the absorption features of the spectrum, which gradually weaken when observed from the maximum curvature. Therefore, we use the curvature at the maximum absorption point of C3H8 to characterize the filtering effect, as shown in Table 3. Table 3 shows that the synthetic background spectrum error is relatively small at low resolutions.

3.2.2. The Fitting Residuals of the NLLS

Figure 6 and Figure 7 show the fitting results and residual plots of the NLLS based on the synthetic background spectrum at different resolutions. Table 4 shows the standard deviation (SD) of the fitting residuals of the C2H4 and C3H8 spectra at different resolutions.
The performance of gas spectrum fitting is mainly affected by Spectral SNR. As shown in Figure 6 and Figure 7 and Table 4, the fitting performance of the C3H8 spectrum with a broad FWHM is greatly affected by the SNR, while the fitting performance of the C2H4 spectrum with a narrow FWHM is less affected by the SNR. Therefore, higher SNR is required to improve the fitting accuracy of the gas spectrum with a broad FWHM, while under certain SNR guarantees, the fitting accuracy of the gas spectrum with a narrow FWHM is similar. In this case, spectral information with high resolution is more important for the concentration inversion of gas with a narrow FWHM.

3.3. Result Analysis

First, the NLLS method based on the synthetic background spectrum (with inversion parameters shown in Table 5) is used to analyze the values of C3H8 gas and C2H4 gas concentrations under different spectral resolutions (1, 2, 4, 8, and 16 cm−1). Then, the measured mean values of the same gas are normalized. Finally, the precision value (the standard deviation and the Allan deviation) of the quantitative analysis results is calculated, as shown in Table 6 and Table 7.
The quantitative analysis precision of C3H8 gas and C2H4 gas has an inconsistent trend when the spectral resolution varies, as shown in Figure 8 and Figure 9. This is related to the linetype of the gas. As shown in Figure 8a and Figure 9a, the quantitative analysis precision for C2H4 gas with a narrow line decreases with spectral resolution. The relatively optimal spectral resolution for C2H4 gas concentration is 1 cm−1, where the standard deviation is only 0.492 and the Allan deviation is only 0.256. As shown in Figure 8b and Figure 9b, the quantitative analysis precision for C3H8 gas with a broad line increases when spectral resolution decreases. The relatively optimal spectral resolution for C3H8 gas is 16 cm−1, where the standard deviation is only 0.691 and the Allan deviation is only 0.015.
In short, spectral resolution affects the quantitative analysis of gas concentration in OP-FTIR spectrometers by impacting SNR, the synthetic background spectrum, and the NLLS fitting process.

4. Discussion

Based on the experimental method and results, a more detailed and comprehensive discussion on the impact of infrared spectral resolution is provided as follows:
For a gas spectrum with a broad FWHM, the gas concentration information in the spectrum can still be well preserved at lower resolutions. In addition, lower spectral resolution produces a relatively higher SNR. Therefore, low resolution is beneficial for synthesizing the background spectrum and NLLS fitting of the gas spectrum with a broad FWHM, thus improving the accuracy of gas concentration quantification analysis. However, the spectral resolution cannot be reduced without limitation, as excessively low-resolution spectra may mask gas absorption features and thereby affect the accuracy of the quantification analysis.
For a gas spectrum with a narrow FWHM, the gas concentration information in the spectrum may be significantly lost or distorted at lower resolutions. Furthermore, the SNR has a relatively small impact on the NLLS fitting process for gas spectra with a narrow FWHM, but high-resolution spectra of gas with a narrow FWHM carry more spectral information and are very helpful for synthesizing the background spectrum. Therefore, high-resolution spectra are beneficial for improving the accuracy of gas with a narrow FWHM concentration quantification analysis.

5. Conclusions

In summary, when employing the non-linear least squares (NLLS) method based on a synthetic background for open-path Fourier Transform Infrared (OP-FTIR) spectroscopy, quantitative analysis results tend to be more accurate and reliable for gas with a narrow FWHM at high resolutions and gas with a broad FWHM at low resolutions. This observation is crucial for researchers and practitioners working with OP-FTIR spectrometers, as it highlights the importance of considering the FWHM of the gas spectrum when conducting quantitative analyses. By taking into account the characteristics of the gas spectrum, including the width of the absorption lines, users can make informed decisions about the optimal spectral resolution settings for their specific application. This, in turn, can lead to more accurate quantification of target compounds and a better understanding of the chemical species being analyzed.
Future research should continue to investigate the interplay between spectral resolution, the FWHM of gas spectra, and quantitative analysis methods in OP-FTIR spectroscopy. This will enable the development of more advanced algorithms and strategies for optimizing the performance of OP-FTIR systems, ultimately contributing to the enhanced sensitivity, specificity, and applicability of this powerful analytical technique across various environmental and industrial applications.

Author Contributions

Y.Q.: conceptualization, investigation, methodology, writing—original draft, and writing—review, and editing. J.T.: writing—review and editing. X.H.: investigation. X.L.: investigation. M.G.: writing—review and editing. All authors have read and agreed to the published version of the manuscript.

Funding

This work was supported by the National Key Research and Development Project of China (grant nos. 2022YFC3700503 and 2022YFB2602002); the National Natural Science Foundation of China (grant no. 42075135); key research and development projects in Anhui Province (grant nos. 202104a05020026 and 2022l07020023); and key research and development projects in Zhejiang Province (grant no. 2021C03165).

Informed Consent Statement

Not applicable.

Data Availability Statement

Not applicable.

Conflicts of Interest

The authors declare no conflict of interest.

References

  1. Heise, H.M.; Müller, U.; Gärtner, A.G.; Hölscher, N. Improved chemometric strategies for quantitative FTIR spectral analysis and applications in atmospheric open-path monitoring. Field Anal. Chem. Technol. 2001, 5, 13–28. [Google Scholar] [CrossRef]
  2. Chang, P.-E.P.; Yang, J.-C.R.; Den, W.; Wu, C.-F. Characterizing and locating air pollution sources in a complex industrial district using optical remote sensing technology and multivariate statistical modeling. Environ. Sci. Pollut. Res. 2014, 21, 10852–10866. [Google Scholar] [CrossRef] [PubMed]
  3. Sung, L.-Y.; Lu, C.-J. A single-beam titration method for the quantification of open-path Fourier transform infrared spectroscopy. J. Quant. Spectrosc. Radiat. Transf. 2014, 145, 43–49. [Google Scholar] [CrossRef]
  4. Shao, L.; Wang, W.; Griffiths, P.R.; Leytem, A.B. Increasing the Quantitative Credibility of Open-Path Fourier Transform Infrared (FT-IR) Spectroscopic Data, with Focus on Several Properties of the Background Spectrum. Appl. Spectrosc. 2013, 67, 335–341. [Google Scholar] [CrossRef]
  5. Song, Q.-W.; Guo, M.-Q.; Shao, L.-M. Improving Quantitative Accuracy of Ammonia from Open-Path Fourier Transform Infrared Spectroscopy by Incorporating Actual Spectra into Synthetic Calibration Set of Partial Least Squares Regression. Chin. J. Anal. Chem. 2020, 48, e20089–e20097. [Google Scholar] [CrossRef]
  6. Lin, C.-H.; Grant, R.H.; Heber, A.J.; Johnston, C.T. Application of open-path Fourier transform infrared spectroscopy (OP-FTIR) to measure greenhouse gas concentrations from agricultural fields. Atmos. Meas. Tech. 2019, 12, 3403–3415. [Google Scholar] [CrossRef]
  7. Luo, S.; Tian, J.; Liu, Z.; Lu, Q.; Zhong, K.; Yang, X. Rapid determination of styrene-butadiene-styrene (SBS) content in modified asphalt based on Fourier transform infrared (FTIR) spectrometer and linear regression analysis. Measurement 2020, 151, 107204. [Google Scholar] [CrossRef]
  8. Wu, Y.; Peng, S.; Xie, Q.; Xu, P. Nonlinear least squares with local polynomial interpolation for quantitative analysis of IR spectra. Spectrochim. Acta Part A Mol. Biomol. Spectrosc. 2019, 206, 147–153. [Google Scholar] [CrossRef]
  9. Lin, C.-H.; Grant, R.H.; Heber, A.J.; Johnston, C.T. Sources of error in open-path FTIR measurements of N2O and CO2 emitted from agricultural fields. Atmos. Meas. Tech. 2020, 13, 2001–2013. [Google Scholar] [CrossRef]
  10. Byrne, B.; Strong, K.; Colebatch, O.; You, Y.; Wunch, D.; Ars, S.; Jones, D.B.A.; Fogal, P.; Mittermeier, R.L.; Worthy, D.; et al. Monitoring Urban Greenhouse Gases Using Open-Path Fourier Transform Spectroscopy. Atmos.-Ocean 2020, 58, 25–45. [Google Scholar] [CrossRef]
  11. Ticová, B.; Novotný, K.; Kanický, V. Comparison of different spectral resolution ICP-OES spectrometers for the determination of rare earth elements. Chem. Pap. 2019, 73, 2913–2921. [Google Scholar] [CrossRef]
  12. Lu, B.; Wang, X.; Liu, N.; Hu, C.; Dong, J.; Li, Y.; Li, H.; Xiong, Z.; Tang, X. Prediction performance optimization of different resolution and spectral band ranges for characterizing coco-peat substrate available nitrogen. J. Soils Sediments 2021, 21, 2672–2685. [Google Scholar] [CrossRef]
  13. Wang, N.; Ye, S.-F.; Min, S.-G.; Han, C.; Huang, Y. Comparison of the models of mixed liquid samples under different near-infrared spectral resolutions. Spectrosc. Spectr. Anal. 2009, 29, 1813–1817. [Google Scholar]
  14. Ladan, M.K.; Straus, J.; Benković, E.T.; Kreft, S. FT-IR-based method for rutin, quercetin and quercitrin quantification in different buckwheat (Fagopyrum) species. Sci. Rep. 2017, 7, 7226. [Google Scholar] [CrossRef]
  15. Zhao, J.-H.; Wei, Z.-J.; Gao, M.-L.; Fang, J. Research on the influence of infrared spectral resolution on gas quantitative analysis. Spectrosc. Spectr. Anal. 2009, 29, 1813–1817. [Google Scholar]
  16. Qin, Y.; Li, X.; Han, X.; Tong, J.; Gao, M. Research on Spectral Restoration and Gas Concentration Inversion Accuracy Based on Quasi-Trapezoidal Window. Photonics 2022, 9, 885. [Google Scholar] [CrossRef]
  17. Espinoza, L.H.; Niemczyk, T.M.; Stallard, B.R. Generation of Synthetic Background Spectra by Filtering the Sample Interferogram in FT-IR. Appl. Spectrosc. 1998, 52, 375–379. [Google Scholar] [CrossRef]
  18. Smith, T.E.L.; Wooster, M.J.; Tattaris, M.; Griffith, D.W.T. Absolute accuracy and sensitivity analysis of OP-FTIR retrievals of CO2, CH4 and CO over concentrations representative of “clean air” and “polluted plumes”. Atmos. Meas. Tech. 2011, 4, 97–116. [Google Scholar] [CrossRef]
  19. Paton-Walsh, C.; Smith, T.E.L.; Young, E.L.; Griffith, D.W.T.; Guérette, É.-A. New emission factors for Australian vegetation fires measured using open-path Fourier transform infrared spectroscopy–Part 1: Methods and Australian temperate forest fires. Atmos. Chem. Phys. 2014, 14, 11313–11333. [Google Scholar] [CrossRef]
  20. Phillips, F.A.; Naylor, T.; Forehead, H.; Griffith, D.W.T.; Kirkwood, J.; Paton-Walsh, C. Vehicle Ammonia Emissions Measured in An Urban Environment in Sydney, Australia, Using Open Path Fourier Transform Infra-Red Spectroscopy. Atmosphere 2019, 10, 208. [Google Scholar] [CrossRef]
  21. Griffith, D.W.T.; Deutscher, N.M.; Caldow, C.; Kettlewell, G.; Riggenbach, M.; Hammer, S. A Fourier transform infrared trace gas and isotope analyser for atmospheric applications. Atmos. Meas. Tech. 2012, 5, 2481–2498. [Google Scholar] [CrossRef]
  22. Liu, J.; Li, X.; Yang, Y.; Wang, H.; Wu, Y.; Lu, X.; Chen, M.; Hu, J.; Fan, X.; Zeng, L.; et al. An IBBCEAS system for atmospheric measurements of glyoxal and methylglyoxal in the presence of high NO2 concentrations. Atmos. Meas. Tech. 2019, 12, 4439–4453. [Google Scholar] [CrossRef]
Figure 1. The working principle of the OP-FTIR.
Photonics 10 00475 g001
Figure 2. The experimental equipment diagram of the OP-FTIR.
Photonics 10 00475 g002
Figure 3. (a) The standard transmittance spectrum of C2H4 with different resolutions; (b) the measured spectrum of C2H4 with different resolutions.
Photonics 10 00475 g003
Figure 4. (a) the synthetic background spectrum of C2H4 at 1 cm−1 when the number of smoothening points is 5 and the number of filtering times is 700; (b) the synthetic background spectrum of C2H4 at 2 cm−1 when the number of smoothening points is 5 and the number of filtering times is 700; (c) the synthetic background spectrum of C2H4 at 4 cm−1 when the number of smoothening points is 5 and the number of filtering times is 700; (d) the synthetic background spectrum of C2H4 at 8 cm−1 when the number of smoothening points is 5 and the number of filtering times is 700; (e) the synthetic background spectrum of C2H4 at 16 cm−1 when the number of smoothening points is 5 and the number of filtering times is 700.
Photonics 10 00475 g004
Figure 5. (a) The standard transmittance spectrum of C3H8 with different resolutions; (b) the measured spectrum of C3H8 with different resolutions; (c) the synthetic background spectrum of C3H8 at different resolutions when the number of smoothening points is 9 and the number of filtering times is 100.
Photonics 10 00475 g005
Figure 6. (a) the fitted C2H4 spectral result and its residual at 1 cm−1; (b) the fitted C2H4 spectral result and its residual at 2 cm−1; (c) the fitted C2H4 spectral result and its residual at 4 cm−1; (d) the fitted C2H4 spectral result and its residual at 8 cm−1; and (e) the fitted C2H4 spectral result and its residual at 16 cm−1.
Photonics 10 00475 g006
Figure 7. (a) the fitted C3H8 spectral result and its residual at 1 cm−1; (b) the fitted C3H8 spectral result and its residual at 2 cm−1; (c) the fitted C3H8 spectral result and its residual at 4 cm−1; (d) the fitted C3H8 spectral result and its residual at 8 cm−1; and (e) the fitted C3H8 spectral result and its residual at 16 cm−1.
Photonics 10 00475 g007aPhotonics 10 00475 g007b
Figure 8. (a) The standard deviation of C2H4 concentration with different spectral resolutions; (b) the standard deviation of C3H8 concentration with different spectral resolutions.
Photonics 10 00475 g008
Figure 9. (a) The Allan deviation of C2H4 concentration with different spectral resolutions; (b) the Allan deviation of C3H8 concentration with different spectral resolutions.
Photonics 10 00475 g009
Table 1. Spectral resolution and data points after resampling.
Spectral resolution (cm−1)124816
Per 100 cm−1 spectral range contains data points208104522613
Table 2. The error of the synthetic background spectrum of C2H4.
Spectral resolution (cm−1)124816
Error21.1924.4235.9643.03101.76
Table 3. The error of the synthetic background spectrum of C3H8.
Spectral resolution (cm−1)124816
Curvature7.181.120.100.0300.00038
Table 4. The SD of the fitting residuals of the C2H4 and C3H8 spectra at different resolutions.
TypeResolution
124816
C2H40.191%0.142%0.112%0.083%0.066%
C3H82.221%1.522%0.891%0.576%0.399%
Table 5. Inversion parameters in quantitative analysis.
Parameter TypeTemperaturePressureField of ViewApodization FunctionResolution
Parameter valueT = 298.15 K101.325 kPa28 mradTriangular1, 2, 4, 8, 16 cm−1
Table 6. The standard deviation of quantitative analysis results under different spectral resolutions.
TypeResolution
124816
C2H40.4920.5940.8361.2651.458
C3H80.7970.7790.7630.7150.691
Table 7. The Allan deviation of quantitative analysis results under different spectral resolutions.
TypeResolution
124816
C2H40.2560.3180.5771.1421.551
C3H80.2510.2070.0920.0240.015
Disclaimer/Publisher’s Note: The statements, opinions and data contained in all publications are solely those of the individual author(s) and contributor(s) and not of MDPI and/or the editor(s). MDPI and/or the editor(s) disclaim responsibility for any injury to people or property resulting from any ideas, methods, instructions or products referred to in the content.

