3.1. Consideration of Rayleigh Criterion in Super-Resolution Technology Based on Speckle Interferometry by Simulation
3.1.1. Consideration of the Case Where the Two Light Sources do Not Exceed the Rayleigh Criterion
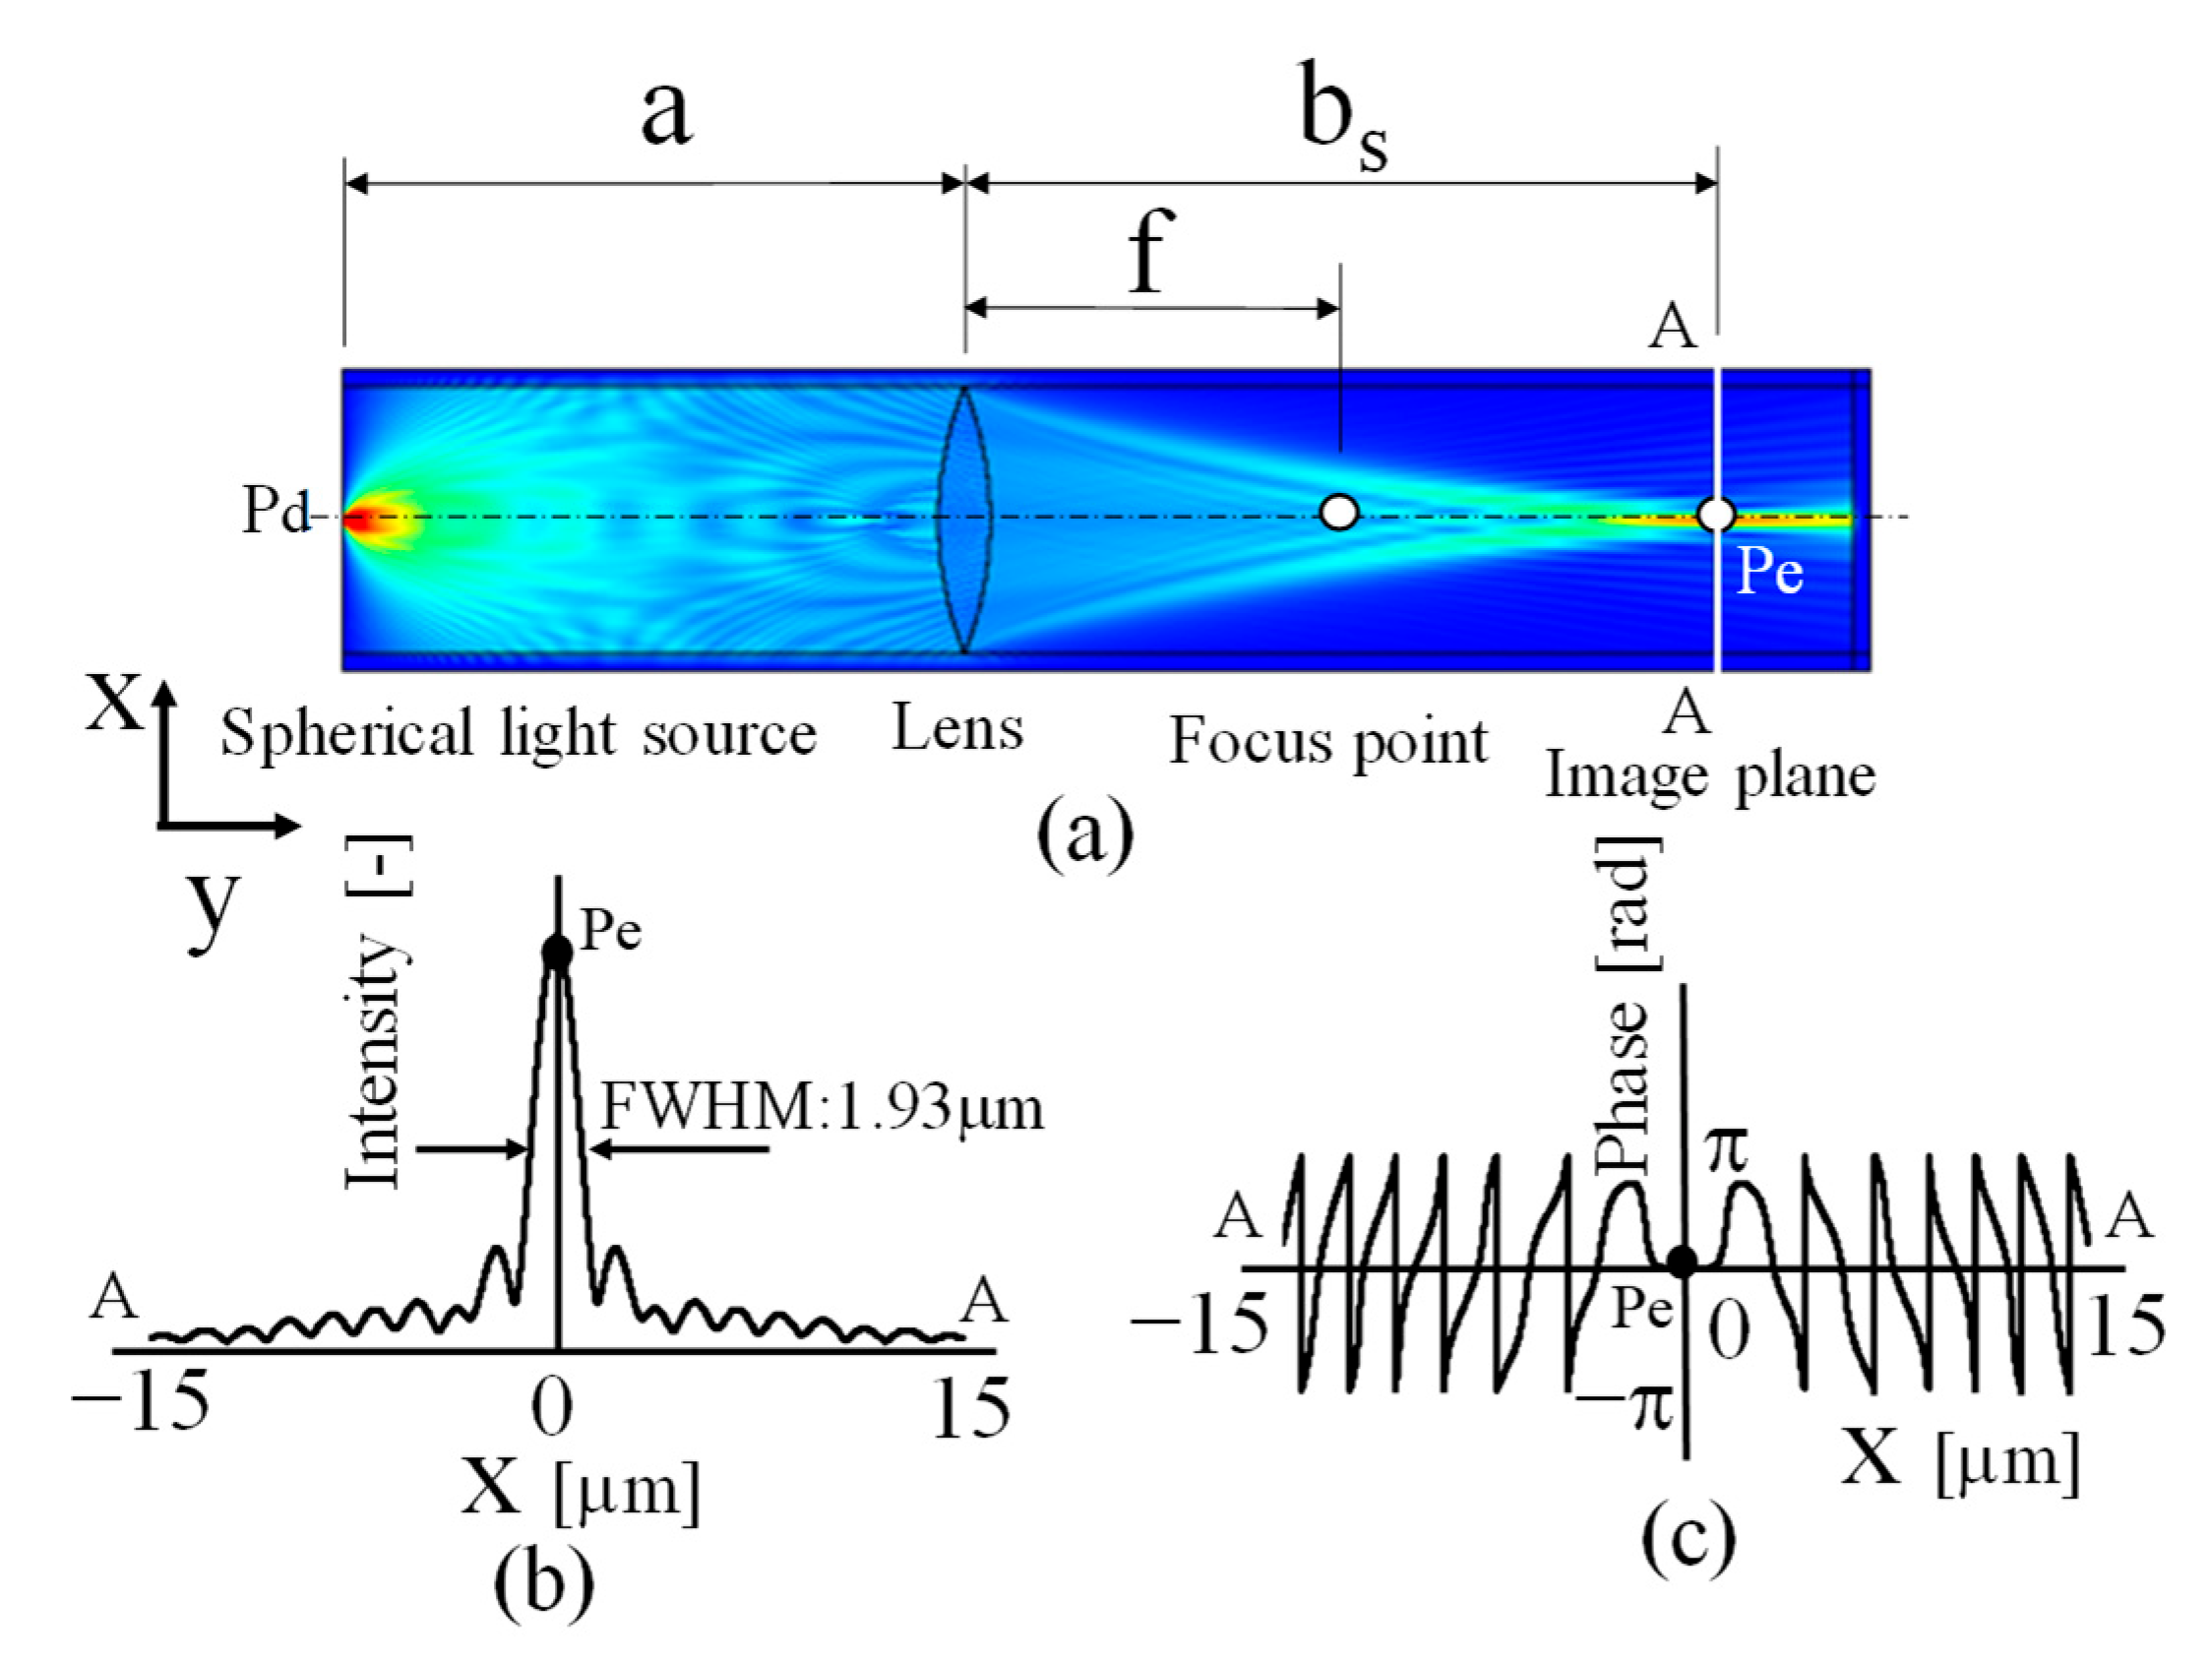
The spherical wave light source located on the optical axis on the left wall of the model shown in
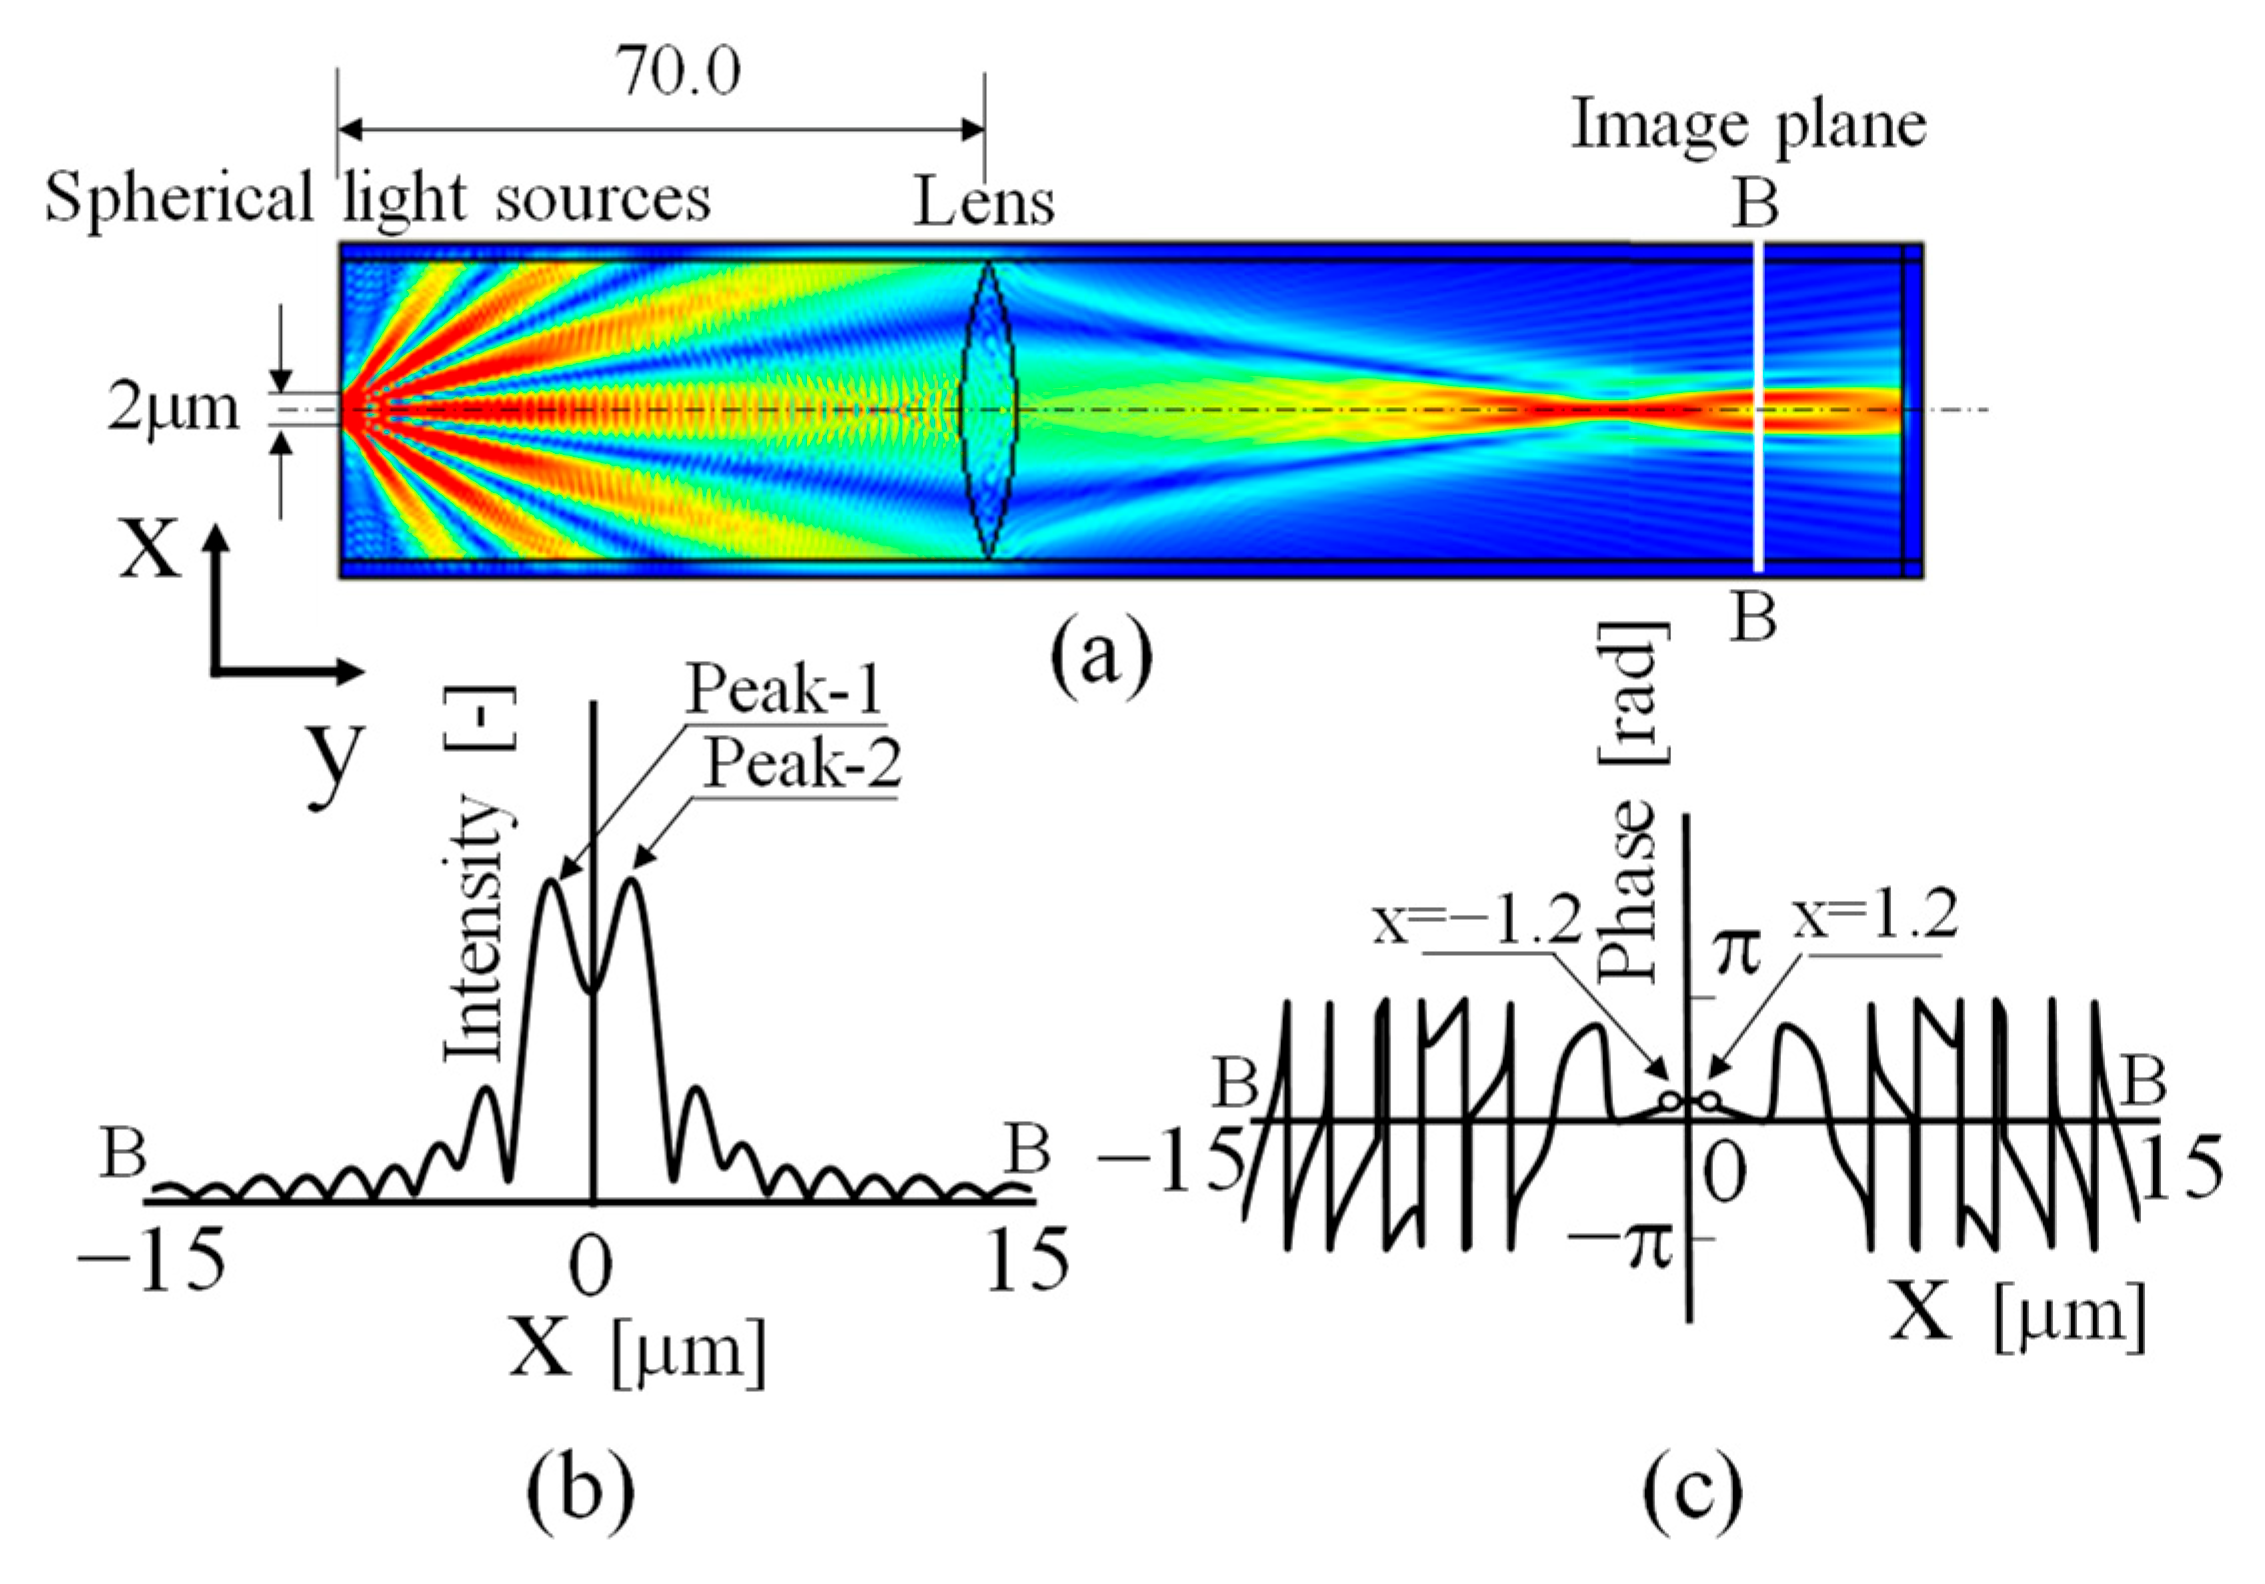
Figure 4a was newly replaced on the left wall as a spherical wave light source symmetrical to the optical axis separated by 2 μm across the optical axis with the same phase. The electromagnetic field intensity distribution when light is emitted from the two light sources is shown in
Figure 5a. The intensity and phase distributions on the imaging plane in this case are shown in
Figure 5b,c.
The distance between the light sources was 2 μm, and the diffraction limit of the optics was 877 nm, which means that the two light sources are set at positions that do not exceed the Rayleigh criterion. As a result, spherical wave beams from two points 2 μm apart interfere, and Young’s fringes [
1,
2] are formed in the intensity distribution, as is generally well known. In the B-B section of the imaging plane, as shown in
Figure 5b, although the intensity distributions are not completely separated, the two peaks can be observed because they do not exceed the Rayleigh criterion. It can also be clearly observed that the zeroth-order and ±first-order light of the Young’s fringes pass through the lens aperture and are focused at the image formation plane. The phase distribution on the imaging plane in this case is shown in
Figure 5c.
When looking at the nearby optical axis in
Figure 5c, the phase difference between the two light sources at x = −1.2 and x = 1.2 as the confocal where the light sources are set up was 0 rad, because the initial phases of the two spherical wave light sources set up in
Figure 5a were both 0 rad.
That is, light from two spherical wave light sources with the same phase set at a distance that does not exceed the Rayleigh criterion can be considered not only as two light sources in terms of the intensity distribution on the image plane but also as the same phase in terms of phase distribution. This means that when considering the Rayleigh criterion in super-resolution technology based on speckle interferometry using coherent light as a light source, it is necessary not only to discuss the intensity distribution but also to investigate the phase distribution in detail, which has not been sufficiently investigated in the past.
3.1.2. Consideration of the Case where Light Sources Are Located at a Proximity Distance Exceeding the Rayleigh Criterion
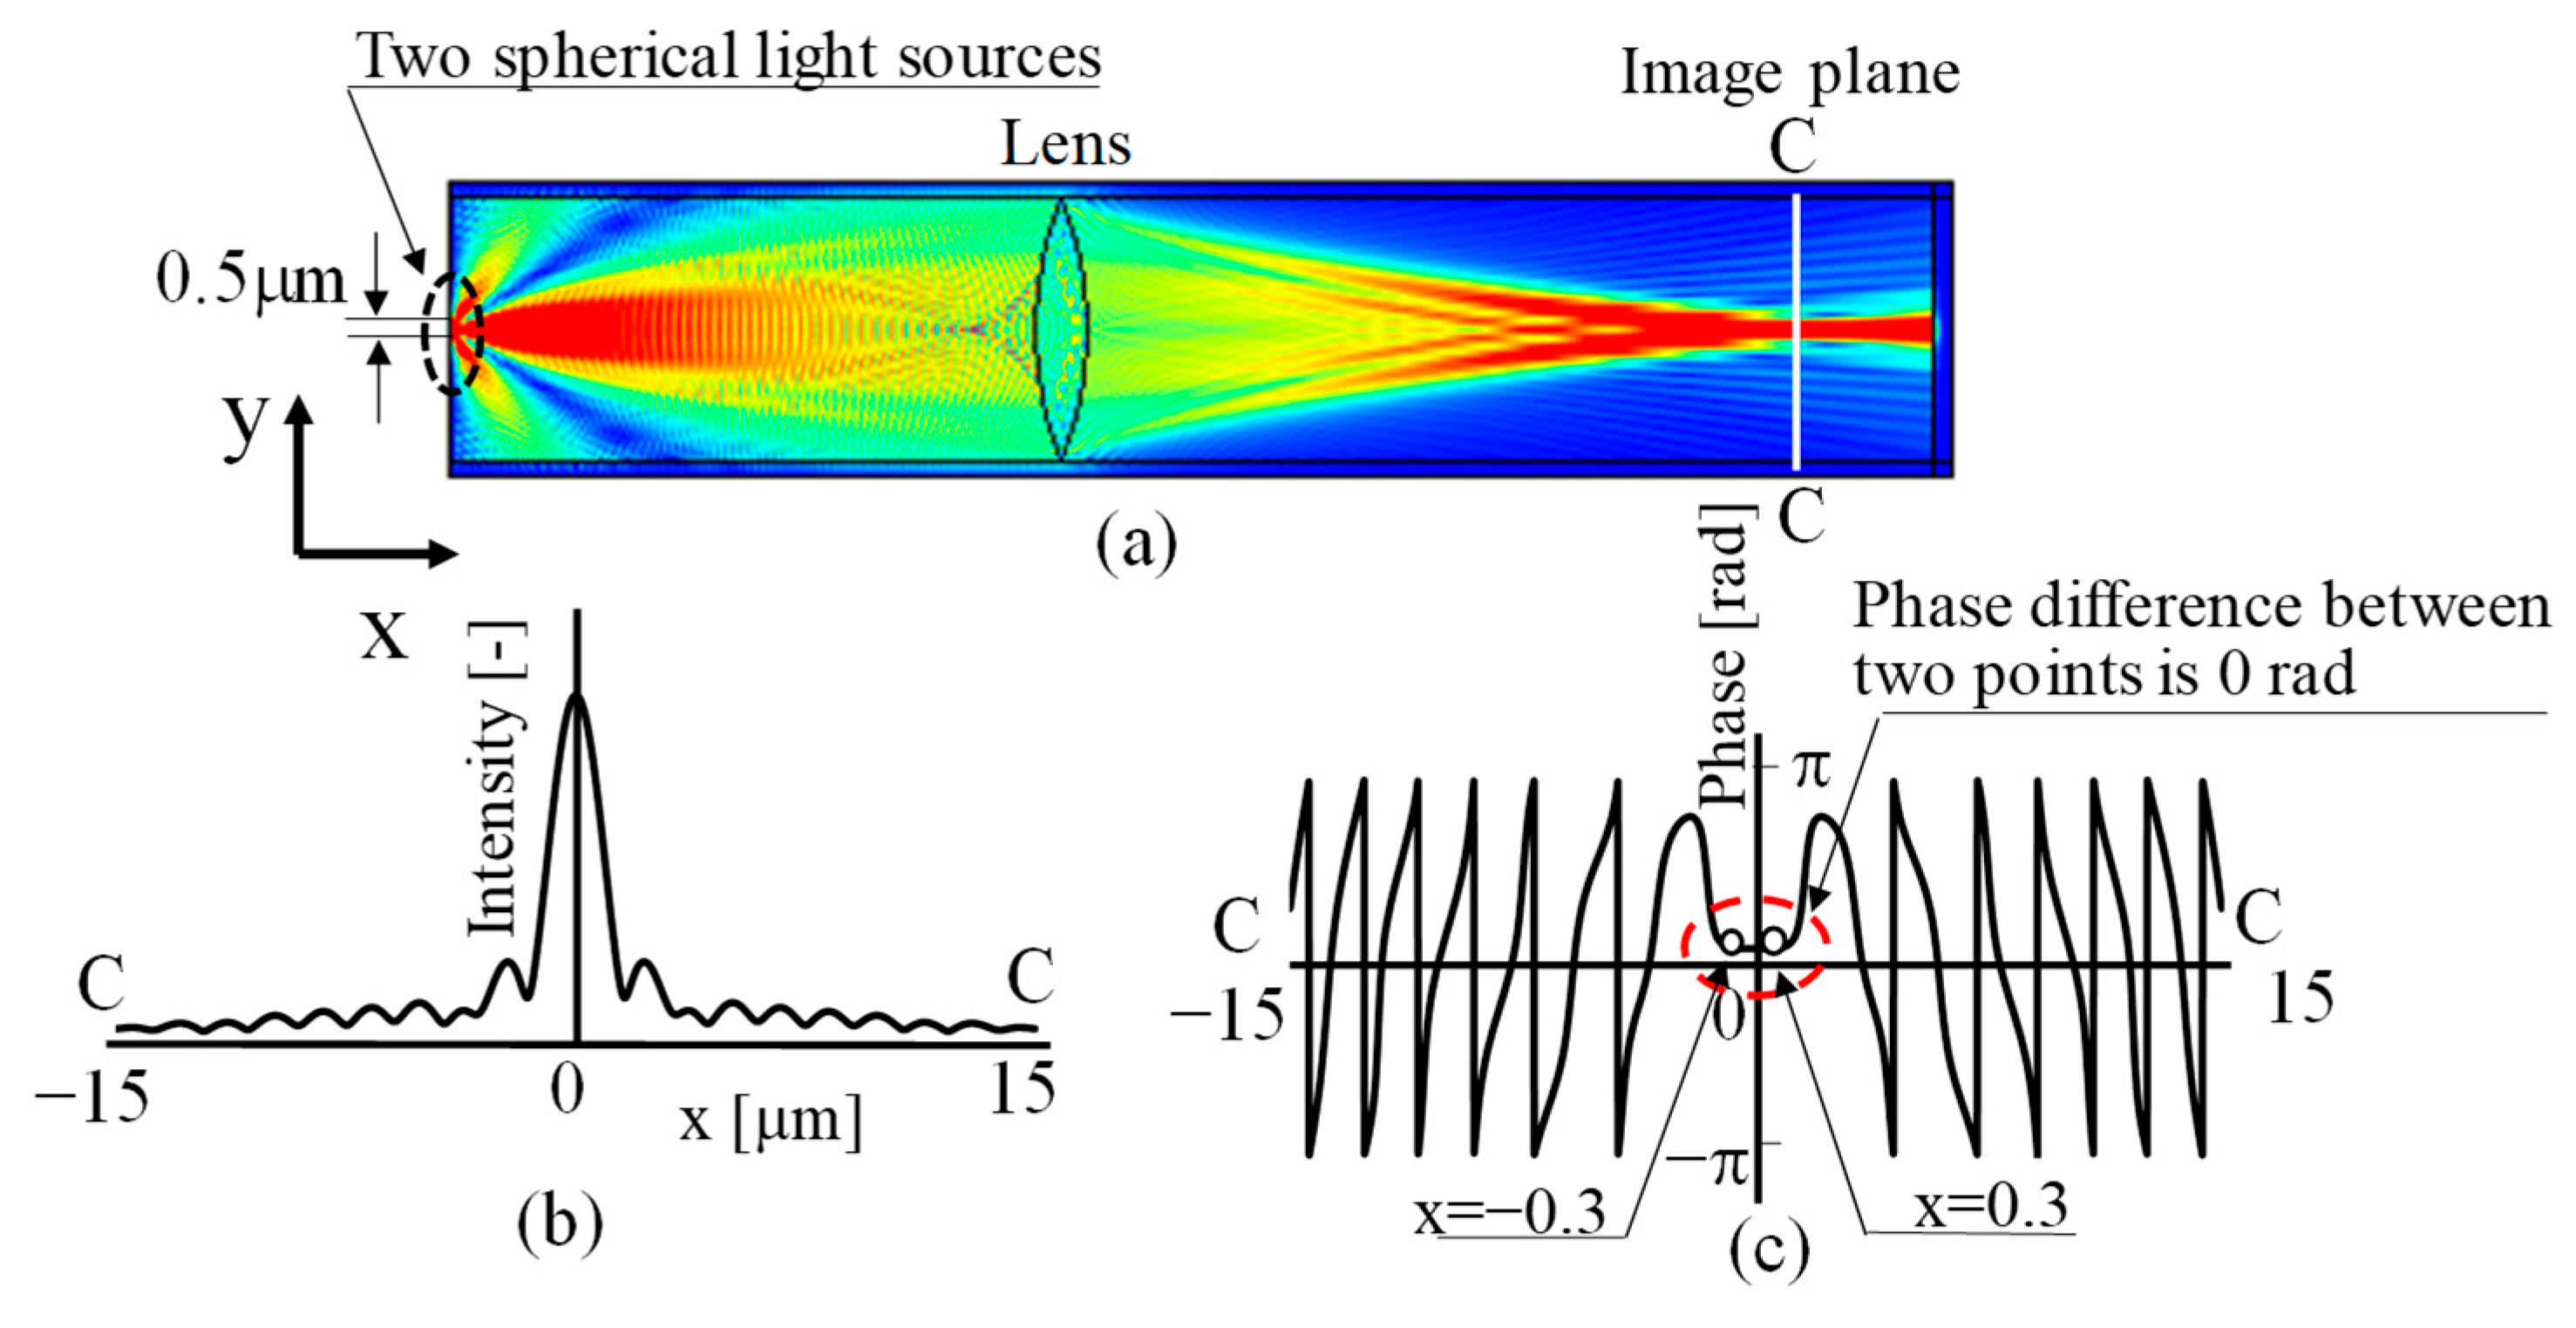
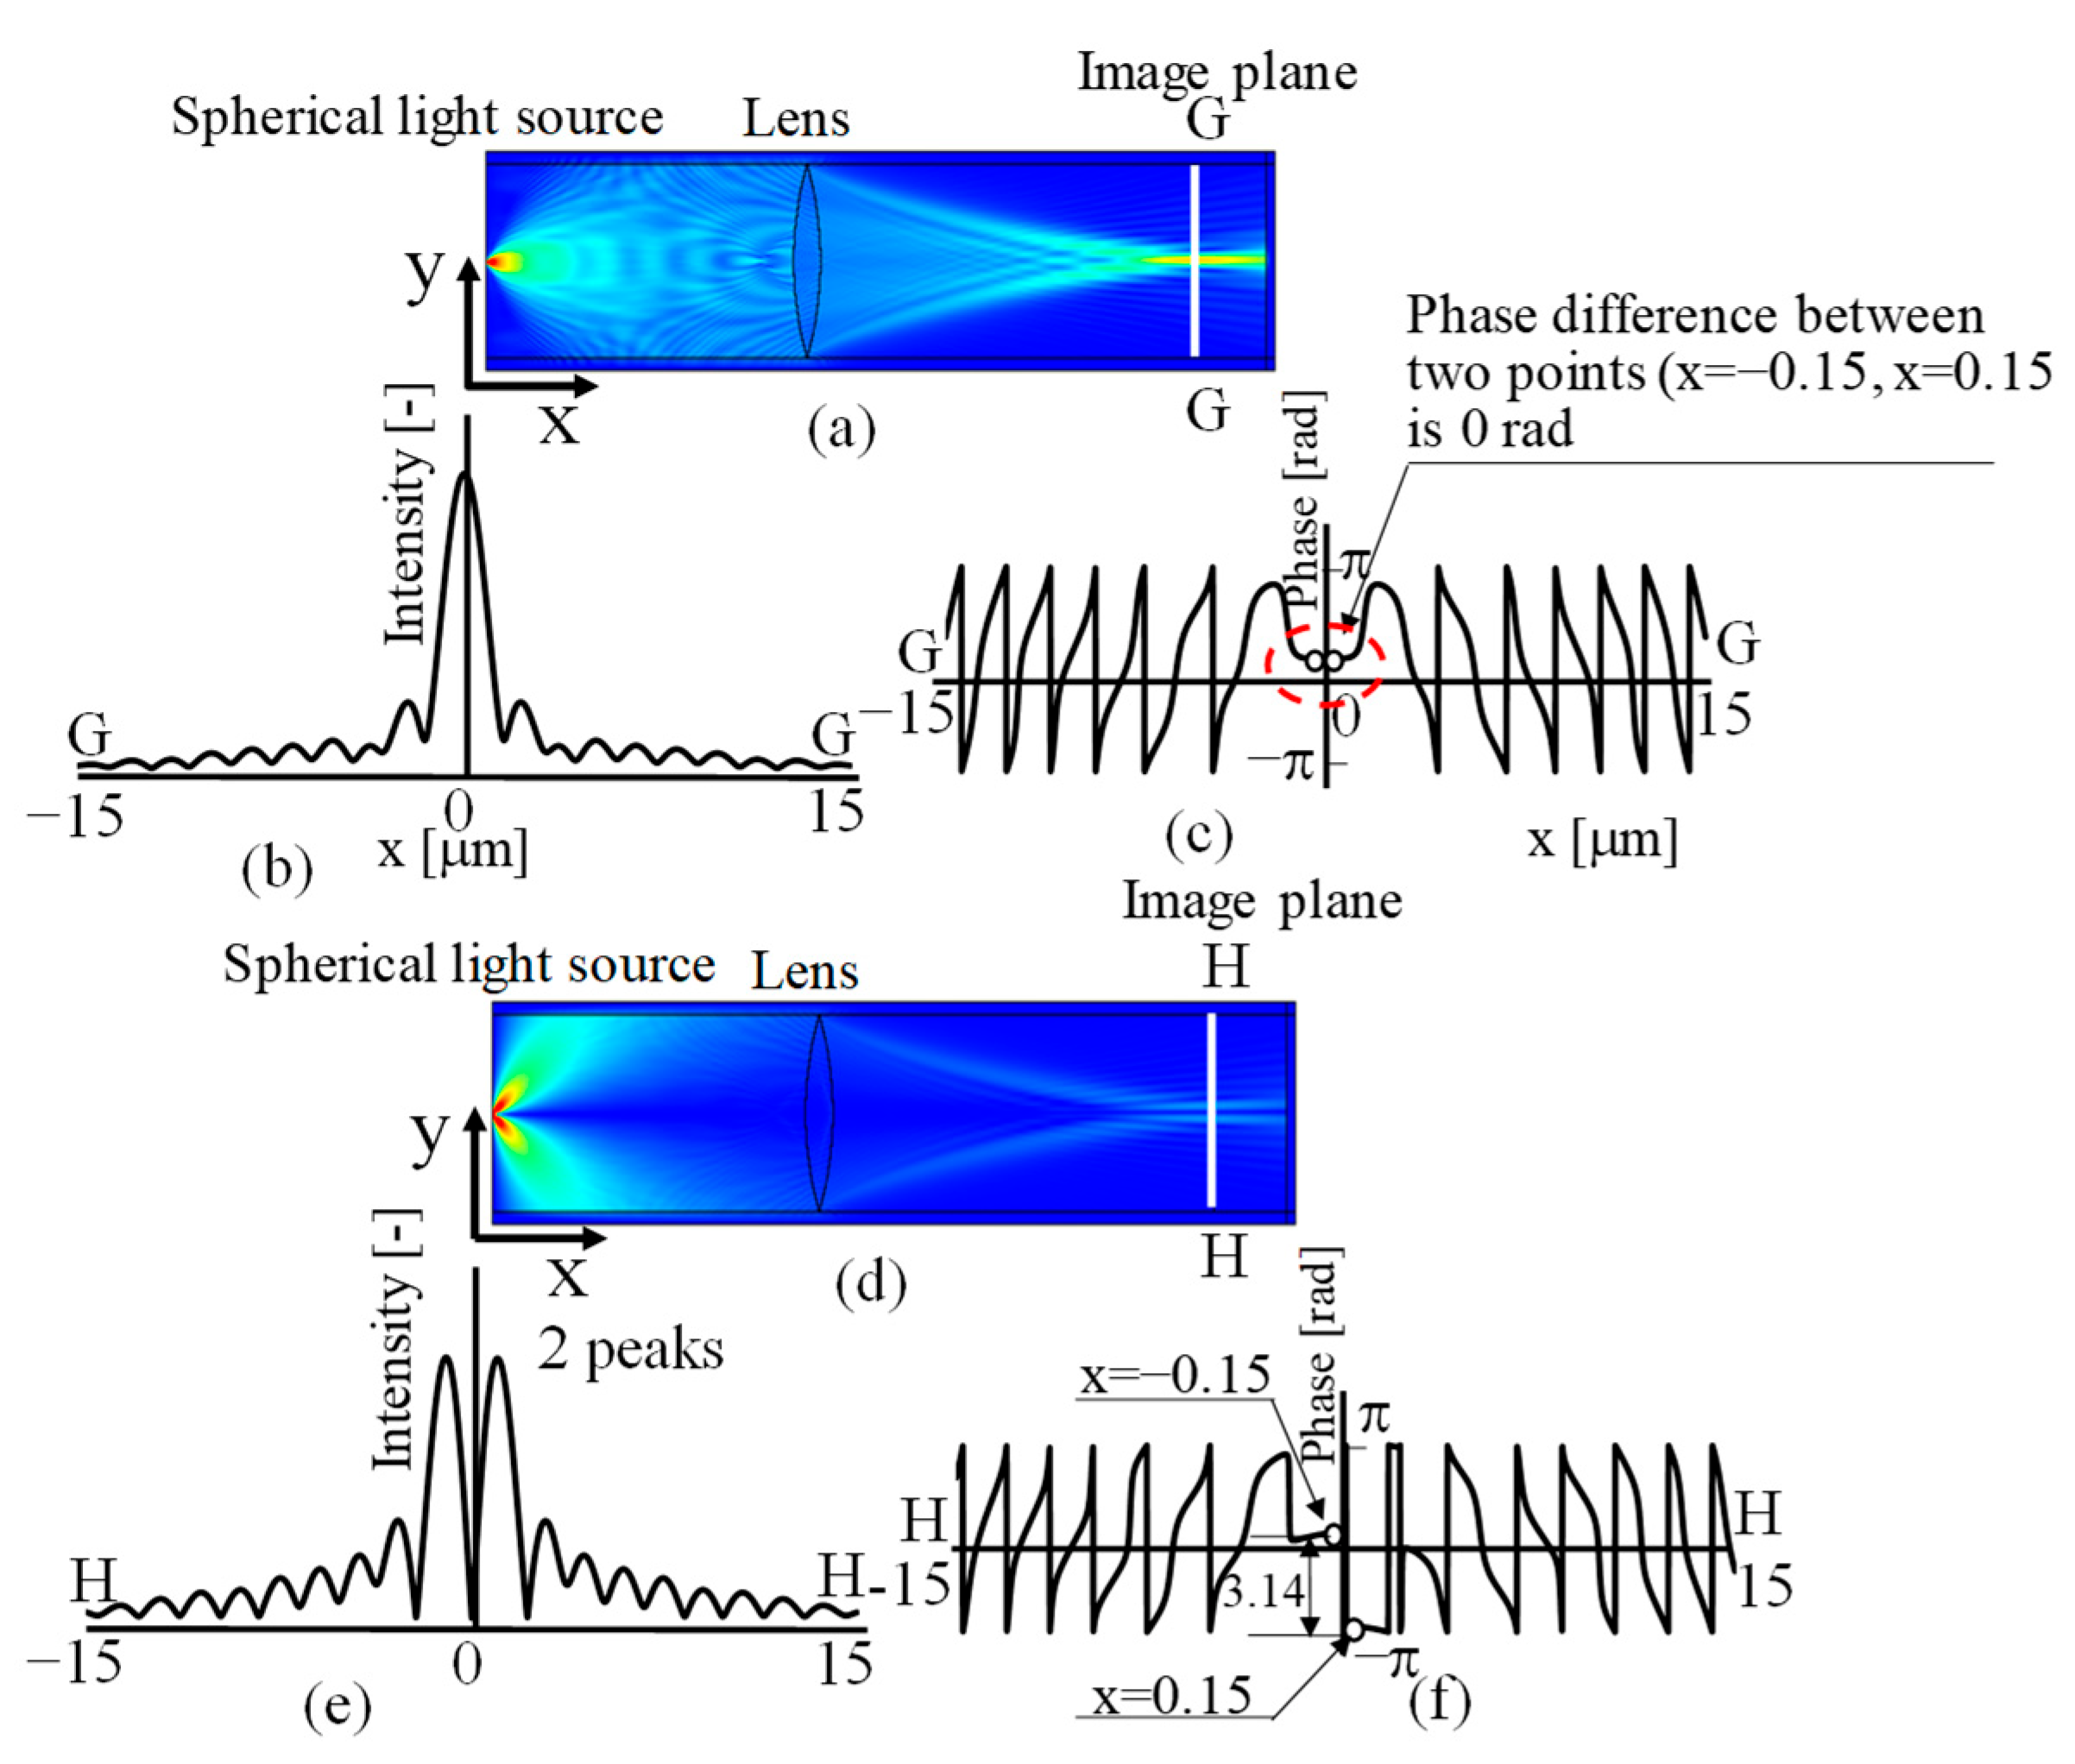
Next, the case when the Rayleigh criterion in the earlier section is not exceeded occurred, and the distance between two spherical wave sources decreased from 2 μm specified in
Figure 5 to 0.5 μm, as illustrated in
Figure 6a.
Figure 6a shows that as the distance between the two light sources becomes closer, the ±first-order light of the Young’s fringes spreads out greatly to the left and right, clearly not passing through the lens aperture, and only the zeroth-order light passes through the lens and is focused at the image formation position. As a result, the intensity distribution on the imaging plane when emitting light from two points simultaneously, as shown in
Figure 6b, cannot be observed as two separate light sources, even though the light was emitted separately from each of the two points. Instead, it is observed as a single peak with a maximum value near the centre between the peaks of the separately emitted lights. That is, the well-known phenomenon based on the Rayleigh criterion can be observed [
1,
2].
In this case, since the initial phase of the light source placed as a spherical wave source was set at the same value as 0 rad for both light sources, the phase difference of the observed light was 0 rad at the two points x = −0.3 and x = 0.3 close to the nearby axis surrounded by the red dashed line, as shown in
Figure 6c.
It is considered that the phase difference corresponding to the initial phase of the two light sources is detected between the confocal points of the two light sources installed as the measurement object, as shown in
Figure 5, on the image formation plane of the two light sources placed at a distance closer than the Rayleigh criterion. This means that when the diffraction limit based on the Rayleigh criterion is exceeded, the phase of the two light sources can be detected as the phase difference between the two points, although the intensity distribution can only be confirmed as a single point due to diffraction phenomena.
Thus, it can be understood that according to the traditional Rayleigh-criterion-based approach, imaging the shape of a measured object structure is a process based on intensity distribution, and therefore, due to phenomena caused by diffraction, it is not possible to observe microstructures beyond the diffraction limit using imaging techniques.
However, by treating the phase distribution and especially the phase difference between two light sources, it is possible to analyse the phase of light from each point, even if they are two points in close proximity, and there is a possibility that the shape of the measurement object can be reconstructed.
3.1.3. Consideration of Different Initial Phases of Light Sources Located at Close Proximity Distances Exceeding the Rayleigh Criterion
The difference between the experimental conditions based on super-resolution technology based on speckle interferometry and the simulation conditions when dealing with light from light sources of the same phase, as described in the previous section, is discussed next.
In the super-resolution technique based on speckle interferometry, when observing a microstructure, reflected light with a different phase is reflected from each point on the surface of the measured object, depending on the shape of the microstructure, and this reflected light is analysed.
However, the simulation in the previous section differs in that the light sources in close proximity have the same phase.
In this study, it was considered that the reflected light with different phases plays an important role in realising high resolution beyond the Rayleigh criterion in super-resolution technology based on the speckle interferometry technique.
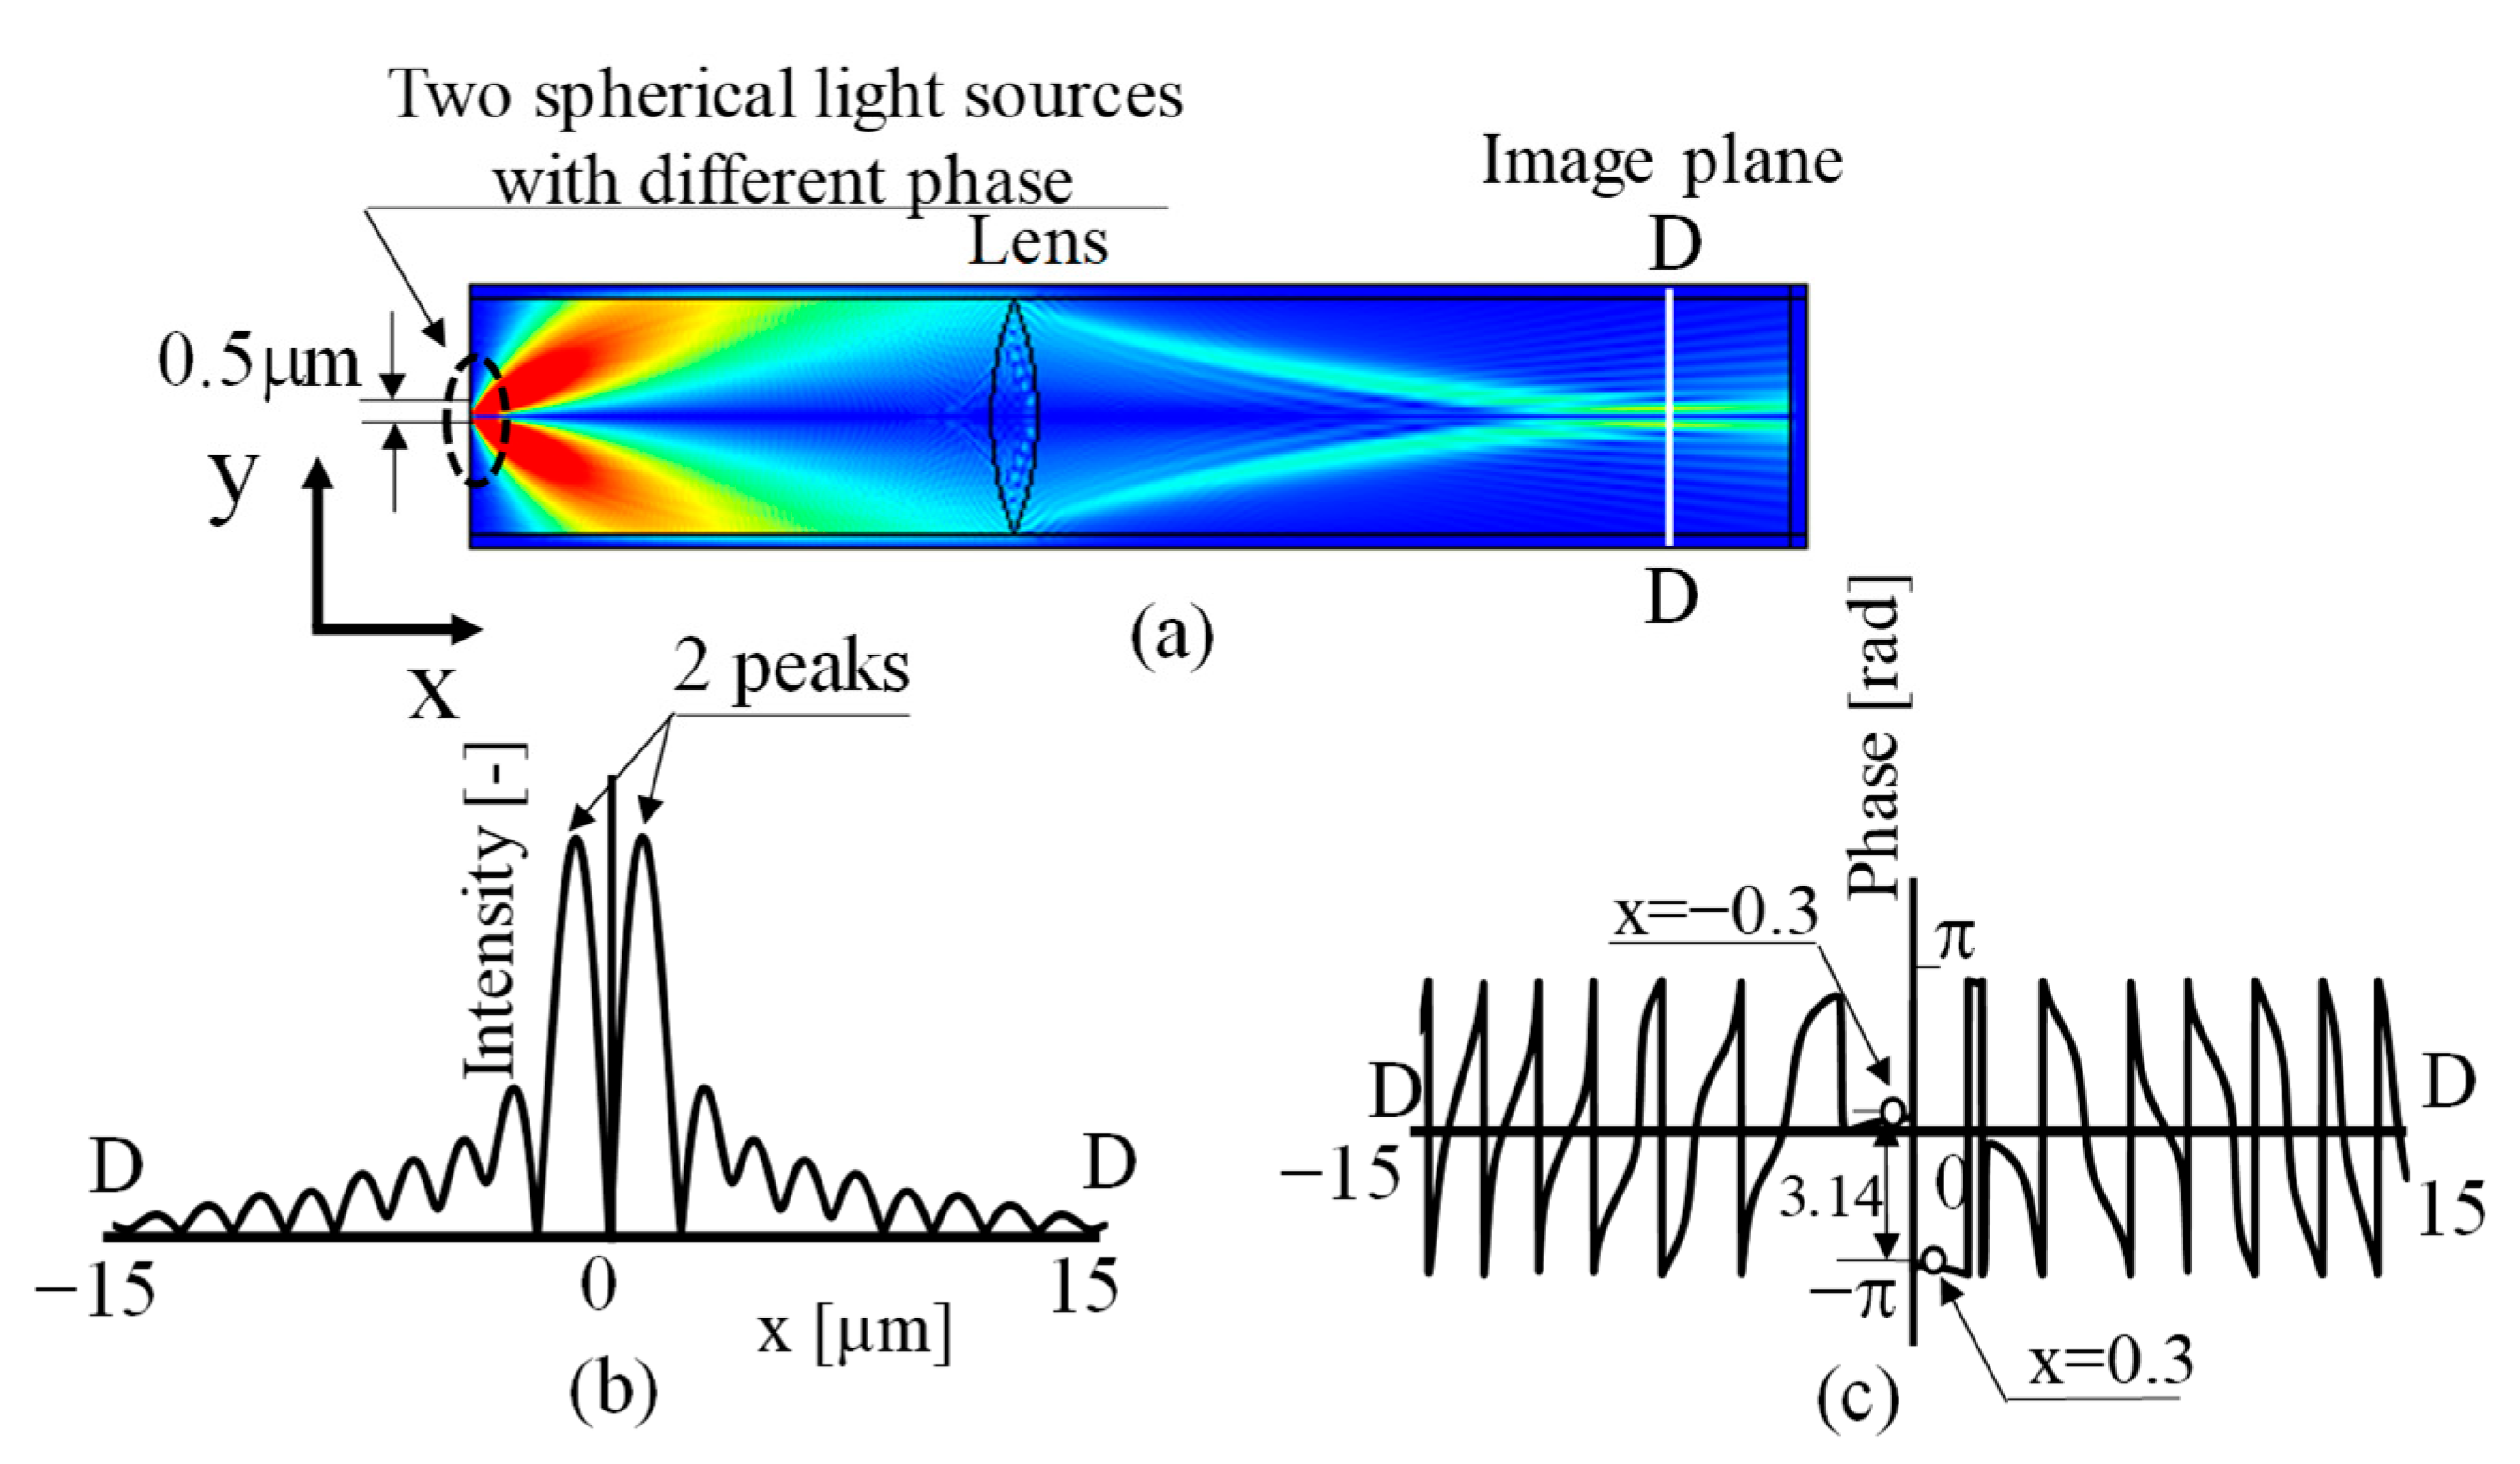
Therefore, different from
Figure 6, the initial phases of the two light sources were set as 0 rad and π rad, and the phase on the image formation plane was examined next when the distance between two points was set at 0.5 μm, as in
Figure 6. The results are shown in
Figure 7.
Comparing the electromagnetic field intensity distribution in
Figure 7a with the result in
Figure 6a, it can be seen that the phase of the intensity distribution reversed and the intensity of light near the optical axis weakened.
It can also be seen that the intensity of light in the diagonal directions, where the existence of intensity could not be observed in
Figure 6a, became stronger. Since the initial phase differs by π rad between the two light sources, it is a natural result that the zeroth-order and ±first-order phases of Young’s fringes in
Figure 6a change by π rad. As a result, light with strong intensity in the space between the zeroth- and ±first-order light in
Figure 6a is considered to be generated, as shown in
Figure 7a. In short, it can be understood that the separation of the two image points is due to destructive interference between the two images, as already suggested by microsphere-assisted microcopy [
16,
17].
With this change in the direction of light, there is light that passes through the lens aperture, which did not exist in the in-phase case. This is thought to be the phenomenon of two bright spots on the image formation plane. In this case, when the light in this new direction is observed as an intensity distribution on the imaging plane, two intensity peaks can be observed near the optical axis, as shown in
Figure 7b. Detailed observation of this phenomenon in
Figure 7a shows that light emitted from the two points forms interference fringes known as Young’s fringes and that the phase of the fringes is inverted and divided into two directions (upper and lower). Next, a part of the light from each of the two directions passes through the lens and reaches the image plane, forming two peaks as the intensity distribution. That is,
Figure 7a,b confirms that there are two light points at the observation point on the image formation plane.
Furthermore, when observing the nearby optical axis of the phase distribution in
Figure 7c in detail, the phase difference at the position of each white circle at x = −0.3 and x = 0.3, the confocal point of the two spherical wave light sources changed by π rad.
When the phase between the two light sources on the left wall differs by π rad, it can be confirmed that even if the two light sources are located beyond the Rayleigh criterion, the phase difference at the confocal point corresponding to the position of each light source set as the measurement object in the observed phase distribution differs by π rad. This means that even if the distance between two light sources exceeds the Rayleigh criterion, the phase difference between the light sources set up as light sources is preserved at the observation point.
This phenomenon suggests that the shape of an object can be measured beyond the diffraction limit as a phase distribution by detecting the phase at each point of the object with high resolution in super-resolution technology based on speckle interferometry technology. It can then be understood that for a phase distribution to exist, the existence of a geometrical unevenness distribution on the measured surface is required.
3.2. Experimental Verification of a Phenomenon Obtained in Simulation Results That Occurs Based on a Phase Change between Two Light Sources Located beyond the Diffraction Limit
In the simulation, it was shown that when the phases of two light sources in close proximity beyond the diffraction limit are different, the existence of the two light sources can be confirmed by detecting the phase difference between the two light sources if the light is coherent. In other words, if two light sources are based on the diffraction limit, which was thought to be impossible to confirm the existence of two points that exist beyond the Rayleigh criterion, based on the simulation results, the separation of the existence of two light sources beyond the diffraction limit is considered possible by detecting the phase difference between the two points with high resolution. Therefore, it was experimentally verified whether the phenomena based on the simulation results could occur in reality using a real optical model that was simplified as much as possible.
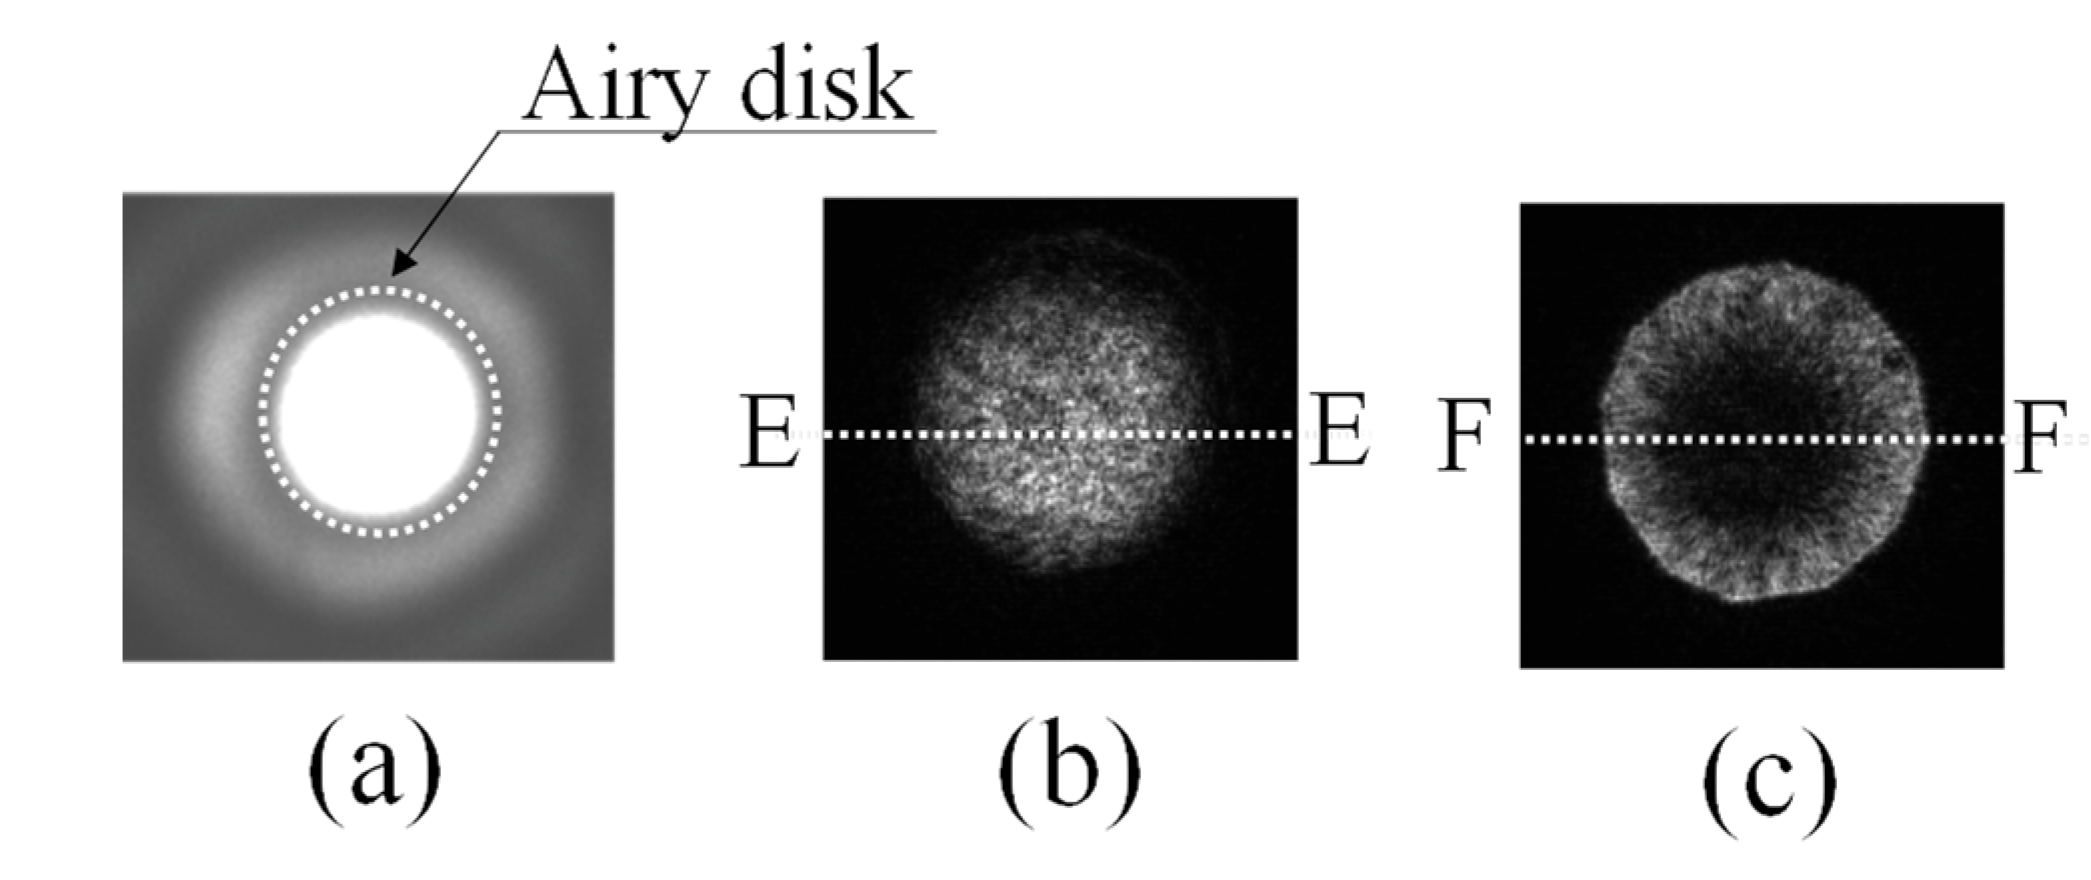
In the optical system used in the experiment, the diffracted image shown in
Figure 8a with a circular aperture, formed by a laser light source with a source wavelength of 532 nm, was used as the diffracted image model [
2] when the light source was observed using a circular lens. Two diffraction image models were prepared with light emitted from the same laser and with no phase difference between the two diffraction image models, and the two models were superimposed so that they overlapped from the left and right.
In this case, if the overlap exceeds the Airy disk, the light source is considered only one light point. The general situation regarding diffraction limits based on the well-known Rayleigh criterion [
2] arises. Furthermore, when the two lights are superimposed so that they gradually coincide spatially, the interior of the Airy disk is observed as a single bright light source because the phases of the two lights are originally equal, as shown in
Figure 8b. This is also a well-known phenomenon that generally occurs when dealing with the Rayleigh criterion [
2].
In this case, the E-E section of the intensity distribution in
Figure 8b is shown in
Figure 9a. It can be observed that the entire inner surface of the Airy disk is brightened.
Next, the phase difference between the two overlapping lights was changed to π rad by changing the optical path length of one of the lights. It could be confirmed that the bright state inside the Airy disk, as shown in
Figure 8b, changes to a dark state at the centre of the light, as shown in
Figure 8c. In this case, the intensity distribution in the F-F cross section of
Figure 8c is shown in
Figure 9b. Clearly, the central area becomes darker and the peripheral area becomes brighter, just as in
Figure 7b, which was observed in the simulation.
Thus, if the two light sources in close proximity beyond the Rayleigh criterion are coherent and the phases of the two light sources are different, experimental results confirm that the two light sources can be separated by detecting the phase difference between the two points on the image formation plane, as in the simulation results.
3.3. Influence on the Detection Phase of two Coherent Light Sources with Different Phases as the Distance between them Changes
As shown in this study, it was found that even two light sources exceeding the Rayleigh criterion can be observed as two points using phase analysis of coherent light.
In
Figure 7, two light sources 0.5 μm apart were observed. Therefore, the next case in which the two light sources are even closer to each other was discussed.
The results for the case where the distance between the two light sources is 0.25 μm are shown in
Figure 10.
Figure 10a–c shows the results when the two light sources have the same phase (0 rad). Similar to the results shown in
Figure 6, the two light sources placed beyond the diffraction limit cannot be separated. In the intensity distribution in
Figure 10b, two light sources cannot be considered as two light sources. However, in the phase distribution in
Figure 10c, it can be clearly confirmed that the phase difference between the two light sources is 0, as shown by the red dashed line.
In contrast, in
Figure 10d–f, where the phase difference between the two light sources changes to π rad, two peaks can be observed in the intensity distribution in
Figure 10e.
Furthermore, in the phase distribution in
Figure 10f, it can be confirmed that the phase difference between the two points changes by π rad at the confocal point where the light source is located.
These results show that in an optical system with a diffraction limit of 877 nm, if two light sources 250 nm apart are coherent light sources and their phases are detected, it is possible to observe them as two light sources beyond the diffraction limit.
Furthermore, how an observation becomes possible when two light sources are in close proximity was investigated using simulation.
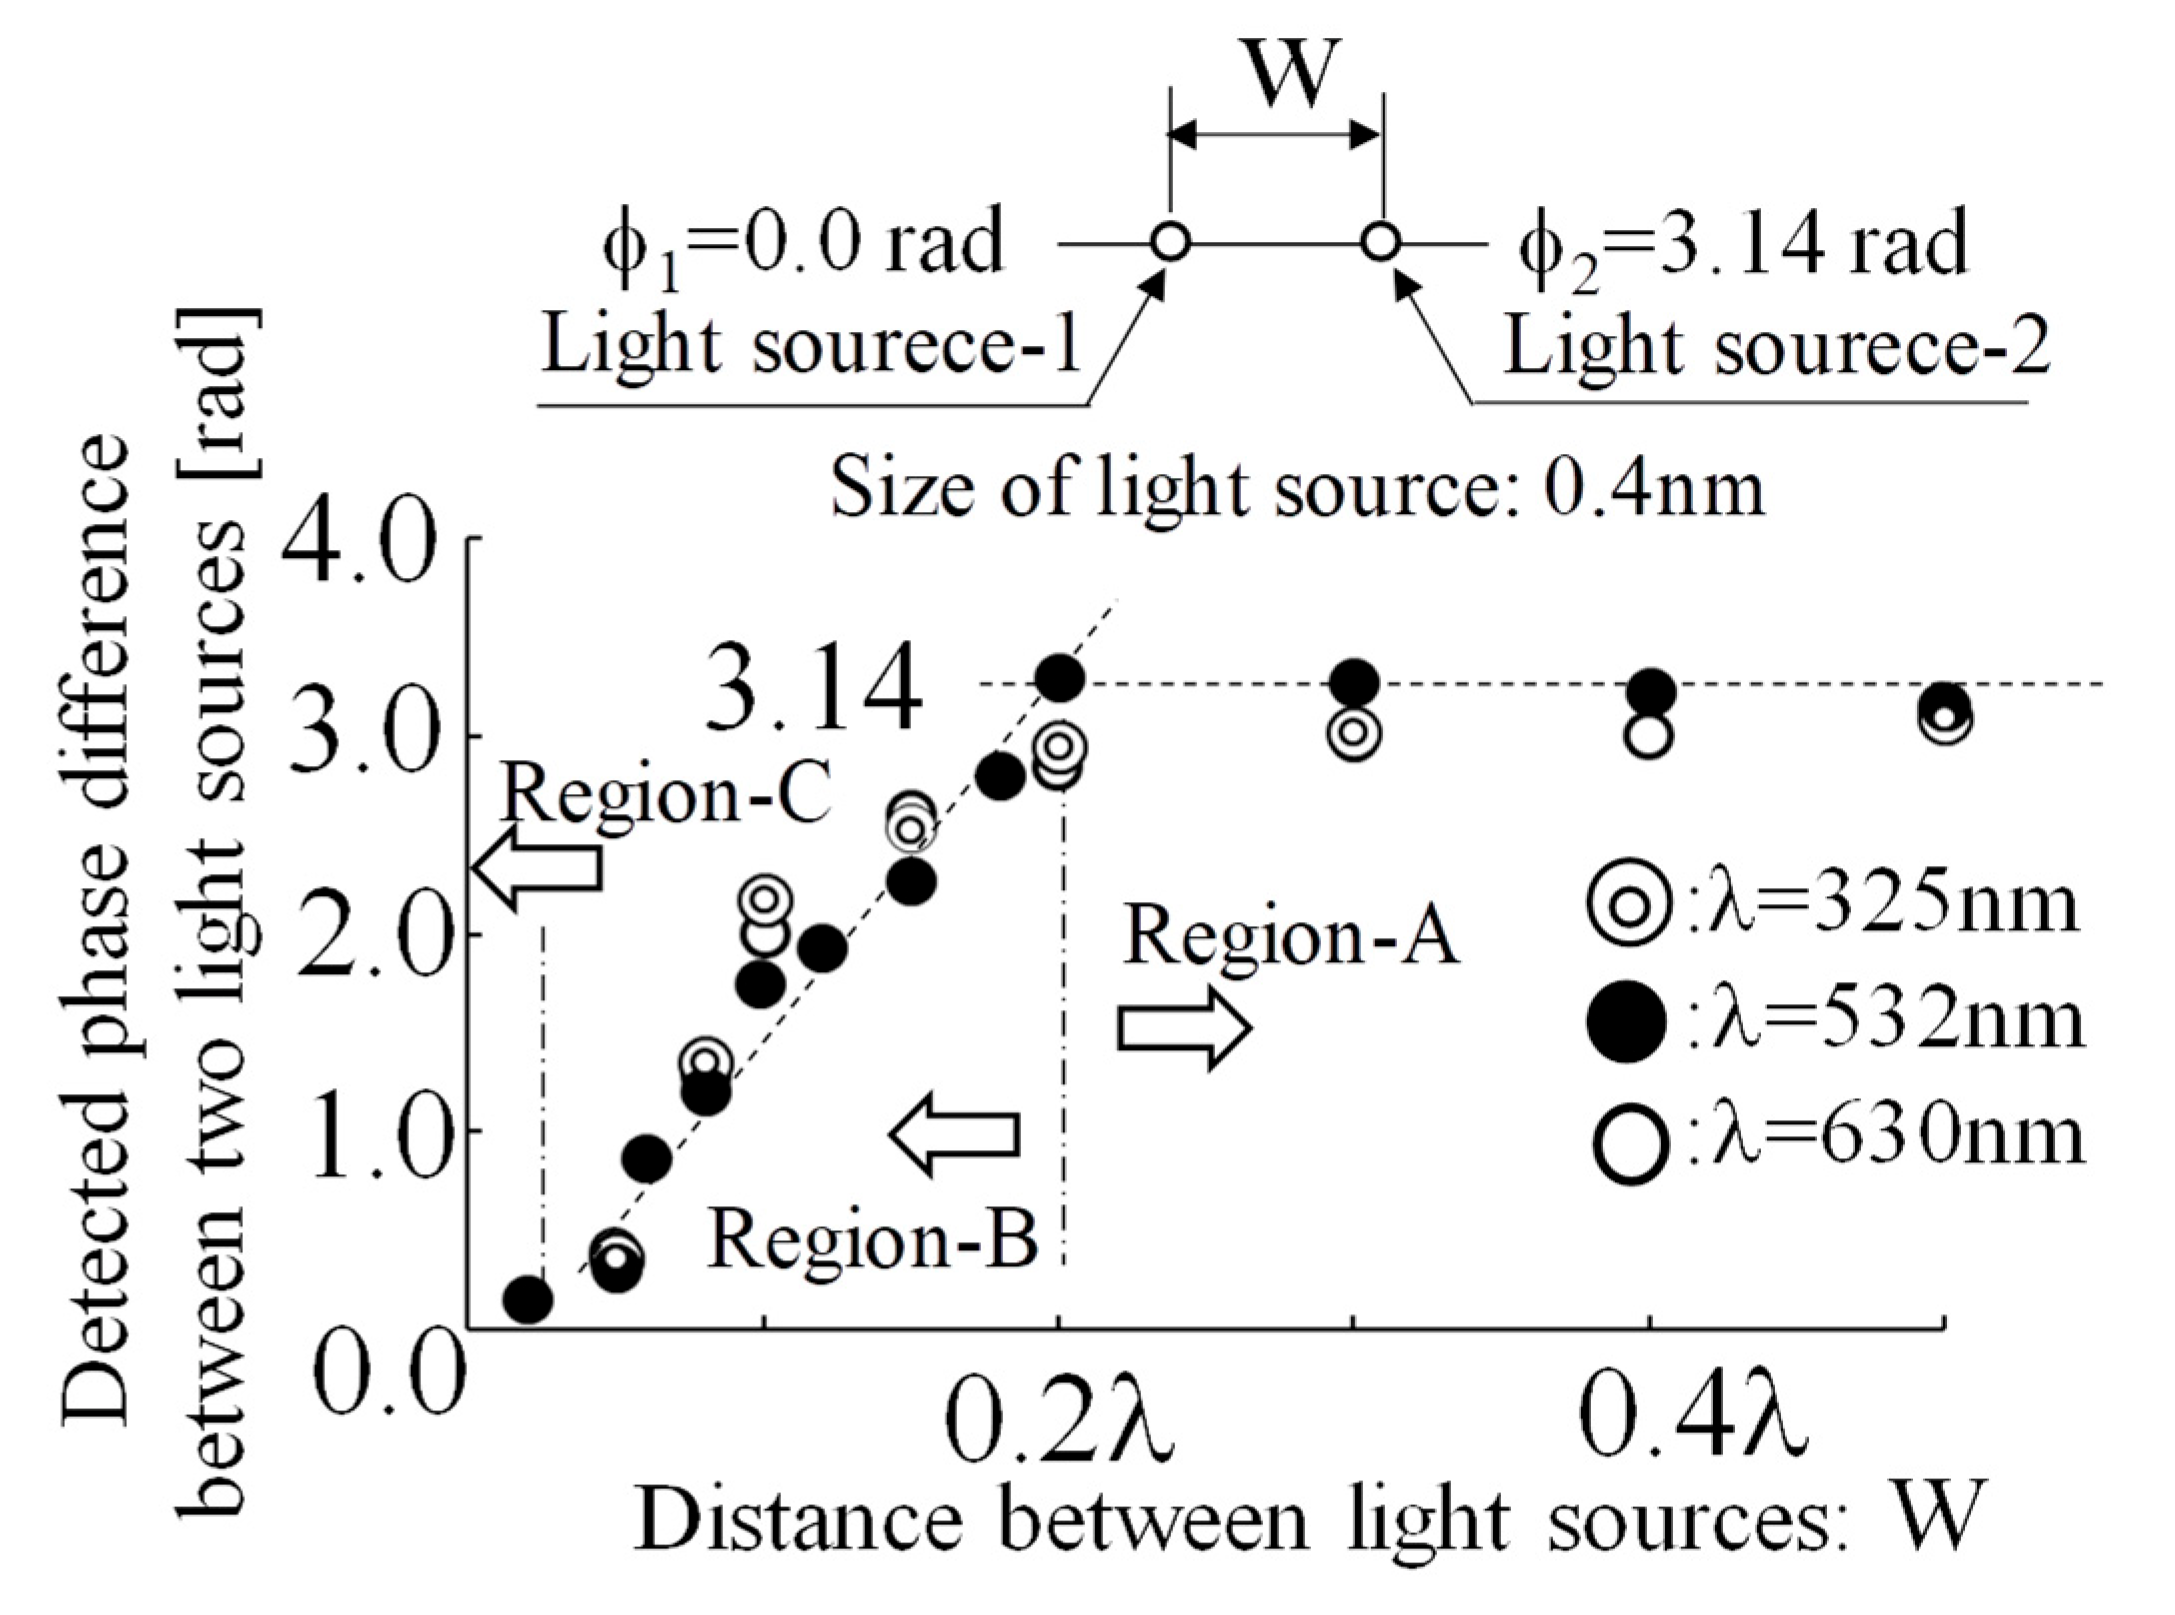
First, the light source wavelength was 532 nm, and the phase difference between the two light sources was set as π rad when the distance between the two light sources varied from 0.01 to 0.5 times the light source wavelength (λ).
In
Figure 11, the horizontal axis is the distance between the two light sources (w) and is given as a multiple of the wavelength λ. The vertical axis is the detected phase difference between the two light sources.
In the result for the wavelength of 532 nm indicated by the black circle (●), it can be observed that the phase of two light sources in close proximity can be detected as π rad, which is set as the phase difference, up to about 0.2 λ (actual length: about 100 nm). Next, as the distance becomes closer than 100 nm (0.2 λ), the phase difference gradually becomes increasingly smaller, and even if the phase difference is set as π rad, it can no longer be detected as π rad.
However, even if it is no longer possible to accurately detect dimensions related to the shape of the object, it is still possible to observe the approximate shape of the measured object. For example, in the experimental results of a previous report [
26], although the groove depth of a 100-nm-wide groove could be detected almost accurately when observing a 100-nm-wide groove, the groove depth of a 60-nm-wide groove could not be accurately detected as the actual groove depth, although it could be captured as a groove.
Thus, in the observation of microstructures using speckle interferometry, there are several measurement limits in the experimental measurement process, such as the range where dimensions can be accurately measured (e.g., Region-A in
Figure 11), the range where dimensions cannot be accurately measured but shapes can be captured (e.g., Region-B in
Figure 11), and the range where the state of the measurement is not yet clearly understood (e.g., Region-C in
Figure 11).
It is thought that there are several levels of measurement limits.
Therefore, it is necessary to investigate in detail the regions below 0.2 λ in
Figure 11 (Region-B and Region-C in
Figure 11) in the future. Furthermore, based on the results of this study, it is also necessary to discuss the causes of why such regions occur. Based on the results of these further investigations, the measurement limits of this method should be considered in more detail.
In this study, simulations were performed on the basis of the experimental results already reported. As a result, the wavelength was considered 532 nm. However, as a general concept in optical measurement, it is important to know how a change in wavelength affects the measurement results. Therefore, next, a simulation was performed to see how a light source with a different wavelength, as well as 532 nm, affected the measurement results.
For the light source wavelength, it was decided to consider visible light lasers, which are commonly used for measurements. The case of a long wavelength of 630 nm, modelled after a He-Ne laser (wavelength: 632.8 nm), is indicated by a white circle (○) in
Figure 11.
The results are also shown in
Figure 11 as double white circles (◎) for the case of the 325 nm wavelength modelled after the shorter wavelengths of He-Cd lasers (wavelengths: 325 nm and 442 nm).
For different light source wavelengths in
Figure 11, it can be found that the phase difference between the two light sources can be accurately detected up to approximately one-fifth of the wavelength (0.2 λ), regardless of the wavelength. This indicates that even when the diffraction limit is exceeded, observation of finer structures becomes possible as the light source wavelength becomes shorter.
These results show that in the observation technique for structures with geometries beyond the diffraction limit using speckle interferometry, the phase difference between two nearby light sources is preserved during detection, even between two points beyond the diffraction limit, when coherent light is used.
By using this phenomenon, it is thought that super-resolution beyond the Rayleigh limit, which has been thought to be undetectable using the conventional Rayleigh criterion based on incoherent light, is realised by detecting the phase difference at each position in the microstructure observation technique based on speckle interferometry technology.
The discussion in this study also focused on super-resolution technology during image sampling, particularly for optical observation of microstructures. However, the sensing technology obtained in this study, which reveals the possibility of realising super-resolution based on phase manipulation of light waves with coherent properties, could also be applied to other sensing fields using electromagnetic waves, such as radar sensor technology [
28].
In the future, the results of this research may lead to the use of phase manipulation technology in sensing related to super-resolution using electromagnetic waves with coherent properties, not only in the field of optics, but also in a wide range of other fields.
