Effects of Pulsed Red and Near-Infrared Light on Neuroblastoma Cells—Pilot Study on Frequency and Duty Cycle


Abstract
1. Introduction
2. Materials and Methods
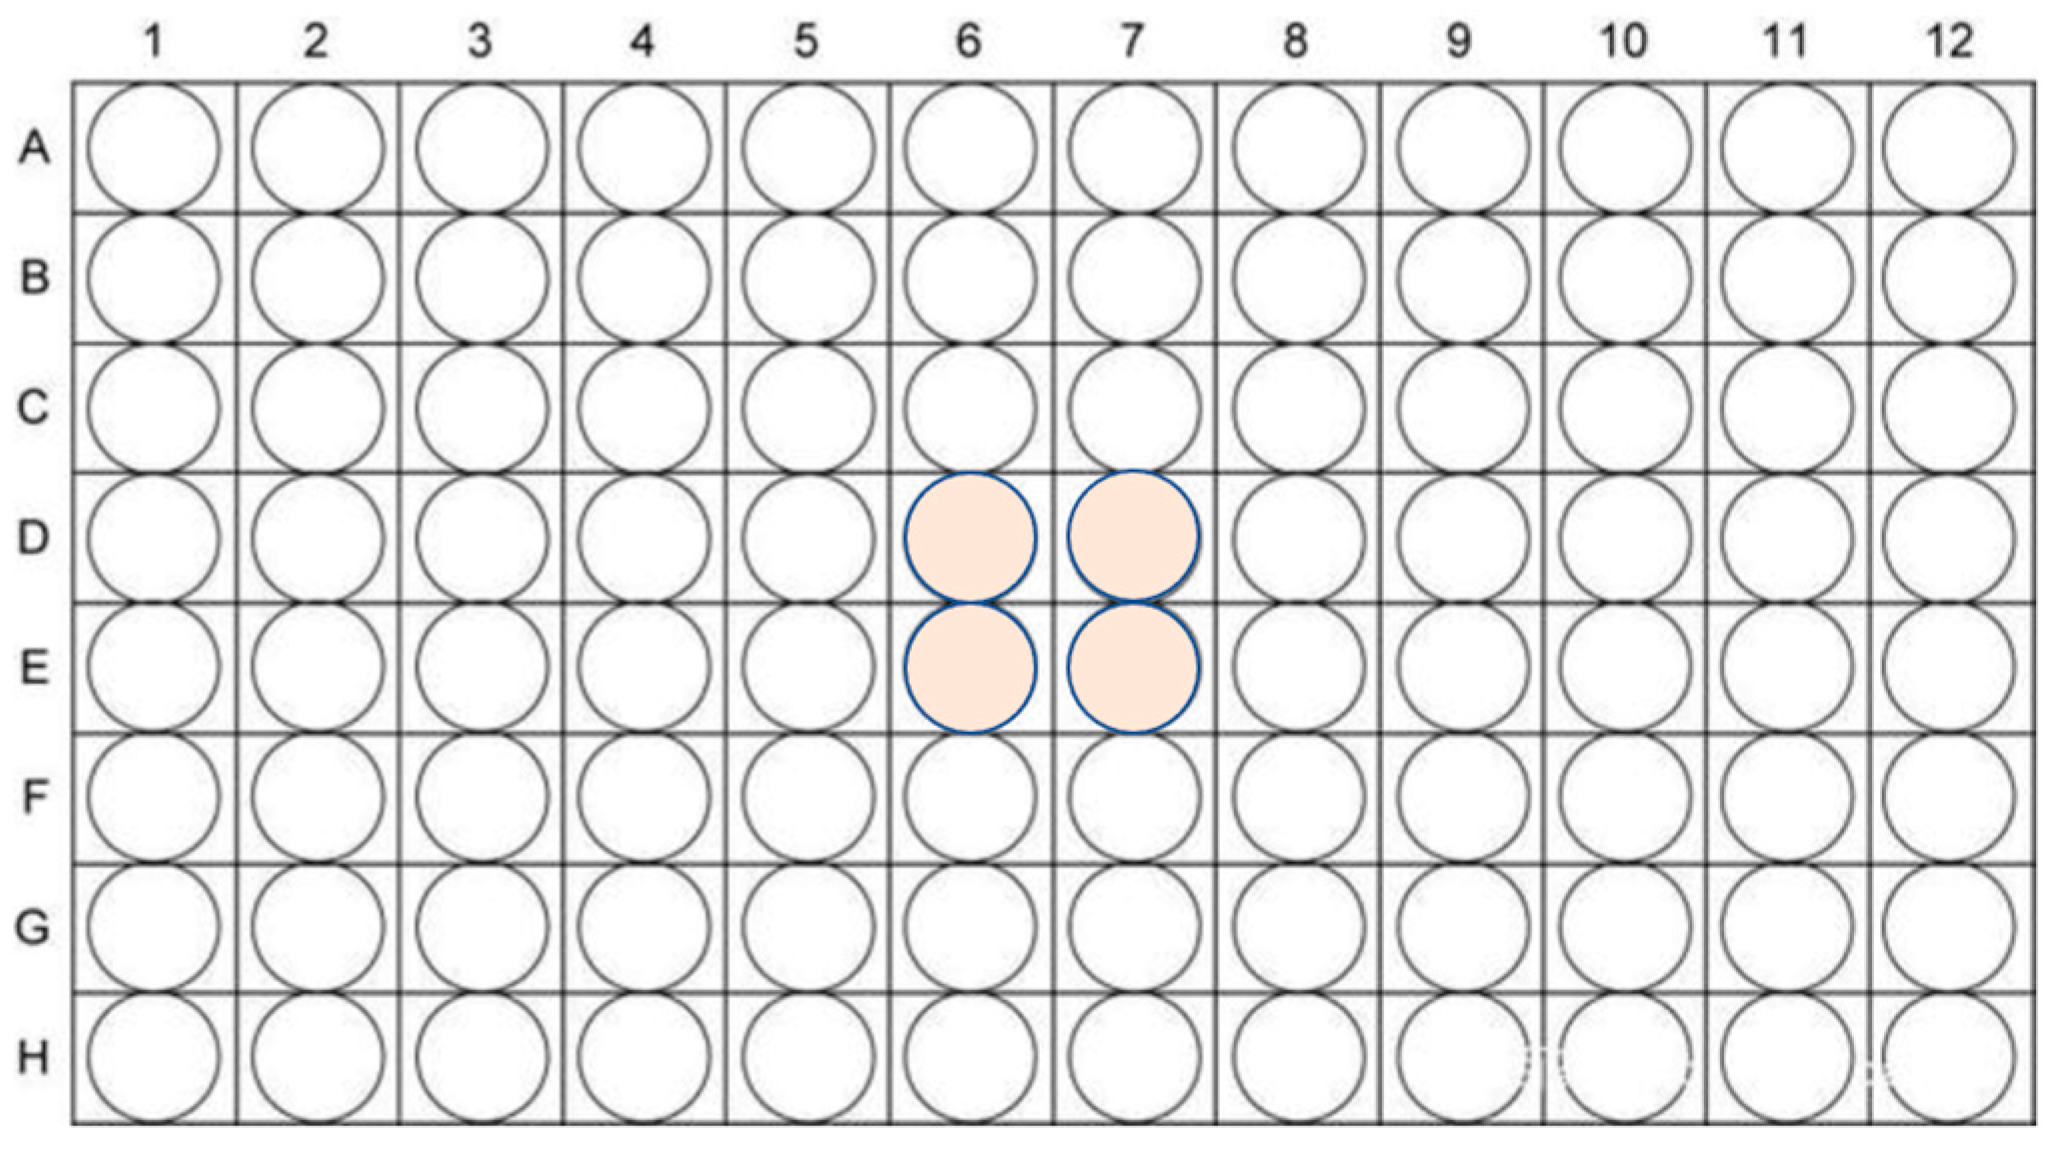
2.1. Cell Culture
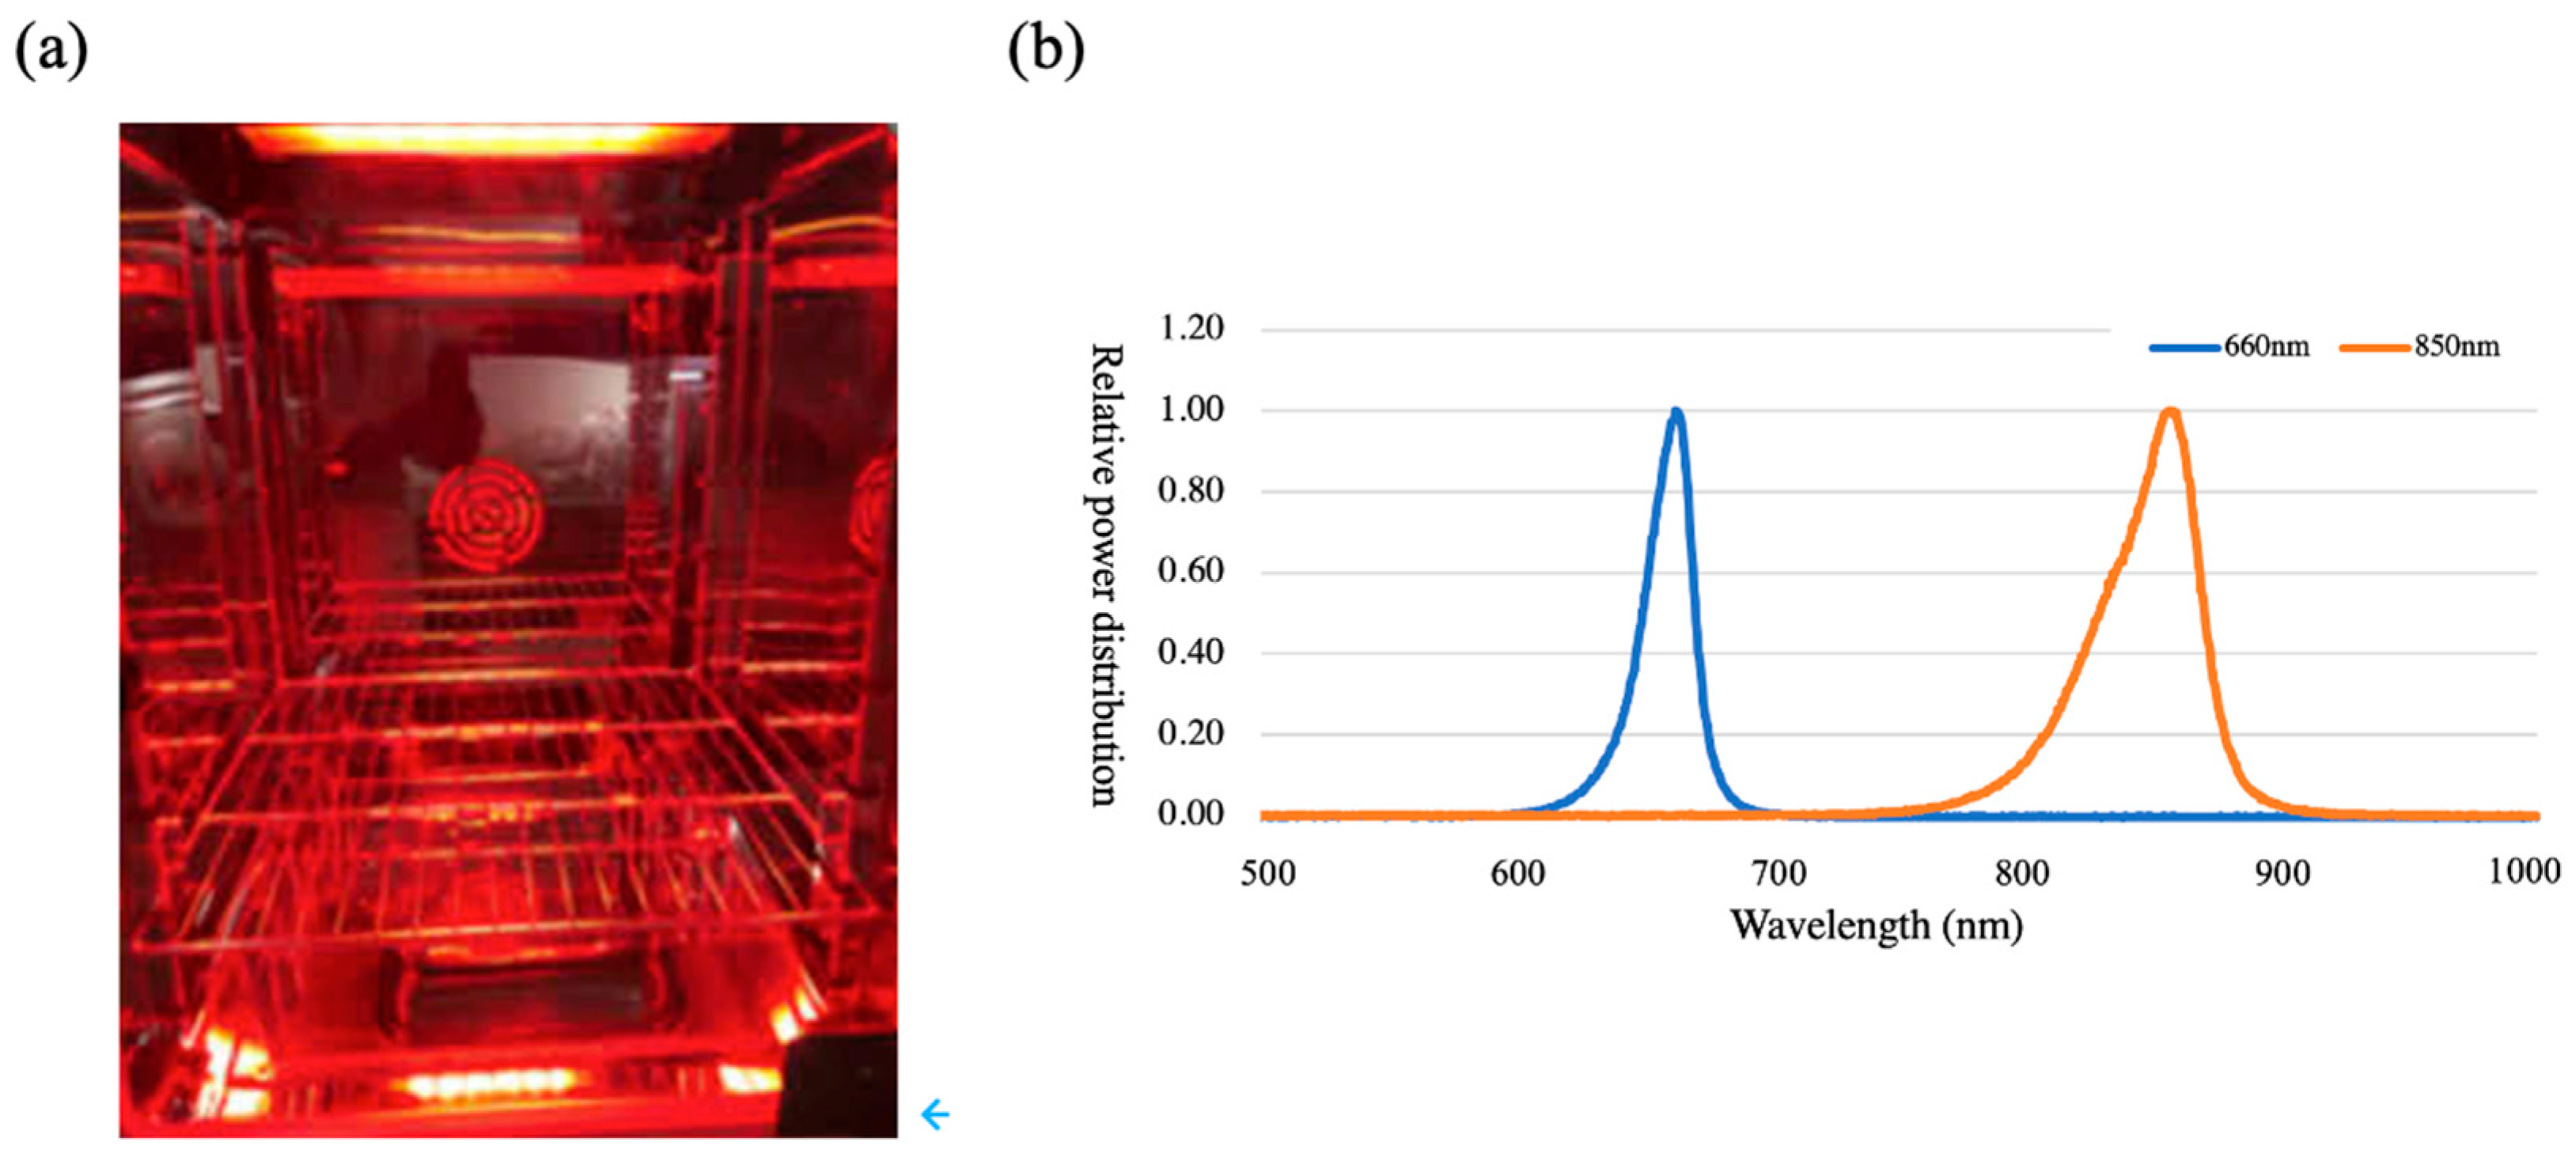
2.2. Light Irradiation
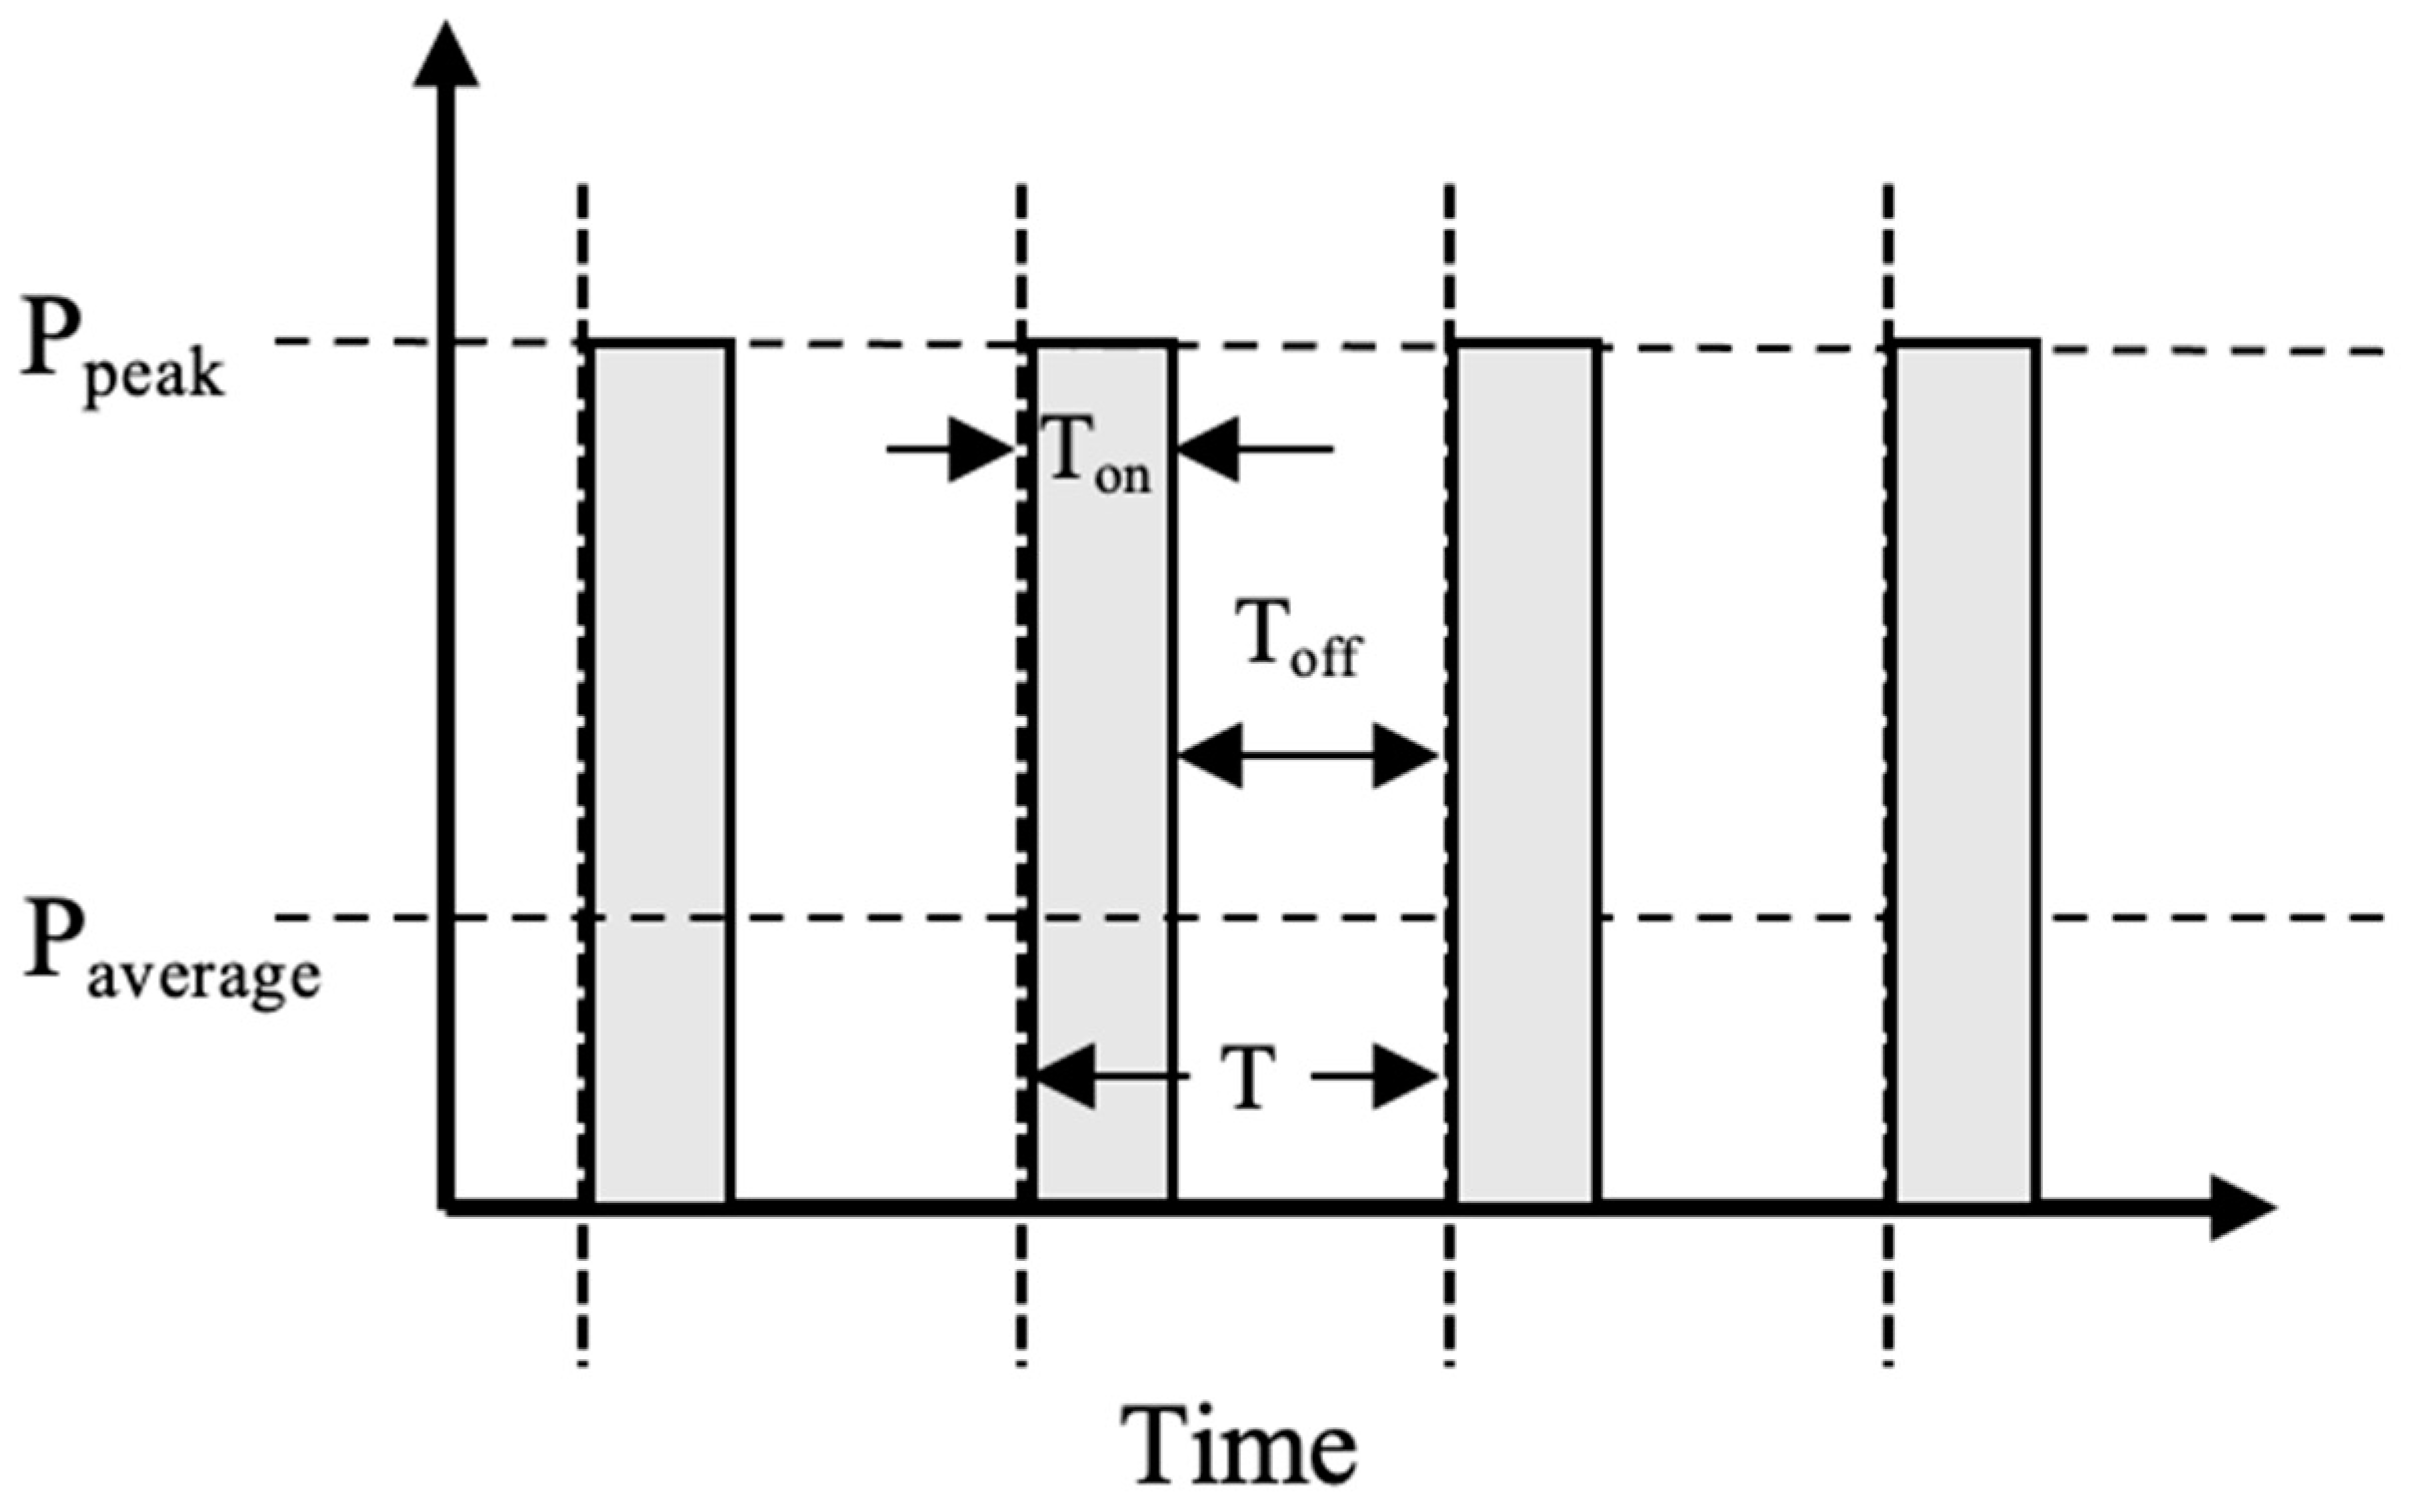
2.3. Lighting Parameters
2.3.1. Experiment 1: Power Density
2.3.2. Experiment 2: Frequency
2.3.3. Experiment 3: Duty Cycle
2.4. Measurement of Cell Viability
2.5. Measurement of Intracellular ROS
2.6. Measurement of Mitochondrial Membrane Potential
2.7. Measurement of ATP
2.8. Statistical Analysis
3. Results
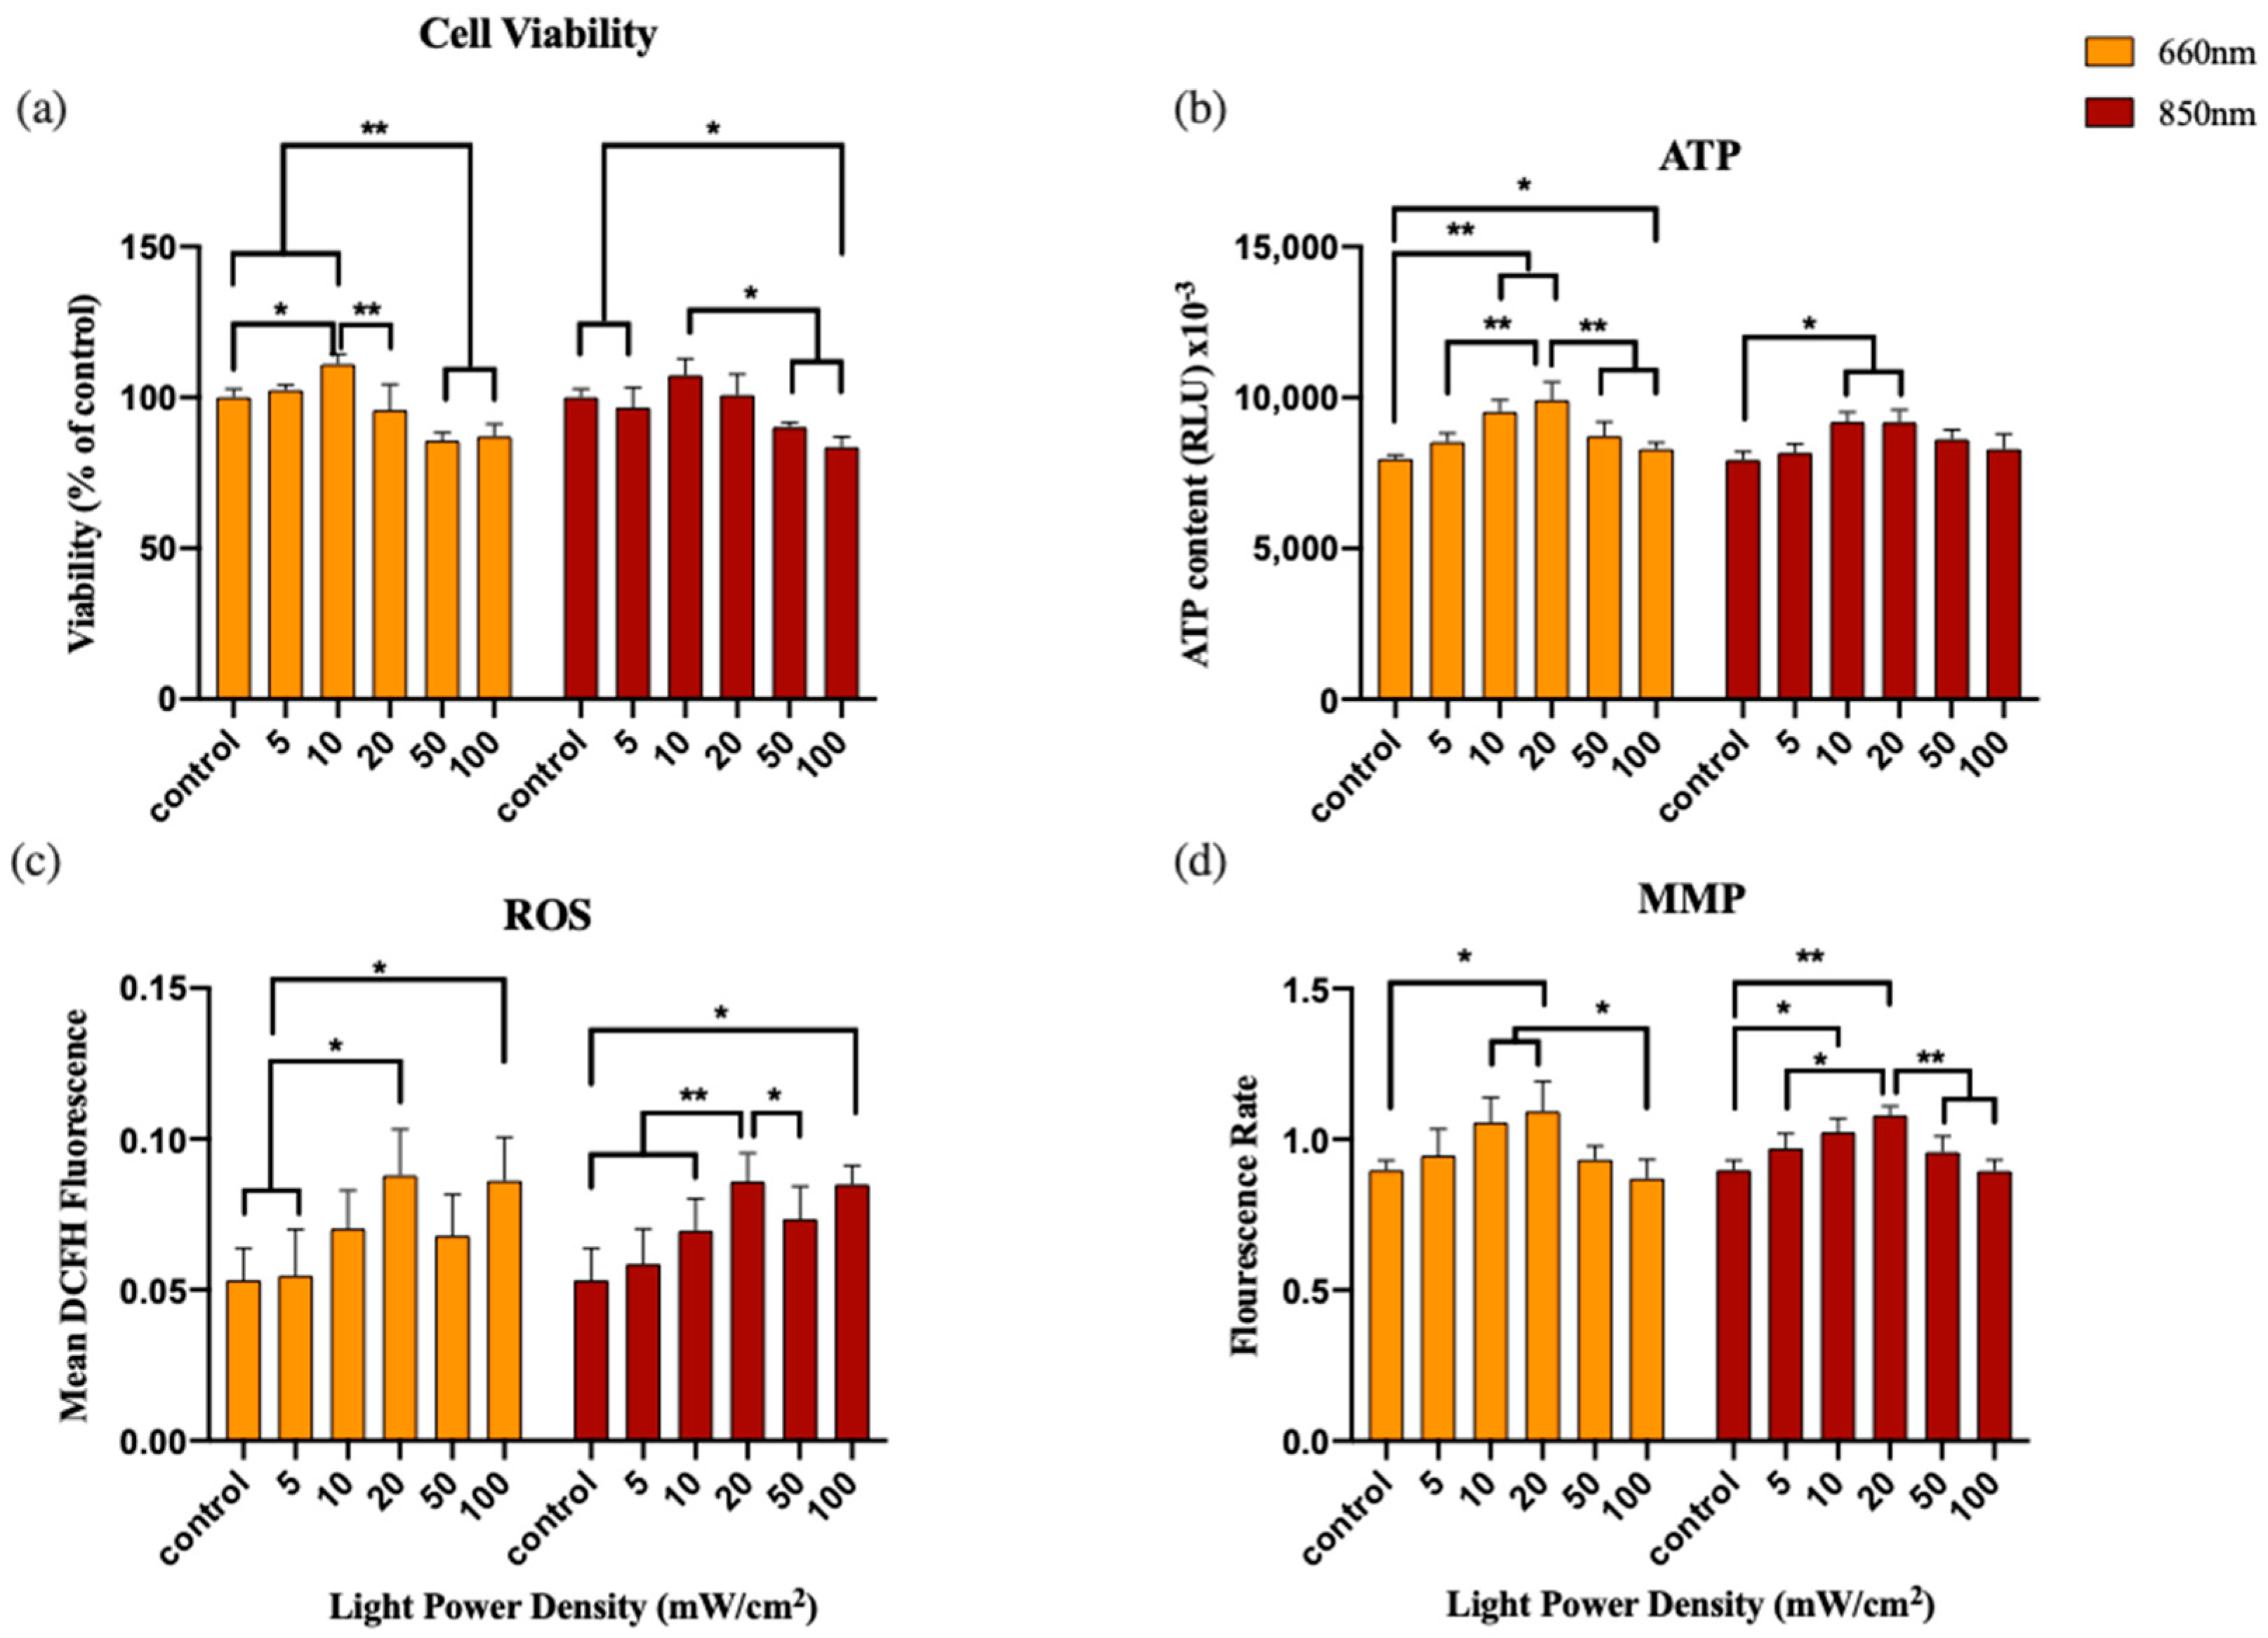
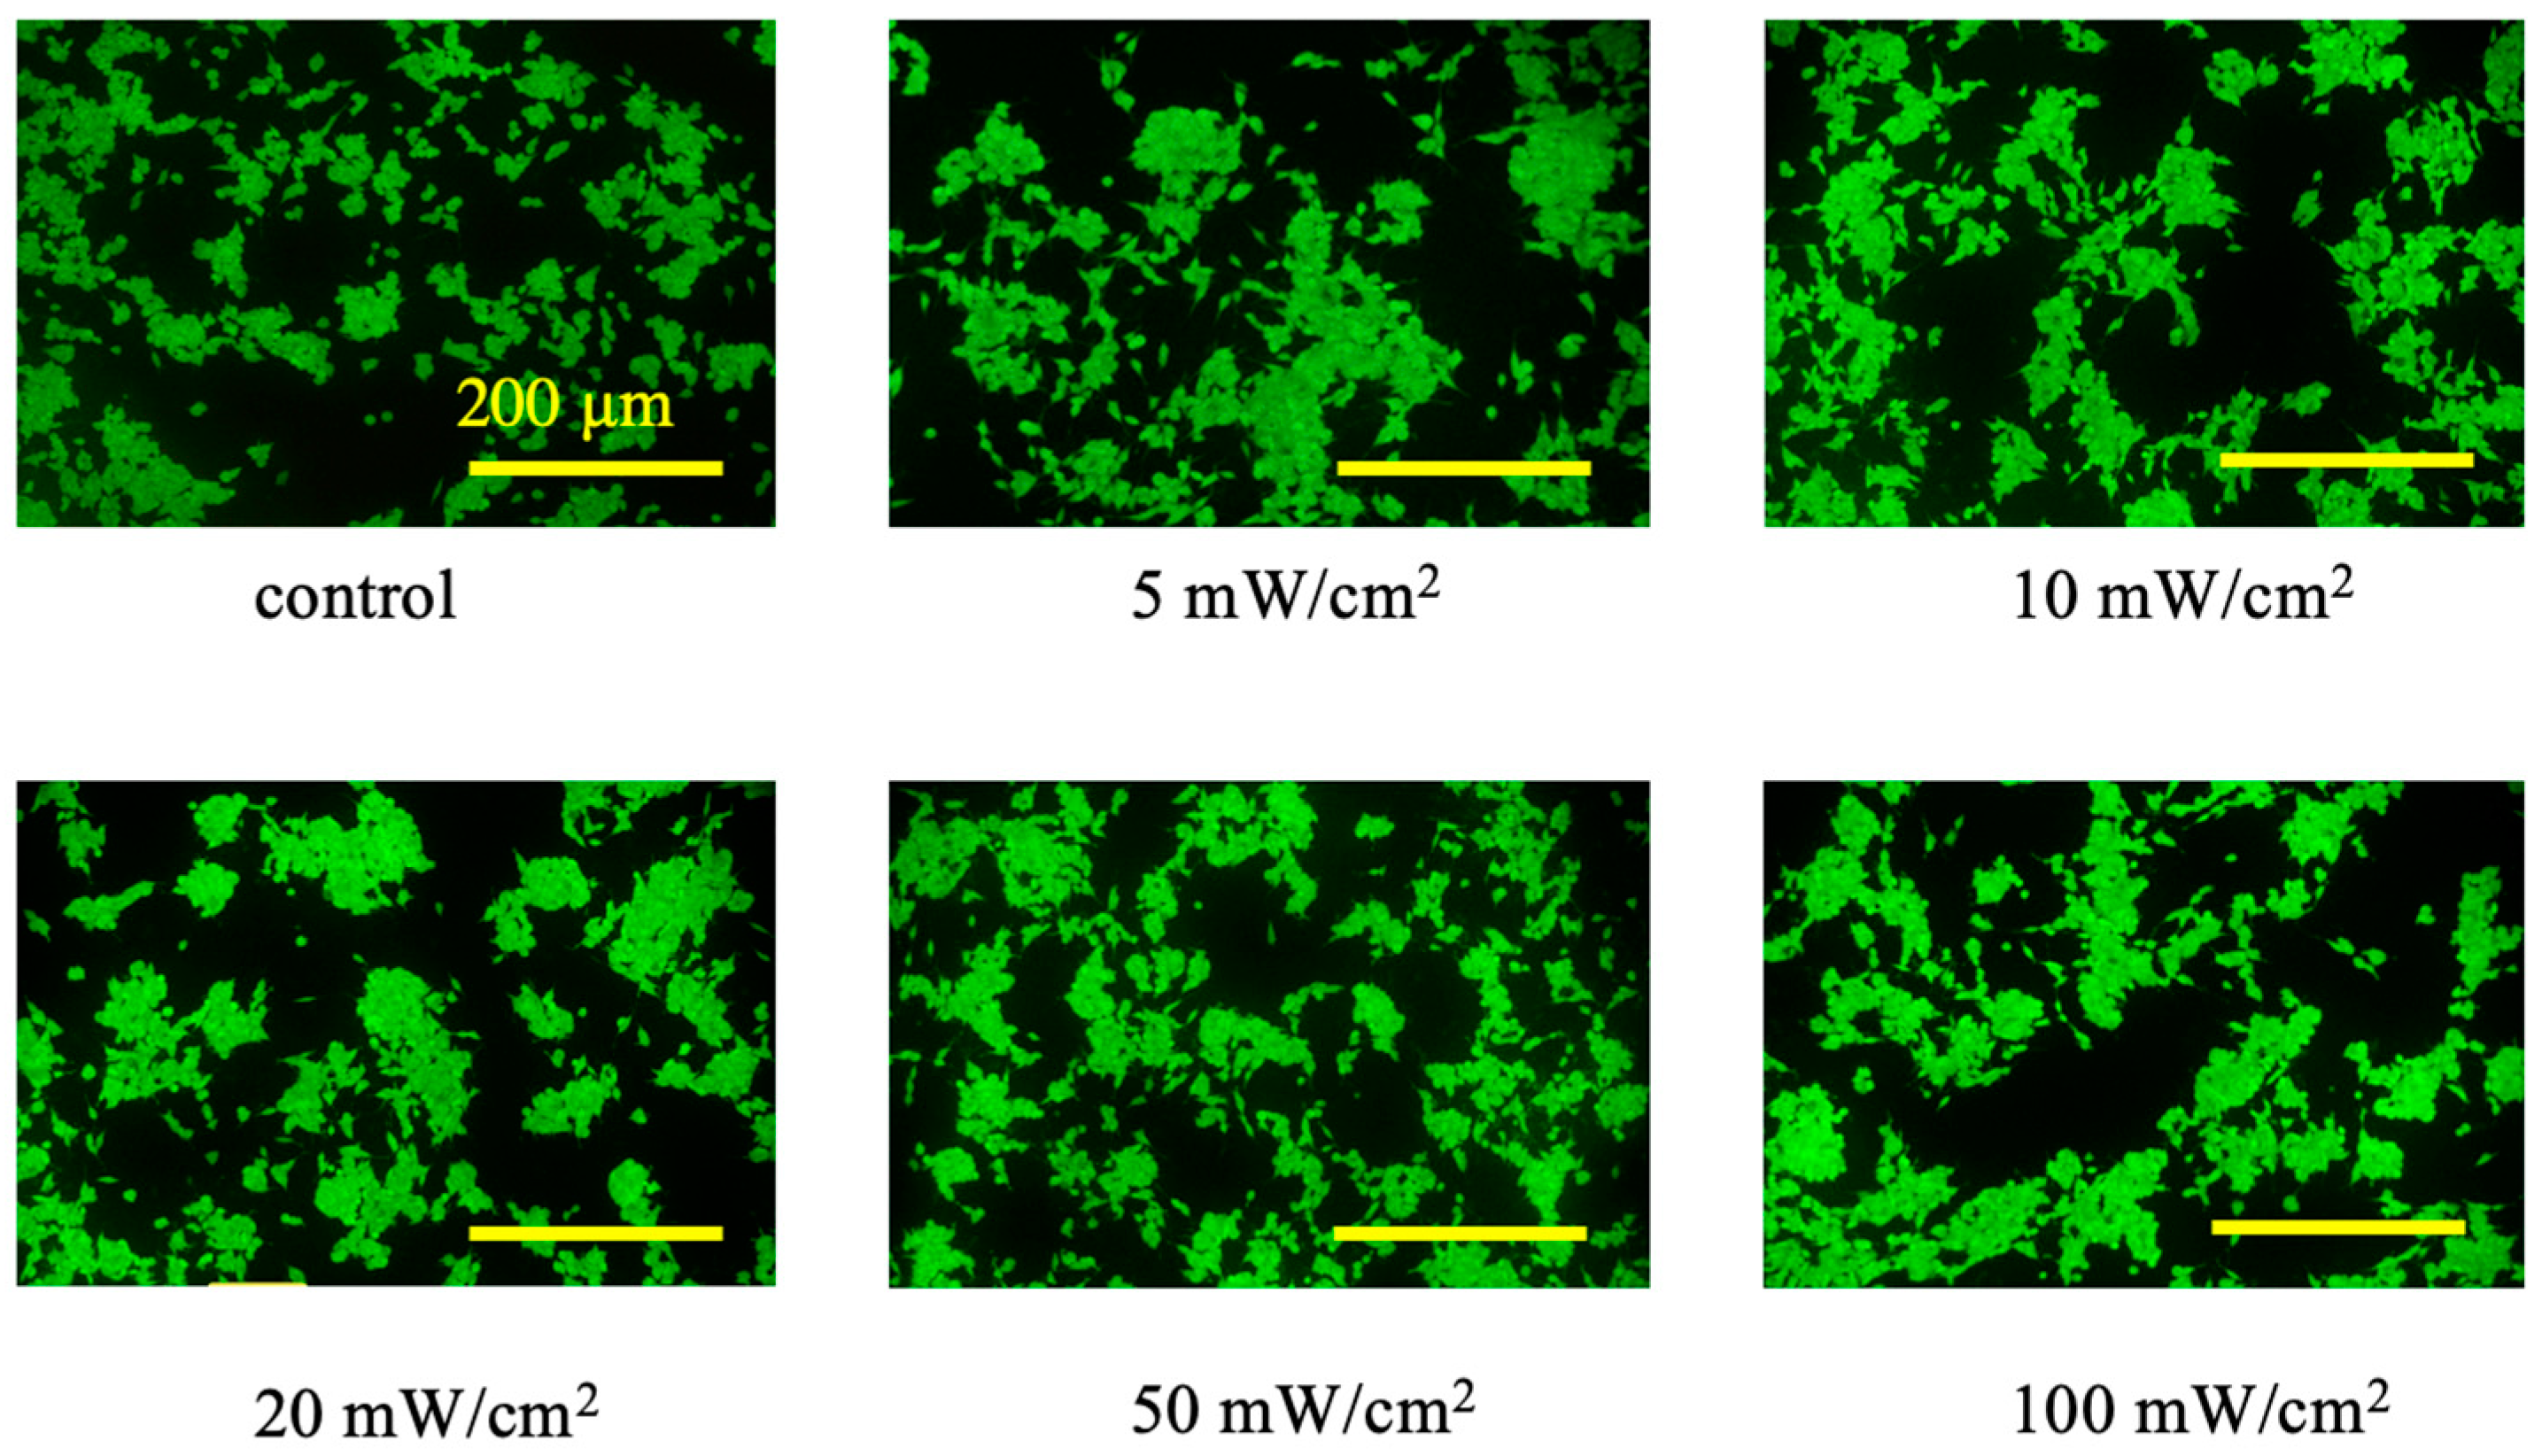
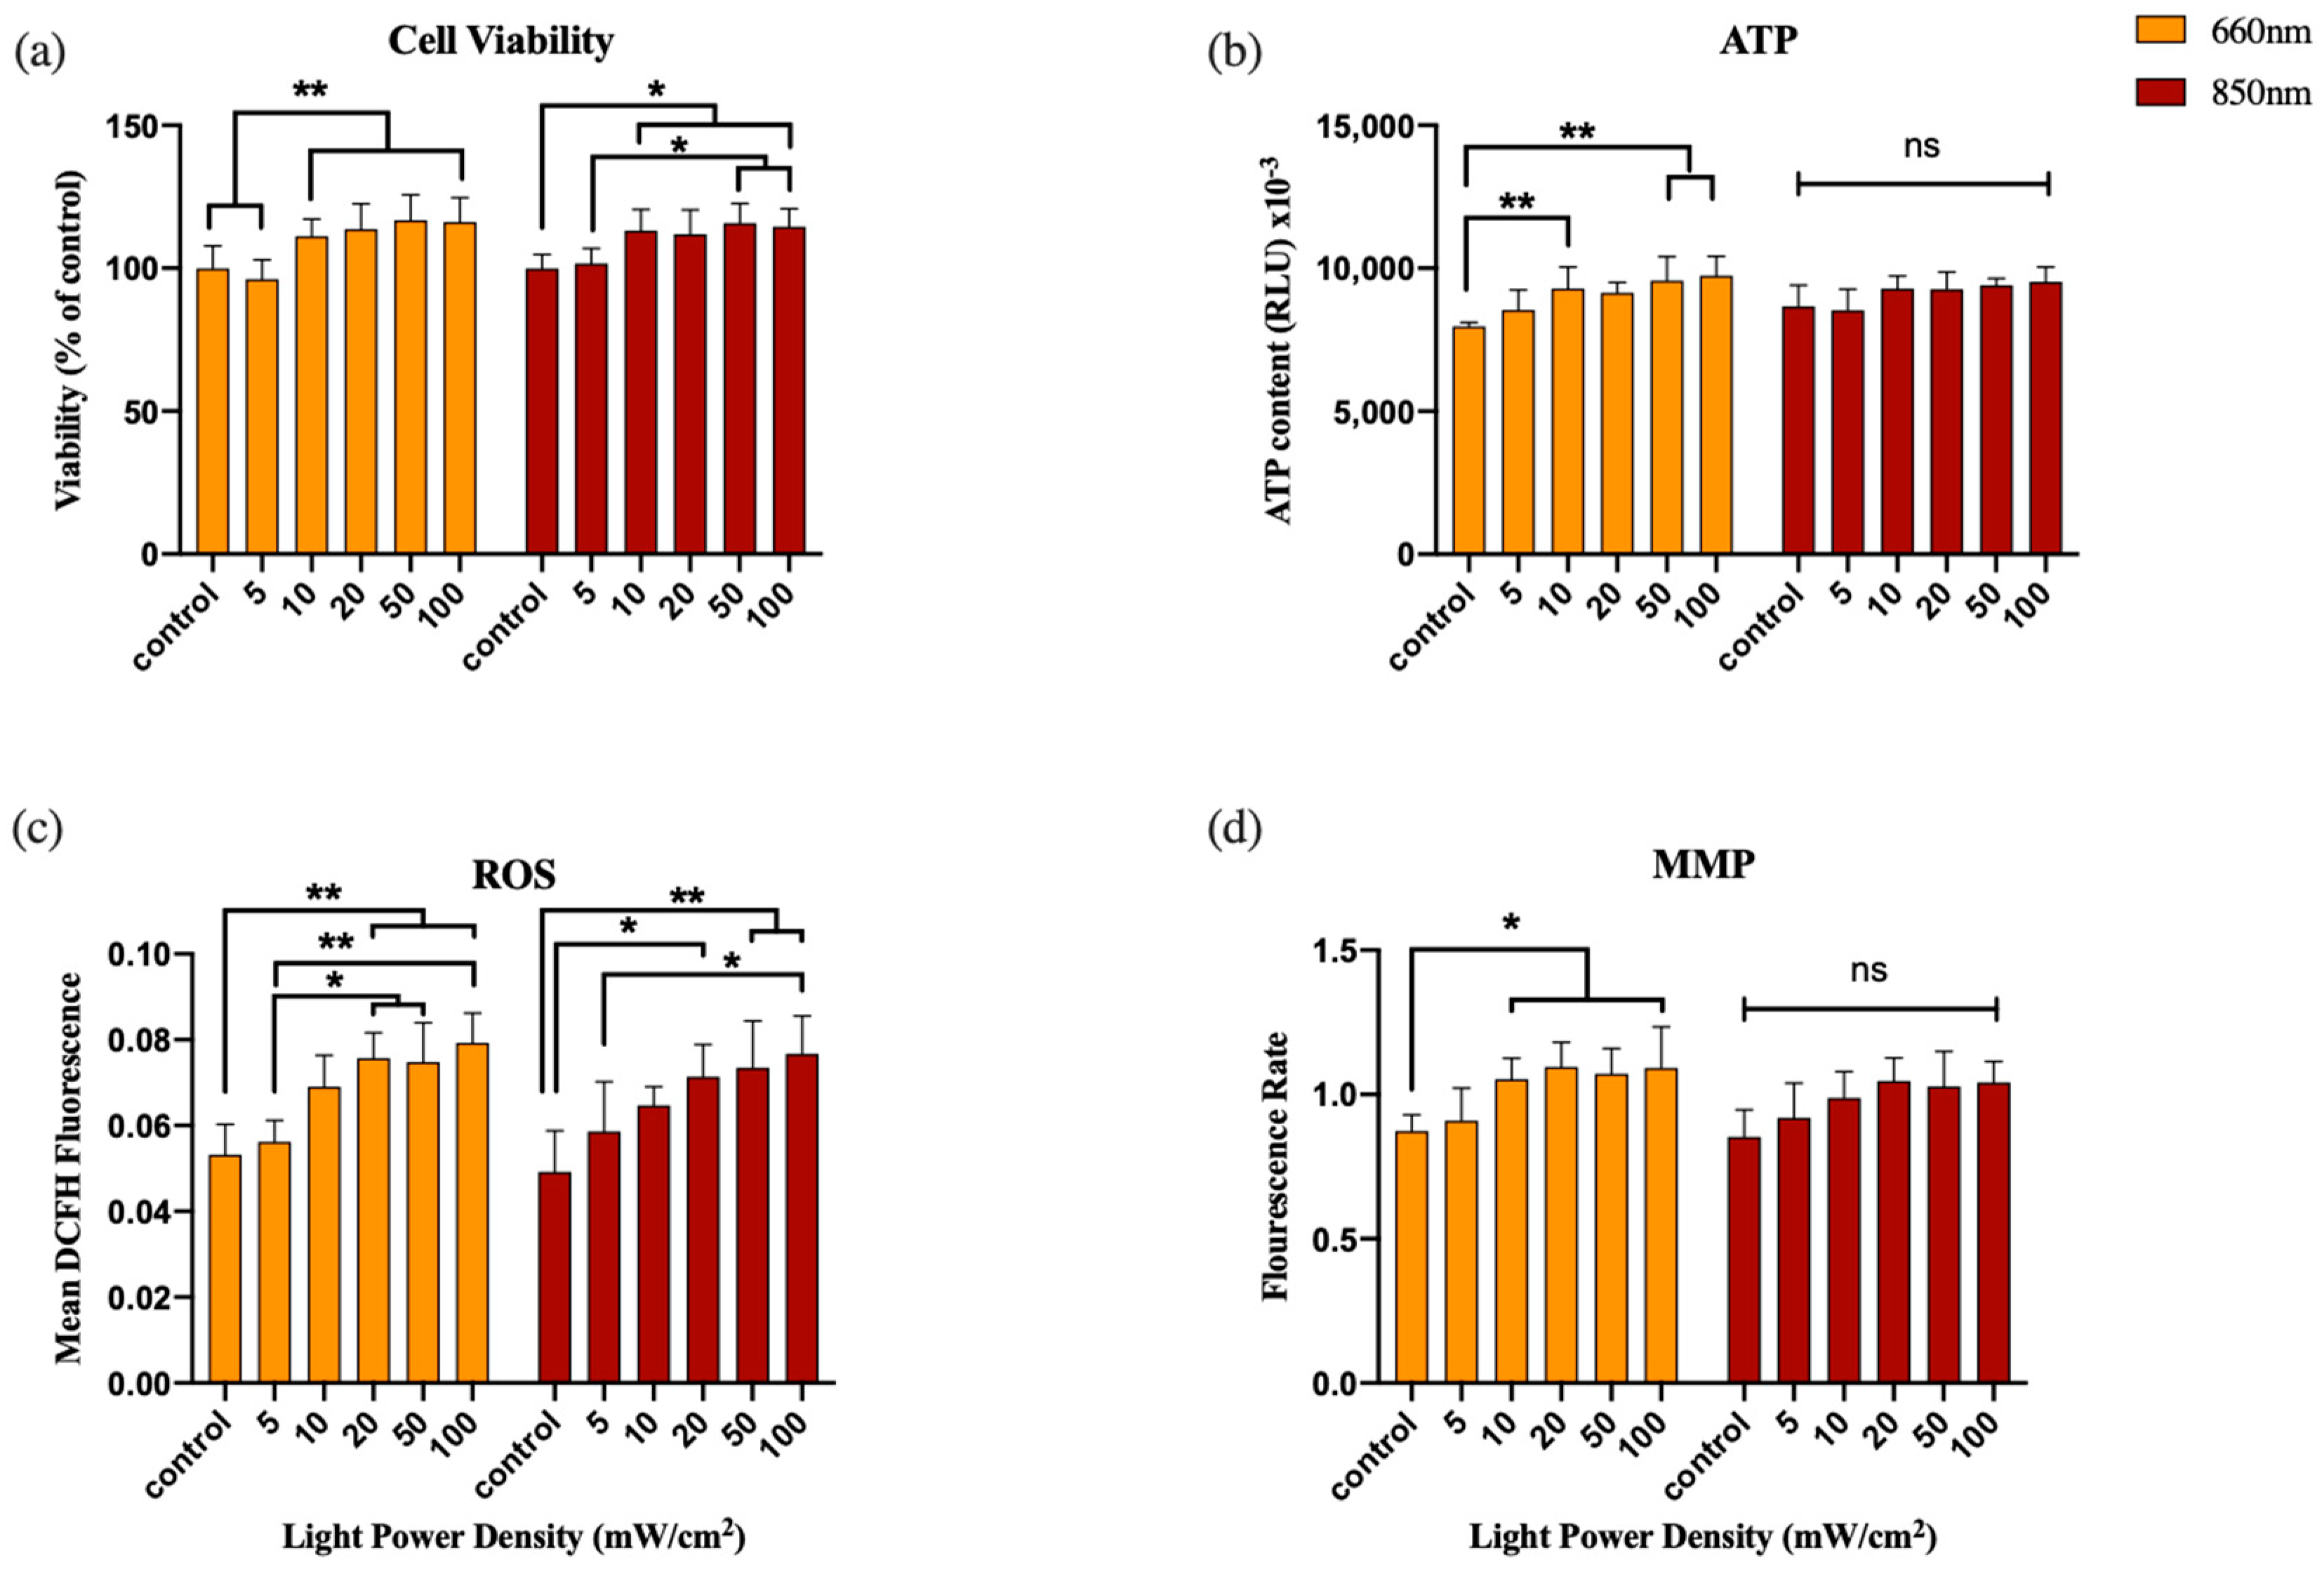
3.1. Experiment 1: Power Density
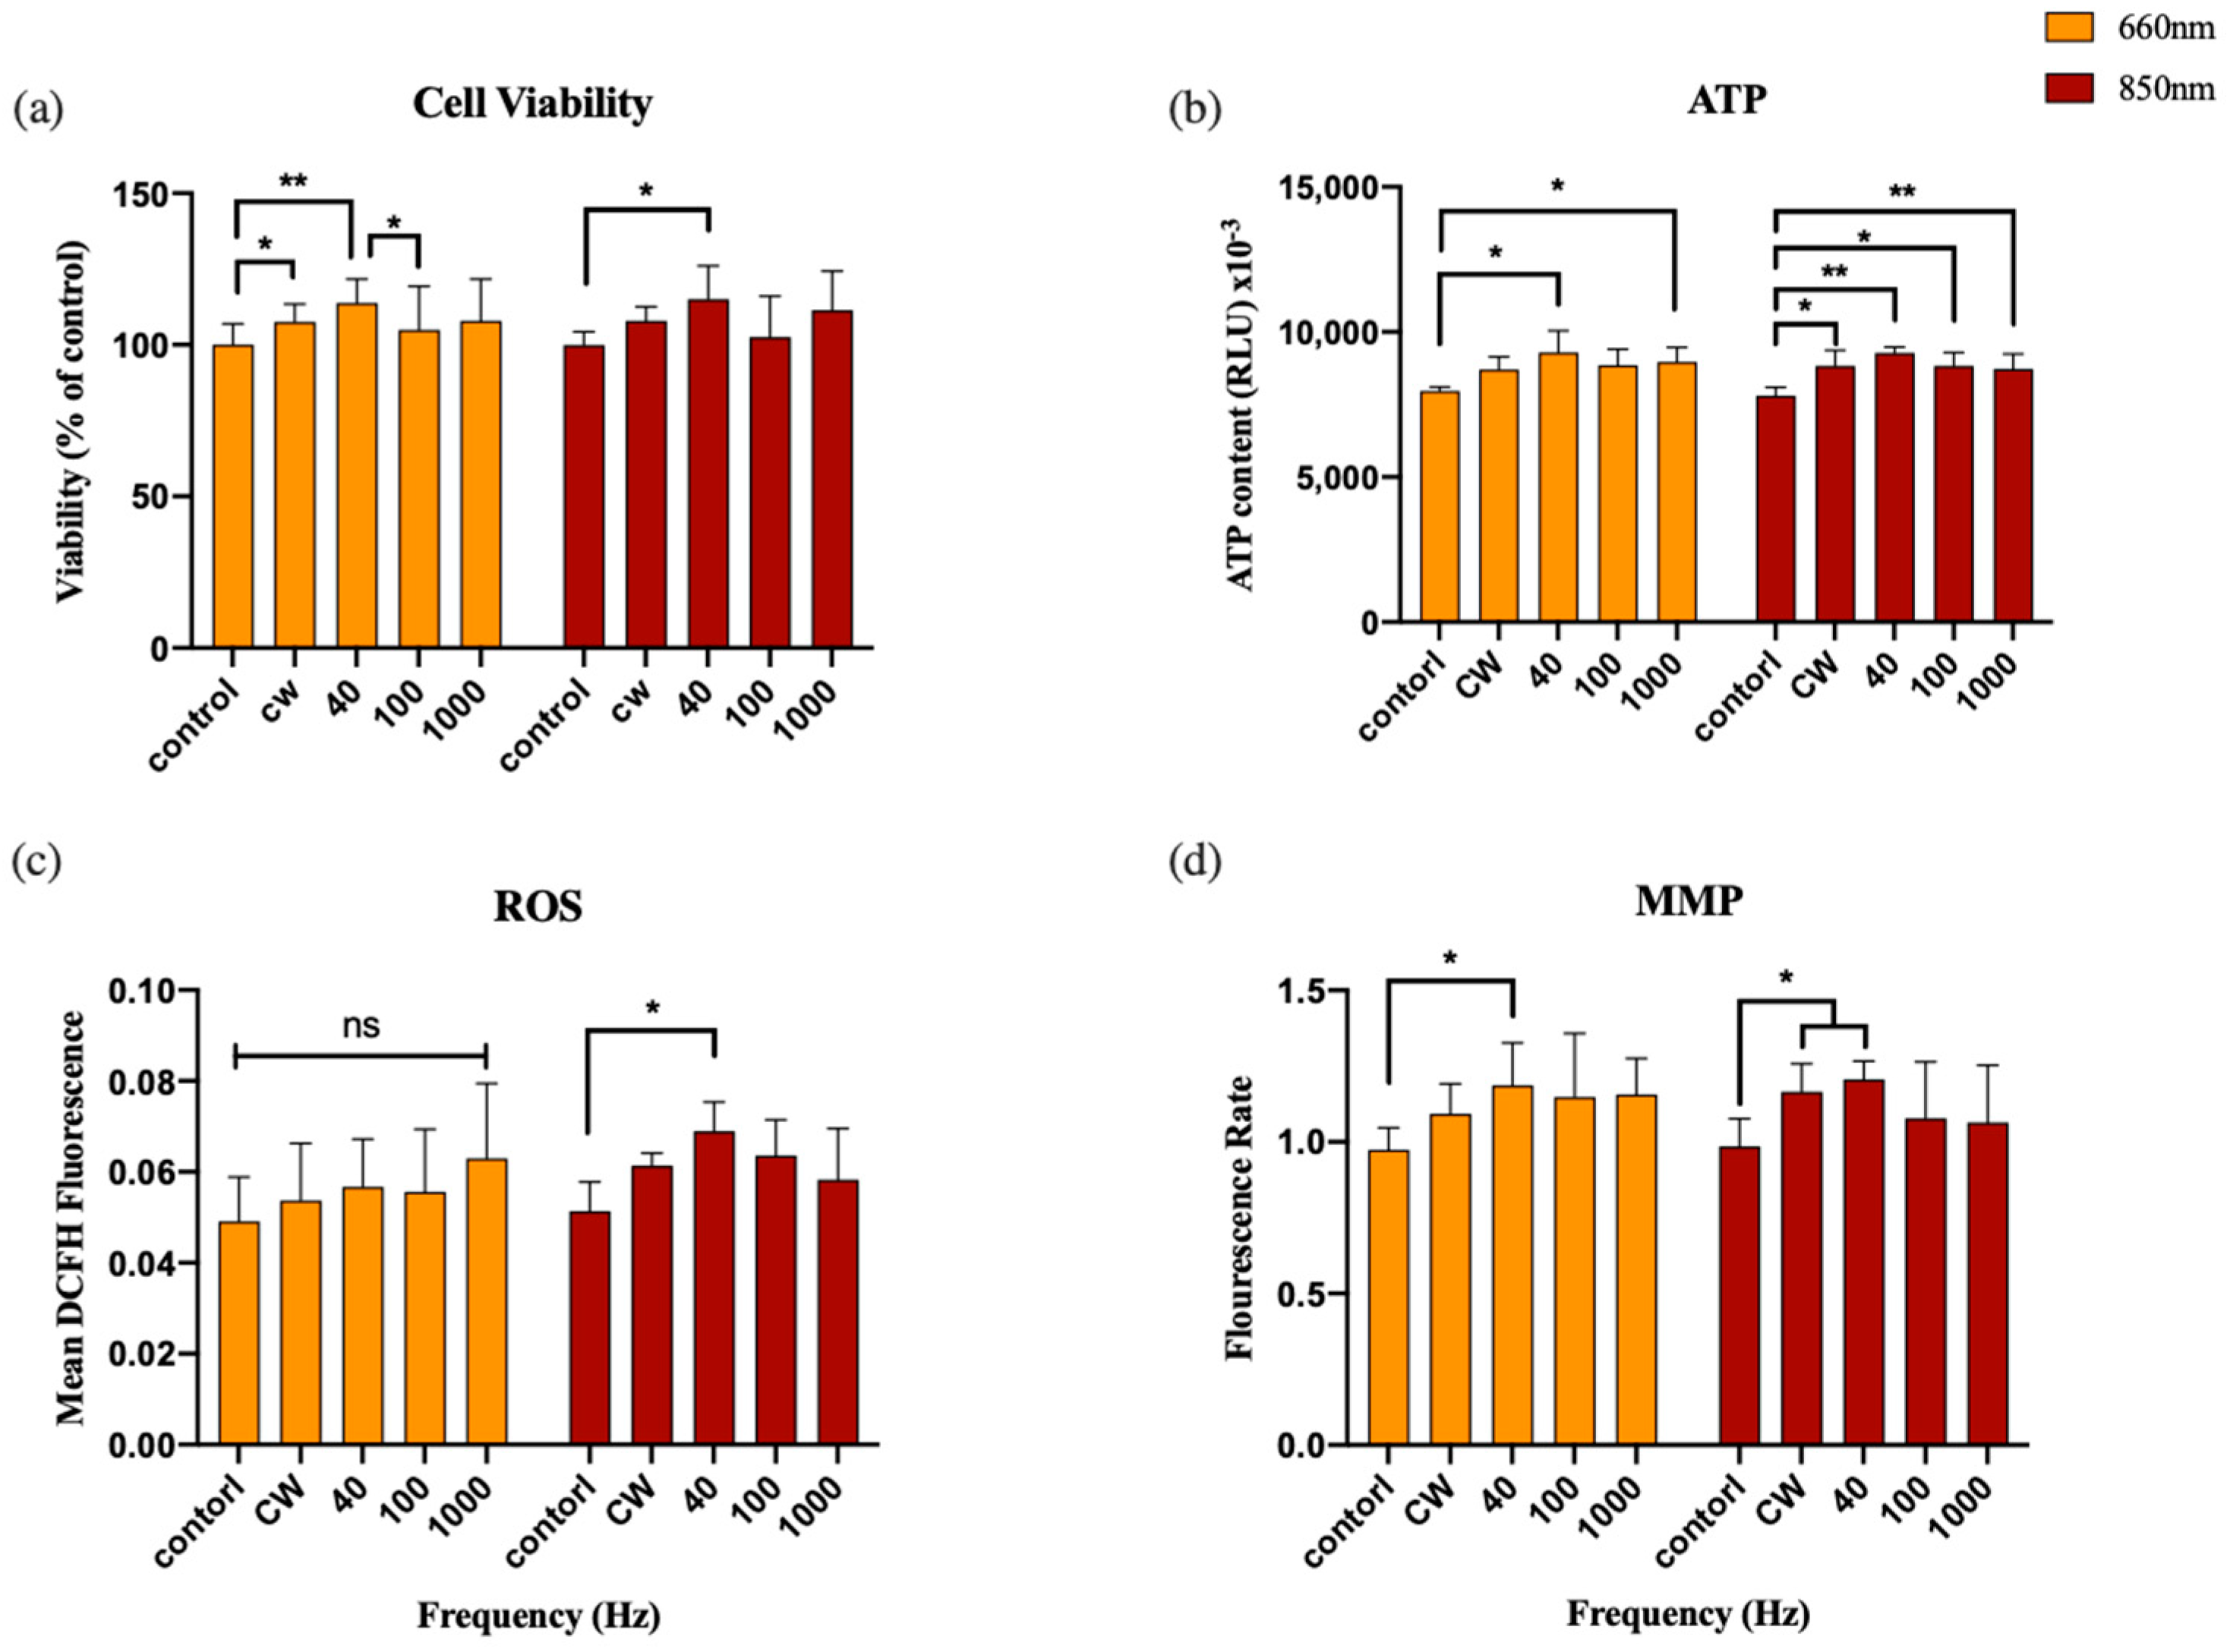
3.2. Experiment 2: Frequency
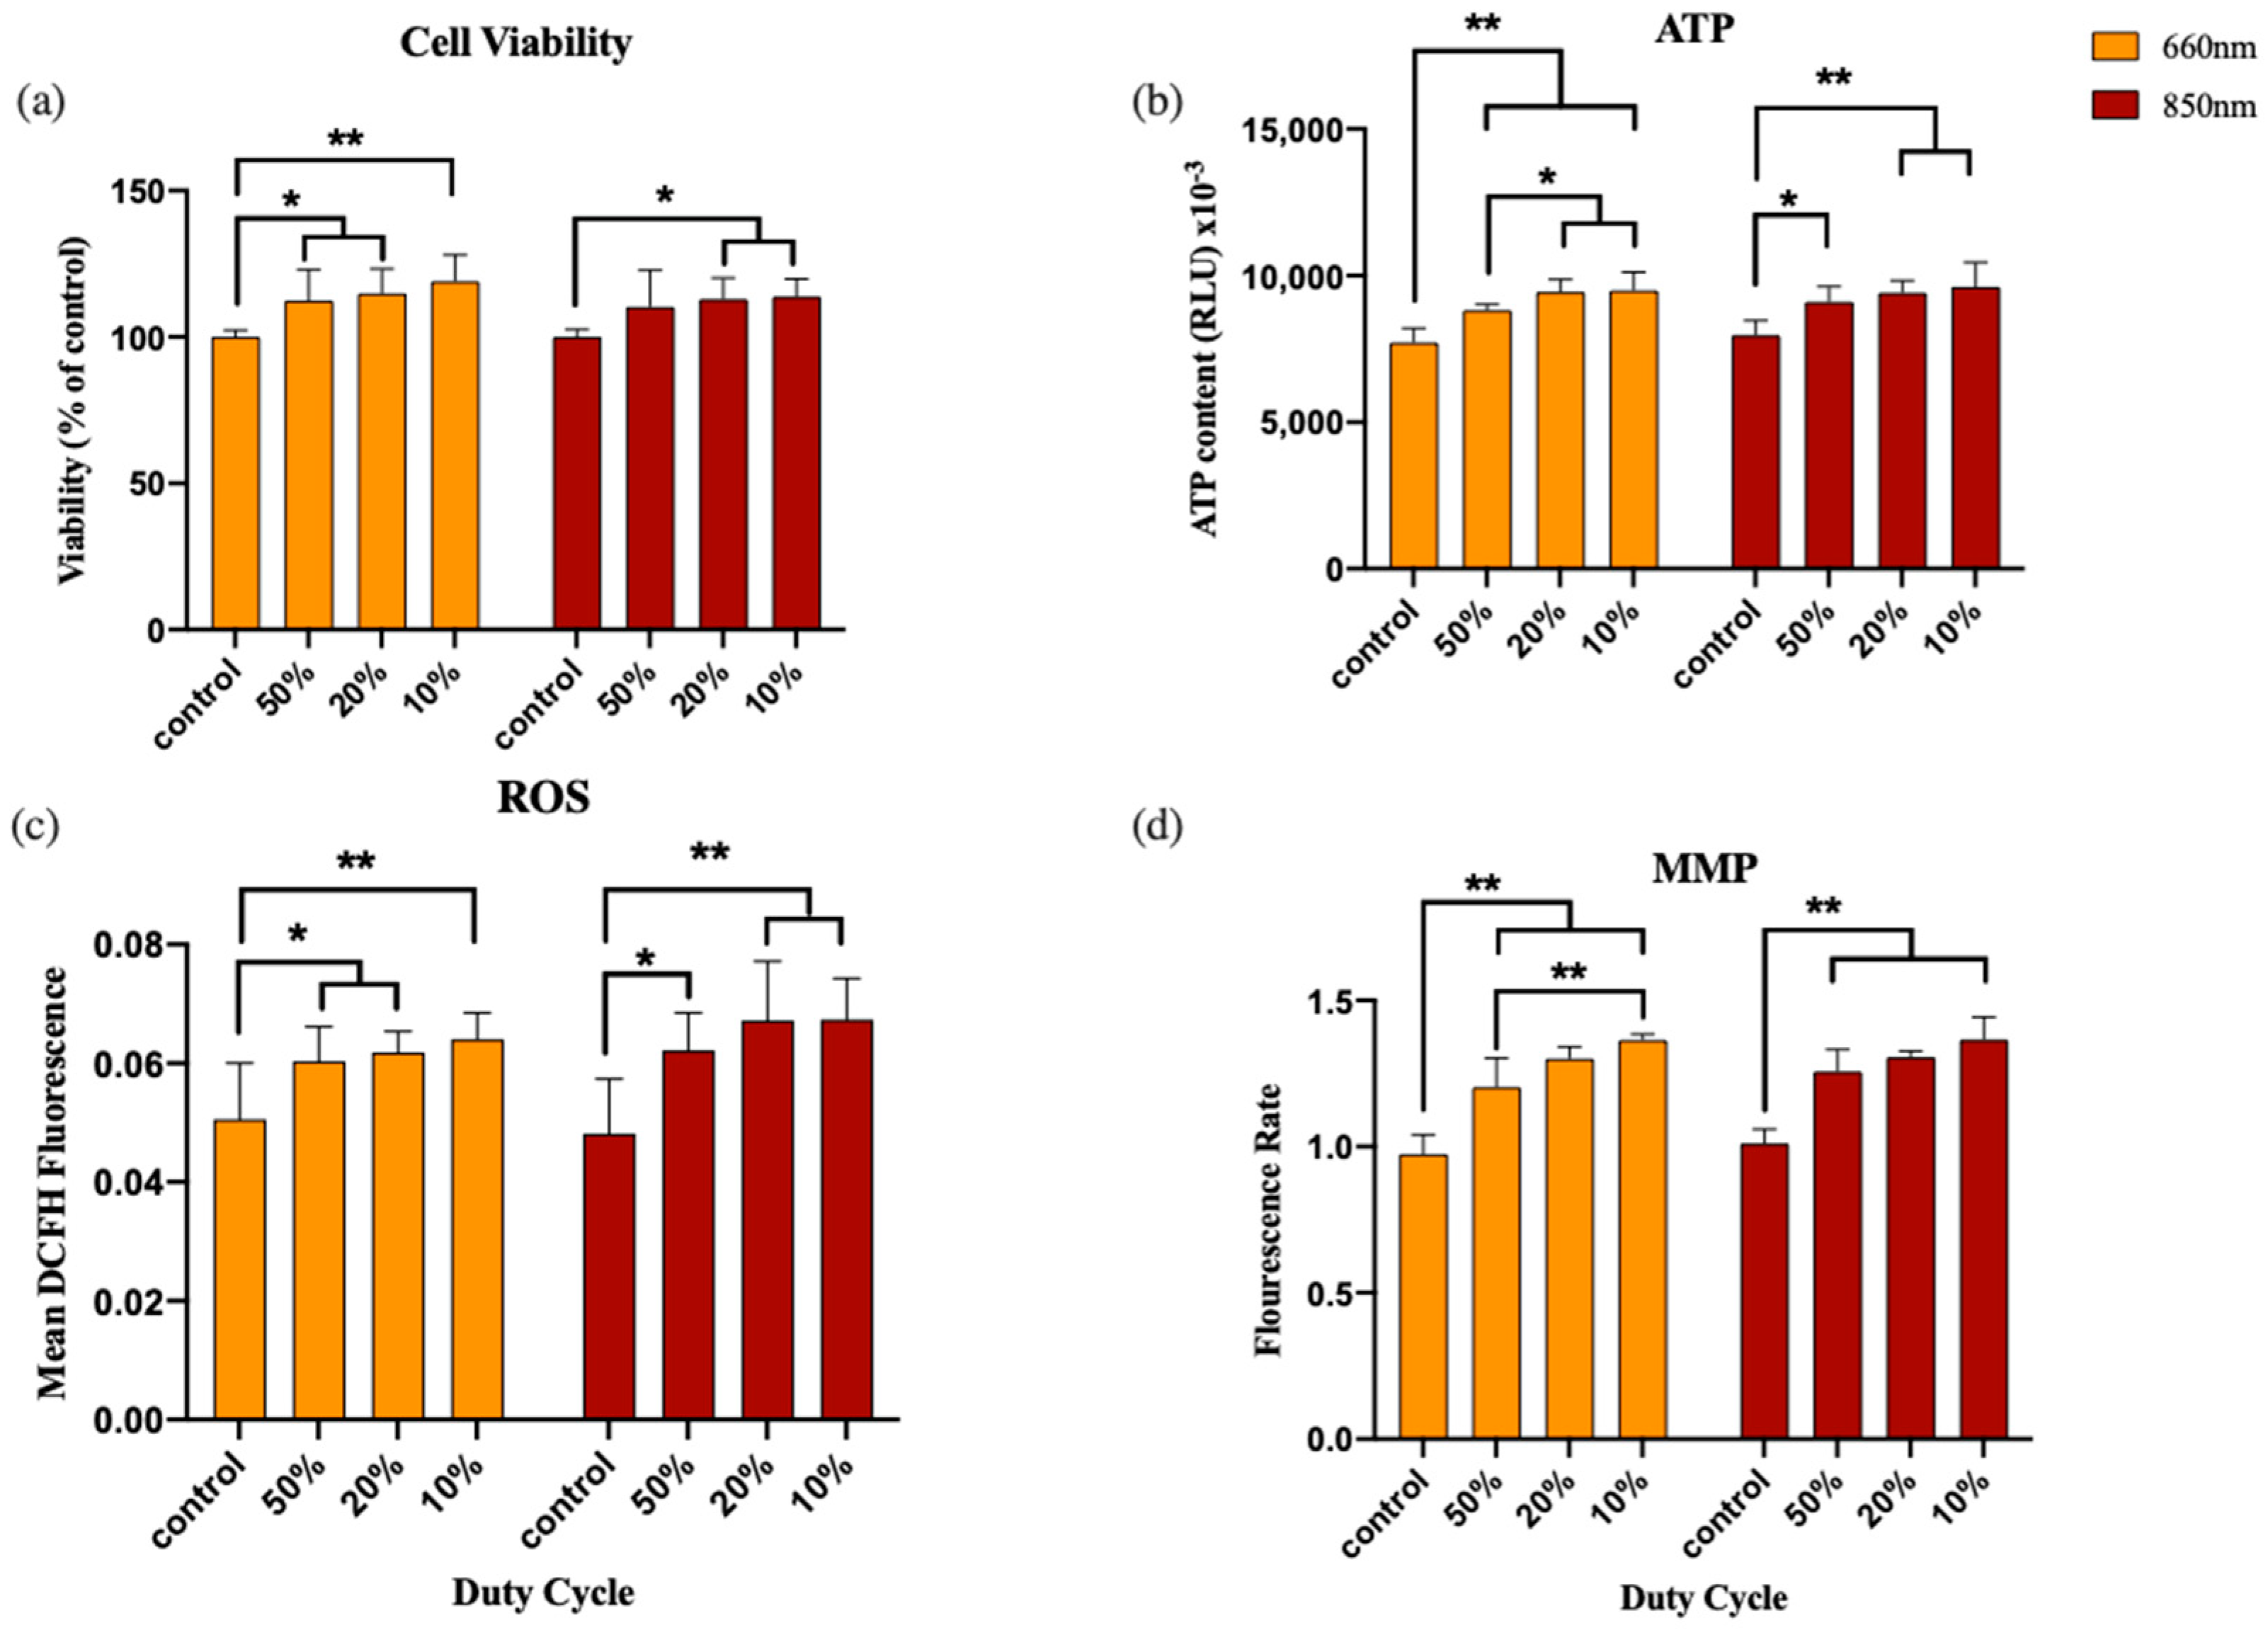
3.3. Experiment 3: Duty Cycle
4. Discussion
4.1. Discussion on Parameters Optimization
4.2. Discussion on Power Density-Time Relationship
4.3. Discussion on ATP Level Increment
5. Conclusions
Author Contributions
Funding
Conflicts of Interest
References
- Hamblin, M.R.; Agrawal, T.; de Sousa, M. Handbook of Low-Level Laser Therapy, 1st ed.; Jenny Stanford Publishing: Dubai, United Arab Emirates, 2016. [Google Scholar]
- Chung, H.; Dai, T.; Sharma, S.K.; Huang, Y.Y.; Carroll, J.D.; Hamblin, M.R. The Nuts and Bolts of Low-Level Laser (Light) Therapy. Ann. Biomed. Eng. 2012, 40, 516–533. [Google Scholar] [CrossRef]
- Lapchak, P.A.; Boitano, P.D. A Novel Method to Promote Behavioral Improvement and Enhance Mitochondrial Function Following an Embolic Stroke. Brain Res. 2016, 120, 670–683. [Google Scholar] [CrossRef] [PubMed]
- Dong, T.; Zhang, Q.; Hamblin, M.R.; Wu, M.X. Low-Level Light in Combination with Metabolic Modulators for Effective Therapy of Injured Brain. J. Cereb. Blood Flow Metab. 2015, 25, 180–182. [Google Scholar] [CrossRef] [PubMed]
- Schiffer, F.; Johnston, A.L.; Ravichandran, C.; Polcari, A.; Teicher, M.H.; Webb, R.H.; Hamblin, M.R. Psychological Benefits 2 and 4 Weeks after a Single Treatment with near Infrared Light to the Forehead: A Pilot Study of 10 Patients with Major Depression and Anxiety. Behav. Brain Funct. 2009, 5, 46. [Google Scholar] [CrossRef] [PubMed]
- Hamblin, M.R.; Huang, Y.-Y. Photobiomodulation in the Brain Low-Level Laser (Light) Therapy in Neurology and Neuroscience; Nikki Levy: Boca Raton, FL, USA, 2019. [Google Scholar]
- Mancebo, M.C.; Eisen, J.L.; Sibrava, N.J.; Dyck, I.R.; Rasmussen, S.A. Dose Response Effects of 810 Nm Laser Light on Mouse Primary Cortical Neurons. Lasers Surg. Med. 2011, 43, 851–859. [Google Scholar] [CrossRef]
- De Freitas, L.F.; Hamblin, M.R. Proposed Mechanisms of Photobiomodulation or Low-Level Light Therapy. IEEE J. Sel. Top. Quantum Electron. 2016, 22, 348–364. [Google Scholar] [CrossRef]
- Salehpour, F.; Mahmoudi, J.; Kamari, F.; Sadigh-Eteghad, S.; Rasta, S.H.; Hamblin, M.R. Brain Photobiomodulation Therapy: A Narrative Review. Mol. Neurobiol. 2018, 55, 6601–6636. [Google Scholar] [CrossRef]
- Hashmi, J.T.; Huang, Y.Y.; Sharma, S.K.; Kurup, D.B.; De Taboada, L.; Carroll, J.D.; Hamblin, M.R. Effect of Pulsing in Low-Level Light Therapy. Lasers Surg. Med. 2010, 42, 450–466. [Google Scholar] [CrossRef]
- Brondon, P.; Stadler, I.; Lanzafame, R.J. Pulsing Influences Photoradiation Outcomes in Cell Culture. Lasers Surg. Med. 2009, 41, 222–226. [Google Scholar] [CrossRef]
- Ueda, Y.; Shimizu, N. Effects of Pulse Frequency of Low-Level Laser Therapy (LLLT) on Bone Nodule Formation in Rat Calvarial Cells. J. Clin. Laser Med. Surg. 2003, 21, 271–277. [Google Scholar] [CrossRef]
- Zomorrodi, R.; Loheswaran, G.; Pushparaj, A.; Lim, L. Pulsed Near Infrared Transcranial and Intranasal Photobiomodulation Significantly Modulates Neural Oscillations: A Pilot Exploratory Study. Sci. Rep. 2019, 9, 6309. [Google Scholar] [CrossRef]
- De Taboada, L.; Yu, J.; El-Amouri, S.; Gattoni-Celli, S.; Richieri, S.; McCarthy, T.; Streeter, J.; Kindy, M.S. Transcranial Laser Therapy Attenuates Amyloid-β Peptide Neuropathology in Amyloid-β Protein Precursor Transgenic Mice. J. Alzheimer’s Dis. 2011, 23, 521–535. [Google Scholar] [CrossRef]
- Reinhart, F.; El Massri, N.; Chabrol, C.; Cretallaz, C.; Johnstone, D.M.; Torres, N.; Darlot, F.; Costecalde, T.; Stone, J.; Mitrofanis, J.; et al. Intracranial Application of Near-Infrared Light in a Hemi-Parkinsonian Rat Model: The Impact on Behavior and Cell Survival. J. Neurosurg. 2016, 124, 1829–1841. [Google Scholar] [CrossRef]
- Cooper, C.E.; Springett, R. Measurement of Cytochrome Oxidase and Mitochondrial Energetics by near–Infrared Spectroscopy. Philos. Trans. R. Soc. B Biol. Sci. 1997, 352, 669–676. [Google Scholar] [CrossRef] [PubMed]
- Jahan, A.; Nazari, M.A.; Mahmoudi, J.; Salehpour, F.; Salimi, M.M. Transcranial Near-Infrared Photobiomodulation Could Modulate Brain Electrophysiological Features and Attentional Performance in Healthy Young Adults. Lasers Med. Sci. 2019, 34, 1193–1200. [Google Scholar] [CrossRef]
- Rojas, J.C.; Bruchey, A.K.; Gonzalez-Lima, F. Low-Level Light Therapy Improves Cortical Metabolic Capacity and Memory Retention. J. Alzheimer’s Dis. 2012, 32, 741–752. [Google Scholar] [CrossRef]
- Barrett, D.W.; Gonzalez-Lima, F. Transcranial Infrared Laser Stimulation Produces Beneficial Cognitive and Emotional Effects in Humans. Neuroscience 2013, 230, 13–23. [Google Scholar] [CrossRef] [PubMed]
- Holmes, E.; Barrett, D.W.; Saucedo, C.L.; O’Connor, P.; Liu, H.; Gonzalez-Lima, F. Cognitive Enhancement by Transcranial Photobiomodulation Is Associated With Cerebrovascular Oxygenation of the Prefrontal Cortex. Front. Neurosci. 2019, 13, 1129. [Google Scholar] [CrossRef] [PubMed]
- Lapchak, P.A.; Salgado, K.F.; Chao, C.H.; Zivin, J.A. Transcranial Near-Infrared Light Therapy Improves Motor Function Following Embolic Strokes in Rabbits: An Extended Therapeutic Window Study Using Continuous and Pulse Frequency Delivery Modes. Neuroscience 2007, 148, 907–914. [Google Scholar] [CrossRef]
- Khanh, T.Q.; Bodrogi, P.; Vinh, Q.T.; Winkler, H. LED Lighting: Technology and Perception; John Wiley & Sons: Hoboken, NJ, USA, 2014. [Google Scholar]
- Loo, K.; Lun, W.; Tan, S.; Lai, Y.; Tse, C. On Driving Techniques for LEDs: Toward a Generalized Methodology. IEEE Trans. Power Electron. 2009, 24, 2967–2976. [Google Scholar] [CrossRef]
- Meng, C.; He, Z.; Xing, D. Low-Level Laser Therapy Rescues Dendrite Atrophy via Upregulating BDNF Expression: Implications for Alzheimer’s Disease. J. Neurosci. 2013, 33, 13505–13517. [Google Scholar] [CrossRef] [PubMed]
- Oron, U.; Ilic, S.; De Taboada, L.; Streeter, J. Ga-As (808 Nm) Laser Irradiation Enhances ATP Production in Human Neuronal Cells in Culture. Photomed. Laser Surg. 2007, 25, 180–182. [Google Scholar] [CrossRef] [PubMed]
- Grillo, S.L.; Duggett, N.A.; Ennaceur, A.; Chazot, P.L. Non-Invasive Infra-Red Therapy (1072 Nm) Reduces β-Amyloid Protein Levels in the Brain of an Alzheimer’s Disease Mouse Model, TASTPM. J. Photochem. Photobiol. B. 2013, 123, 13–22. [Google Scholar] [CrossRef]
- Moro, C.; El Massri, N.; Torres, N.; Ratel, D.; De Jaeger, X.; Chabrol, C.; Perraut, F.; Bourgerette, A.; Berger, M.; Purushothuman, S.; et al. Photobiomodulation inside the Brain: A Novel Method of Applying near-Infrared Light Intracranially and Its Impact on Dopaminergic Cell Survival in MPTP-Treated Mice: Laboratory Investigation. J. Neurosurg. 2014, 120, 670–683. [Google Scholar] [CrossRef]
- Zhang, Q.; Zhou, C.; Hamblin, M.R.; Wu, M.X. Low-Level Laser Therapy Effectively Prevents Secondary Brain Injury Induced by Immediate Early Responsive Gene X-1 Deficiency. J. Cereb. Blood Flow Metab. 2014, 32, 1391–1401. [Google Scholar] [CrossRef] [PubMed]
- Huang, Y.Y.; Chen, A.C.; Carroll, J.D.; Hamblin, M.R. Biphasic Dose Response in Low Level Light Therapy. Dose-Response 2009, 7, 358–383. [Google Scholar] [CrossRef]
- Salehpour, F.; Cassano, P.; Rouhi, N.; Hamblin, M.R.; De Taboada, L.; Farajdokht, F.; Mahmoudi, J. Penetration Profiles of Visible and Near-Infrared Lasers and Light-Emitting Diode Light through the Head Tissues in Animal and Human Species: A Review of Literature. Photobiomodulation Photomed. Laser Surg. 2019, 37, 581–595. [Google Scholar] [CrossRef]
- Rosenberg, N.; Gendelman, R.; Noofi, N. Photobiomodulation of Human Osteoblast-like Cells in Vitro by Low-Intensity-Pulsed LED Light. FEBS Open Bio 2020, 10, 1276–1287. [Google Scholar] [CrossRef]
- Garza, K.M.; Zhang, L.; Borron, B.; Wood, L.B.; Singer, A.C. Gamma Visual Stimulation Induces a Neuroimmune Signaling Profile Distinct from Acute Neuroinflammation. J. Neurosci. 2020, 40, 1211–1225. [Google Scholar] [CrossRef]
- Henderson, T.A.; Morries, L.D. Near-Infrared Photonic Energy Penetration: Can Infrared Phototherapy Effectively Reach the Human Brain? Neuropsychiatr. Dis. Treat. 2015, 11, 2191–2208. [Google Scholar] [CrossRef]
- Ilic, S.; Leichliter, S.; Streeter, J.; Oron, A.; DeTaboada, L.; Oron, U. Effects of Power Densities, Continuous and Pulse Frequencies, and Number of Sessions of Low-Level Laser Therapy on Intact Rat Brain. Photomed. Laser Surg. 2006, 24, 458–466. [Google Scholar] [CrossRef] [PubMed]
- Golovynska, I.; Golovynskyi, S.; Stepanov, Y.V.; Stepanova, L.I.; Qu, J.; Ohulchanskyy, T.Y. Red and Near-Infrared Light Evokes Ca2+ Influx, Endoplasmic Reticulum Release and Membrane Depolarization in Neurons and Cancer Cells. J. Photochem. Photobiol. B Biol. 2021, 214, 112088. [Google Scholar] [CrossRef] [PubMed]


| Parameter | Unit | Description | Calculating Formula |
|---|---|---|---|
| Ton | s | The “on” time of the pulse interval duration | |
| Toff | s | The “off” time of the pulse interval duration | |
| T | s | The time duration of one-pulse interval | T = Ton + Toff |
| Frequency (f) | Hz | The number of pulse intervals per unit of time | f = 1/T |
| Duty cycle (D) | % | A unitless fractional number or % standing for the proportion of pulse-on time in each pulse interval | D = Ton/T |
| Power density | mW/cm2 | The intensity of power delivered per unit area and time | |
| Peak power density (Ppeak) | mW/cm2 | The power density of the “on” time of the pulse | |
| Average power density (Paverage) | mW/cm2 | The mean power density of the pulse interval duration | Paverage = Ppeak × D |
| Fluence | J/cm2 | The accumulated power delivered during the treatment per unit irradiation area | Fluence = Paverage × Irradiation Time |
| Dose | J | The accumulated power delivered during the treatment | Dose = Fluence × Irradiation area |
| Group | Operation Mode | Power Density | Irradiation Time | Fluence |
|---|---|---|---|---|
| Control | / | |||
| 660 nm | CW | 5 mW/cm2 | 8 min | 2.4 J/cm2 |
| CW | 10 mW/cm2 | 4.8 J/cm2 | ||
| CW | 20 mW/cm2 | 9.6 J/cm2 | ||
| CW | 50 mW/cm2 | 24 J/cm2 | ||
| CW | 100 mW/cm2 | 48 J/cm2 | ||
| 850 nm | CW | 5 mW/cm2 | 2.4 J/cm2 | |
| CW | 10 mW/cm2 | 4.8 J/cm2 | ||
| CW | 20 mW/cm2 | 9.6 J/cm2 | ||
| CW | 50 mW/cm2 | 24 J/cm2 | ||
| CW | 100 mW/cm2 | 48 J/cm2 | ||
| Group | Operation Mode | Paverage | Irradiation Time | Fluence | ||
|---|---|---|---|---|---|---|
| Control | / | |||||
| 660 nm | CW | 10 mW/cm2 | 8 min | 4.8 J/cm2 | ||
| PW | ||||||
| Frequency | Duty cycle | Ppeak | ||||
| 40 Hz | 50% | 20 mW/cm2 | ||||
| 100 Hz | 50% | 20 mW/cm2 | ||||
| 1000 Hz | 50% | 20 mW/cm2 | ||||
| 850 nm | CW | |||||
| PW | ||||||
| Frequency | Duty cycle | Ppeak | ||||
| 40 Hz | 50% | 20 mW/cm2 | ||||
| 100 Hz | 50% | 20 mW/cm2 | ||||
| 1000 Hz | 50% | 20 mW/cm2 | ||||
| Group | Operation Mode | Paverage | Irradiation Time | Fluence | ||
|---|---|---|---|---|---|---|
| Control | / | |||||
| 660 nm | CW | 10 mW/cm2 | 8 min | 4.8 J/cm2 | ||
| PW | ||||||
| Frequency | Duty cycle | Ppeak | ||||
| 40 Hz | 10% | 100 mW/cm2 | ||||
| 40 Hz | 20% | 50 mW/cm2 | ||||
| 40 Hz | 50% | 20 mW/cm2 | ||||
| 850 nm | CW | |||||
| PW | ||||||
| Frequency | Duty cycle | Ppeak | ||||
| 40 Hz | 10% | 100 mW/cm2 | ||||
| 40 Hz | 20% | 50 mW/cm2 | ||||
| 40 Hz | 50% | 20 mW/cm2 | ||||
Disclaimer/Publisher’s Note: The statements, opinions and data contained in all publications are solely those of the individual author(s) and contributor(s) and not of MDPI and/or the editor(s). MDPI and/or the editor(s) disclaim responsibility for any injury to people or property resulting from any ideas, methods, instructions or products referred to in the content. |
© 2023 by the authors. Licensee MDPI, Basel, Switzerland. This article is an open access article distributed under the terms and conditions of the Creative Commons Attribution (CC BY) license (https://creativecommons.org/licenses/by/4.0/).
Share and Cite
Tang, L.; Qin, H.; Lin, S.; Liu, M. Effects of Pulsed Red and Near-Infrared Light on Neuroblastoma Cells—Pilot Study on Frequency and Duty Cycle. Photonics 2023, 10, 315. https://doi.org/10.3390/photonics10030315
Tang L, Qin H, Lin S, Liu M. Effects of Pulsed Red and Near-Infrared Light on Neuroblastoma Cells—Pilot Study on Frequency and Duty Cycle. Photonics. 2023; 10(3):315. https://doi.org/10.3390/photonics10030315
Chicago/Turabian StyleTang, Luyao, Haokuan Qin, Shangfei Lin, and Muqing Liu. 2023. "Effects of Pulsed Red and Near-Infrared Light on Neuroblastoma Cells—Pilot Study on Frequency and Duty Cycle" Photonics 10, no. 3: 315. https://doi.org/10.3390/photonics10030315
APA StyleTang, L., Qin, H., Lin, S., & Liu, M. (2023). Effects of Pulsed Red and Near-Infrared Light on Neuroblastoma Cells—Pilot Study on Frequency and Duty Cycle. Photonics, 10(3), 315. https://doi.org/10.3390/photonics10030315