Communication

Pulse Measurement from a Polluted Frequency Resolved Optical Gating Trace Based on Half-Trace Retrieval Algorithm

Joint Laboratory on High Power Laser and Physics, Shanghai Institute of Optics and Fine Mechanics, Chinese Academy of Sciences, Shanghai 201800, China
*
Authors to whom correspondence should be addressed.
Photonics 2023, 10(3), 255; https://doi.org/10.3390/photonics10030255
Submission received: 3 January 2023 / Revised: 18 February 2023 / Accepted: 24 February 2023 / Published: 28 February 2023

Abstract

:
A half-trace retrieval algorithm based on an extended-ptychographical iterative engine algorithm is proposed to reconstruct the temporal structure of pulse from a polluted and recorded frequency-resolved optical gating (FROG) trace that was modulated by poor spatial profile of output pulses, stray light, or misalignment of the measurement setup. In the proposed algorithm, the probe pulse and the gated pulse were retrieved simultaneously from a recorded FROG trace with a half-delay range, and the measured pulse was obtained by combining the different edges of the probe pulse and the gated pulse. Numerical simulations were carried out to verify the feasibility of the proposed algorithm. A single-shot picoseconds (ps)−THG−FROG setup with a 100 - μ J ps laser system and an online ps−SHG−FROG setup in PW laser system were built to test the proposed algorithm experimentally. The results show that the temporal structure of pulses retrieved by the half-trace retrieval algorithm is closer to the real temporal structure than that retrieved by the conventional ptychographical algorithm when the recorded FROG trace is badly polluted.

1. Introduction

The advent of ultrashort, ultra-intense pulse lasers has promoted the development of research in the fields of particle acceleration [1], inertial confinement fusion [2,3], and high-energy-density science [4]. In order to carry out research in the aforementioned fields, many ultrashort, ultra-intense lasers have been established around the world, including the advanced radiographic capability (ARC) [5,6] laser system at the Omega EP facility [7,8], at the Vulcan and Orion facilities [9,10], and the petawatt (PW) laser at the Shen Guang II (SG−-II) facility [11]. All of these facilities can provide laser pulses with pulse widths in the order of picoseconds(ps) and energies in the order of kilojoules. The complete characterization of the temporal intensity distribution and the phase distribution of PW laser pulses is important as even small variations in both the intensity distribution and in the phase distribution can distort the output pulse distribution and influence the result of physical experiments. Frequency-resolved optical gating (FROG), proposed by Kane and Trebino [12], is probably the most commonly used method to fully characterize ultrashort optical pulses. Additionally, two separate branches of retrieval algorithms were developed to reconstruct the temporal structure of pulses from the measured FROG trace, including the principal component generalized projections algorithm (PCGPA) [13,14,15,16] and the ptychographic-based reconstruction algorithm [17,18]. The former method works well when no prior information about the measured pulse is available, while the later has the advantage of not requiring a Fourier transform relation between the frequency and the time axes [19]. However, both of these algorithms require a less polluted FROG trace that is caused by nonuniform spatial profile of the measured pulse, stray light or misalignment of the measurement setup. In addition, the delay range of these two method, and which should cover the positive delay (when the front edge of the gated pulse interacts with the rear edge of the probe pulse) and the negative delay (when the rear edge of the gated pulse interacts with the front edge of the probe pulse). However, it is difficult to acquire an ideal recorded FROG trace in the real world, especially in high power laser systems. For example, Chen et al. characterized ps laser pulses in ARC using a commercial single-shot second-harmonic generation (SHG) FROG after the output pulses were compressed to near the transform limit using a mini-compressor on the ARC diagnostic table [20]. However, the recorded SHG−FROG trace was not found to be as symmetric as expected in theory, which would lead to incorrect reconstruction results. Though a mirror image of the good half can be well applied in the SHG−FROG experiment, it cannot be applied in other variants of FROG, such as third harmonic generation (THG)−FROG, which would provide much more information (direction of time), since THG−FROG trace is not always as symmetrical as SHG−FROG trace. Therefore, it is urgent to develop a method that can be used to reconstruct the temporal structure of pulses when the recorded FROG trace is partially polluted. In our previous work, a mirror-image configuration was introduced to our homemade single-shot ps−SHG−FROG to balance the nonuniformity of the spatial distribution of the measured pulse [21]. However, the recorded SHG−FROG trace was found still to be slightly asymmetric, which would result in inaccurate reconstruction results. That is to say, the full online characterization of output pulses in a high-power laser system has not been demonstrated accurately so far.
In this paper, a new variant of the ptychographic inversion engine [22]—the half-trace retrieval algorithm—was proposed to reconstruct the temporal structure of pulses from a partially polluted FROG trace. Numerical simulations are used to demonstrate the feasibility of this proposed method for recovering a pulse from a polluted THG−FROG trace. The results show that the proposed half-trace retrieval algorithm outperforms the conventional ptychographic algorithm, especially when the recorded trace is modulated by a partially polluted spatial profile of the measured pulse. In addition, a single-shot ps−THG−FROG setup based on a cross-correlator was built to demonstrate the half-trace retrieval algorithm experimentally on an off-line laser system, and a SHG−FROG experiment was carried out in the PW laser system to diagnostic the output pulse. The proposed half-trace retrieval algorithm showed effective performance in reconstructing the temporal structure of ps laser pulses from a partially polluted FROG trace, both in the compact laser system and the PW laser system.

2. Methods

We applied the extend ptychographic iterative engine (ePIE) algorithm [22] to retrieve the temporal structure of pulses. Unlike the traditional ptychographic-based and PCGP algorithms, the proposed algorithm uses a FROG trace with a half-delay range to reconstruct the temporal structure of pulses. Additionally, the reason why the whole temporal structure of pulses can be retrieved from FROG trace only with half-delay range can be explained as follows. In spatial domain, the complexed-valued object and the complex wavefield incident on the specimen can be retrieved simultaneously using the ePIE algorithm. Therefore, we can conclude that the probe pulse and the gated pulse can be reconstructed simultaneously using the ePIE algorithm. When the probe pulse (green line) is incident on the nonlinear crystal before the gated pulse (red line), the output nonlinear signal was generated by interacting with the rear edge of the probe pulse and the front edge of the gated pulse in Figure 1a. Considering the measured pulse can be represented by probe pulse and gated pulse, respectively, we can reconstruct the part of the probe pulse and gated pulse, as presented in the box of the Figure 1b. After transforming the probe pulse and the gated pulse to the form of the measured pulse, we can reconstruct the whole temporal structure of pulses by combining the rear edge of the probe pulse and the front edge of the gated pulse together.
Assuming THG−FROG for simplicity and generality, the measured trace is represented as
I ( ω , τ ) = | + E 2 ( t ) E ( t τ ) e j ω t d t | 2 ,
where E 2 ( t ) is the probe pulse, E ( t τ ) is the gated pulse, and τ is the time delay between two pulses (taking the delay range when the probe pulse is incident on the nonlinear crystal before the gated pulse as an example, that is, τ 0 ). The iterative reconstruction procedures of the half trace retrieval algorithm are described as follows (assumming that the recorded FROG trace include the most spectrum at τ = 0 ). The algorithm starts with a random guess of pulse E 0 ( t ) .
  • At first, we denote the pulse guess before the n-th iteration as E n 1 ( t ) . The THG signal in the n th iteration is represented as
    Ψ n ( t , k ( j ) ) = E n 1 2 ( t ) E n 1 ( t k ( j ) · d τ ) ,
    where k ( j ) is the index of the running step delay, and d τ is the time delay step.
  • THG signal is Fourier transformed, and its modulus is replaced by the square root of the measured spectrum at the j-th delay
    Ψ n ( ω , k ( j ) ) = I ( ω , k ( j ) ) F ( Ψ n ( t , k ( j ) ) ) | F ( Ψ n ( t , k ( j ) ) ) | ,
    where F ( · ) denotes the Fourier transform function.
  • The updated THG signal can be calculated by the inverse Fourier transform as
    Ψ n , ( t , k ( j ) ) = F 1 [ Ψ n ( ω , k ( j ) ) ] ,
    where F 1 ( · ) denotes the inverse Fourier transform function.
  • The probe pulse and the gated pulse can be updated as
    P n 2 ( t ) = E n 1 2 ( t ) + α E n 1 * ( t k ( j ) · d τ ) | E n 1 ( t k ( j ) · d τ ) | m a x 2 × ( Ψ n , ( t , k ( j ) ) Ψ n ( t , k ( j ) ) ) ,
    G n ( t k ( j ) · d τ ) = E n 1 ( t k ( j ) · d τ ) + α E n 1 2 * ( t ) | E n 1 2 ( t ) | m a x 2 × ( Ψ n , ( t , k ( j ) ) Ψ n ( t , k ( j ) ) ) ,
    where the update coefficient α is set as that in [21]
  • The complete pulse distribution can be reconstructed by connecting the front edge of the pulse P ( t ) and the rear edge of the pulse G ( t ) together as (Both of the centroid of pulses P ( t ) and G ( t ) are moved to t = 0 , and the centroid of the intensity distribution of pulse P ( t ) and G ( t ) is calculated by t c = t t | E ( t ) | 2 / t | E ( t ) | 2 , where | E ( t ) | 2 represents the temporal intensity distribution of the pulse.
    E n ( t ) = P n ( t ) , t 0 , G n ( t ) , t > 0 .
  • E n ( t ) is chosen as the next initial guess, and the procedures from steps one to five are repeated in the next delay index. The FROG error between the calculated and measured traces is calculated until all of the delay indices are updated once an iteration, as follows:
    E r n = 1 N · N / 2 j = N 2 + 1 0 ω I ( ω , k ( j ) ) | F ( E n 2 ( t ) E n ( t k ( j ) · d τ ) ) | 2 I ( ω , k ( j ) ) 2
    where N denotes the number of sampling points. The iterations continue until the error E r n is smaller than the signal-to-noise ratio (SNR) or until a fixed number of iterations is completed. At last, the procedures from steps one to six are repeated for the other ten initial guesses of pulses E 0 ( t ) , and the results with the smallest FROG error were chosen for the final solution.

3. Results and Discussion

3.1. Numerical Simulation

First, the feasibility of the half-trace retrieval algorithm is demonstrated numerically. (To distinguish the conventional algorithm from the proposed half trace retrieval algorithm, we refer to the original algorithm using the complete FROG trace as complete trace retrieval algorithm.) We numerically produced a laser pulse, conforming to a Gaussian power spectrum with a random spectral phase centered at 800 nm. The complete simulated THG−FROG trace was composed of 256 × 256 points (256 represents the number of spectral sampling points and the number of delay steps) with equal delay step size, d τ = 1.5625 f s , and spanning the same frequency window (i.e., the spectral resolution is 1 N d τ = 2.5 T H z ). White-Gaussian noise σ was added to the simulated THG−FROG trace, at different SNR values, defined by S N R = 20 l o g I F R O G σ , where · denotes the L2 norm. Figure 2 presents the reconstructed results when the recorded FROG trace is not polluted, except for noise. SNR noise of 20 dB was added to the simulated FROG trace of the measured pulse in Figure 2a to generate the noised trace, as presented in Figure 2b. No prior information about the pulse was assumed. Figure 2c–n present the reconstructed results. The first horizontal panel presents the results retrieved from the complete trace, while the other two panels present the results retrieved from the negative delay range ( τ < 0 ) and the positive delay range ( τ > 0 ), respectively. Figure 2c–e show the corresponding reconstructed traces. The associated amplitude and phase of the reconstructed pulse are shown in Figure 2f–h and Figure 2i–k, respectively, with respect to the original temporal structure. The corresponding retrieved spectral intensity distributions are presented in Figure 2l–n. As shown, the half-trace retrieval algorithm works well with both the half trace with a positive delay range and the half trace with a negative delay range.
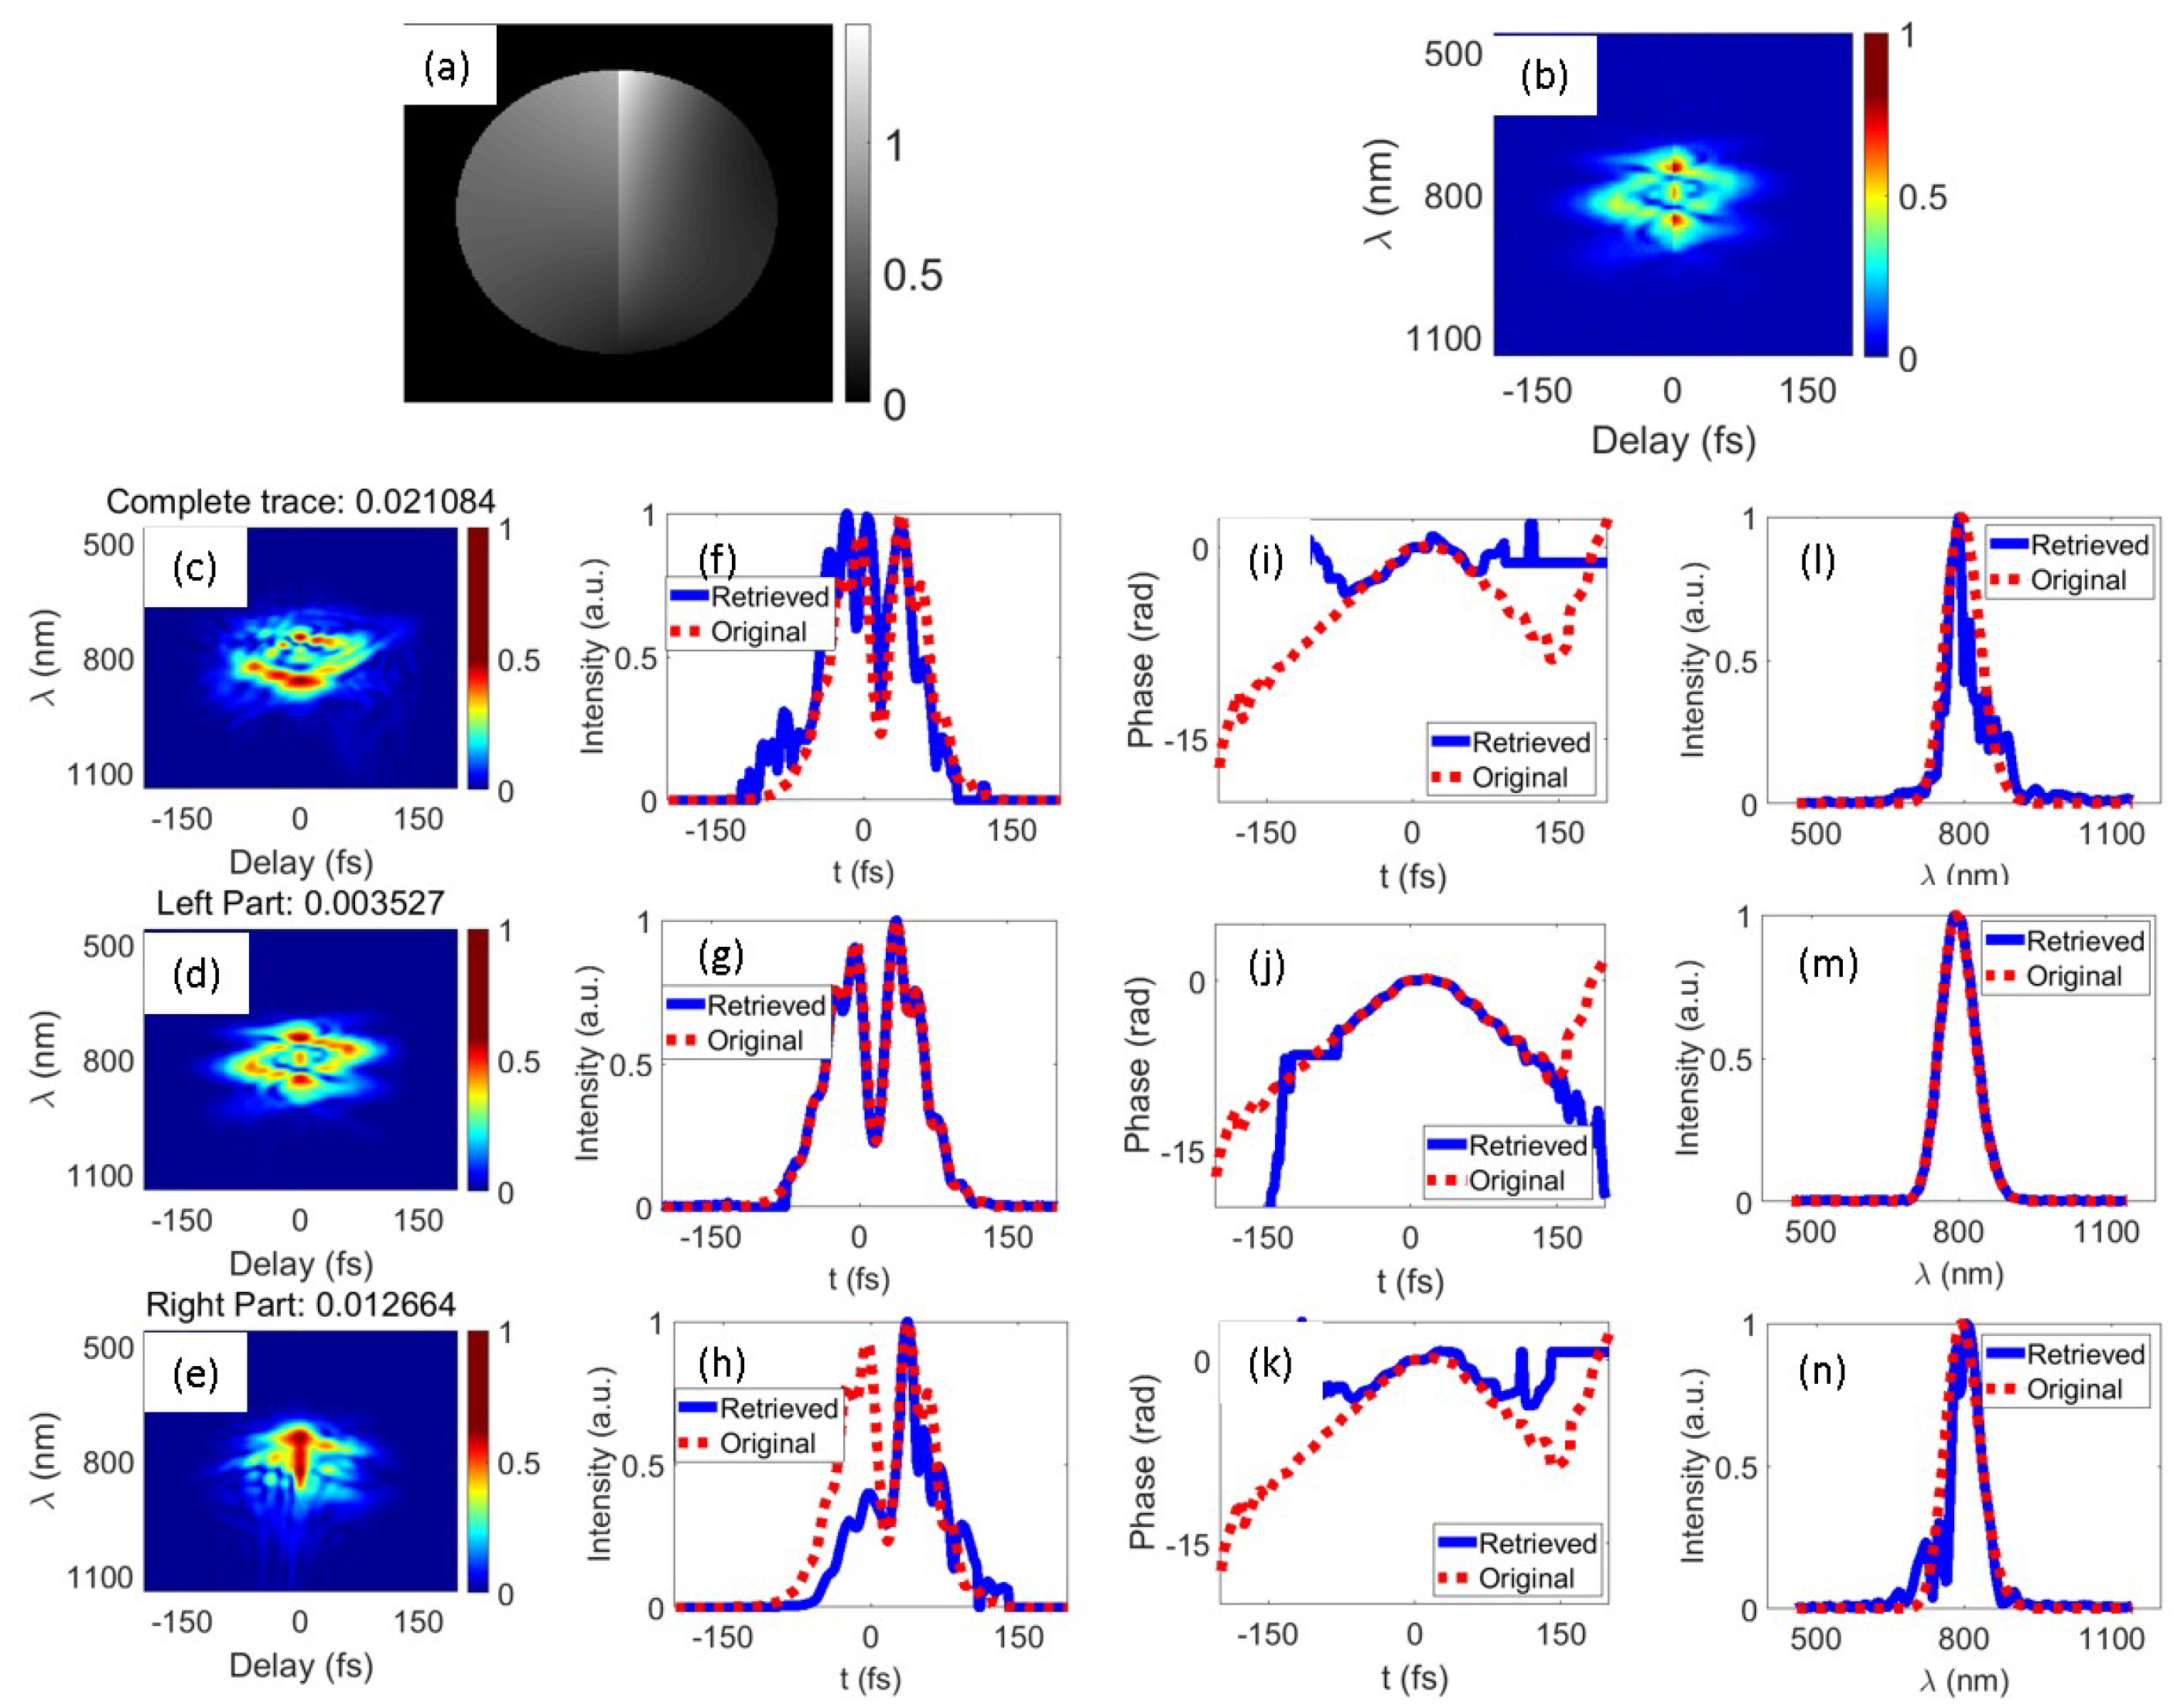
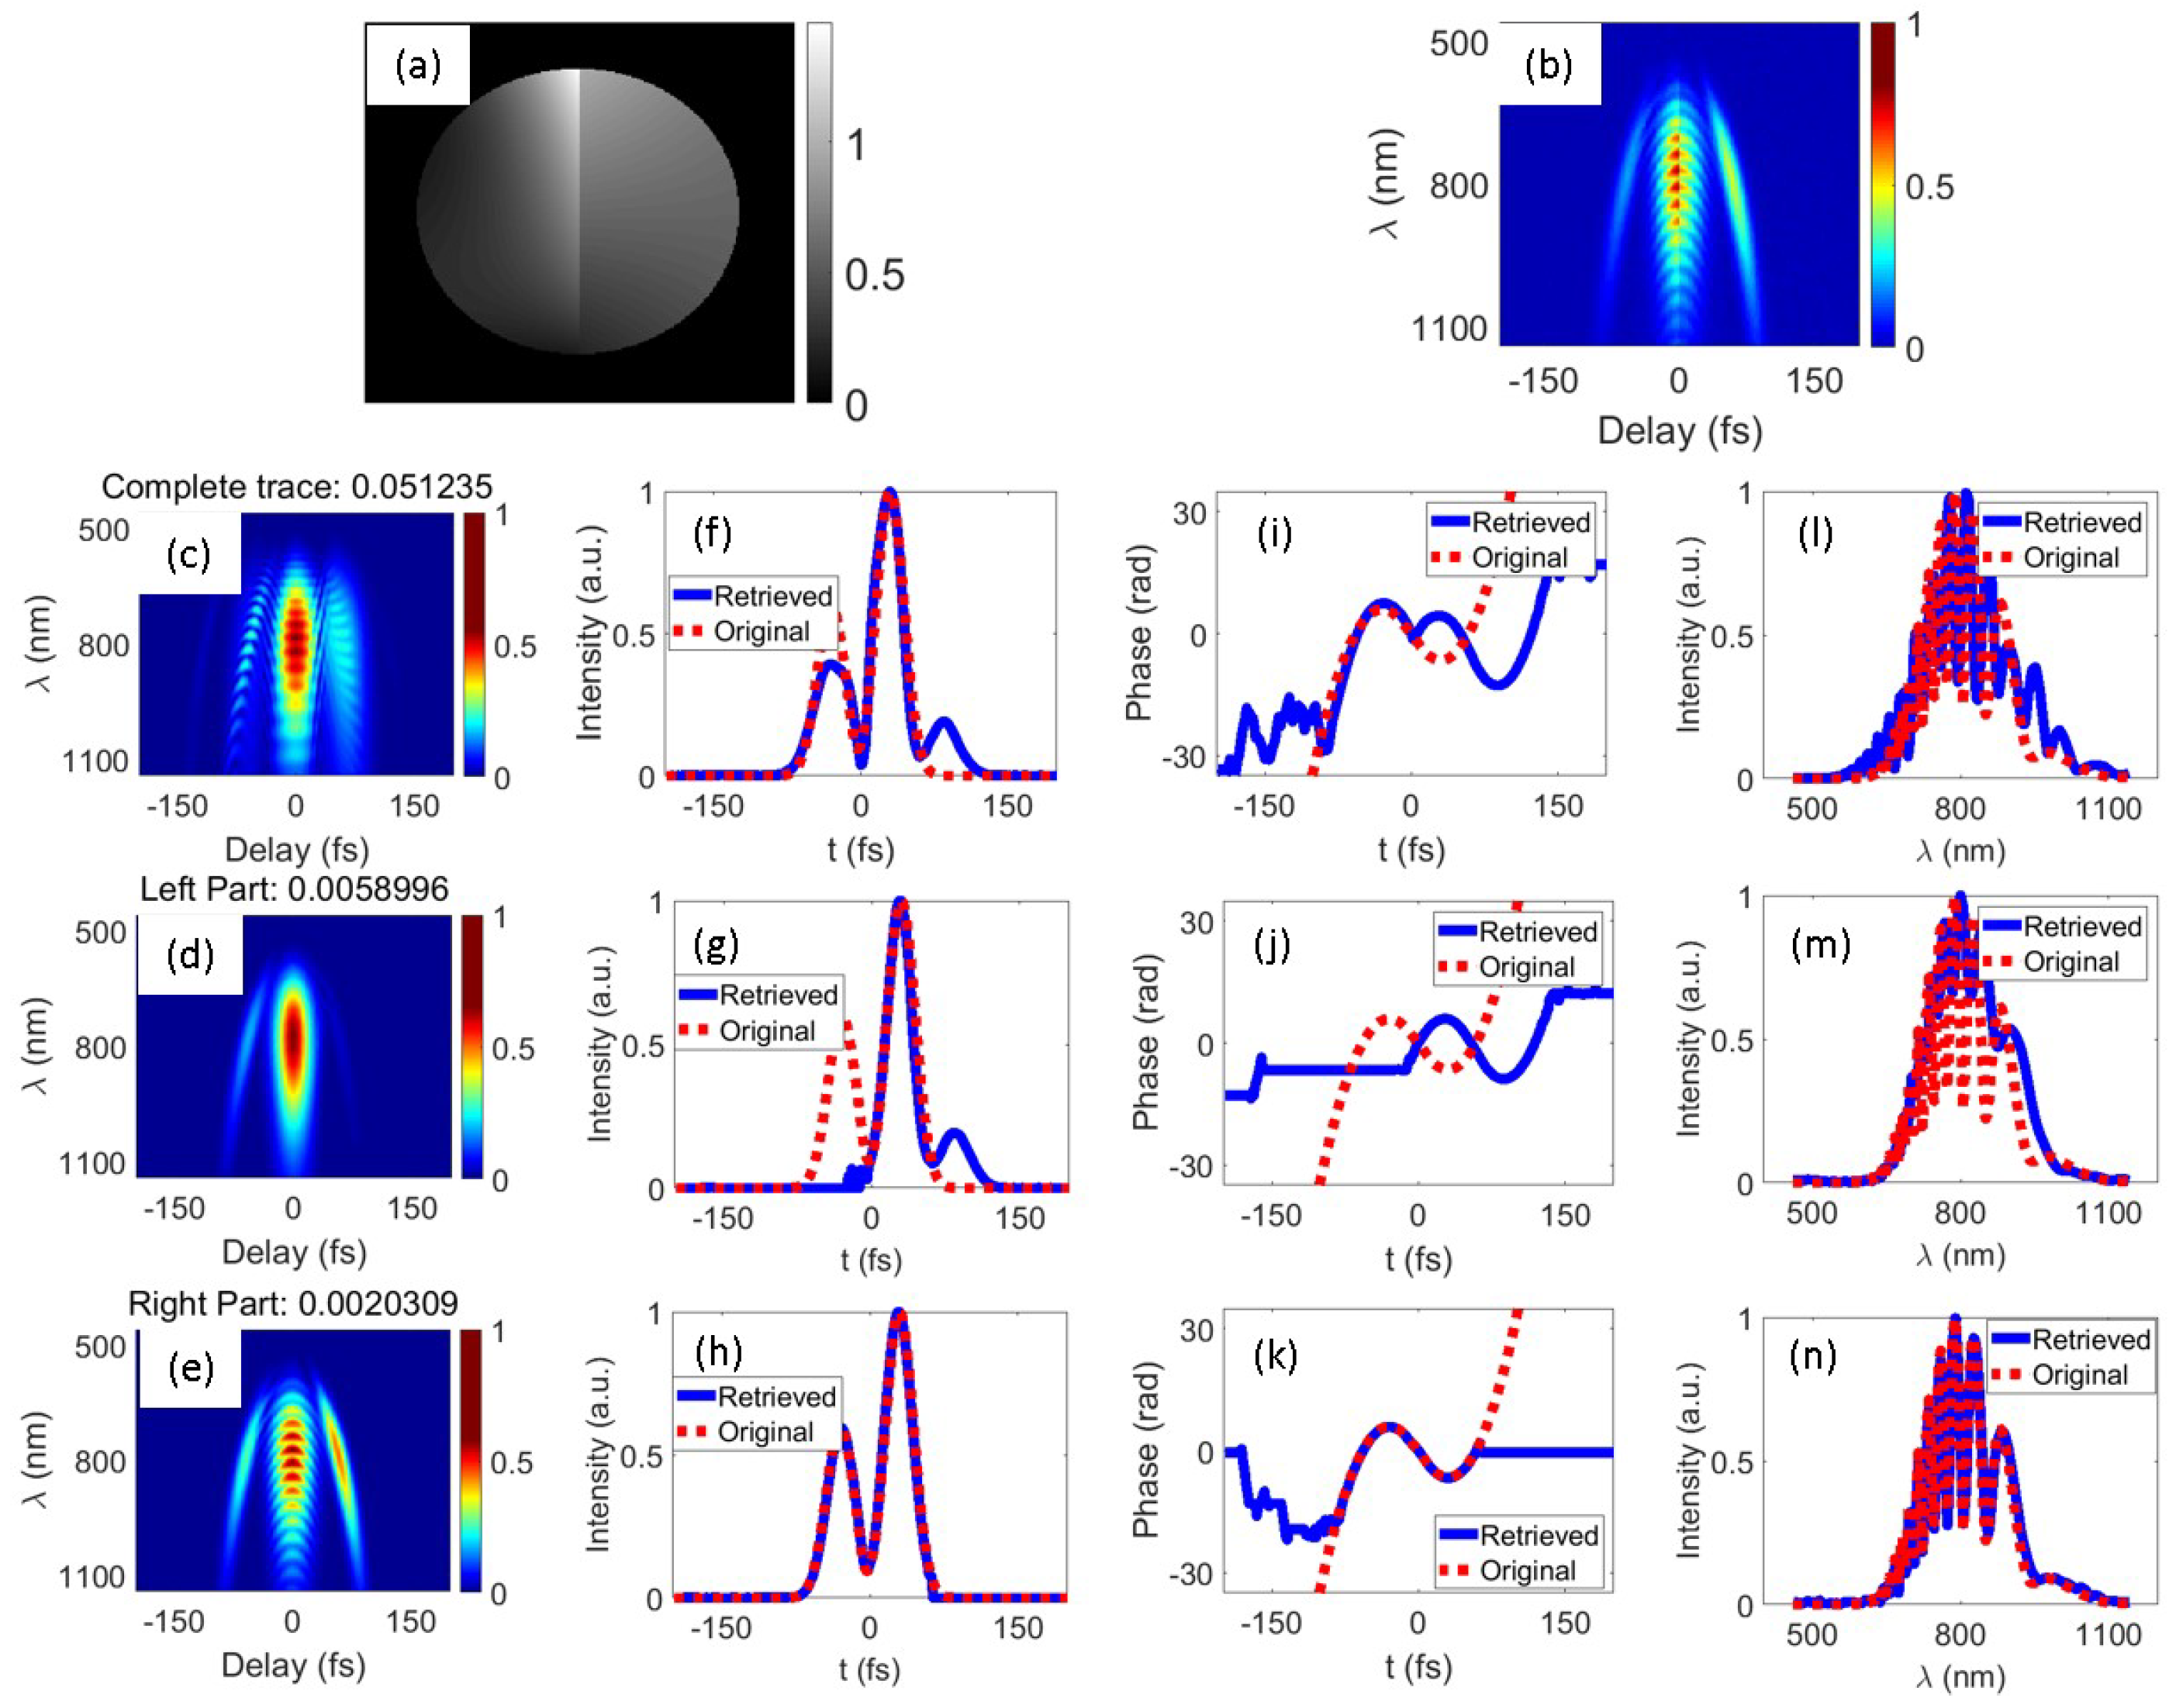
Furthermore, we also numerically verified the performance of the half-trace retrieval algorithm when the recorded FROG trace was partially modulated by poor spatial profile. The results are presented in Figure 3. The polluted FROG trace presented in Figure 3b was generated by mapping the simulated poor spatial profile presented in Figure 3a to the simulated FROG trace, as shown in Figure 2a. The root mean square (RMS) value of the spatial profile in Figure 3a is 0.0374, and the RMS value of the left part is 0.0095, while the RMS value of the right part is 0.0401. In Figure 3c–n, each horizontal panel presents the results reconstructed from the complete trace, the trace with positive delay range, and the trace with negative delay range, respectively. The reconstructed complete traces using different parts of the polluted trace are presented in Figure 3c–e, respectively, and the reconstructed errors are presented above them. The corresponding retrieved temporal amplitude and phase distributions are presented in Figure 3f–h and Figure 3i–k, respectively, along with the original temporal structure (dashed line). The reconstructed spectral amplitude distributions with respect to the original are presented in Figure 3l–n. By comparing different reconstructed temporal structure of pulses retrieved from different parts of the polluted trace, we can clearly find that only the temporal structure retrieved by the proposed algorithm from the polluted part with a smaller RMS value can successfully match the original temporal structure of pulse, while the complete trace retrieval algorithm fails to reconstruct the true temporal structure of pulses. Hence, the half-trace retrieval algorithm is more reliable for reconstructing the temporal structure of pulses when the recorded FROG trace is modulated by poor spatial profile. In addition, a simulation of a double Gaussian chirped pulse was also added to test the universality of this retrieval algorithm. Additionally, the results are presented in Figure 4, while the spatial distribution is presented in Figure 4a, which has symmetry to that in Figure 3a. From the numerical results, we can conclude that the half-trace retrsieval algorithm shows better performance than the complete-trace retrieval algorithm when the recorded FROG trace is modulated by poor spatial values near the field of the measured pulse.

3.2. Experiments

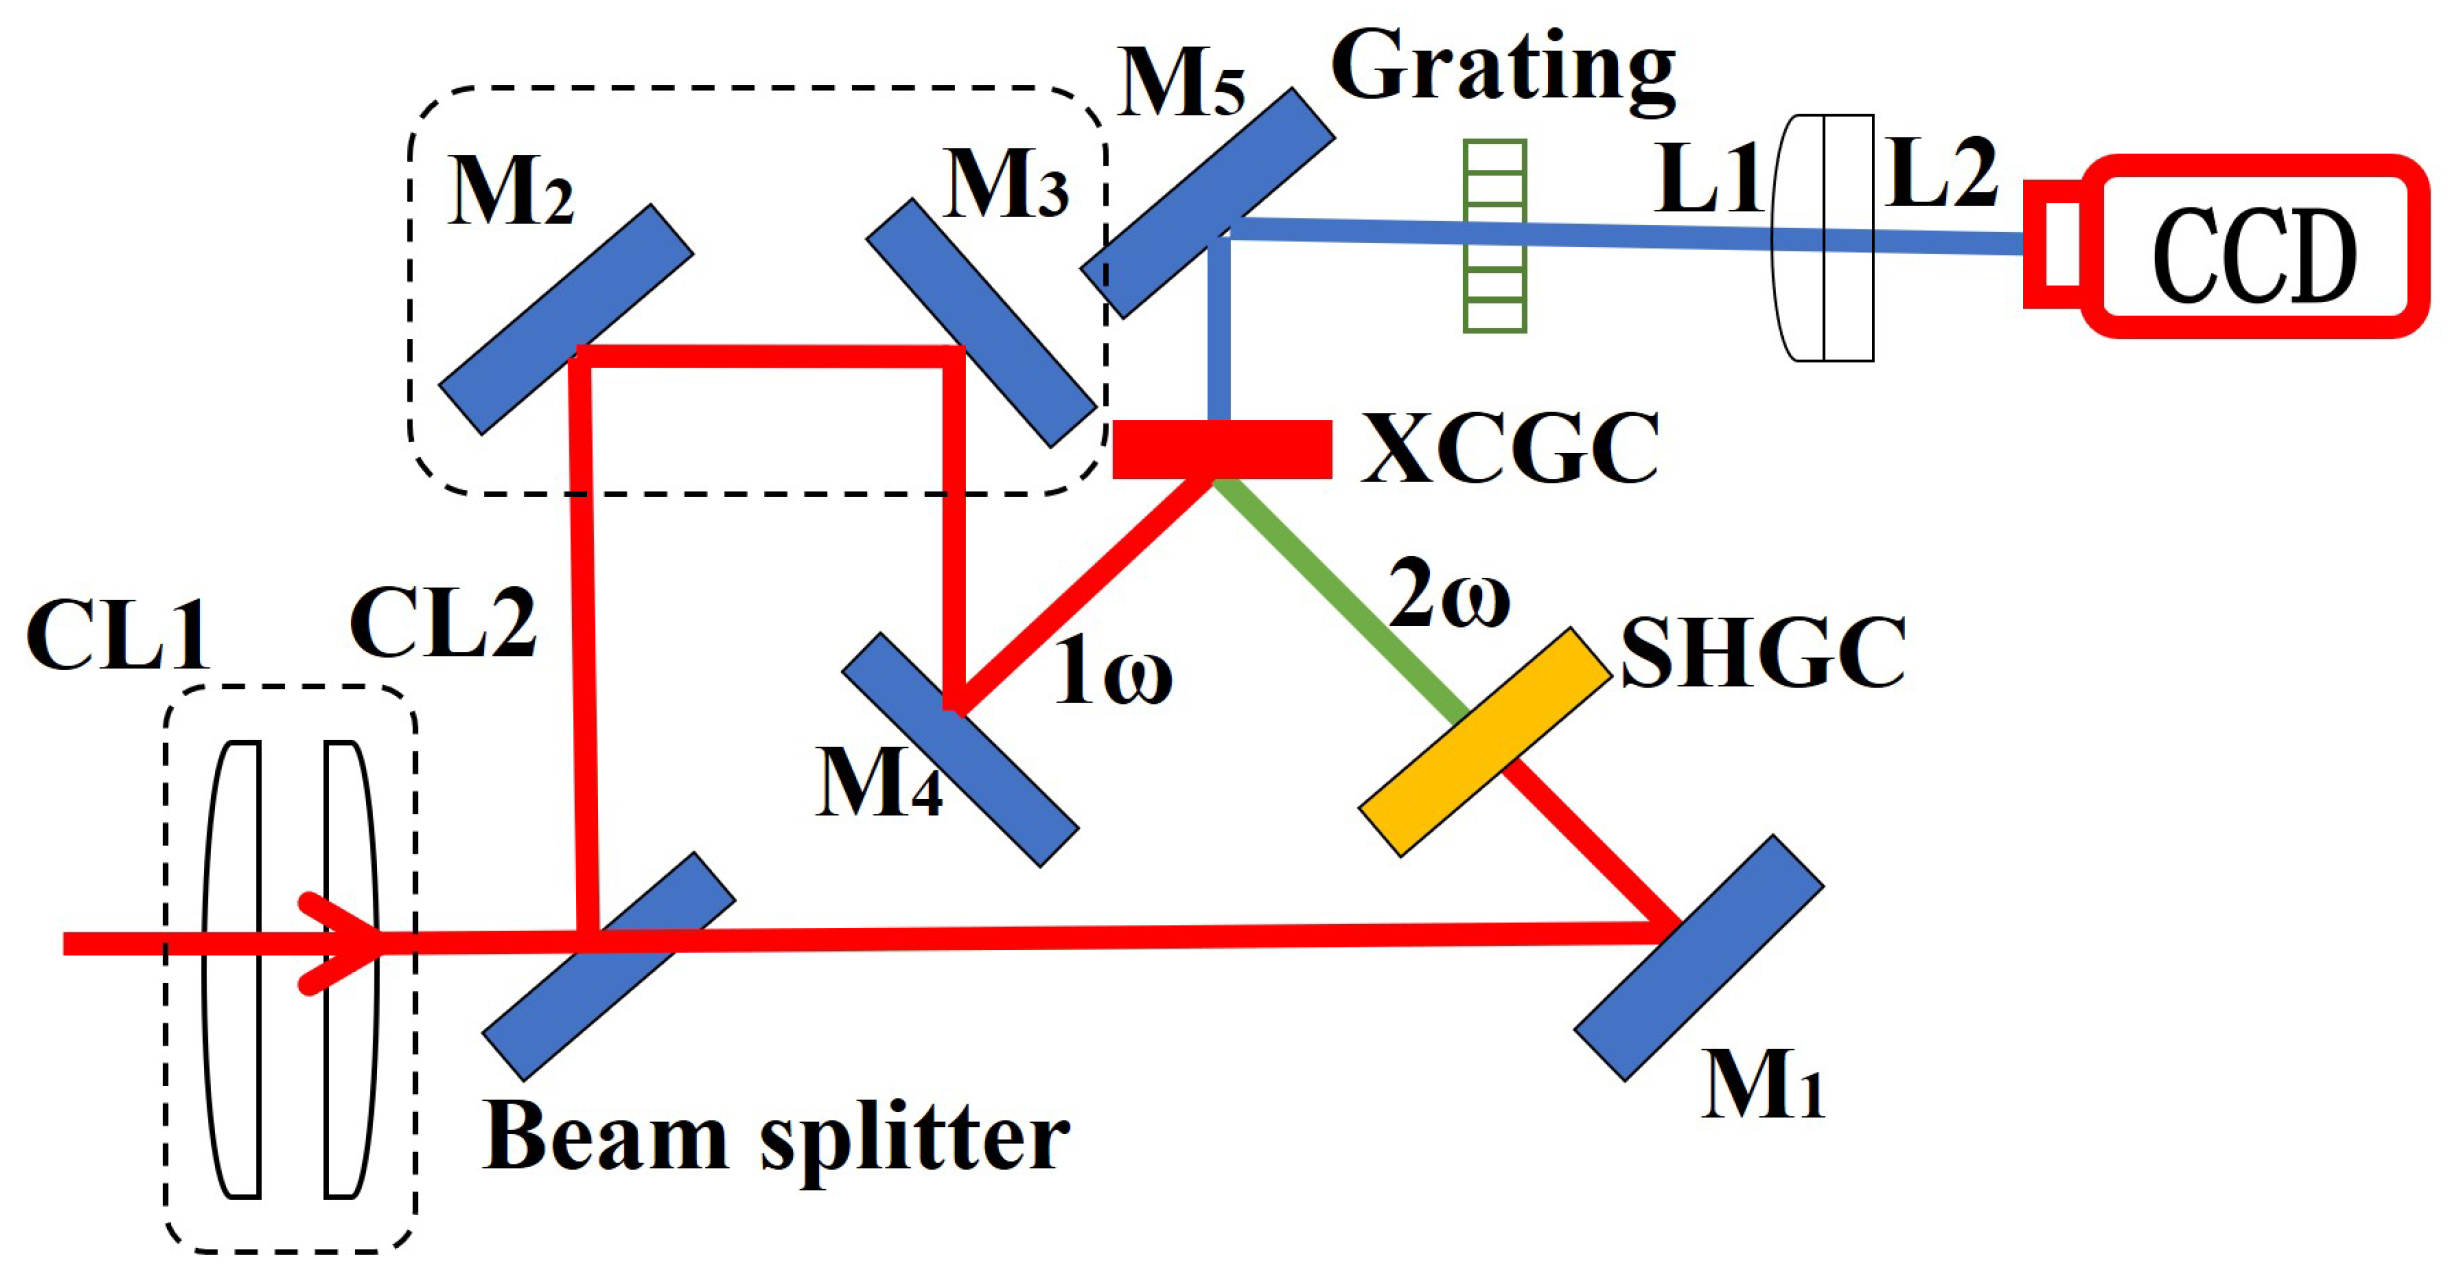
At first, the half-trace retrieval algorithm was demonstrated experimentally using our single-shot homemade ps−THG−FROG on a 100- μ J ps laser system, which is centered at 1026 nm with a bandwidth of approximately 5 nm and a pulse duration of 1 to 5 ps. A schematic of our homemade ps−THG−FROG, based on a cross-correlator, is presented in Figure 5 with a temporal resolution of 32fs and a spectral resolution of 0.42 nm. A cylindrical-lens pair (CL1, CL2) was used for beam reduction in one dimension to improve the peak power density of the input beam. Then, a beam splitter (5-mm-thick, Φ 50 mm), made of BK7 silica, divides the input beam into two parts. One beam was sent directly to a 1-mm-thick BBO cross-correlation generation crystal (XCGC) using a set of mirrors ( M 2 , M 3 , M 4 ) with diameter of 50 mm, while the other beam was guided to a BBO SHG crystal by M 1 before being sent to the XCGC. The angle between these two beams on the XCGC was set to 70 as a trade-off between the scanning temporal range and the nonlinear conversion efficiency. Furthermore, a 1200 line/mm blazed grating was placed right after the XCGC to separate the different spectral components in each delay line (the direction of the groove was placed perpendicular to the beam-reduction direction to obtain a standard THG−FROG trace). Finally, the output THG signal was recorded by a charge-coupled device (CCD), consisting of 2048 × 2048 pixels, with a pixel size of 5   μ m, after passing through an imaging lens (L1, f = 100 mm) and a Fourier transform lens (L2, f = 50 mm) (L1 and L2 are cylindrical lenses and are placed orthogonal to each other).
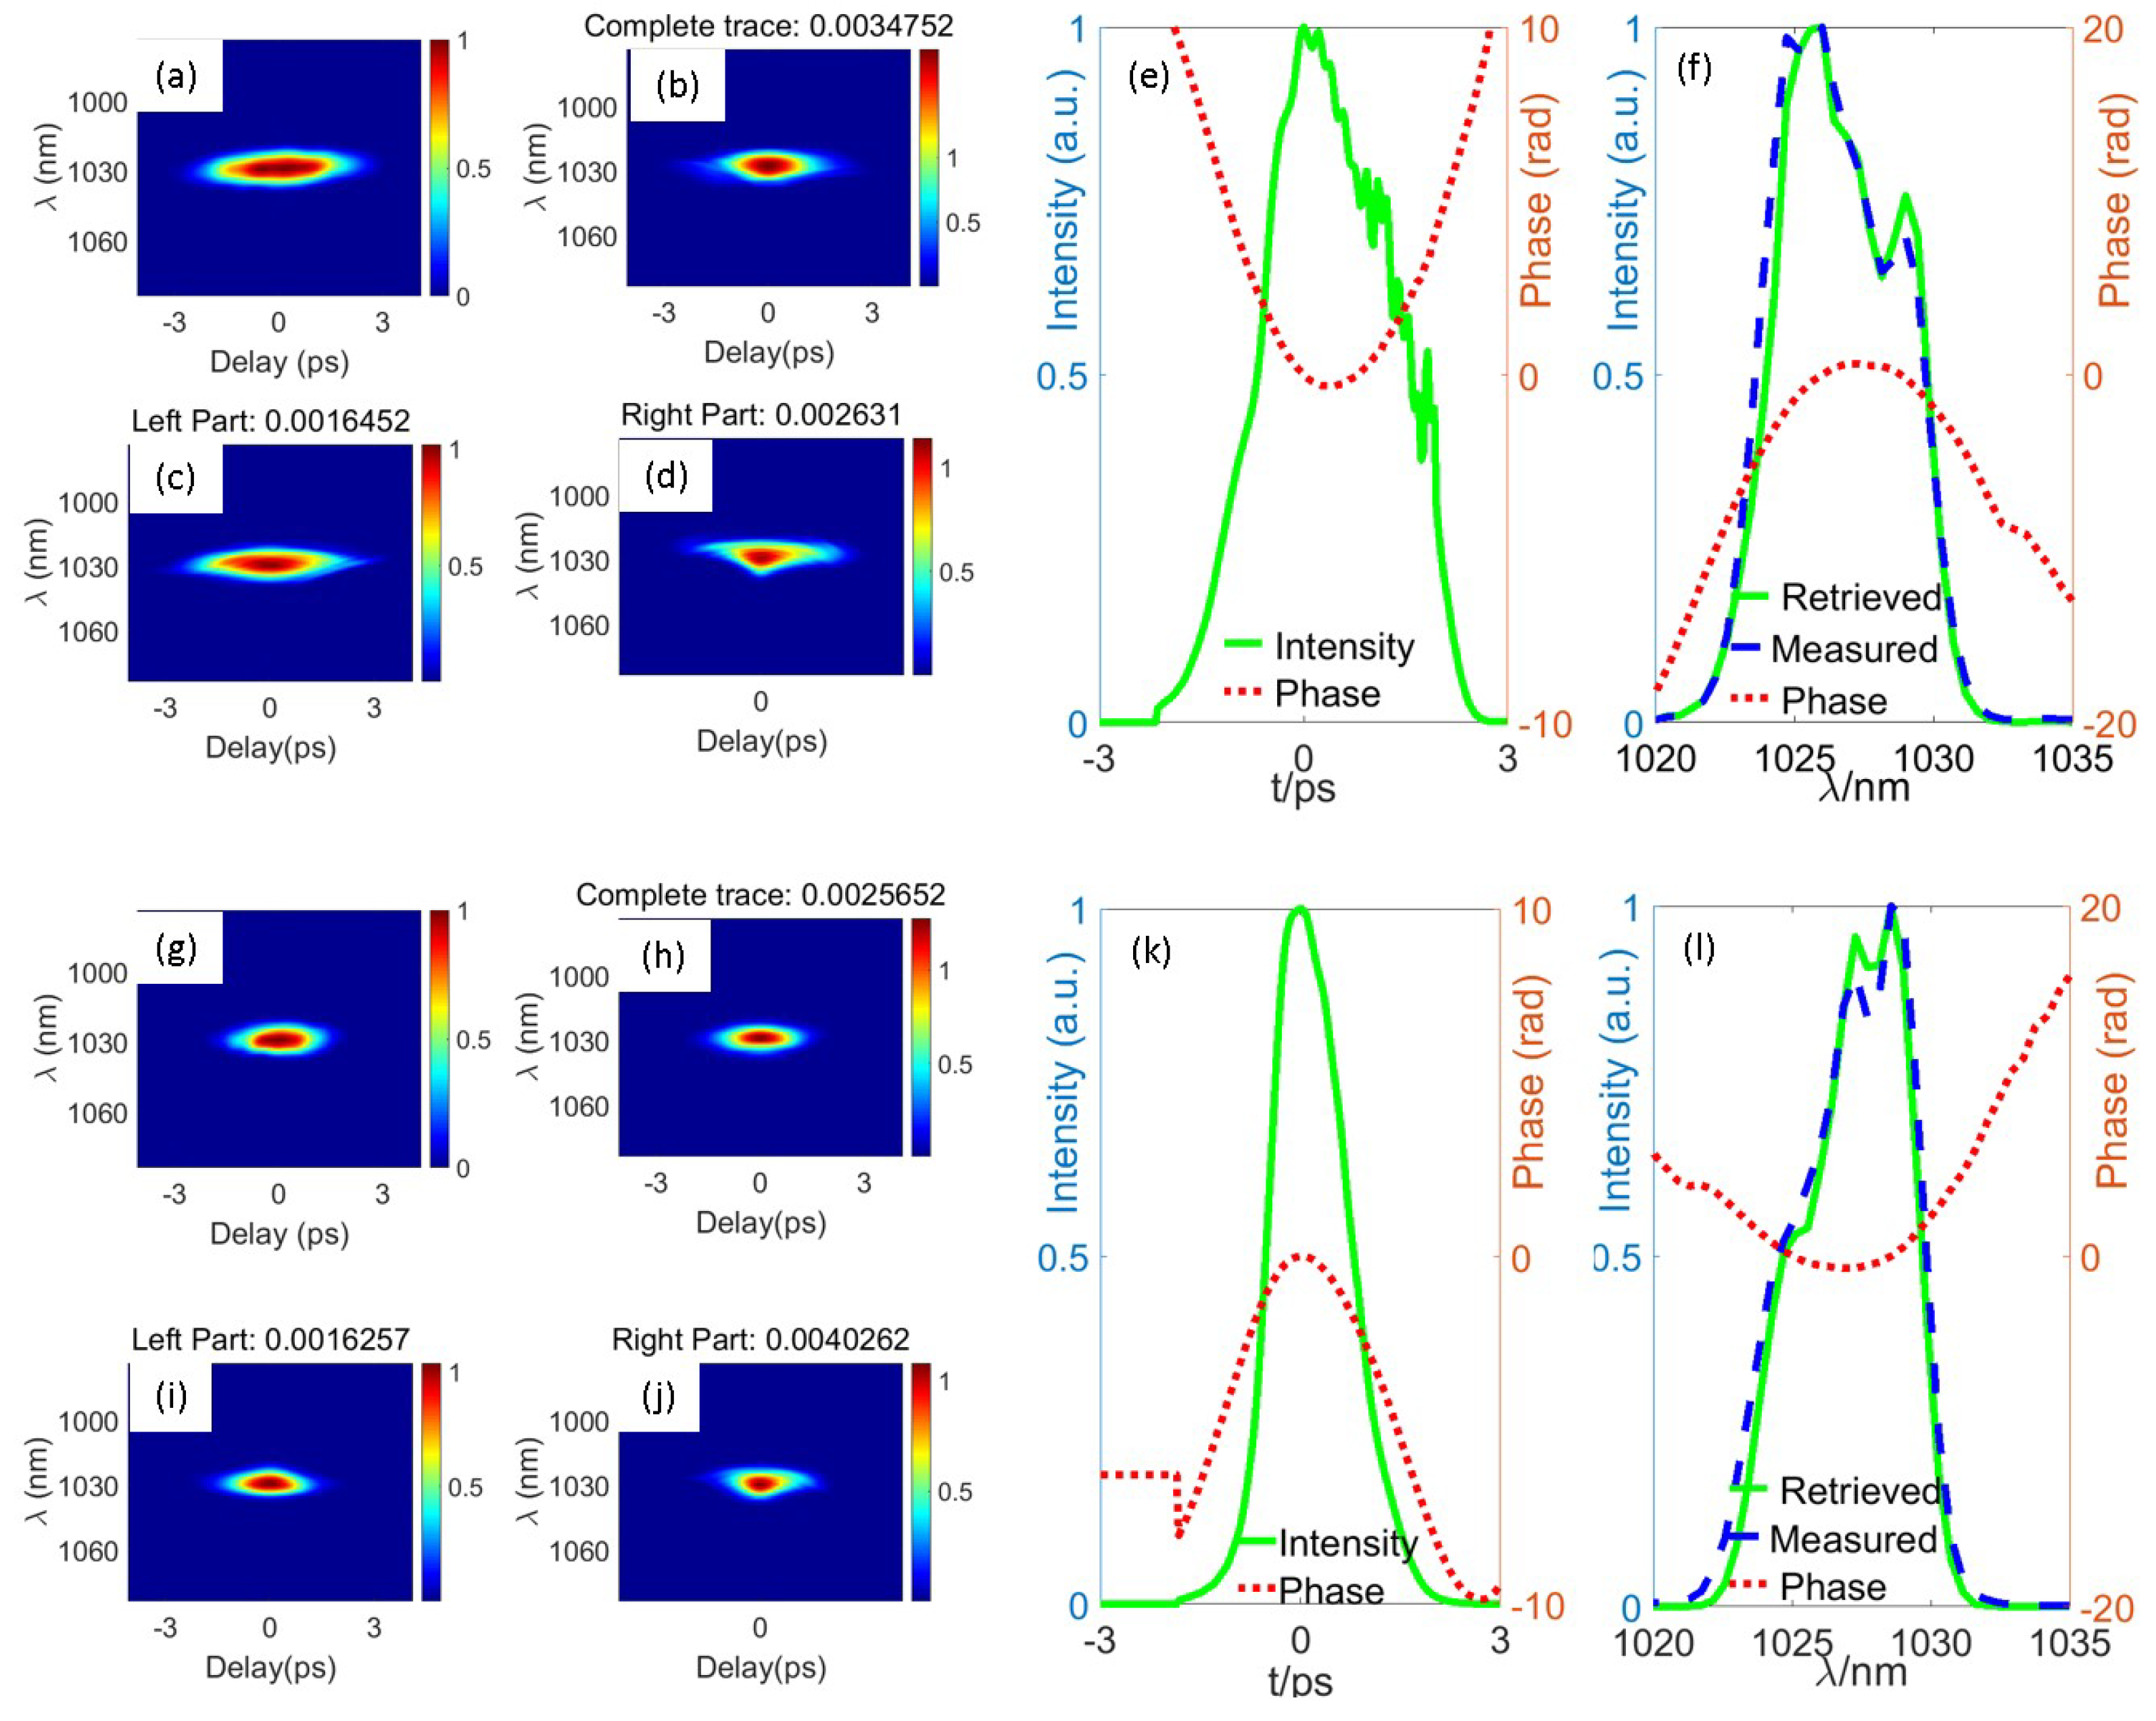
The output pulses with different pulse width scanning from negative chirped to positive chirped pulses were tested experimentally, and two typical reconstruction results are presented in Figure 6. These are represented in Figure 6a–l. Figure 6a,g present the original THG−FROG trace obtained from the experiment. Figure 6b,h show the reconstructed THG−FROG trace using the complete trace retrieval algorithm, and the error between measured and reconstructed trace is presented on top. Figure 6c,i and Figure 6d,j show the reconstructed THG−FROG trace using the half-trace retrieval algorithm with negative delay range and positive delay range, respectively, and the error is presented above them. Additionally, Figure 6e,k present the reconstructed temporal structure with the smallest reconstructed error, while Figure 6f,l show the corresponding reconstructed spectral structure compared with the spectra (blue dashed line) measured by a spectrometer. Clearly, the smallest reconstruction error is always obtained when the half-trace retrieval algorithm is applied to the recorded FROG trace with a negative delay range, which is due to the poor spatial profile of the output pulses. The measured values of pulse width and the sign of chirp conform to theoretical values. Additionally, the calculated spectral instensity distribution almost coincides with that measured spectrum, confirming the reliability of ps−THG−FROG and the half-trace retrieval algorithm in the compact laser system.
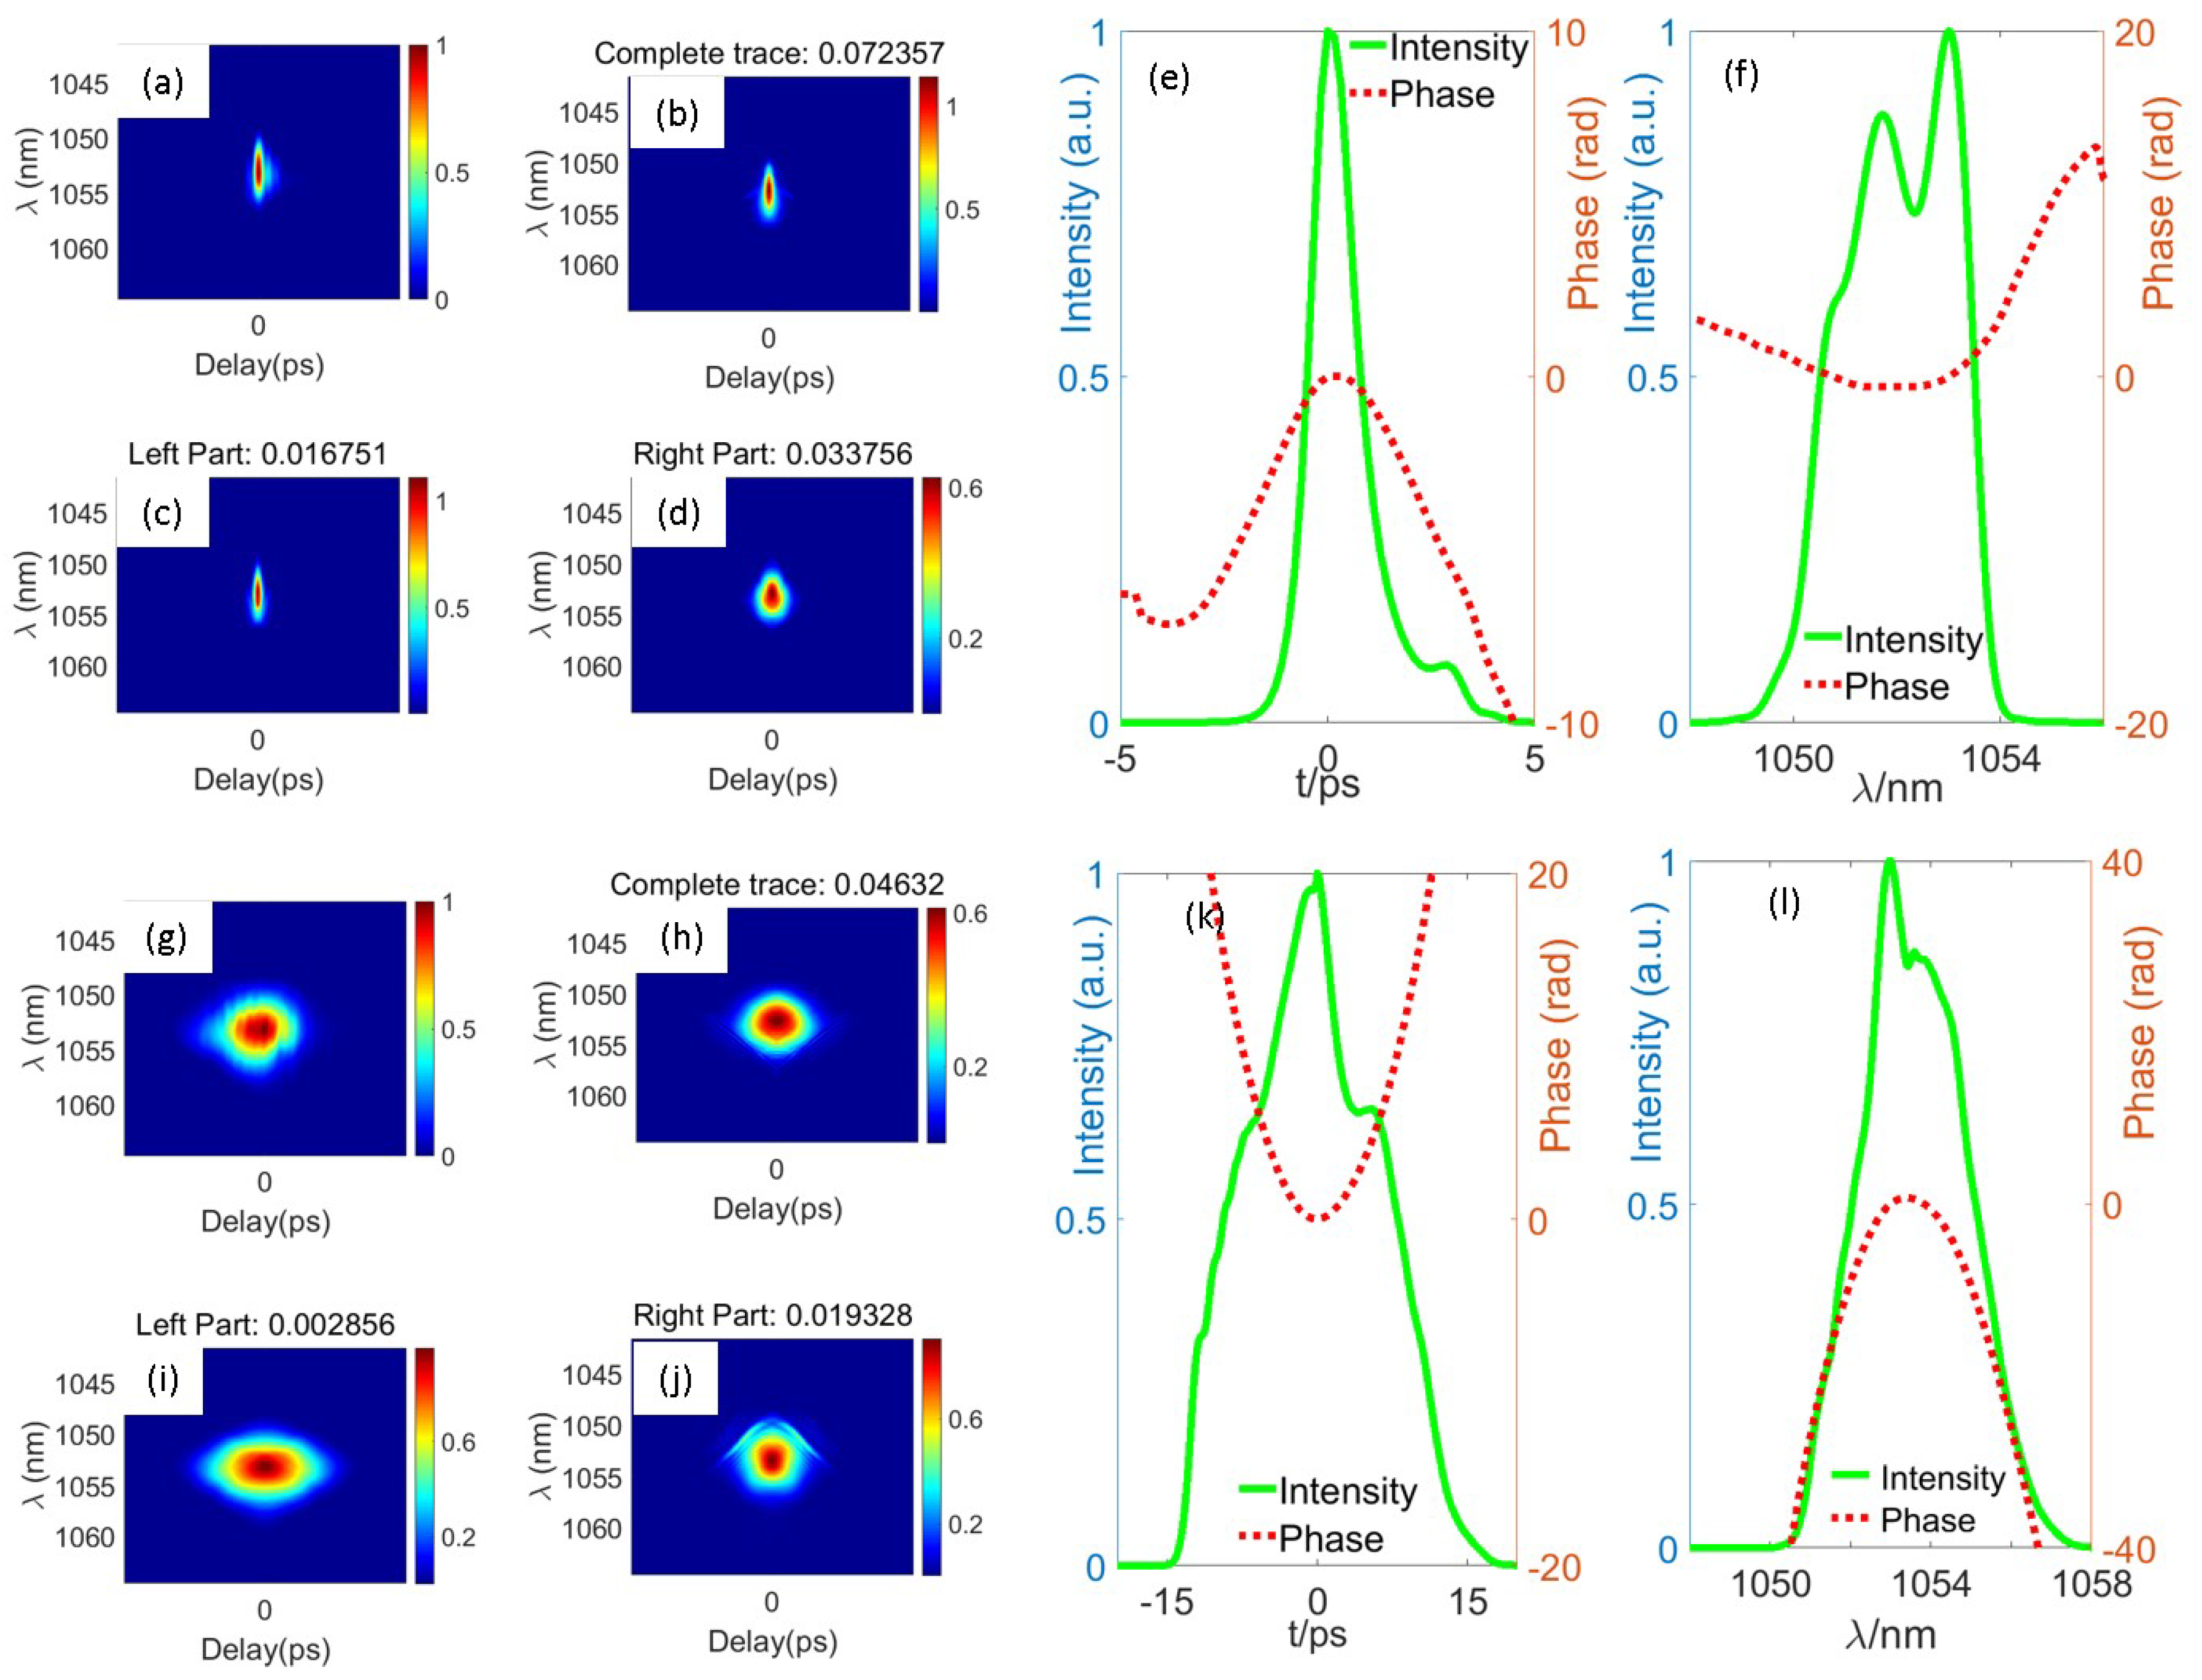
Then, a SHG−FROG experiment was carried out on PW laser system centered at 1053nm with a temporal resolution of 65fs and a spectral resolution of 0.08 nm. The near-field spatial distribution of PW laser is presented in Figure 7. It can be clearly seen that the near-field spatial profile is clearly divided into two parts caused by compressed grating piars, which would result in a modulated recorded trace. The online measurement results of two shots are presented in Figure 8. In Figure 8a–l, Figure 8a,g present the recorded SHG−FROG trace after noise filtering; they are composed of 512 × 512 data points. Figure 8b,h present the reconstructed FROG trace using complete trace retrieval algorithm, and the error between measured and reconstructed FROG trace is presented on top. Figure 8c,i and Figure 8d,j show the reconstructed trace using the half trace retrieval algorithm with negative delay range and positive delay range, respectively, and the reconstructed error is also presented above them. Additionally, Figure 8e,k present the reconstructed temporal structure with the smallest reconstructed errors, while Figure 8f,l shows the corresponding reconstructed spectral structure. According to the position of grating that used to adjust the output pulse width, the output pulse of these two shots were about 1ps and 13.5 ps, theoretically. Additionally, the reconstructed pulse widths of these two shots in the experiment were 1.28 ps and 17.44 ps, which are consistent with the theoretical value. In addition, the reconstructed spectral width of two shots are both around 3.4 nm, which is consistent with the spectral width of the output laser source. That is to say, the reconstructed pulse distribution using half-trace retrieval algorithm is reliable to describe the characteristic of the output laser pulses in the PW laser system.

4. Conclusions

In conclusion, we proposed a half-trace retrieval algorithm to reconstruct a pulse distribution from a FROG trace with a half-delay range. Numerical simulations were carried out to demonstrate the feasibility of the half-trace retrieval algorithm, and the results show that the proposed algorithm performs better than the conventional complete trace retrieval algorithm, especially when the recorded trace is modulated by the poor spatial profile. In addition, the experiment was carried out on a single-shot ps−THG−FROG setup with a 100 - μ J ps laser system and an online ps−SHG−FROG setup in PW laser system. Both the complete trace retrieval algorithm and the half-trace retrieval algorithm were used to reconstruct the temporal structure of pulses from the recorded trace, and the results retrieved by the half-trace retrieval algorithm always show a smaller reconstruction error. In other words, the temporal structure reconstructed by the half-trace retrieval algorithm is closer to the real temporal structure in the experiment than that reconstructed by the complete trace retrieval algorithm. In addition, the half trace retrieval algorithm saved nearly half of the time to reconstruct the temporal structure compared to the complete trace retrieval algorithm. Although the proposed half-trace retrieval algorithm is applied in SHG and THG FROG, it can also be applied to other types of nonlinearities when the measured pulse can be represented by the probe pulse and gated pulse, respectively. The half-trace retrieval algorithm opens new opportunities in the diagnostics of ultrashort pulses where the spatial distribution is not identically uniform. The proposed algorithm is particularly useful in high power laser systems, from which it is difficult to obtain a uniform spatial distribution without any hardware modifications.

Author Contributions

Conceptualization, L.P., C.L. and J.Z.; methodology, L.P.; validation, L.P.; supervision, X.O.; writing–original draft preparation, L.P.; writing–review and editing, L.P., C.L. and X.Z.; funding acquisition, C.L. and J.Z. All authors have read and agreed to the published version of the manuscript.

Funding

This research was funded by the Strategic Priority Research Program of the Chinese Academy of Sciences Grant No. XDA25020306, National Natural Science Foundation of China (NSFC) (61827816, 11875308, 61675215, 62175247), Scientific Instrument Developing Project of the Chinese Academy of Sciences/YJKYYQ20180024, and the Innovation Fund of Key Laboratory of Chinese Academy of Sciences/CXJJ-22S015.

Institutional Review Board Statement

Not applicable.

Informed Consent Statement

Informed consent was obtained from all subjects involved in the study.

Data Availability Statement

Not applicable.

Conflicts of Interest

The authors declare no conflict of interest.

References

  1. Sapra, N.V.; Yang, K.Y.; Vercruysse, D.; Leedle, K.J.; Black, D.S.; England, R.J.; Su, L.; Trivedi, R.; Miao, Y.; Solgaard, O.; et al. On-chip integrated laser-driven particle accelerator. Science 2020, 367, 79. [Google Scholar] [CrossRef] [PubMed] [Green Version]
  2. Betti, R.; Hurricane, O.A. Inertial-confinement fusion with lasers. Nat. Phys. 2016, 12, 435–448. [Google Scholar] [CrossRef]
  3. Craxton, R.S.; Anderson, K.S.; Boehly, T.R.; Goncharov, V.N.; Harding, D.R.; Knauer, J.P.; McCrory, R.L.; McKenty, P.W.; Meyerhofer, D.D.; Myatt, J.F.; et al. Direct-drive inertial confinement fusion: A review. Phys. Plasmas 2015, 22. [Google Scholar] [CrossRef] [Green Version]
  4. Glenzer, S.H.; Redmer, R. X-ray Thomson scattering in high energy density plasmas. Rev. Mod. Phys. 2009, 81, 1625–1663. [Google Scholar] [CrossRef]
  5. Heebner, J.E.; Acree, R.L.; Alessi, D.A.; Barnes, A.I.; Bowers, M.W.; Browning, D.F.; Budge, T.S.; Burns, S.; Chang, L.S.; Christensen, K.S.; et al. Injection laser system for Advanced Radiographic Capability using chirped pulse amplification on the National Ignition Facility. Appl. Opt. 2019, 58, 8501–8510. [Google Scholar] [CrossRef] [PubMed]
  6. Meaney, K.D.; Kerr, S.; Williams, G.J.; Geppert-Kleinrath, H.; Kim, Y.; Herrmann, H.W.; Kalantar, D.H.; Mackinnon, A.; Bowers, M.; Pelz, L.; et al. Multi-pulse time resolved gamma ray spectroscopy of the advanced radiographic capability using gas Cherenkov diagnostics. Phys. Plasmas 2021, 28, 033102. [Google Scholar] [CrossRef]
  7. Stan, C.V.; Saunders, A.M.; Hill, M.P.; Lockard, T.; Mackay, K.; Ali, S.J.M.; Rudd, R.E.; McNaney, J.; Eggert, J.; Park, H.S. Radiographic areal density measurements on the OMEGA EP laser system. Rev. Sci. Instrum. 2021, 92, 053901. [Google Scholar] [CrossRef]
  8. Valdivia, M.P.; Stutman, D.; Stoeckl, C.; Mileham, C.; Zou, J.; Muller, S.; Kaiser, K.; Sorce, C.; Keiter, P.A.; Fein, J.R.; et al. Implementation of a Talbot-Lau x-ray deflectometer diagnostic platform for the OMEGA EP laser. Rev. Sci. Instrum. 2020, 91, 023511. [Google Scholar] [CrossRef]
  9. Hopps, N.; Danson, C.; Duffield, S.; Egan, D.; Elsmere, S.; Girling, M.; Harvey, E.; Hillier, D.; Norman, M.; Parker, S.; et al. Overview of laser systems for the Orion facility at the AWE. Appl. Opt. 2013, 52, 3597–3607. [Google Scholar] [CrossRef] [Green Version]
  10. Danson, C.N.; Brummitt, P.A.; Clarke, R.J.; Collier, J.L.; Fell, B.; Frackiewicz, A.; Hancock, S.; Hawkes, S.; Hernandez-Gomez, C.; Holligan, P.; et al. Vulcan Petawatt—An ultra-high-intensity interaction facility. Nucl. Fusion 2004, 44, S239–S246. [Google Scholar] [CrossRef] [Green Version]
  11. Zhu, J. Review of special issue on high power facility and technical development at the NLHPLP. High Power Laser Sci. Eng. 2019, 7, e12. [Google Scholar] [CrossRef] [Green Version]
  12. Kane, D.J.; Trebino, R. Characterization of Arbitrary Femtosecond Pulses Using Frequency-Resolved Optical Gating. IEEE J. Quantum Electron. 1993, 29, 571–579. [Google Scholar] [CrossRef]
  13. Kane, D.J. Real-time measurement of ultrashort laser pulses using principal component generalized projections. IEEE J. Sel. Top. Quantum Electron. 1998, 4, 278–284. [Google Scholar] [CrossRef]
  14. Jafari, R.; Jones, T.; Trebino, R. 100frequency-resolved optical gating. Opt. Express 2019, 27, 2112–2124. [Google Scholar] [CrossRef] [Green Version]
  15. Jafari, R.; Khosravi, S.D.; Trebino, R. Reliable determination of pulse-shape instability in trains of ultrashort laser pulses using frequency-resolved optical gating. Sci. Rep. 2022, 12, 21006. [Google Scholar] [CrossRef]
  16. Khosravi, S.D.; Jafari, R.; Schittenhelm, M.; Suresh, S.; Gibson, G.N.; Trebino, R. Characterization of two-color ultrashort laser pulses using polarization-gating and transient-grating frequency-resolved optical gating. J. Opt. Soc. Am. B-Opt. Phys. 2022, 39, 683–693. [Google Scholar] [CrossRef]
  17. Spangenberg, D.; Rohwer, E.; Bruegmann, M.H.; Feurer, T. Ptychographic ultrafast pulse reconstruction. Opt. Lett. 2015, 40, 1002–1005. [Google Scholar] [CrossRef] [Green Version]
  18. Sidorenko, P.; Lahav, O.; Avnat, Z.; Cohen, O. Ptychographic reconstruction algorithm for frequency-resolved optical gating: Super-resolution and supreme robustness. Optica 2016, 3, 1320. [Google Scholar] [CrossRef] [Green Version]
  19. Kane, D.J. Comparison of the Ptychographic Inversion Engine to Principal Components Generalized Projections. IEEE J. Sel. Top. Quantum Electron. 2019, 25, 1–8. [Google Scholar] [CrossRef]
  20. Chen, H.; Hermann, M.R.; Kalantar, D.H.; Martinez, D.A.; Di Nicola, P.; Tommasini, R.; Landen, O.L.; Alessi, D.; Bowers, M.; Browning, D.; et al. High-energy (> 70 keV) x-ray conversion efficiency measurement on the ARC laser at the National Ignition Facility. Phys. Plasmas 2017, 24, 033112. [Google Scholar] [CrossRef]
  21. Pan, L.; Ouyang, X.; Zhang, X.; Zhu, P.; Liu, C.; Li, Z.; Zhu, B.; Zhu, J.; Zhu, J. Picosecond frequency-resolved optical gating based on a modified ptychographic-based algorithm for use in a petawatt laser. Opt. Eng. 2020, 59, 054103. [Google Scholar] [CrossRef]
  22. Thibault, P.; Dierolf, M.; Bunk, O.; Menzel, A.; Pfeiffer, F. Probe retrieval in ptychographic coherent diffractive imaging. Ultramicroscopy 2009, 109, 338–343. [Google Scholar] [CrossRef]
Figure 1. (a) The schematic when the probe pulse (green line) is incident on the nonlinear medium before the gated pulse (red line). (b) Reconstructable part of the probe pulse and the gated pulse.
Photonics 10 00255 g001
Figure 2. Numerical reconstruction from an unpolluted THG−FROG trace. (a) Simulated FROG trace of measured pulse (b) noised trace of the measured pulse, (ce) reconstructed traces, (fh) amplitude of reconstructed pulses, (ik) phase of reconstructed pulses, and (ln) spectral intensity distributions of the reconstructed pulses.
Photonics 10 00255 g002
Figure 3. Numerical reconstruction from a partially polluted THG−FROG trace of a Gaussian spectrum pulse. (a) simulated poor spatial distribution, (b) polluted FROG trace, (ce) reconstructed traces, (fh) amplitude of reconstructed pulses, (ik) phase of reconstructed pulses, and (ln) spectral intensity distributions of the reconstructed pulses.
Photonics 10 00255 g003
Figure 4. Numerical reconstruction from a partially polluted THG−FROG trace of a double Gaussian chirped pulse. (a) simulated poor spatial distribution, (b) polluted FROG trace, (ce) reconstructed traces, (fh) amplitude of reconstructed pulses, (ik) phase of reconstructed pulses, and (ln) spectral intensity distributions of the reconstructed pulses.
Photonics 10 00255 g004
Figure 5. Schematic of homemade ps−THG−FROG used for experiments.
Photonics 10 00255 g005
Figure 6. Experimental pulse reconstructions of two shots using our homemade ps−THG−FROG setup on 100 - μ J ps-laser system. The reconstructed results are divided into two groups with different pulse widths. (a,g) present the recorded THG−FROG trace. (b,h) present the reconstructed trace using complete trace retrieval algorithm. (c,i) show the reconstructed trace using half-trace retrieval algorithm using negative delay range, while (d,j) show the same using a positive delay range. The reconstructed errors between measured and reconstructed trace are presented on top of the reconstructed trace. (e,k) show the reconstructed pulse distribution with the smallest reconstructed error in temporal domain, while (f,l) showed the reconstructed spectral distribution compared with their corresponding measured spectra (blue dashed line).
Photonics 10 00255 g006
Figure 7. Near-field spatial distribution in PW laser system.
Photonics 10 00255 g007
Figure 8. Experimental pulse reconstructions of two shots on PW laser system with second harmonic generation (SHG) FROG. The reconstructed results are divided into second groups. (a,g) present the recorded SHG−FROG trace. (b,h) present the reconstructed FROG trace using complete trace retrieval algorithm. (c,i) show the reconstructed trace using half-trace retrieval algorithm using negative delay range, while (d,j) show the same using a positive delay range. The reconstructed errors between measured and reconstructed trace are presented on top of the reconstructed trace. (e,k) and (f,l) show the reconstructed pulse distribution with the smallest reconstructed error in temporal and spectral domain.
Photonics 10 00255 g008
Disclaimer/Publisher’s Note: The statements, opinions and data contained in all publications are solely those of the individual author(s) and contributor(s) and not of MDPI and/or the editor(s). MDPI and/or the editor(s) disclaim responsibility for any injury to people or property resulting from any ideas, methods, instructions or products referred to in the content.