3. Results and Discussion
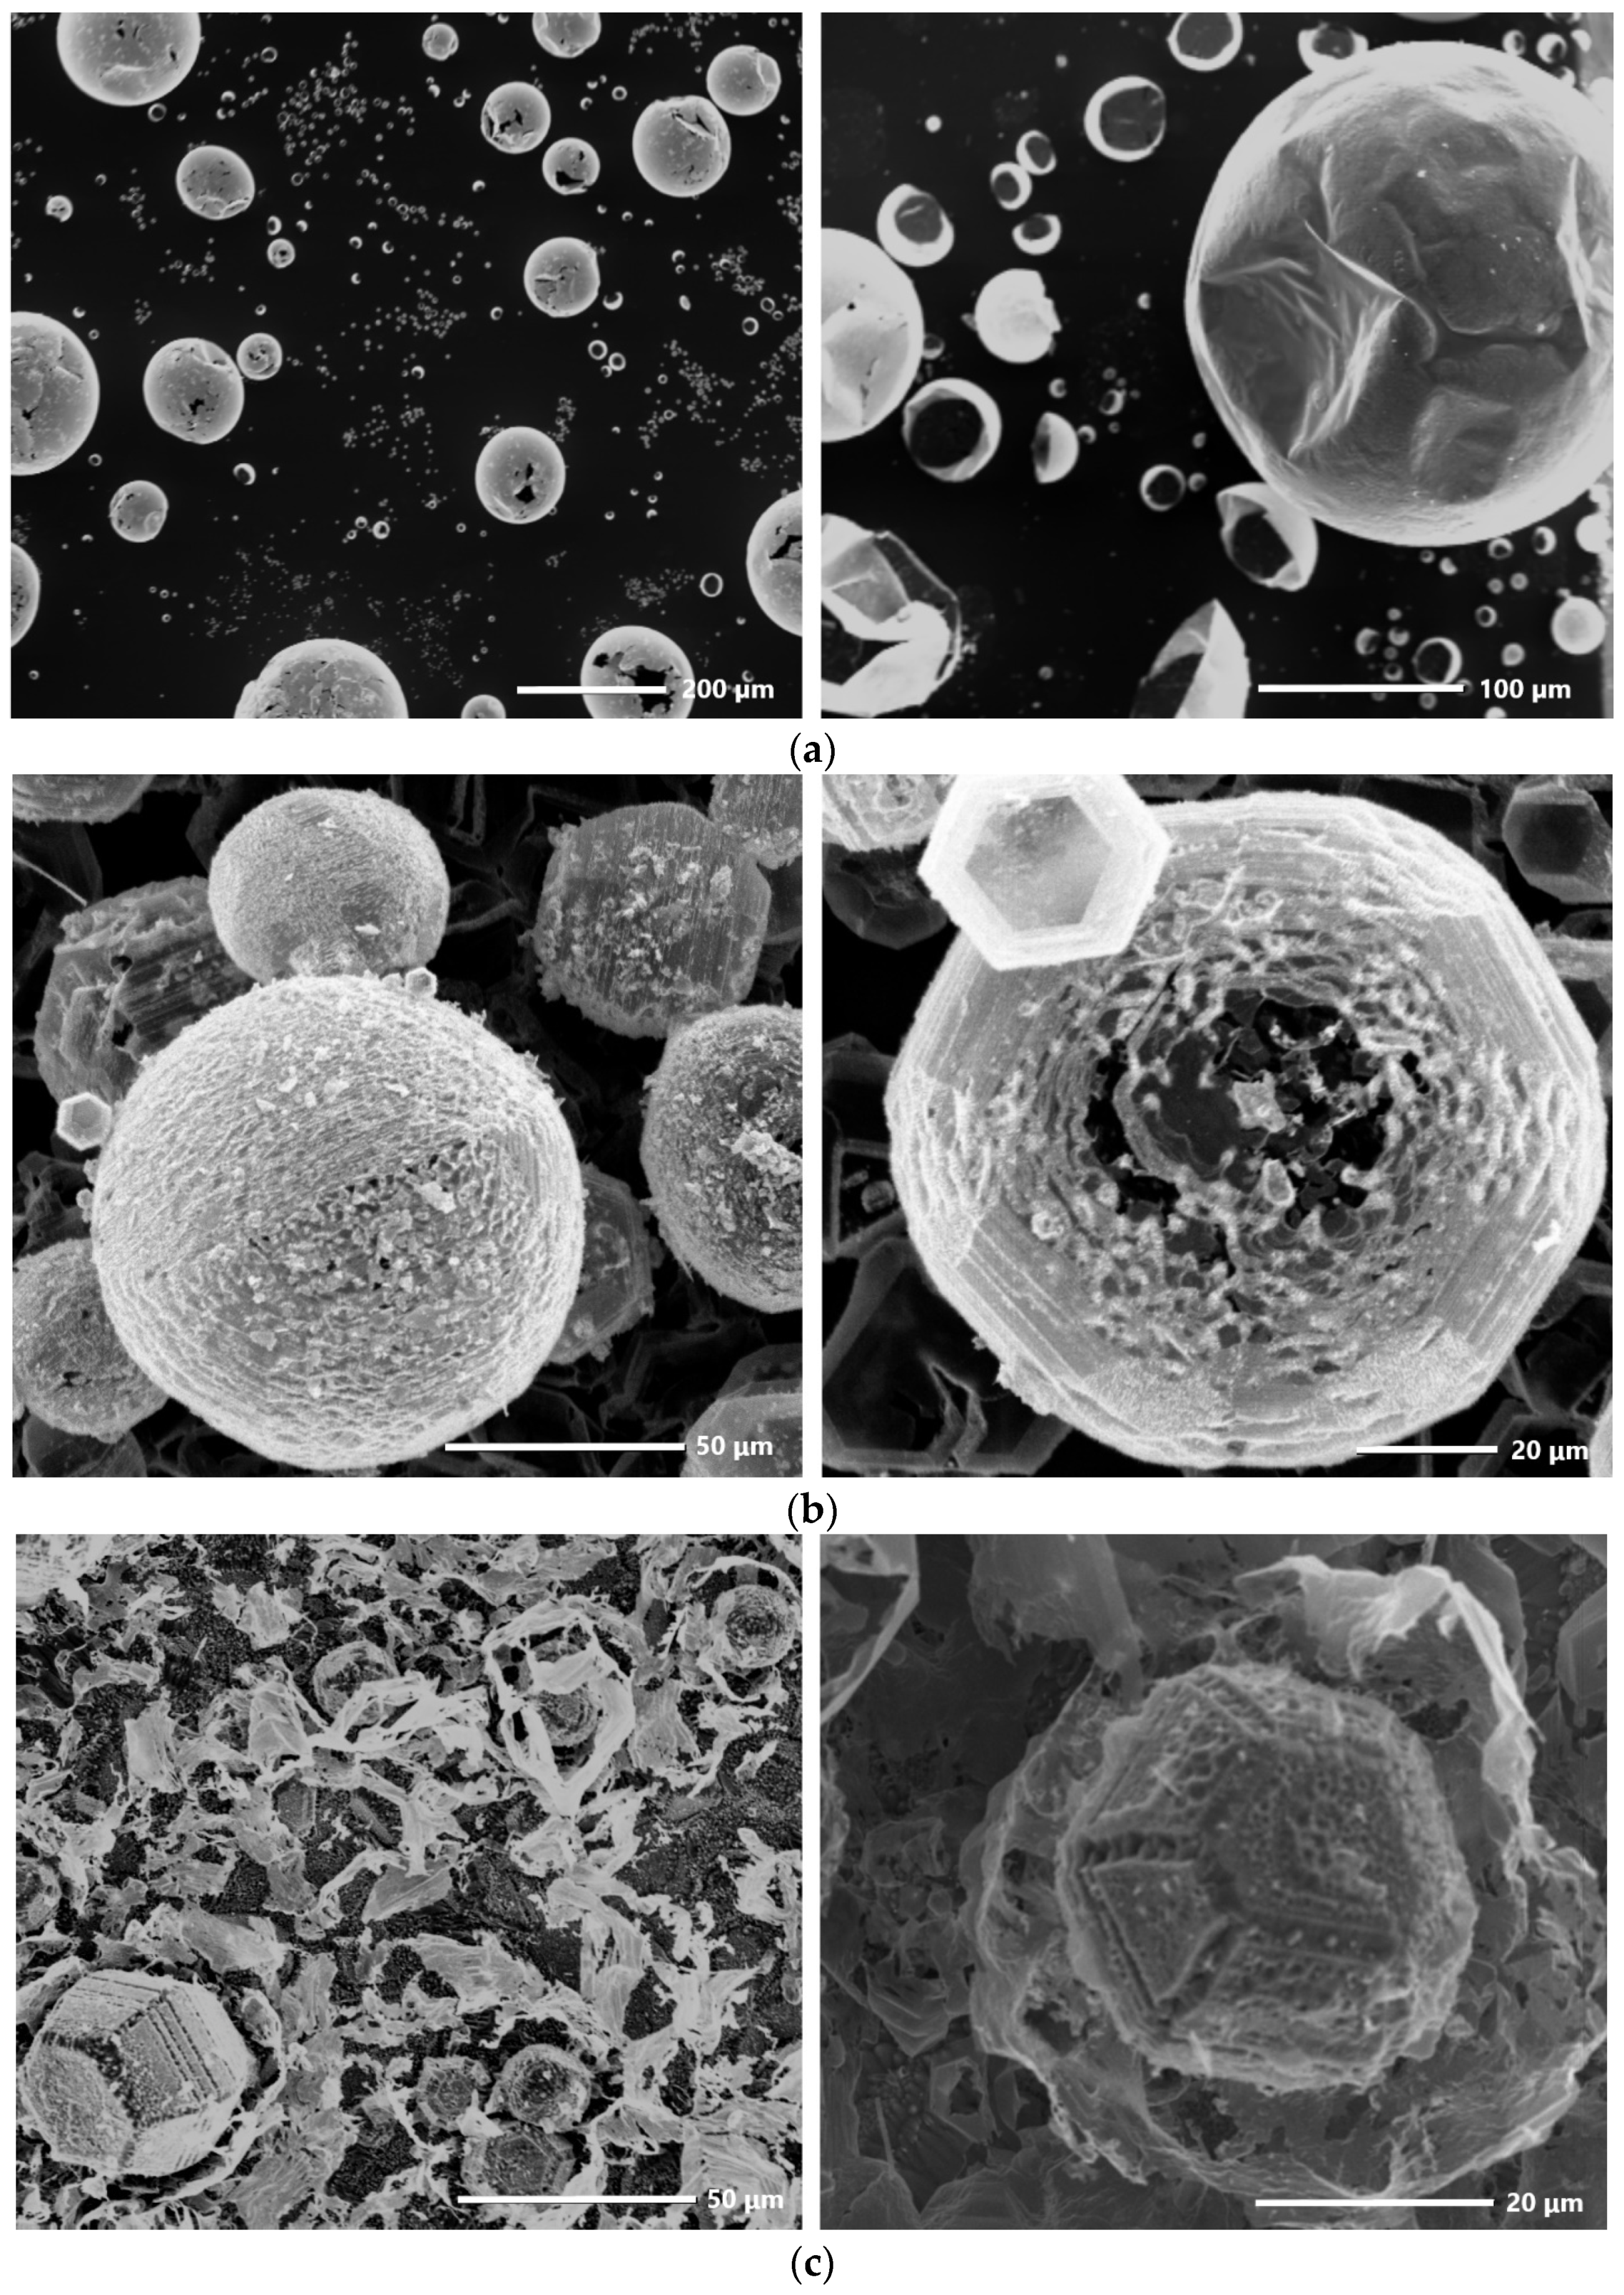
Figure 1 shows micrographs of the synthesized ZnO samples. Sample S1 (
Figure 1a) was characterized by the presence of spheroid microcrystals with a smooth thin shell and cavities inside. The sizes of the microspheroids were within a wide range, from several micrometers to ~0.25 mm. Many spheroids had cracked or torn shells. The morphology of sample S2 was more diverse (
Figure 1b). Similar to sample S1, spheroids were also observed in this sample. However, their surfaces were not as smooth, and in many cases, they were partially faceted. The hexagonal shape of the facets indicated the wurtzite structure of such crystals. In addition to spheroids, polyhedral microcrystals were also observed in the micrographs of sample S2. Such crystals had 14 faces: 2 faces were end faces and 12 faces were side faces (six pairs of faces each located at an angle of 60° relative to each other and forming a hexagonal cross-section of the crystal). In the case of sample S3, spheroids were no longer observed—only polyhedral microcrystals were present. At the same time, many of them were covered with fine-grated structures—smaller microcrystallites. Over almost the entire surface of the sample, fragments of a thin-walled structure were observed, with which the polyhedral microcrystals were partially covered.
Figure 2 shows the XRD patterns of samples S1 and S3, which were in fact representatives of two different types of ZnO morphologies—spheroids and polyhedral microcrystals. The XRD analysis confirmed that the ZnO structures under study crystallized in the wurtzite phase. The ZnO shells of the spheroids (sample S1) had a predominantly (002) orientation—despite the fact that reflections from the (100) and (101) planes were also observed, their intensity was significantly lower than that of the (002) peak. The peak at 2
θ = 28.56° corresponded to the reflection from the (111) plane of a Si substrate. At the same time, the crystal structure of sample S3, in addition to the indicated peaks, was characterized by the appearance of reflections from the ZnO (102), (110), (103), (112), and (201) planes. Besides that, the (100) and (101) reflections increased significantly and amounted to ~1/3 of the (002) peak in intensity.
Analysis of the morphological and structural features of the samples suggested the following mechanisms for the formation of the observed ZnO structures. At the beginning of the synthesis process, when the flow of oxygen and argon is turned on, Zn microdroplets are transferred from the zinc source to the substrate. Zinc belongs to the group of fusible metals with melting point of ~420 °C. In addition, zinc is quite volatile—its evaporation temperature is ~906 °C at atmospheric pressure. As a result, at the optimal temperature of gas-phase synthesis and at reduced pressure, a sufficiently high concentration of Zn vapor can be achieved, which is necessary for condensation on the substrate of liquid metal droplets. At low crystallization temperatures, when kinetic restrictions are strong, the liquid phase significantly increases the growth rate, bringing the regime closer to the diffusion one. This leads to rapid overgrowth of the droplet surface with solid oxide in an oxygen flow, forming spheroids covered with a thin ZnO shell. Here, one can talk about the vapor–liquid–solid growth mechanism, which in this case led to the implementation of the energetically most-favorable growth direction, <001> (see
Figure 2, top part). At the same time, liquid zinc still remains inside the spheroids. Due to the higher partial pressure of zinc vapor inside the spheroid compared to the pressure of the gas flow outside, cracks may form in the spheroid’s thin shell. In some cases, the spheroids even burst, with their shells significantly destroyed, and the zinc remaining inside the spheroids in a liquid state completely evaporates. In such cases, partially broken spheroids or only remnants of their shells remain on the substrate. All this can be seen in micrographs of sample S1 (
Figure 1a).
If only relatively small cracks appear in the shell, only partial evaporation of zinc from the inner part of the spheroid occurs. This takes place in addition to the mechanism of Zn vapor diffusion through the gas-permeable shell of the spheroid, when it is still relatively thin [
17]. This results in a decrease in the volume of liquid zinc in the spheroid and the formation of a cavity inside the spheroid, separating the remaining part of the liquid zinc droplet and the ZnO shell of the spheroid. On the other hand, oxygen, which is still purging the reactor, enters the spheroid through cracks in its shell from the external flow. This oxygen reacts with the zinc remaining inside the spheroid. However, the rate of such oxygen supply to the inner region of the spheroid is limited. As a result, the crystallization process of ZnO inside the spheroid occurs slowly, in a regime close to thermodynamic equilibrium. This contributes to the formation of a ZnO microcrystal with an equilibrium shape, which in the case of hexagonal packing is an isometric polyhedron [
18,
19]. In such a polyhedron, in addition to the <001> crystallographic direction, other directions are also developed, in particular, <100> and <101>, which is reflected in the results of the XRD studies (see
Figure 2, bottom part). During long-term synthesis (more than 20–25 min), almost all polyhedral microcrystals formed inside their spheroids are freed from them—the spheroid shells are completely destroyed (sample S3). For example, in
Figure 1c, the remains of the spheroid shell are clearly visible around the polyhedral microcrystals. Only small fragments of shells remain on the surface of such microcrystals. Thus, the shell of the spheroid serves as a cocoon for the polyhedral microcrystals, promoting their thermodynamic equilibrium growth. Continuation of the synthesis after the destruction of the spheroid shell leads to the rapid overgrowth of the microcrystal’s surface with smaller microcrystallites due to Zn microdroplets settling onto it and the rapid influx of oxygen, which is no longer retained by the spheroid shell. This leads to the formation of a fine-grained ZnO structure on the surface of the polyhedral microcrystals of sample S3.
The case of sample S2 is an intermediate stage between samples S1 and S3. Here, we observed both undamaged and cracked spheroids, as well as polyhedral microcrystals, already freed from their spheroids but not yet overgrown with smaller microcrystallites (
Figure 1b). The example of this sample clearly shows what happens to the spheroids and their surfaces during a synthesis process lasting longer than 5 min. After the initial formation of spheroids with ZnO shells and a liquid zinc phase inside, the surface of the spheroid begins to thicken as a result of the continued flow of reagents into the growth zone. The faceting of the spheroids occurs at high concentrations of the reagents during an exothermic reaction (Zn + O
2 → ZnO). In this case, the formation of active structural elements on the surface—steps and kinks—can be observed (see the right side of
Figure 1b). Layer-by-layer growth on a faceted spheroid is a sign of two-dimensional nucleation. The formation of two-dimensional nuclei is facilitated by reducing the surface energy of the liquid–crystal interface and low temperatures [
20,
21]. Of note, in the present work, the temperature in the growth zone was significantly lower than that used by us in the synthesis of whisker- and plate-like crystals (
T1 was around 580 °C) using the same experimental equipment. Apparently, the described process occurred in parallel with the formation of polyhedral ZnO microcrystals inside the spheroids.
The results of EDX analysis of the samples revealed a significant change in the relative zinc and oxygen contents with increasing synthesis time. Thus, in the case of sample S1, the zinc/oxygen ratio on the surface of the spheroids was on average 37/63 at.%, demonstrating a significant excess of oxygen and a lack of zinc. Similar data were obtained for both the outer and inner surfaces of spheroid shells. As the synthesis time increased, the relative zinc content increased. In particular, for sample S3, the zinc/oxygen ratio reached 80/20 at.% on the surface of some microcrystals.
The PL of the samples was studied in the UV and visible ranges under cw low-intensity excitation and pulsed laser excitation. Due to the small laser excitation spot on the sample surfaces and the heterogeneity of the samples, a different number of crystals of different sizes fell into the excitation zone, depending on the location on the sample. This resulted in significant variation in the PL intensity of the samples under this excitation type. In addition, an increase in synthesis time was reflected in a significant increase in the amount of material in the samples. This also greatly affected the intensity of the luminescent signals. In particular, the UV emission intensity for sample S1 turned out to be more than an order of magnitude lower than that for samples S2 and S3, already under low-intensity cw excitation. In this regard, it is advisable to analyze only the shape of the PL properties of the samples and the wavelengths and intensity ratios of individual components in these spectra, as well as the behavior of PL with respect to the excitation intensity.
Figure 3 compares the PL spectra of the samples obtained under low-intensity
cw excitation (
Figure 3a,b) and pulsed laser excitation at a relatively low power density,
ρexc ≈ 15 kW/cm
2 (
Figure 3c). For the convenience of comparative analysis, the PL spectra were normalized to the maximum of the UV band and placed one below the other.
Figure 3b additionally shows the visible parts of the PL spectra of the samples (
cw excitation) vs. photon energy.
In the PL spectra of all samples under low-intensity
cw excitation, two emission bands were observed (
Figure 3a). The one of shorter wavelength, located in the region of 381–382 nm for all samples, was the near-band-edge luminescence (NBEL) of ZnO. The full width at half maximum (FWHM) of the band was ~25 nm (0.2 eV). The wide band, located in the visible part of the spectrum, represented the defect (or deep-level) luminescence (DL) of ZnO. While the wavelengths and shapes of the NBEL bands for all the samples were approximately the same, such parameters of the DL band were different. In particular, the shape of the DL band was significantly transformed when the synthesis time was more than 5 min. In the case of sample S1, the DL band was very wide (FWHM reached ~310 nm or 1.1 eV), occupying the entire visible range (white luminescence could be observed from the surface of the sample by the naked eye). This band was clearly made up of several components. The same can be said for the case of samples S2 and S3, taking into account the flat long-wavelength tail of the main maximum at 505–510 nm. In this regard, it may be convenient to decompose the DL part of the spectrum into the Gaussian components. In the case studied, satisfactory fitting could be achieved using three Gaussian components peaking at 2.48–2.52 eV, 2.05–2.15 eV, and 1.75 eV, which are designated as A
1, A
2 and A
3 in
Figure 3b. It can be seen that in the DL spectrum of sample S1, all three components have comparable intensities. Meanwhile, in the spectra of samples S2 and S3, the longer wavelength components A
2 and A
3 significantly lost intensity compared to the component A
1, which gave the PL of these samples a green tint. Moreover, in the case of sample S3, this effect was even more pronounced. This was reflected in a noticeable decrease in the FWHM of the DL band from 1.1 eV (sample S1) to 0.75 eV (170 nm) for sample S2 and 0.70 eV (150 nm) for sample S3.
At the same time, it is instructive to compare these data with the EDX results. A weakening of the yellow–red parts of the DL (components A
2 and A
3) of the samples, which was observed with increasing synthesis duration, was accompanied by a significant increase in the zinc/oxygen ratio. Thus, there is a clear correlation between the PL data of the samples and their elemental composition. In particular, we can associate a yellow–red part of the DL (components A
2 and A
3), which was rather strong in sample S1, mainly with excess oxygen. This is consistent with the results of some studies in which the corresponding optical transitions were associated with the participation of zinc vacancies (V
Zn) and oxygen interstitials (O
i), including their complexes with other defects [
22,
23,
24,
25,
26,
27]. In particular, in [
23], it was assumed that O
i provided an emission band around 1.95 eV. At the same time, some authors argue that O
i complexes with other elements rather than isolated O
i are responsible for such red–orange emission [
26]. The authors of [
22,
25] suggest the participation of V
Zn in the radiative transition with an energy of 2.0–2.1 eV. The green luminescence peaking at around 2.5 eV (described by the component A
1 in our case) is more often associated with oxygen vacancies and their complexes [
25,
27,
28].
A somewhat different picture was observed under laser excitation (
Figure 3c). In this case, the ratio of the DL and NBEL bands changed sharply. In particular, the PL spectra of samples S1 and S2 showed no visible parts. There was only the NBEL band peaking at 382–384 nm. The PL spectrum of sample S3 contained both luminescence bands with maxima at 383 and 500 nm, respectively. The FWHM of the NBEL band of the samples remained virtually unchanged, comparable in value to the case of low-intensity
cw excitation. At the same time, the DL band of sample S3 narrowed by almost two times, revealing the FWHM of 80 nm (0.4 eV). The Gaussian decomposition in this case showed only two components remaining—A
1 and A
2 (see the inset in the bottom part of
Figure 3c). Here, the component A
2 formed a noticeable long-wavelength shoulder to the main maximum provided by the component A
1.
Such a redistribution of NBEL and DL intensities upon a significant increase in excitation power (see
Figure 3a,c) was also observed earlier for ZnO structures [
29,
30,
31] and can be explained by at least two effects: saturation of DL emission centers at the high-density excitation and a decrease in the thickness of the depletion layer as a result of flattening of energy bands. Particularly in the second case, electron–hole pairs, intensively created by photons with an energy greater than the bandgap, neutralized the excess charge on the semiconductor surface (the existence of this charge, in the absence of illumination, causes bending of the energy bands and formation of the depletion layer [
32]). The straightening of the bands was accompanied by a partial deactivation of DL emission centers located near the surface and an increase in the probability of interband transitions. All these factors resulted in a relative increase in the UV component as compared to the visible one.
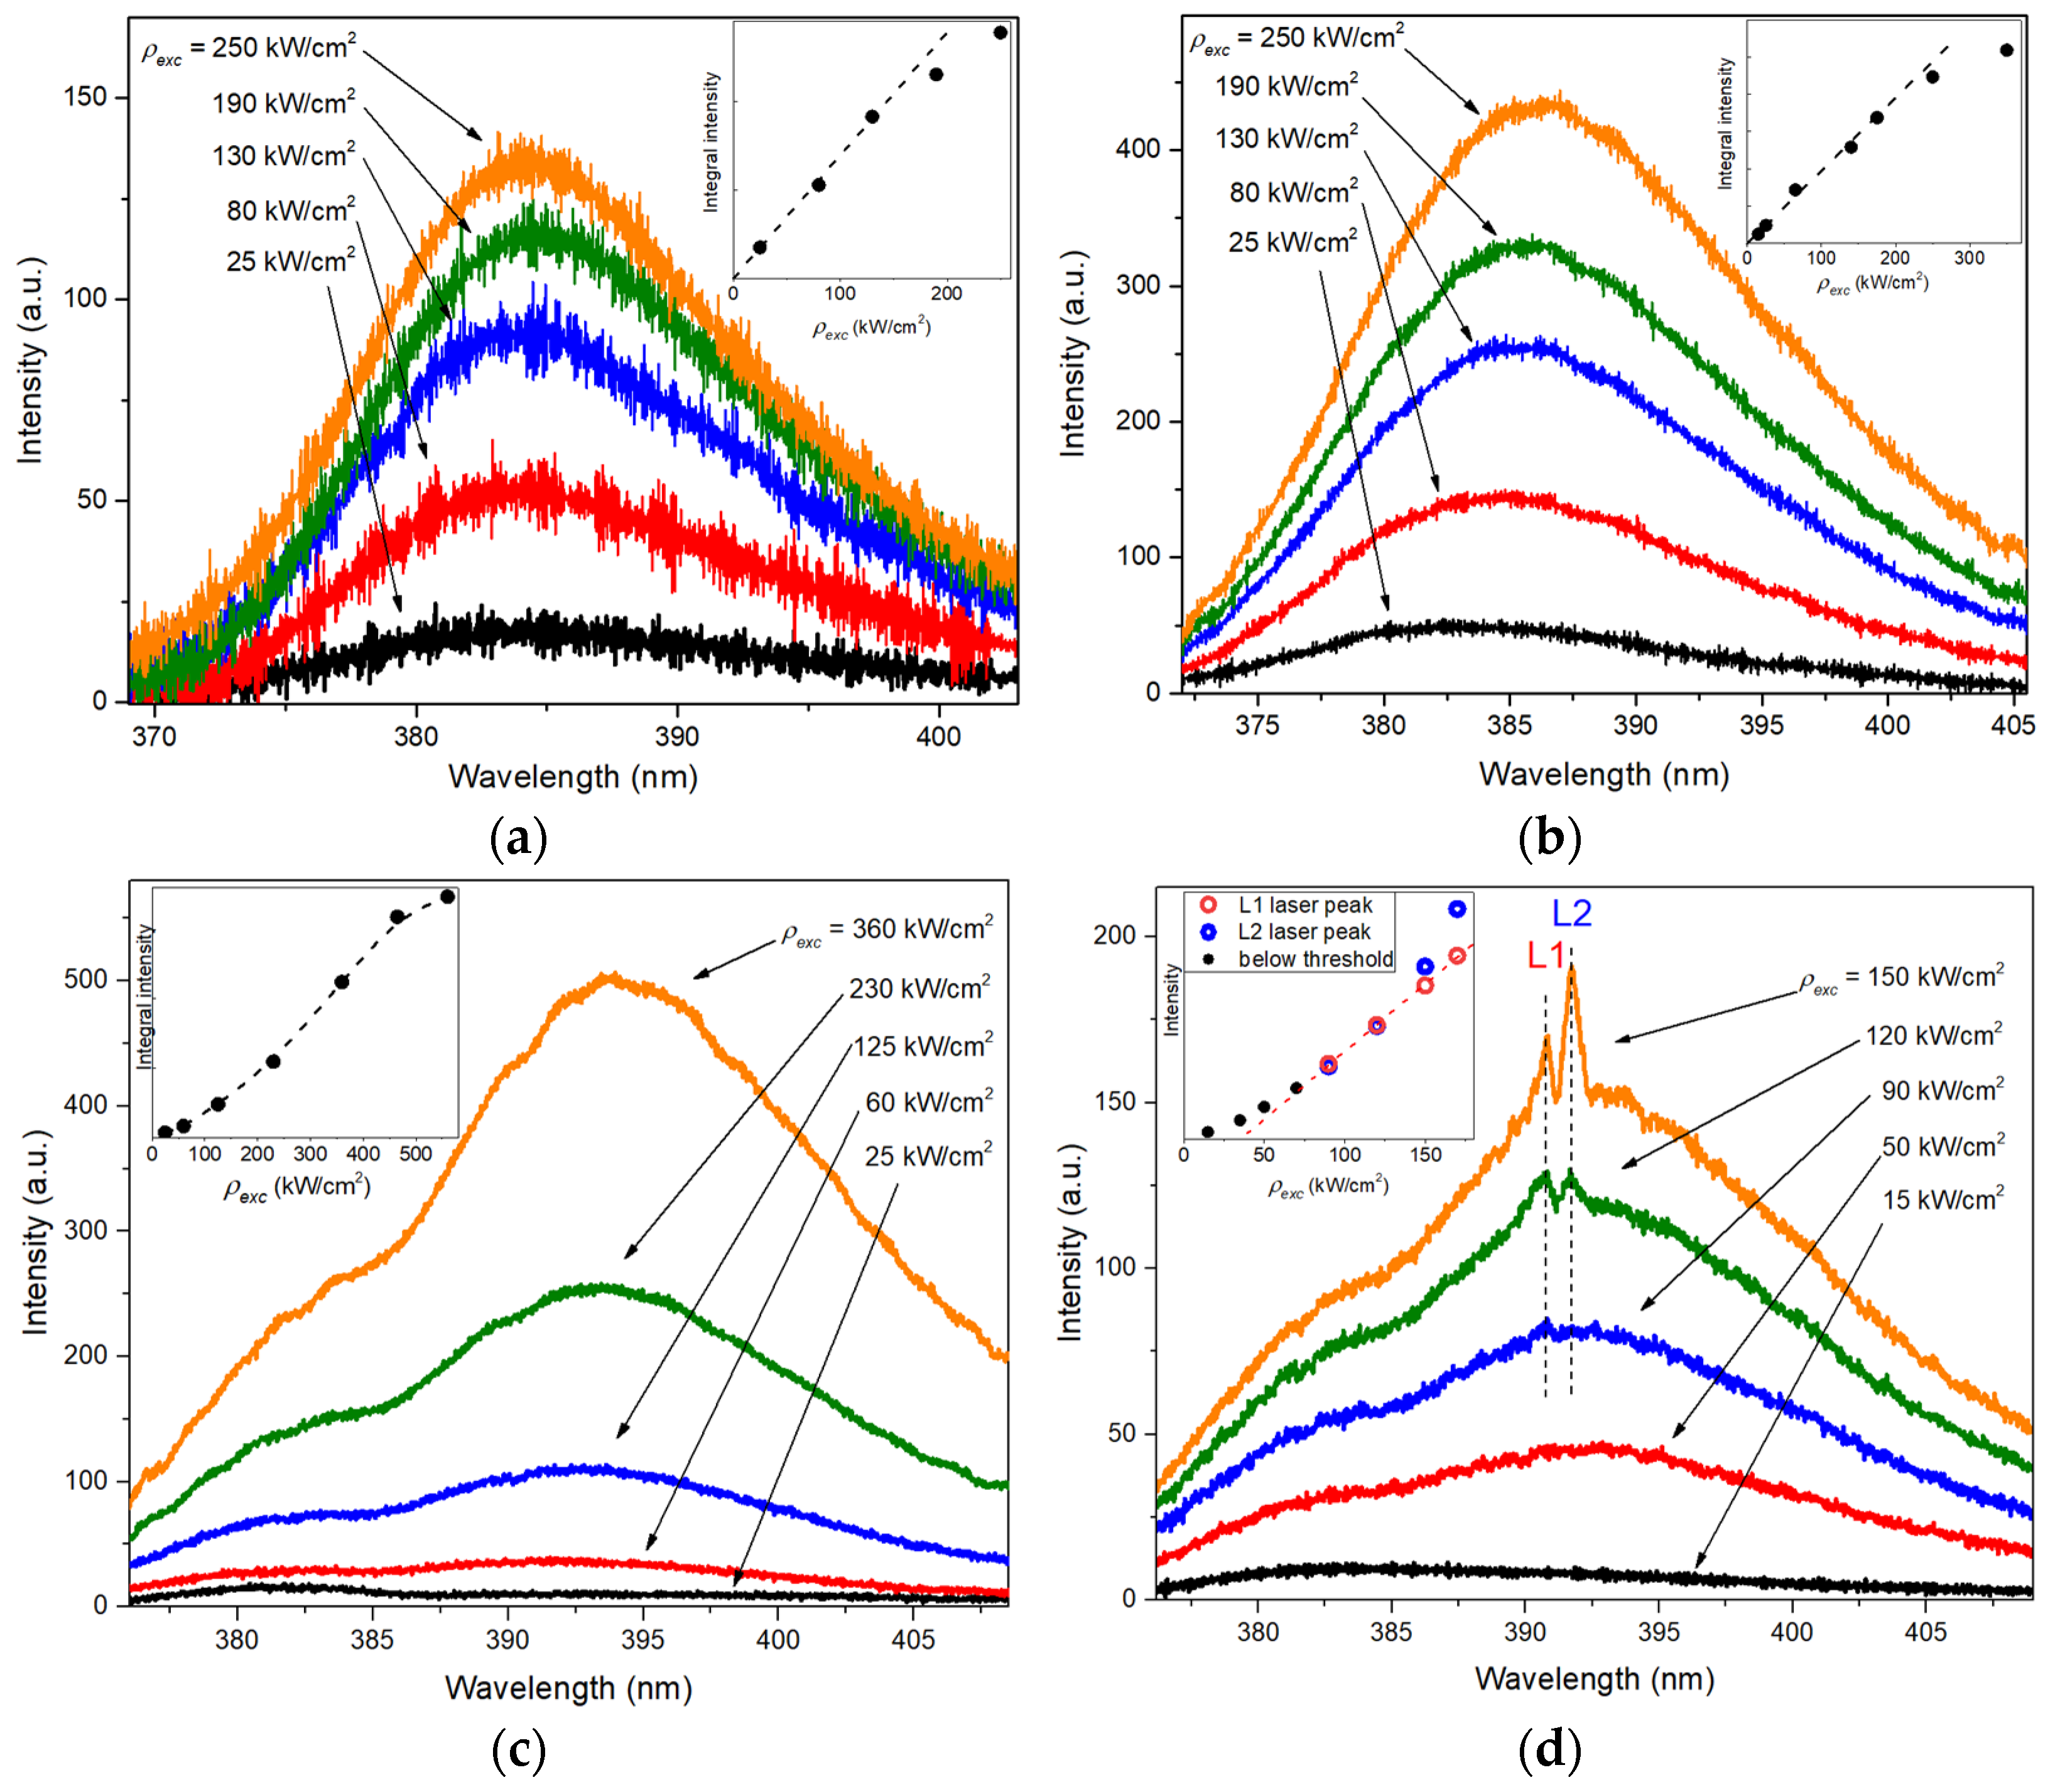
Figure 4 shows the evolution of the NBEL spectra of the samples with increasing
ρexc. In the case of sample S1 (
Figure 4a), the characteristics of the NBEL band (shape, FWHM, and wavelength) did not change substantially at different
ρexc values and were practically independent of the sample’s irradiated region. The dependence of the integral intensity of the NBEL band on
ρexc (see inset in
Figure 4a) demonstrated a linear character at initial
ρexc values and a tendency to fast saturation at elevated
ρexc. The weak NBEL and the rapid saturation of its intensity in this case were apparently associated with the low crystalline quality and the small thickness of the oxide shells of the spheroids. The small reservoir of NBEL centers of such structures is supplemented by a large number of crystal lattice defects, which serve as effective centers for nonradiative recombination of electron–hole pairs [
33,
34]. At the same time, a thin ZnO layer forming the spheroid shell cannot provide significant absorption of exciting radiation. All this results in the low efficiency of conversion of excitation light into luminescence and its rapid saturation.
In the case of samples S2 and S3, the heterogeneity of the samples’ structures significantly manifested itself in the NBEL, since crystals of different morphology, shape, and size were present. This was reflected not only in the intensity of the NBEL band, but also in its shape and behavior at different
ρexc values. In particular, three types of evolution of NBEL spectra were observed with increasing
ρexc values. The first type was similar to the case of sample S1—the NBEL spectrum represented a single band of spontaneous emission, which became saturated with increasing
ρexc values. The main difference in this case was the much more significant variability in the band intensity depending on the sample’s region due to the more diverse morphology. In regions where the PL intensity was quite high (more than an order of magnitude higher than in the case of sample S1), a redshift of the NBEL band could also be observed. An example of such spectra is shown in
Figure 4b. In this case, the redshift was ~1.5 nm, with an increase in
ρexc by a factor of 3. The other two types of evolution of the NBEL spectra of samples S2 and S3 exhibited stimulated emission properties. In particular, in the first case, amplified spontaneous emission (ASE) was observed. ASE manifested itself by a change in the shape of the NBEL band and a superlinear dependence of the NBEL integral intensity on
ρexc.
Figure 4c shows an example of such a case. Here, when a certain value of
ρexc was reached, in addition to the main maximum at 382–383 nm, a long-wavelength shoulder appeared in the spectrum. With a further increase in
ρexc, this shoulder formed into a separate band peaking at 391–392 nm at lower excitation levels, which began to dominate over the short-wavelength component and subsequently formed the main part of the NBEL. As
ρexc increased, the maximum of the long-wavelength NBEL component intensively redshifted. The redshift was 3.5 nm as
ρexc increased by a factor of 3 in the case presented in
Figure 4c. The appearance of the second, long-wavelength NBEL component was accompanied by a superlinear increase in the NBEL integral intensity. When the
ρexc was more than ~350 kW/cm
2, the integrated intensity tended to saturate (see inset in
Figure 4c). The third type of NBEL evolution revealed the laser properties of the samples. In this case, with the initial increase in
ρexc, in addition to the spontaneous emission band at 382–383 nm, which is the main one at low excitation intensities, a long-wavelength component appeared, demonstrating ASE, similar to the second type of spectra (
Figure 4c). The laser effect manifested itself in the appearance of narrow peaks in the region of the long-wavelength component of the NBEL and a rapid increase in their intensity with a further increase in
ρexc. This can be seen in
Figure 4d, which shows the evolution of the NBEL spectra of sample S3’s region with a single laser microcrystal. In this case, laser peaks appeared at
ρexc ~ 90 kW/cm
2; their average FWHM was ~0.4 nm. As
ρexc rose, the intensity of these peaks increased, and new peaks with lower energies appeared. The spacing between adjacent laser peaks was 0.9–1 nm. As in the case of ASE, there was a noticeable redshift of the entire spectral region of lasing. In addition to the appearance of increasingly longer wavelength peaks, this redshift manifested itself in a redistribution of the intensities of the laser peaks. This is well reflected by the dependence of the intensity of two neighboring laser peaks with wavelengths of 390.8 nm (the L
1 laser peak) and 391.7 nm (the L
2 laser peak) on
ρexc plotted in the inset of
Figure 4d. For subthreshold pumping intensities, the dependence of the NBEL intensity (measured in the region λ = 391.2 nm, i.e., in the range of the long-wavelength component) on
ρexc was superlinear, suggesting the presence of ASE. When the L
1 and L
2 laser peaks appeared, their intensities were almost the same. However, with increasing
ρexc, the intensity of the L
2 peak increased faster than that of the L
1 peak. In this case, the dependence of the L
2 peak intensity on
ρexc turned out to be superlinear, which, generally speaking, is not typical for classical microlasers. This superlinearity was obviously related to the contribution of ASE to the spectrum in addition to the lasing. Apparently, the ASE and the laser emission were formed either in different regions of the microcrystal or, more likely, in different microcrystals that fell in the excitation region. This is evidenced by the absence of a noticeable narrowing of the long-wavelength band with increasing
ρexc after overcoming the lasing threshold, which should have occurred due to the transfer of its energy into optical modes—this situation is usually observed for single micro- and nanocrystal ZnO cavities [
35,
36], including polyhedral microcrystals studied earlier [
16].
In the case under study, WGM lasing is excited, as was shown in our previous work [
16], where such polyhedral microcrystals were studied for the first time. In particular, the wavelengths of the laser peaks are described well within the framework of a planar model of a hexagonal WGM cavity:
where
D is the diameter of the hexagonal cavity,
and
(
and
are the refractive indices for TE and TM polarizations), and
N is the mode number (interference order) [
37,
38]. We considered only TE modes, which are predominantly excited in the near-UV range in ZnO WGM microcavities [
38,
39].
A separate issue is the nature of the long-wavelength NBEL component that appeared in the ASE and lasing spectra of the samples. There are reports on luminescence associated with shallow defects in the ZnO lattice that can appear in this spectral region [
40,
41,
42]. However, the appearance of the long-wavelength NBEL band in only some places of the samples, its redshift, and finally its accompaniment by a superlinear increase in the NBEL integral intensity and lasing allowed us to exclude the defect origin of this band in the case under study and, instead, to assume the participation of processes leading to optical gain. Although the gain mechanisms in ZnO have been studied for quite a long time, in many cases, doubts and disputes still remain—this applies to a greater extent to room-temperature gain, when the interpretation of emission spectra is difficult due to the strong spectral broadening and overlapping of the different emission bands. The spectral pattern of ASE and lasing with two emission bands, one of which (short-wavelength) has a spontaneous nature and the second of which (long-wavelength) is stimulated (laser) emission, is often observed for WGM ZnO microstructures [
9,
31,
35,
43,
44,
45]. In this case, the spectral behavior of the stimulated emission bands can be different, depending on the excitation power. In some cases, there is an intense redshift, as observed in the present work. In other cases, the redshift is either weakly pronounced or completely absent. Until recently, it was widely believed that in WGM ZnO microstructures exhibiting intense redshift of the ASE/lasing band, optical gain is formed as a result of population inversion in the electron–hole plasma (EHP) [
9,
35,
43,
45]. However, in a recent study of low-threshold ZnO microrod lasers [
46], we showed that the mechanism of redshifting gain at room temperature is exciton scattering on free electrons rather than an inverted EHP.
The threshold pumping intensities required to excite lasing in the ZnO polyhedral microcrystals under study were not as low as for the microrods in [
46]. A simple estimate of the density of electron–hole pairs created by optical pumping [
16] does not exclude reaching values on the order of the threshold Mott density (~10
18 cm
−3 for ZnO [
47]), already at near-threshold pumping intensities. Nevertheless, the estimates of the dynamic change in the bandgap energy due to renormalization [
16] show that for microcrystalline ZnO, the range of 390–395 nm is too long-wavelength for stimulated emission due to recombination in an inverted EHP. At the same time, it was noted in [
46] that the spectral picture, corresponding to the case of a redshifting gain profile, does not change upon transition from the excitonic regime to the EHP regime, even with a significant increase in excitation intensity. From this, we can conclude that above the Mott threshold, scattering processes similar to excitonic ones are realized, i.e., population inversion in EHP does not occur. In particular, in [
48], the scattering of Coulomb-correlated electron–hole pairs by free carriers in the EHP was suggested as a replacement for the exciton–electron scattering process. Moreover, we believe that the true pair density created in the crystals under study was less than the estimated one. This was due to the reduced efficiency of pumping energy absorption as a result of the presence of fragments of spheroid shells on the microcrystals’ surfaces, which created additional scattering and absorption in the path of exciting light. In this regard, we believe that the gain mechanism similar to exciton–electron scattering is realized in polyhedral microcrystals, which can transform into an analogous process in EHP with increasing pumping intensity.
The spontaneous emission component of the NBEL peaking at 382–384 nm (see, e.g.,
Figure 4a,b) can be associated with phonon replicas of free exciton emission. Moreover, in the case of relatively low excitation intensities, the main contribution to this band is made by the first phonon replica [
28]. The redshift of this band with increasing excitation intensity, observed in the case of samples S2 and S3 (
Figure 4b), indicates an increase in the fraction of the second phonon replica, the maximum of which falls in the range of approximately 390–392 nm in the case of microcrystalline ZnO at room temperature [
46,
49].

