Article

Broadband 2.85 μm Luminescence Properties of Er3+/Dy3+ Co-Doped Fluorotellurite Glass

1
School of Materials Science and Engineering, Changchun University of Science and Technology, Changchun 130022, China
2
Chongqing Institute of Changchun University of Science and Technology, Chongqing 528437, China
*
Author to whom correspondence should be addressed.
Photonics 2023, 10(11), 1261; https://doi.org/10.3390/photonics10111261
Submission received: 4 August 2023 / Revised: 31 October 2023 / Accepted: 8 November 2023 / Published: 15 November 2023
(This article belongs to the Section Optical Communication and Network)

Abstract

:
TeO2-BaF2-Er2O3-Dy2O3 laser glasses were prepared using the melt-quenching method. The bound water that can capture the excited state energy was reduced by physical and chemical methods. We did not observe a significant Er3+ emission peak at 2.7 μm in fluorescence spectra, which may be due to the efficient energy transfer process (ET2). Meanwhile, we found a broadband gain span of approximately 400 nm in fluorescence spectra at the 2.85 μm band, attributed to the ‘vector summation’ of the energy level radiation transition and the change of the glass network. Subsequently, we explored the structural properties of the glass. The results indicated that the Gaussian peak located at 250 cm−1 drifts toward 370 cm−1, which may be caused by the fracture or recombination of Te-O-Te and a decrease in the bridge oxygen content with the increasing concentration of Er2O3. The topology cage structure around the luminescence center of rare earth ions is changed and the stability of the optically active center is enhanced, finally contributing to the enhancement of luminescence. Meanwhile, the maximum σemi and gain coefficient of Dy3+ reach up to 7.22 × 10⁻²¹ cm2 and 7.37 cm−1, respectively. The comprehensive results show that the fluorotellurite glass designed in this study is expected to be a gain medium for mid-infrared lasers in remote sensing monitoring, military, and other fields.

1. Introduction

In recent years, fiber lasers in the mid-infrared band have become a hot topic due to their potential applications in remote sensing monitoring, military, and other fields [1,2,3,4,5,6,7,8,9]. Usually, ~3 μm emission originates from the radiative transition of Ho3+: 5I65I7, Er3+: 4I11/24I13/2, and Dy3+: 6H13/26H15/2 [2]. However, Ho3+ does not have an absorption band that matches a commercial pumping source [10], so studies have focused more on Er3+ and Dy3+.
In 2017, Qi et al. successfully fabricated Dy3+/Nd3+ co-doped fluoride glass with hydroxyl absorption coefficients as low as 0.032 cm−1, and the emission cross-section reached up to 5.22 × 10⁻²¹ cm2 [11]. In 2020, Wang et al. reported an Er3+ doped TeO2-Ga2O3-R2O glass with an emission cross-section of 7.2 × 10⁻²⁰ cm, which obtained high-efficiency fluorescence at the 2.7 μm band [12]. In 2022, Ye et al. found a significant enhancement of luminescence in the 2.7 μm band with a maximum gain coefficient of 2.25 cm−1 in Er3+ doped TeO2-Ta2O5-ZnO glass, which underwent considerable changes when platinum crucibles were adopted to prepare the glass instead of alumina crucibles [13].
In addition, the selection of the host glass is also particularly important because it tends to resonate with the radiation transition of the mid-infrared luminescence center and suppress its output properties [14]. Fluoride glass does not have a universal application due to its defects such as poor mechanical properties and harsh preparation process. Meanwhile, the wide infrared transmission range, diversified structure, and the easy directional tailoring of the topological cage lattice structure of fluorotellurite glass make the glass form a wider range of intervals and are widely investigated.
In 2020, Hou et al. prepared a Ho3+/Yb3+ co-doped tellurite-germanate glass with lower phonon energy (779 cm−1) [15].
In 2021, Zhang et al. reported a Ho3+/Er3+ co-doped glass and found that positive gain could be obtained when p > 0.4, indicating that a low pumping threshold can achieve 2.7 µm band mid-infrared laser operation [16].
In 2022, Zhang et al. investigated the mid-infrared band luminescence of Dy3+/Er3+/Tm3+ tri-doped tellurite glasses, in which the maximum emission cross-section of Dy3+ in the 2.84 μm band reached 1.32 × 10⁻²⁰ cm2 [17].
In 2023, Feng et al. prepared a series of Er3+/Pr3+ co-doped fluorotellurite glasses and the energy transfer mechanism of Er3+ and Pr3+ ions was investigated using the Dexter theory, where the energy transfer microscopic parameters CD-A are 13.21 × 10−40 cm6/s and 0.89 × 10−40 cm6/s for the ET1 and ET2 processes, respectively [18].
In the same year, Zhang et al. obtained 4.1 μm fluorescence emission in Ho3+/Yb3+ co-doped tellurite glasses, and the full width at half maximum (FWHM) reached up to 343 nm [19].
At present, there is little research on mid-infrared luminescence in the 3 μm band, which can achieve both high-efficiency luminescence and long-span gain bandwidth simultaneously. We believe that it is an effective approach to solve the scientific problems of high-efficiency luminescence and large-span gain bandwidth in the 3 μm band and can be achieved by using Er3+/Dy3+ co-doping. The theoretical basis is that Er3+ has a strong absorption peak at 980 nm, while the emission band of Er3+: 4I13/2 energy level is close to the absorption band of Dy3+: 6H11/2 energy level, and it is speculated that there is an efficient energy transfer process between Er3+ and Dy3+. Concurrently, the emission band of spectra between Er3+: 4I11/24I13/2(2.7 μm) and Dy3+: 6H13/26H15/2 (2.9 μm) overlaps, resulting in an enhancement of luminescence efficiency and a broadening of the gain bandwidth in the 3 μm band [20].
In 2017, Wang et al. obtained broadband mid-infrared emissions under different excitation. It is reported that the 980 nm excitation is more efficient for Dy3+/Er3+ co-doped tellurite glass to realize the low threshold at broadband mid-infrared lasers [20].
In 2021, Zhang et al. reported a kind of Dy3+/Er3+ co-doped tellurite glass with a full width at half maximum of 358 nm and clarified the energy transfer process between Dy3+ and Er3+ [21].
Based on the above reasons, this paper aims to address scientific problems such as the low luminescence efficiency and limited tunable range of the gain bandwidth of mid-infrared light sources. Er3+/Dy3+ co-doped TeO2-BaF2 glasses are prepared using the melt-quenching method and the hydroxyl groups in the glasses were effectively removed by physical and chemical methods. Combining the fluorescence spectra and Raman spectra of the system, we try to use Er3+ as a sensitizer and systematically analyze the mechanism and technical method of gain bandwidth extension in the mid-infrared band from the perspective of topological cage grid trimming. Meanwhile, the calculations based on the Er3+/Dy3+ microscopic energy transfer theory are corroborated again, and the broadband mid-infrared emission with a central wavelength of 2.85 μm is finally obtained.

2. Experiment Procedures

2.1. Preparation

Er3+/Dy3+ co-doped fluorotellurite glasses with 60TeO2-40BaF2-3Dy2O3-xEr2O3 (where x = 1, 3, 4.5, and 6, named TB1–TB4) were prepared using the melt-quenching method. Adequate amounts (~20 g) of precursor materials that had been weighed accurately were well mixed and then melted in an alumina crucible at 1050 °C for about 40 min with a dry O2 atmosphere to reduce the content of OH-. The glasses melted as clarified at 1070 °C for 10 min, followed by holding at 1000 °C for 10 min. Thereafter, the samples were formed by casting in a copper mold and annealing for 8 h at 350 °C then furnace cooling to room temperature. Finally, the annealed glass samples were cut and polished to the size of 15 × 15 × 2 mm3 for measurements.

2.2. Measurements

The Raman spectra in the range of 100 cm−1 to 1000 cm−1 can be obtained via the Invia Raman spectrometer from Renishaw (excitation wavelength of 488 nm). The infrared transmittance was measured by a Spectrum Two FT-IR Spectrometer (PerkinElmer, Waltham, MA, USA). Moreover, the absorbance spectra in the wavelength range of 400–2200 nm (step with 2 nm) were detected by a PerkinElmer Lambda 900UV/VIS/NIR spectrophotometer. The refractive index of the glass was measured using an ellipsometer (XLS-100, J.A. Woollam Co., Inc., Lincoln, NE, USA). The fluorescence spectra were carried out by a computer-controlled Triax 320 spectrometer (Jobin-Yvon Co., Edison, NJ, USA) under 980 nm LD excitation with a liquid nitrogen-cooled PbS detector at the range of 1400–3700 nm. The thermal parameters of the glass sample were measured using a 404 PC differential scanning calorimeter (DSC, Poulsbo, WA, USA) with a heating rate of 15 °C/min and N2 was used as a protective gas. Note that the same experimental conditions should be guaranteed for all samples to minimize measurement error as far as possible.

3. Results and Discussion

3.1. Physical Properties

The DSC-measured thermogram of the host glass (60TeO2-40BaF2), which can characterize the thermodynamic properties for manufacturing fiberglass, is shown in Figure 1. The glass transition temperature (Tg) is 397 °C, and the crystallization onset temperature (Tx) of 514 °C can be obtained by observing the curves in Figure 1. In these, the value of Tg is greater than other tellurite glass compositions, which are 80TeO2–10BaO–5BaF2–5La2O3 (359.2 °C) [22] and 74TeO2-15Ga2O3-11BaF2 (366 °C) [23]. Meanwhile, it is also larger than bismuthate glasses (352 °C) [24]. A larger Tg denotes a higher threshold of resistance of glass to laser damage. Furthermore, the ΔT (=Tx − Tg) of the host glass is 117 °C. Therefore, the host glass possesses good thermodynamic properties and crystallization resistance stability, making it a potential laser glass material that can be used for the fabrication of optical fibers.

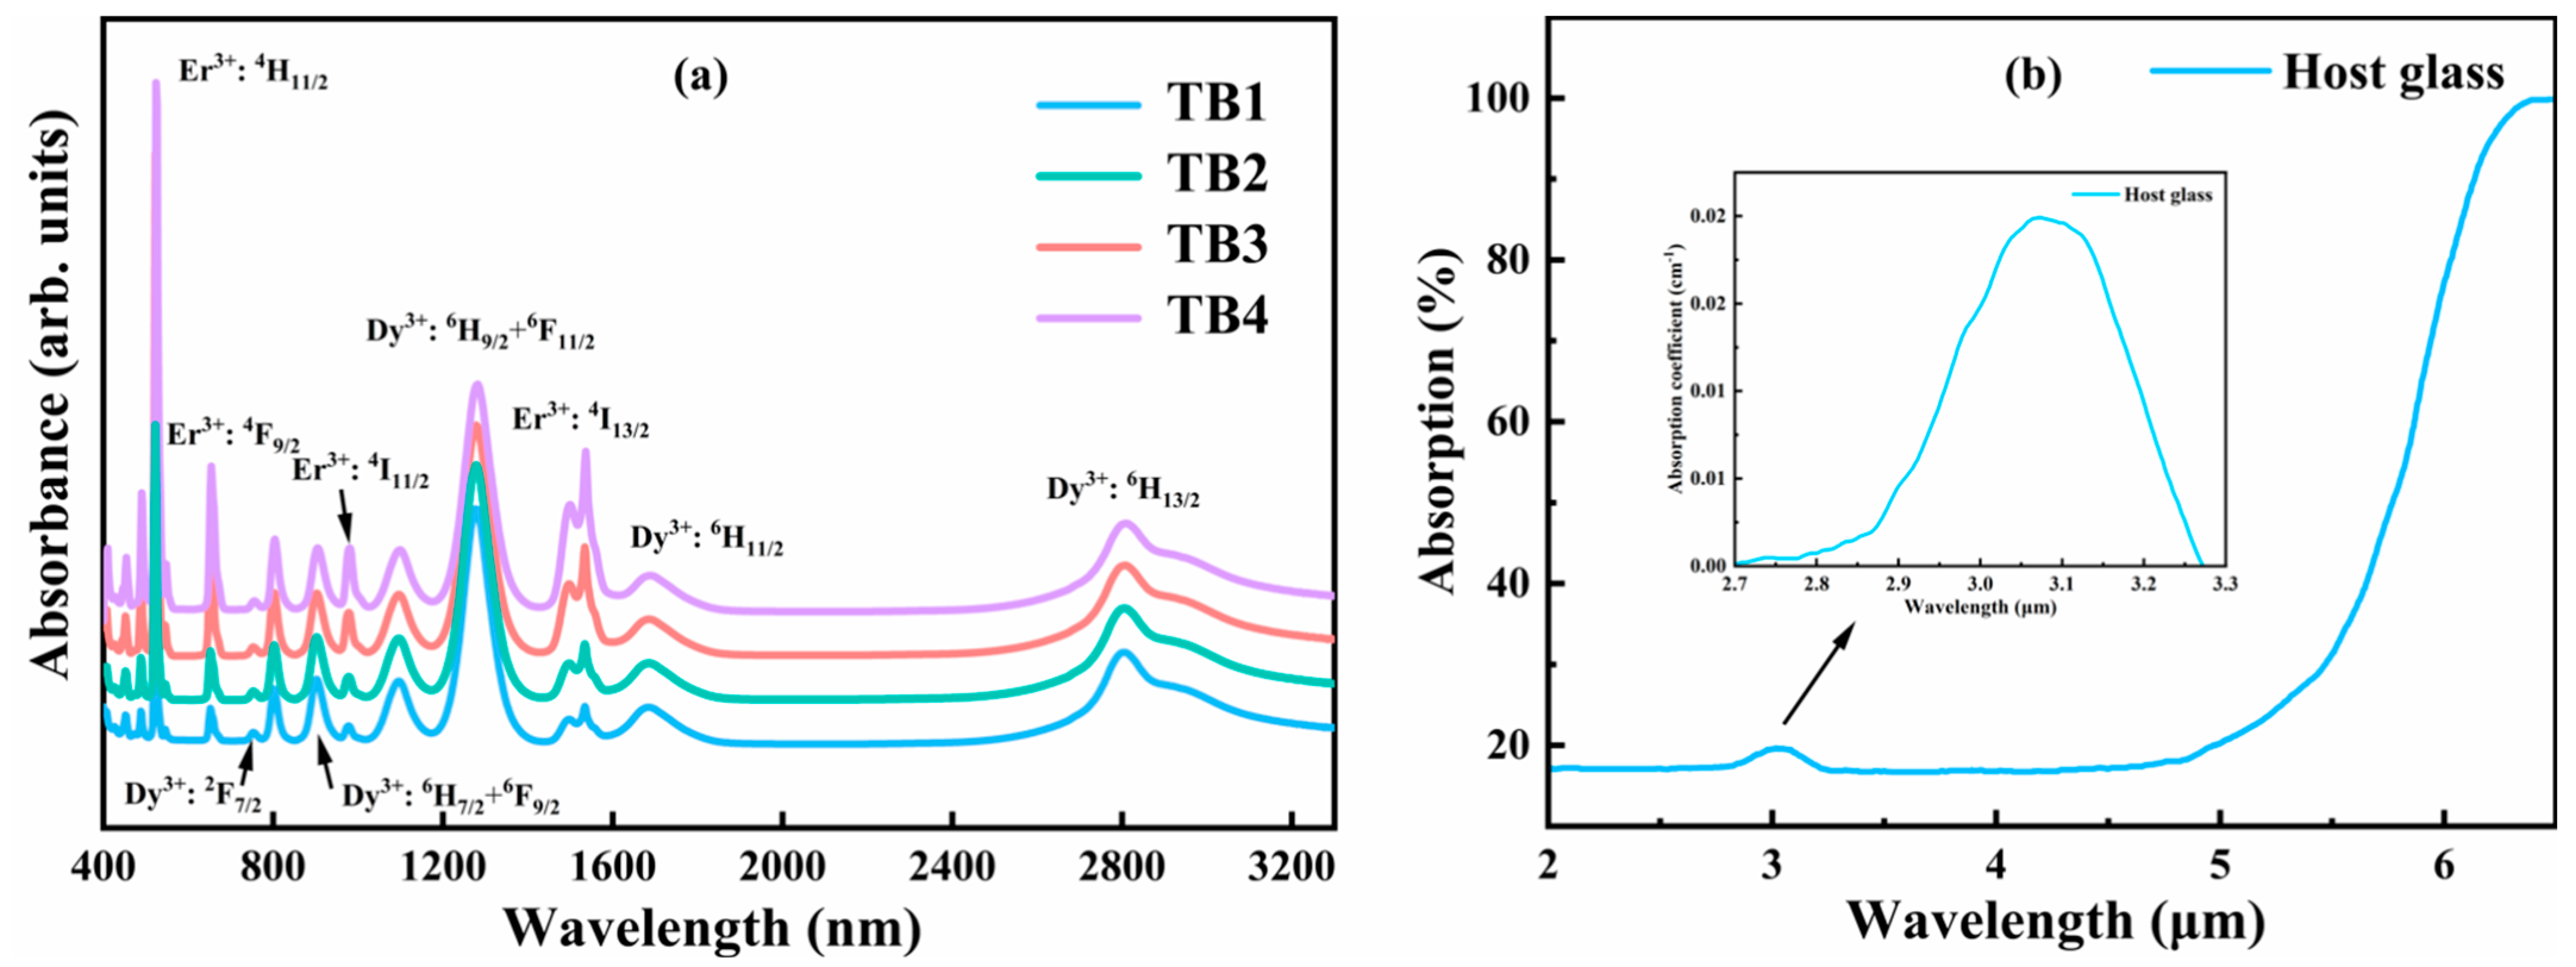
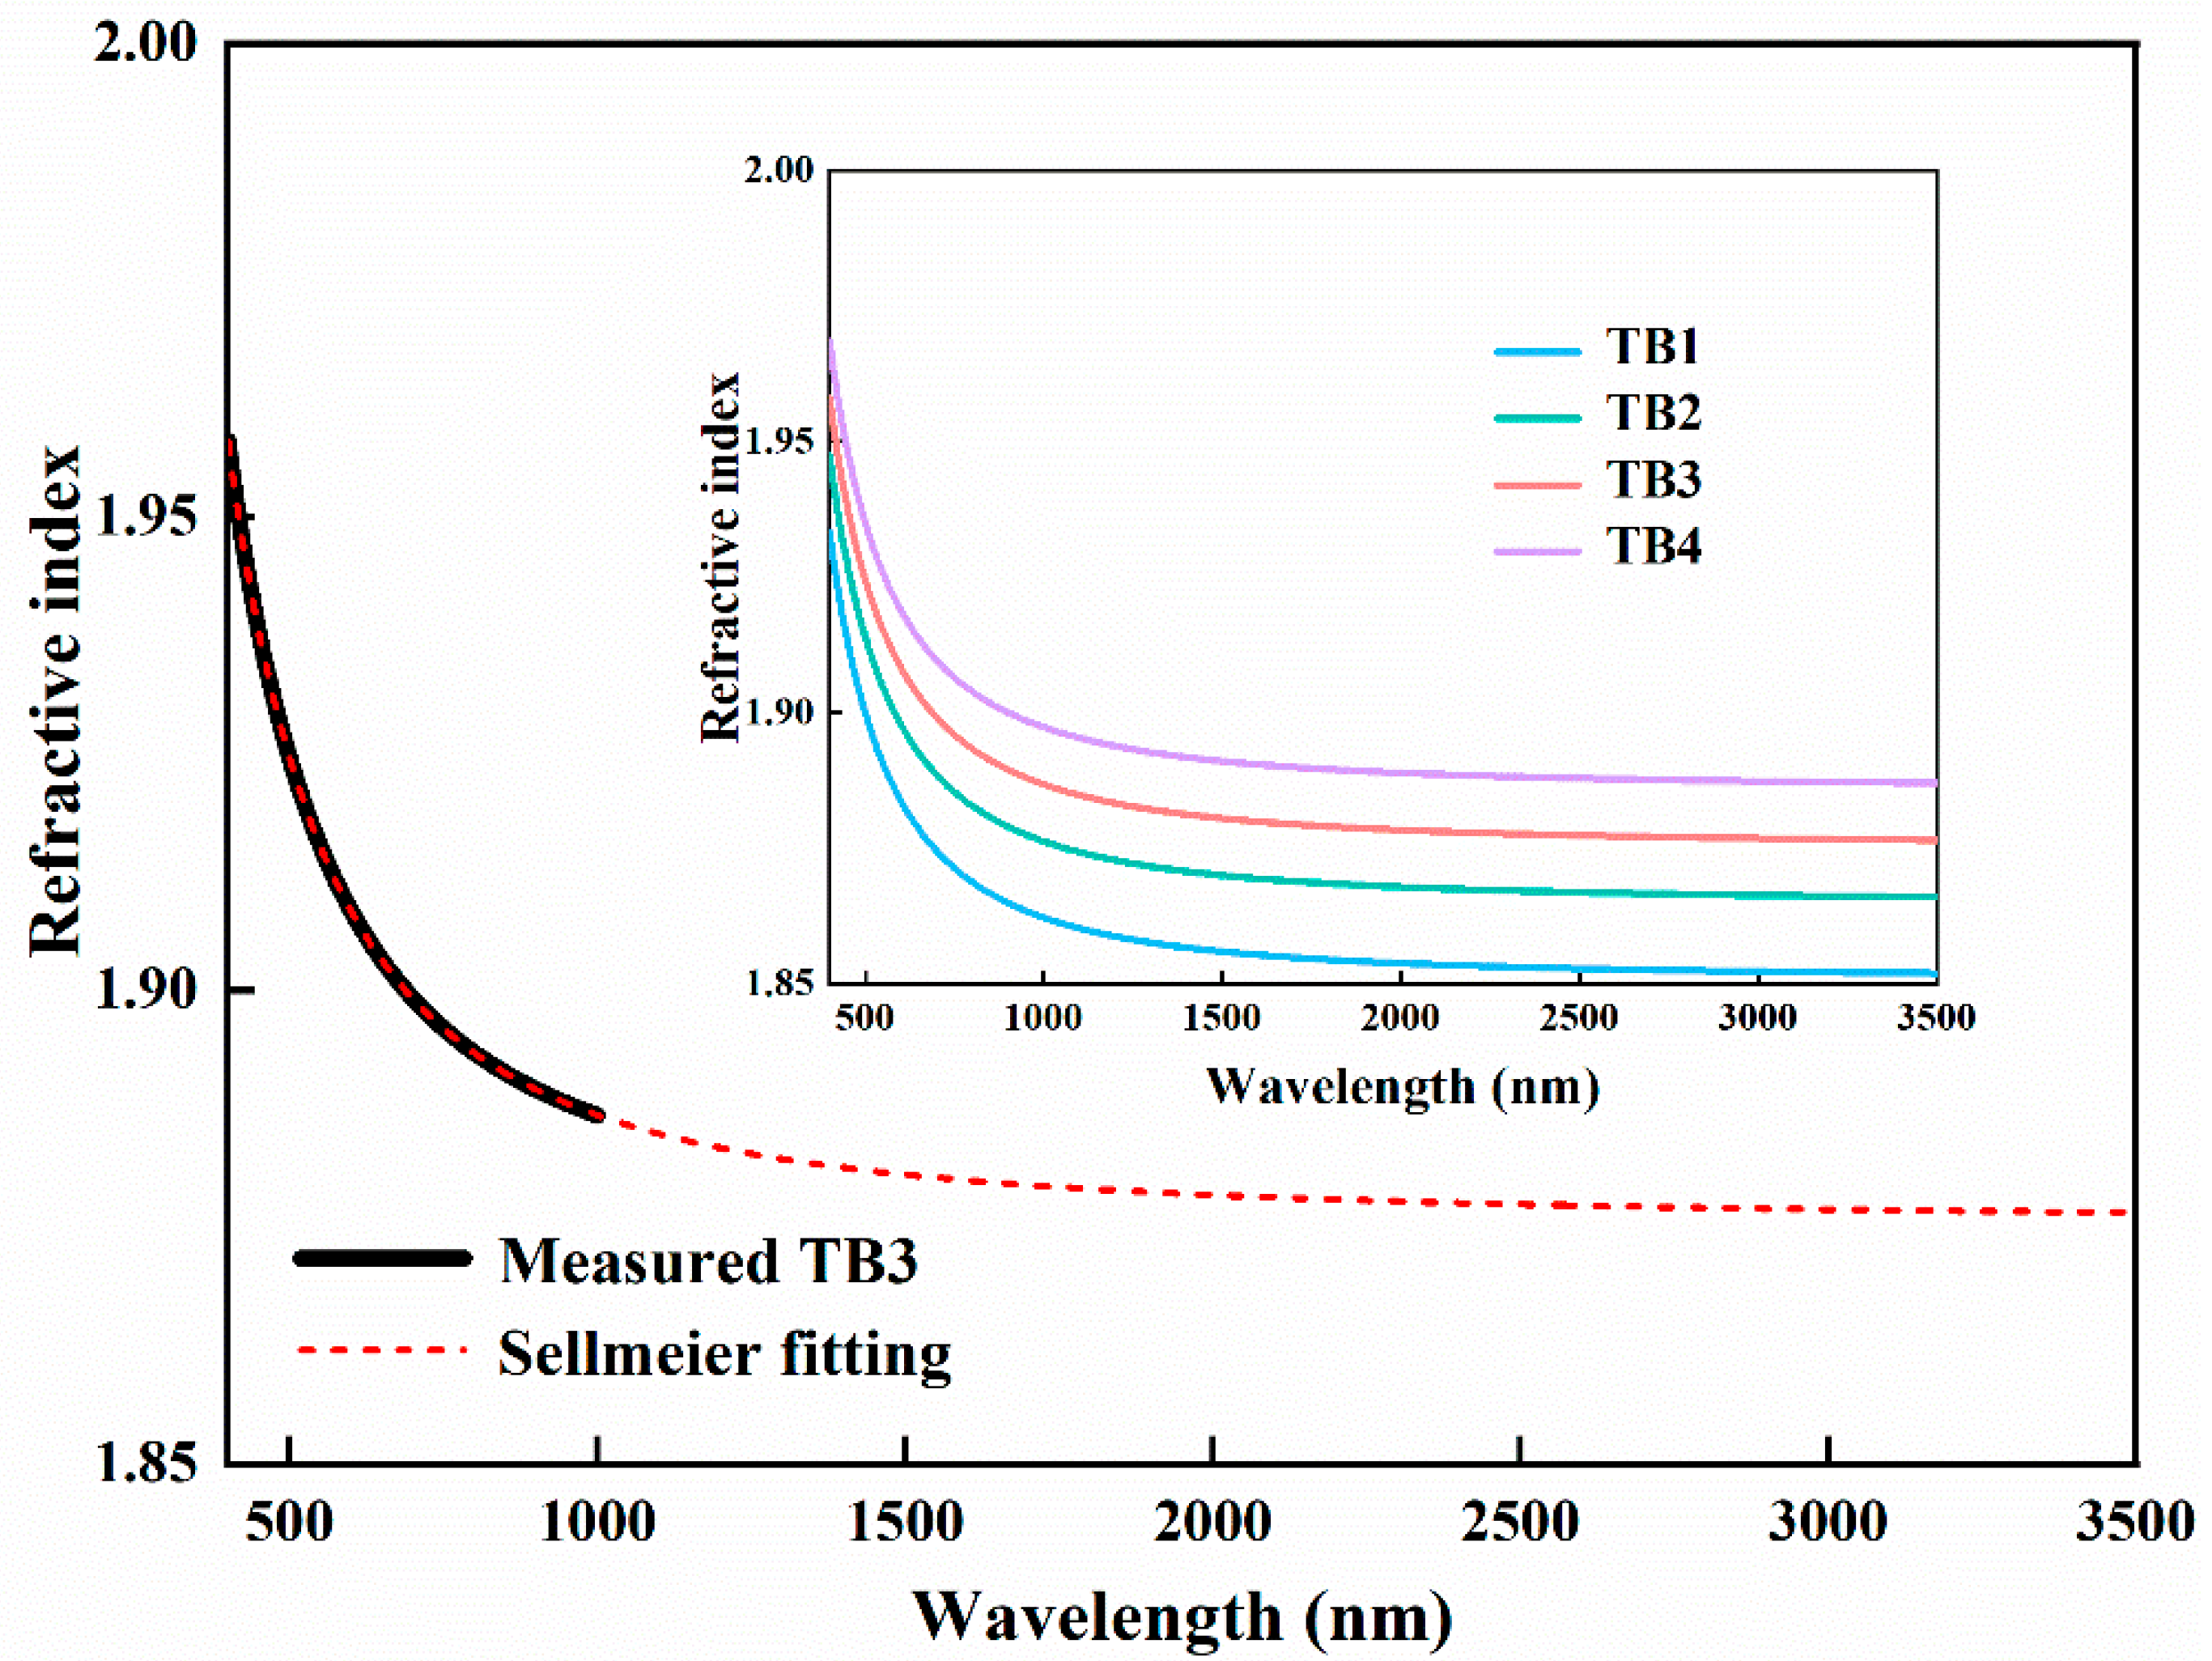
3.2. Absorption Spectra and Refractive Index

The absorption spectra of Er3+/Dy3+ co-doped fluorotellurite glasses at the range of 400–3300 nm are given in Figure 2a. There are eight absorption peaks observed at 524 nm, 656 nm, 756 nm, 808 nm, 904 nm, 980 nm, 1098 nm, 1280 nm, 1534 nm, 1700 nm, and 2808 nm corresponding to energy transition from 4I15/2 to the excited states 4H11/2, 4F9/2, 4I11/2, and 4I13/2 of Er3+, and energy transition from 6H15/2 to the excited states 2F7/2, 6H7/2 + 6F9/2, 6H9/2 + 6F11/2, 6H11/2, 6H11/2, 6H11/2, and 6H13/2 of Dy3+, respectively. With the increase in Er3+ concentration, the absorption intensity was enhanced, while there was no marked change in the shape and position of the different absorption peaks located at different energy levels, which means that the fabricated fluorotellurite glasses have a great solubility for Er3+ and Dy3+ [21,25,26]. It is worth noting that the absorption band of Er3+, located at 1530 nm, is close to that of Dy3+, located at 1700 nm; thus, the effective energy transfer can be performed to obtain the fluorescence of Dy3+: 6H13/26H15/2 at 2.9 μm.
For the 3 μm radiative transition, the energy difference between the energy levels of Er3+ and Dy3+ matches the hydroxyl group absorption. And the non-radiation transition can be caused by the resonance between them or phonon-assisted energy transfer, which leads to the OH- continuously ‘capturing’ the energy of the excited state. Therefore, reducing the content of the hydroxyl group can indirectly enhance the efficiency of mid-infrared luminescence.
We used an oxygen atmosphere in the melting process to physically reduce the hydroxyl group absorption. In addition, we introduced F into the host glass in the form of BaF2, to react with OH to generate HF gas that escapes from the glass melt, which is more electronegative than O2− [27]. Ultimately, physical and chemical methods were used to reduce the OH content in the glass, enhancing the luminescence efficiency of Er3+/Dy3+ co-doped glass near the 2.85 μm band. Figure 2b presents the absorption spectra of the host glass from 2.5 μm to 6.5 μm with a maximum transmittance of 83%. Generally, the OH- groups must be removed from the glass because the residual OH- will resonate with the rare-earth ions and quench their luminescence. Based on the absorption spectra and FT-IR absorption curves in Figure 2, the hydroxyl absorption coefficients can be expressed as [5]:
α O H = 1 L ln T 0 T
where L is the thickness of the glass, T0 is the maximum transmittance of the host glass, and T is the measured transmittance intensity. The calculated α O H of the host glass at 3050 nm is 0.02 cm−1, which is lower than the previously reported values for Dy3+/Nd3+ co-doped fluoride glass (0.032 cm−1) [11].
The absorption spectra and the Judd–-Ofelt theory were combined to analyze the bonding of rare-earth ions with surrounding anions and cations to further determine their spectral properties. The calculated Judd–Ofelt parameters Ωt (t = 2, 4, 6) of Dy3+ in TB1–4 and other glasses are listed in Table 1. Note that the Ω2 of TB1–4 glasses (from 8.04 × 10⁻²⁰ cm2 to 9.40 × 10⁻²⁰ cm2) are larger than AYB (1.29 × 10⁻²⁰ cm2) [11] and ZBLAY (3.16 × 10⁻²⁰ cm2) [28] glasses. In general, Ω2 is extremely sensitive to changes in the composition of glass, which is closely related to the network structure and the symmetry of the ligand field in the host glass. A relatively large Ω2 value suggests higher covalency and symmetry. Nevertheless, contrary to previous papers, Ω2 in the current work does not decrease as the Er2O3 concentration increases [4]. With the increase in Ω6, the crystal field action on Dy3+ is weakened, and the Stark fission of energy level is also weakened, thus obtaining wider fluorescence emission spectra [3]. The comprehensive results show that the TB3 glass system is a good gain medium for the mid-infrared band.
Based on the Judd–Ofelt intensity parameters, the radiative transition probabilities (Arad) and radiation lifetime (τrad) of Dy3+ in TB3 glass were further calculated, as shown in Table 2. Relatively high Arad provides a greater possibility for obtaining efficient fluorescence emission. Note, the Arad of Dy3+: 6H13/26H15/2 in TB3 glass is 98.90 s−1 larger than ZBYLY (45.92 s−1) [28] and germanate glass (63.94 s−1) [29]. The larger the probability of radiation transition, the higher the possibility of achieving efficient fluorescence emission. In conclusion, it can be inferred that the prepared TB3 glass might be a promising candidate for mid-infrared amplifiers and lasers.
The refractive index of TB1–4 glasses is fitted by the second-order Sellmeier equation, as shown in the Figure 3 inset. The Sellmeier equation can be expressed as:
n 2 1 = A 0 + n 1 2 A n λ 2 λ 2 a n 2
where λ is the wavelength and A0, An, and αn are the Sellmeier coefficients. It can be derived that the refractive indices of TB1–4 glasses at 2850 nm were 1.8520, 1.8660, 1.8766, and 1.8871, respectively, from the fitting curves.

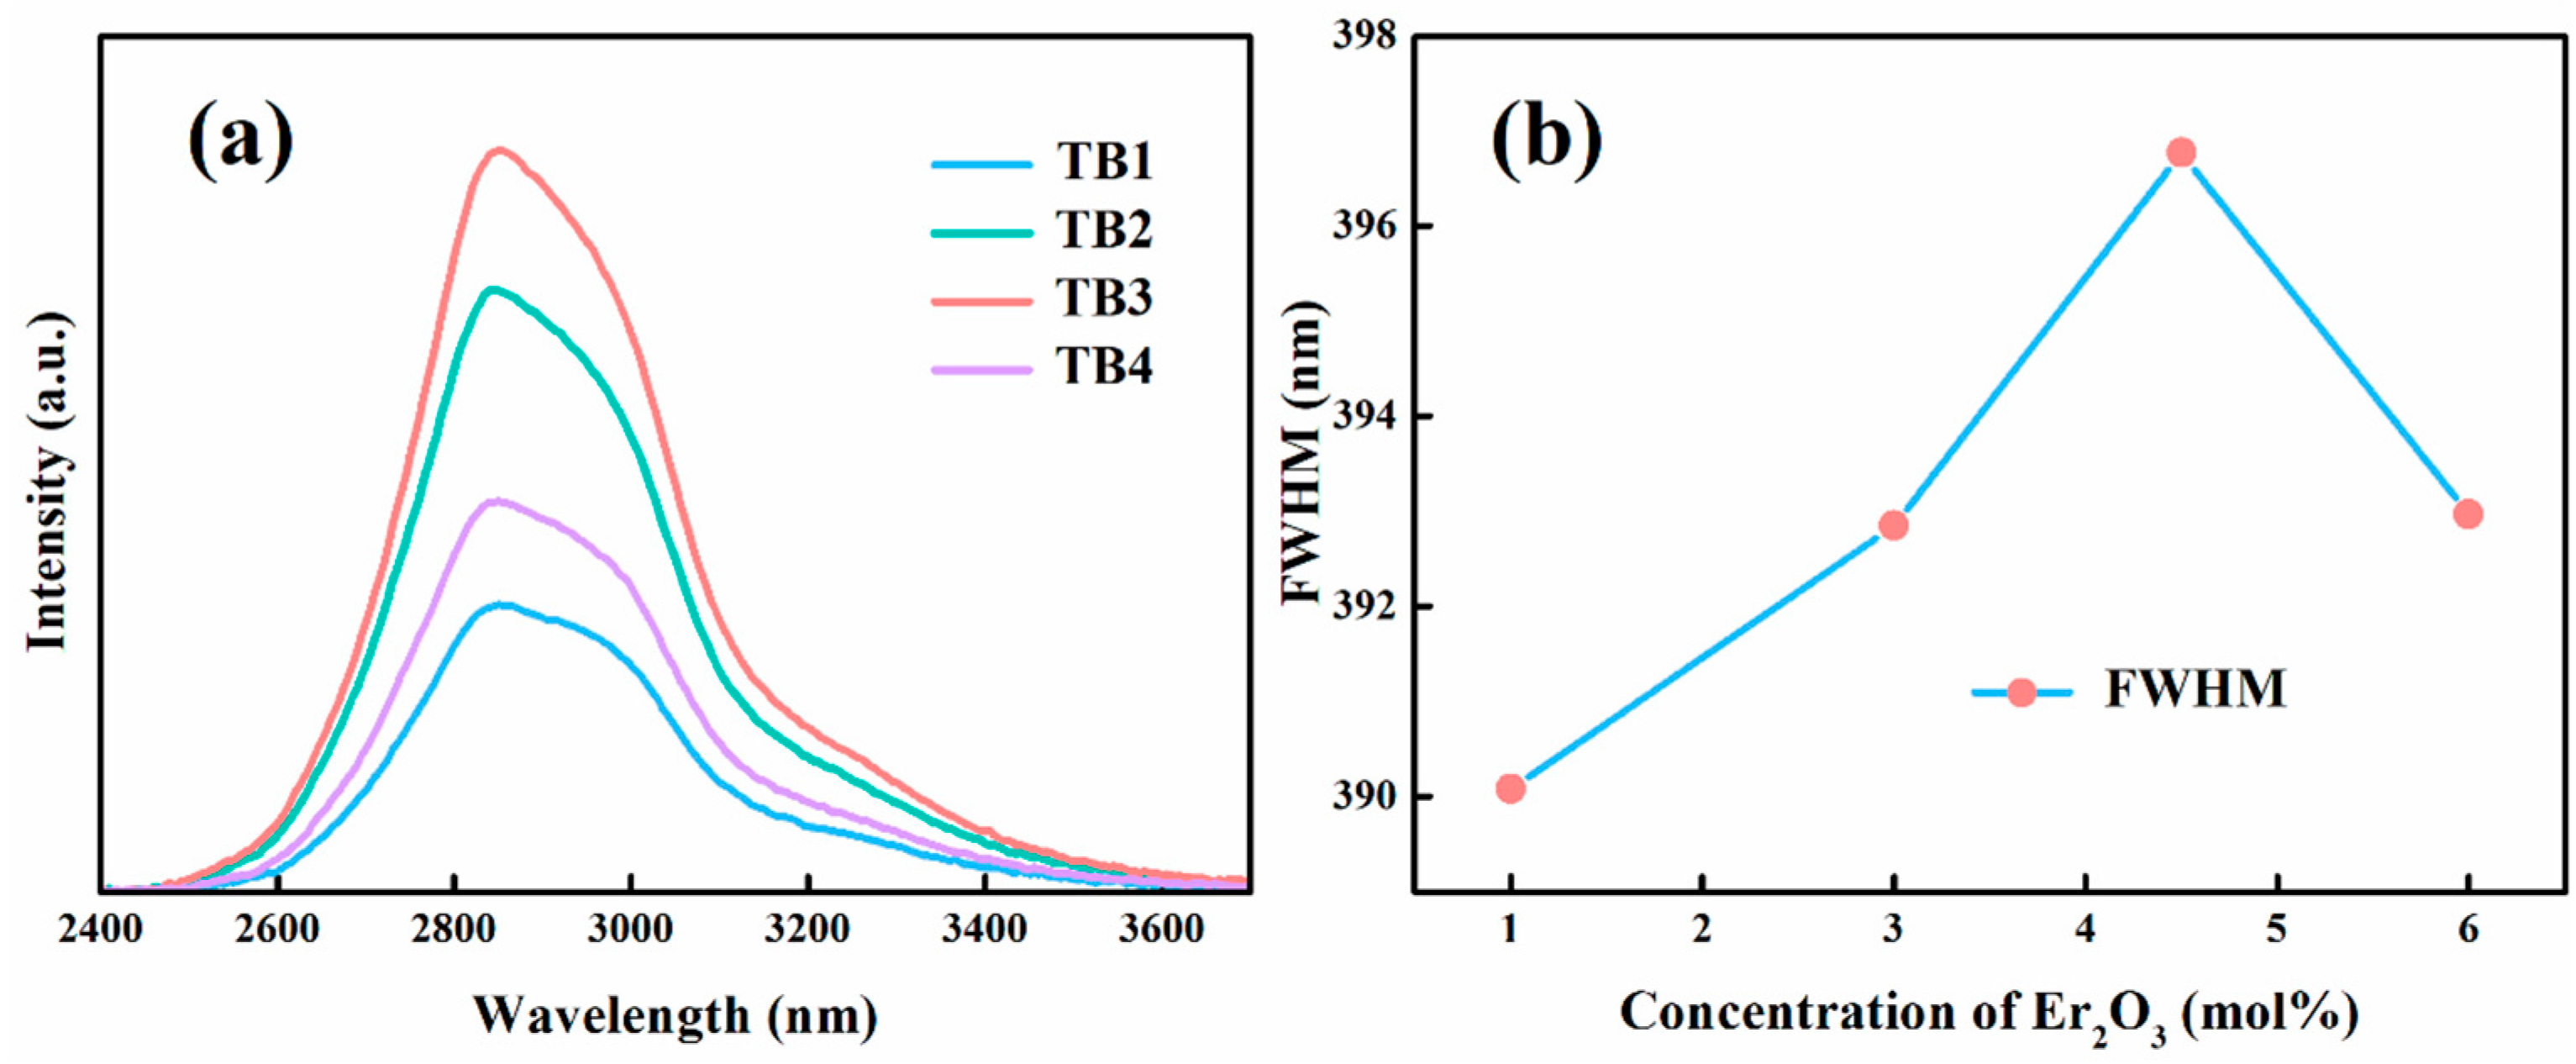
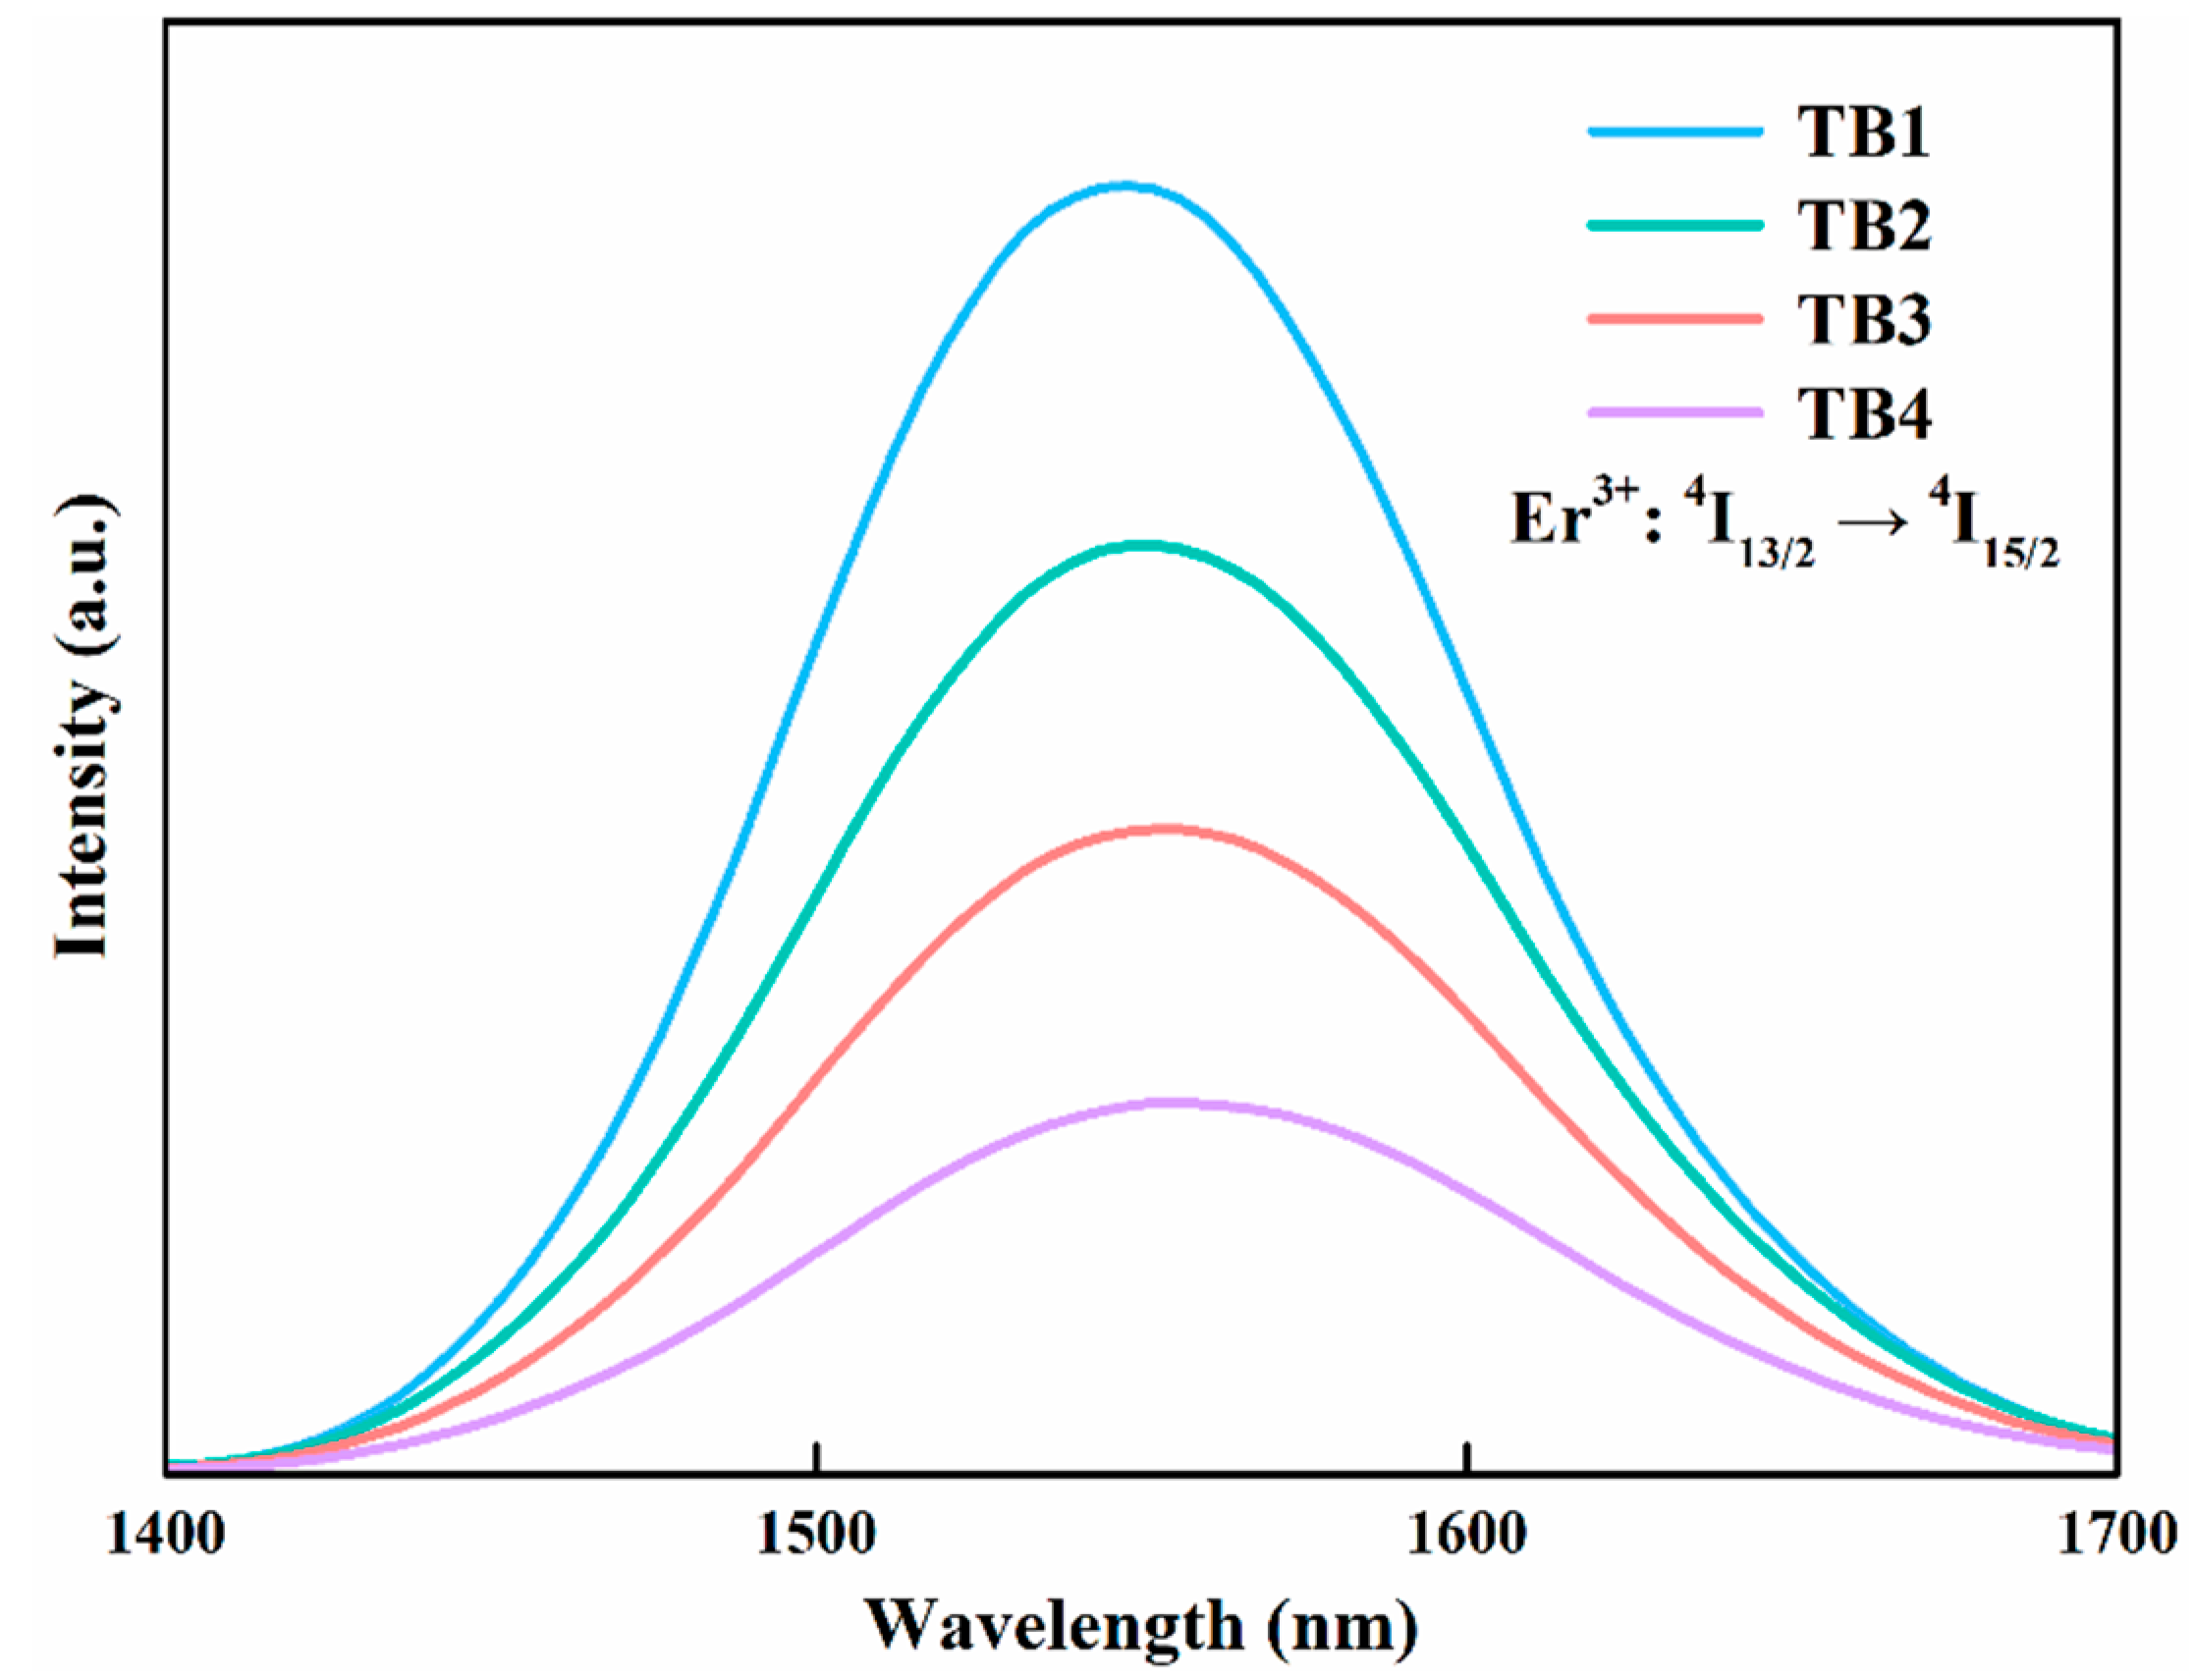
3.3. Mid-Infrared Luminescence Behavior and Lifetime

Figure 4 shows the mid-infrared fluorescence spectra of Er3+/Dy3+ co-doped TB1–4 glasses under the excitation of 980 nmLD. The fluorescence bandwidth of the Er3+/Dy3+ co-doped system is quite broad, extending from 2400 nm to 3700 nm, which is quite significant for the research development of a tunable laser light source at the 3 μm band. A strong emission peak with a central wavelength at 2.85 μm can be observed in Figure 4a; according to previous reports, it should originate from the radiation transition of Er3+: 4I11/24I13/2 (central wavelength located at 2.7 μm) and Dy3+: 6H13/26H15/2 (central wavelength located at 2.9 μm). The emission intensity at ~2.85 µm is highest when the doping concentration of Er2O3 is 4.5 mol%. Then further increasing its doping concentration, the fluorescence intensity at ~2.85 µm was found to decrease instead, which may be due to the shortening distance between ions and predominating resonance processes.
Thereafter, the full width at half maximum (FWHM) of mid-infrared spectra of TB1–TB4 glasses was calculated, as shown in Figure 4b. It found that the FWHM observed in TB3 glass (396.7 nm) is much larger than that reported in Er3+/Dy3+ co-doped fluoroaluminate glass (270 nm) [30] and tellurite glass (209 nm) [20]. Meanwhile, the fluorescence curve is smooth in the range of 2600–2800 nm, without the obvious emission peak at 2.7 μm which is supposed to be caused by the Er3+: 4I11/24I13/2 radiation transition. The relatively broad FWHM is attributed to the ‘vector summation’ of the energy level radiation transition by Er3+: 4I11/24I13/2 and Dy3+: 6H13/26H15/2.
To investigate the energy transfer process between Er3+ and Dy3+, the fluorescence spectra at the 1550 nm band were measured, as shown in Figure 5. The result shows that the luminescence of 1.55 μm is effectively inhibited by modifying the energy level population of sensitized Er3+ ions. With the increment of the Er2O3 concentration, the fluorescence intensity of the 3 μm band was enhanced and the bandwidth was broadened, indicating the existence of an effective energy transfer process between Er3+: 4I13/2 and Dy3+: 6H11/2 energy levels. Concurrently, a high concentration of Er2O3 doping can effectively prevent the self-terminating ’bottleneck’ effect in the 1.55 μm band [31,32].
Furthermore, the fluorescence decay lifetimes are the other experimental evidence for the energy transfer between Er3+ and Dy3+. Figure 6 shows the fluorescence decay lifetime curves of the glass samples TB1–4 monitored at 2850 nm. It can be seen that the fluorescence lifetimes of the glass samples gradually decreased from 5.56 ms to 0.89 ms with increasing Er3+ doping concentrations. The three processes, radiative decay, non-radiative decay by multi-phonon relaxation, and non-radiative transition decay by energy transfer, jointly determine the fluorescence decay lifetime. The increased probability of the non-radiative transition between Er3+/Dy3+ leads to a rapid decrease in the fluorescence lifetime, further confirming the energy transfer of Er3+ to Dy3+.

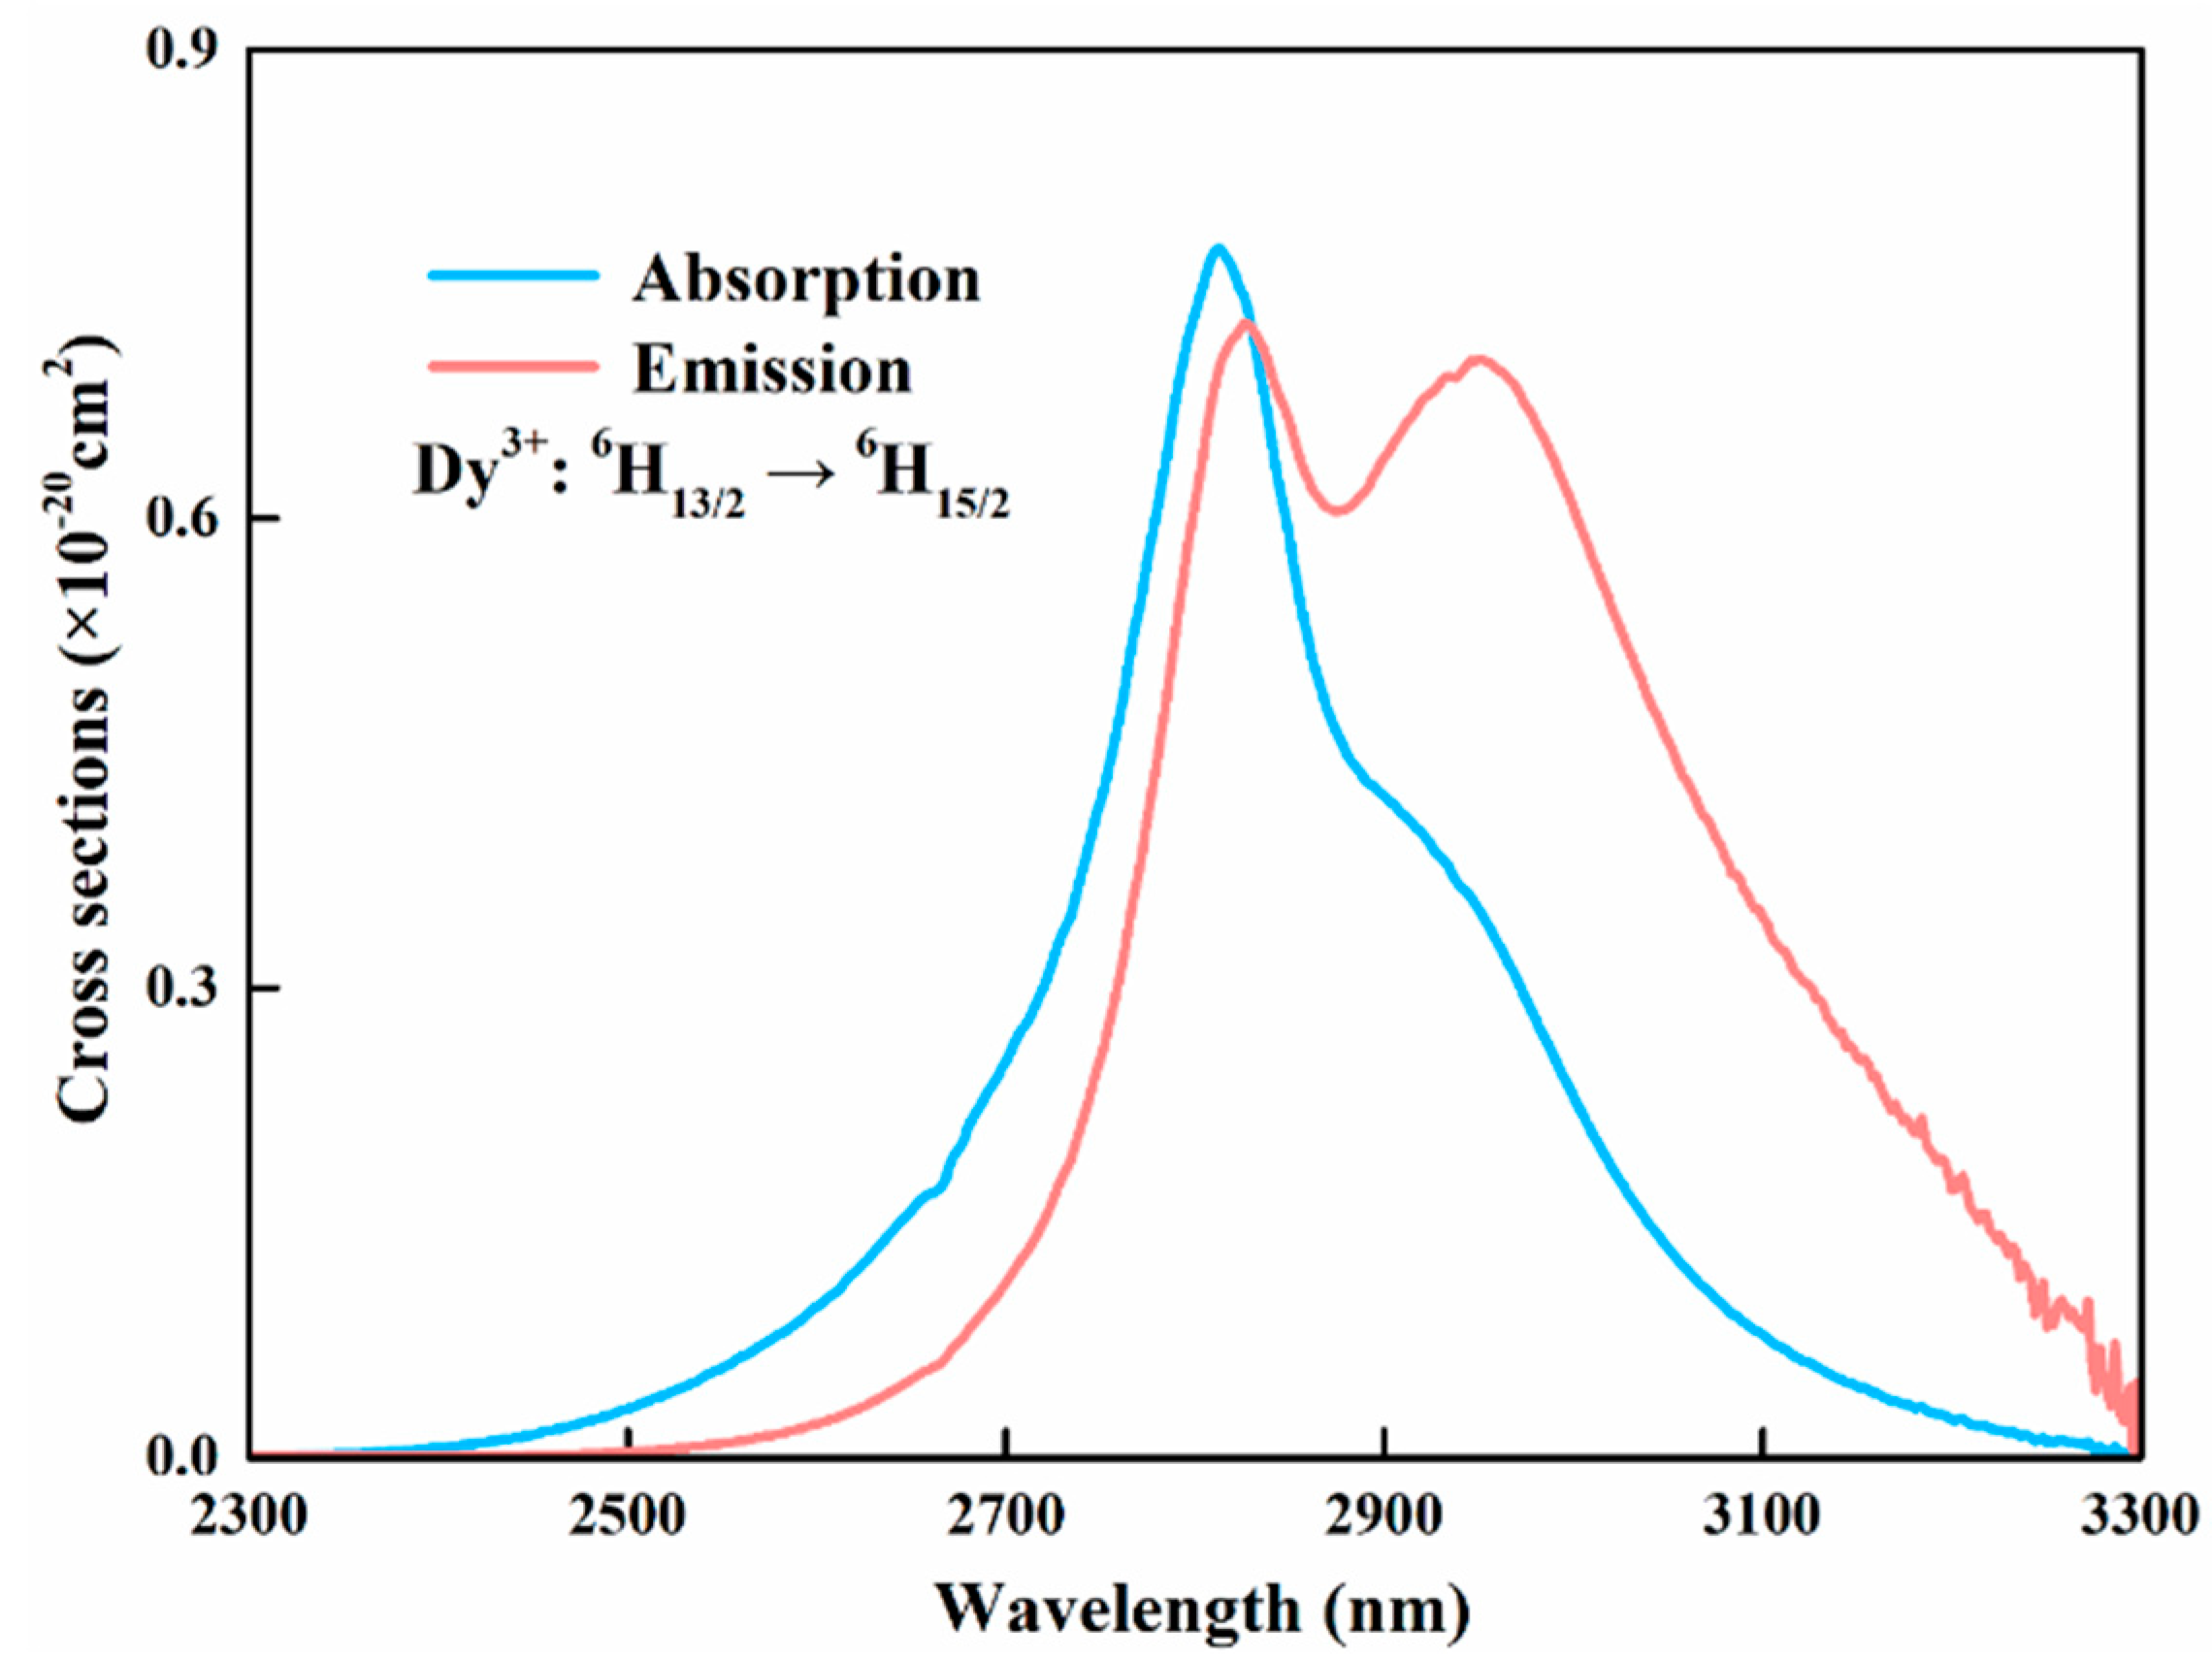
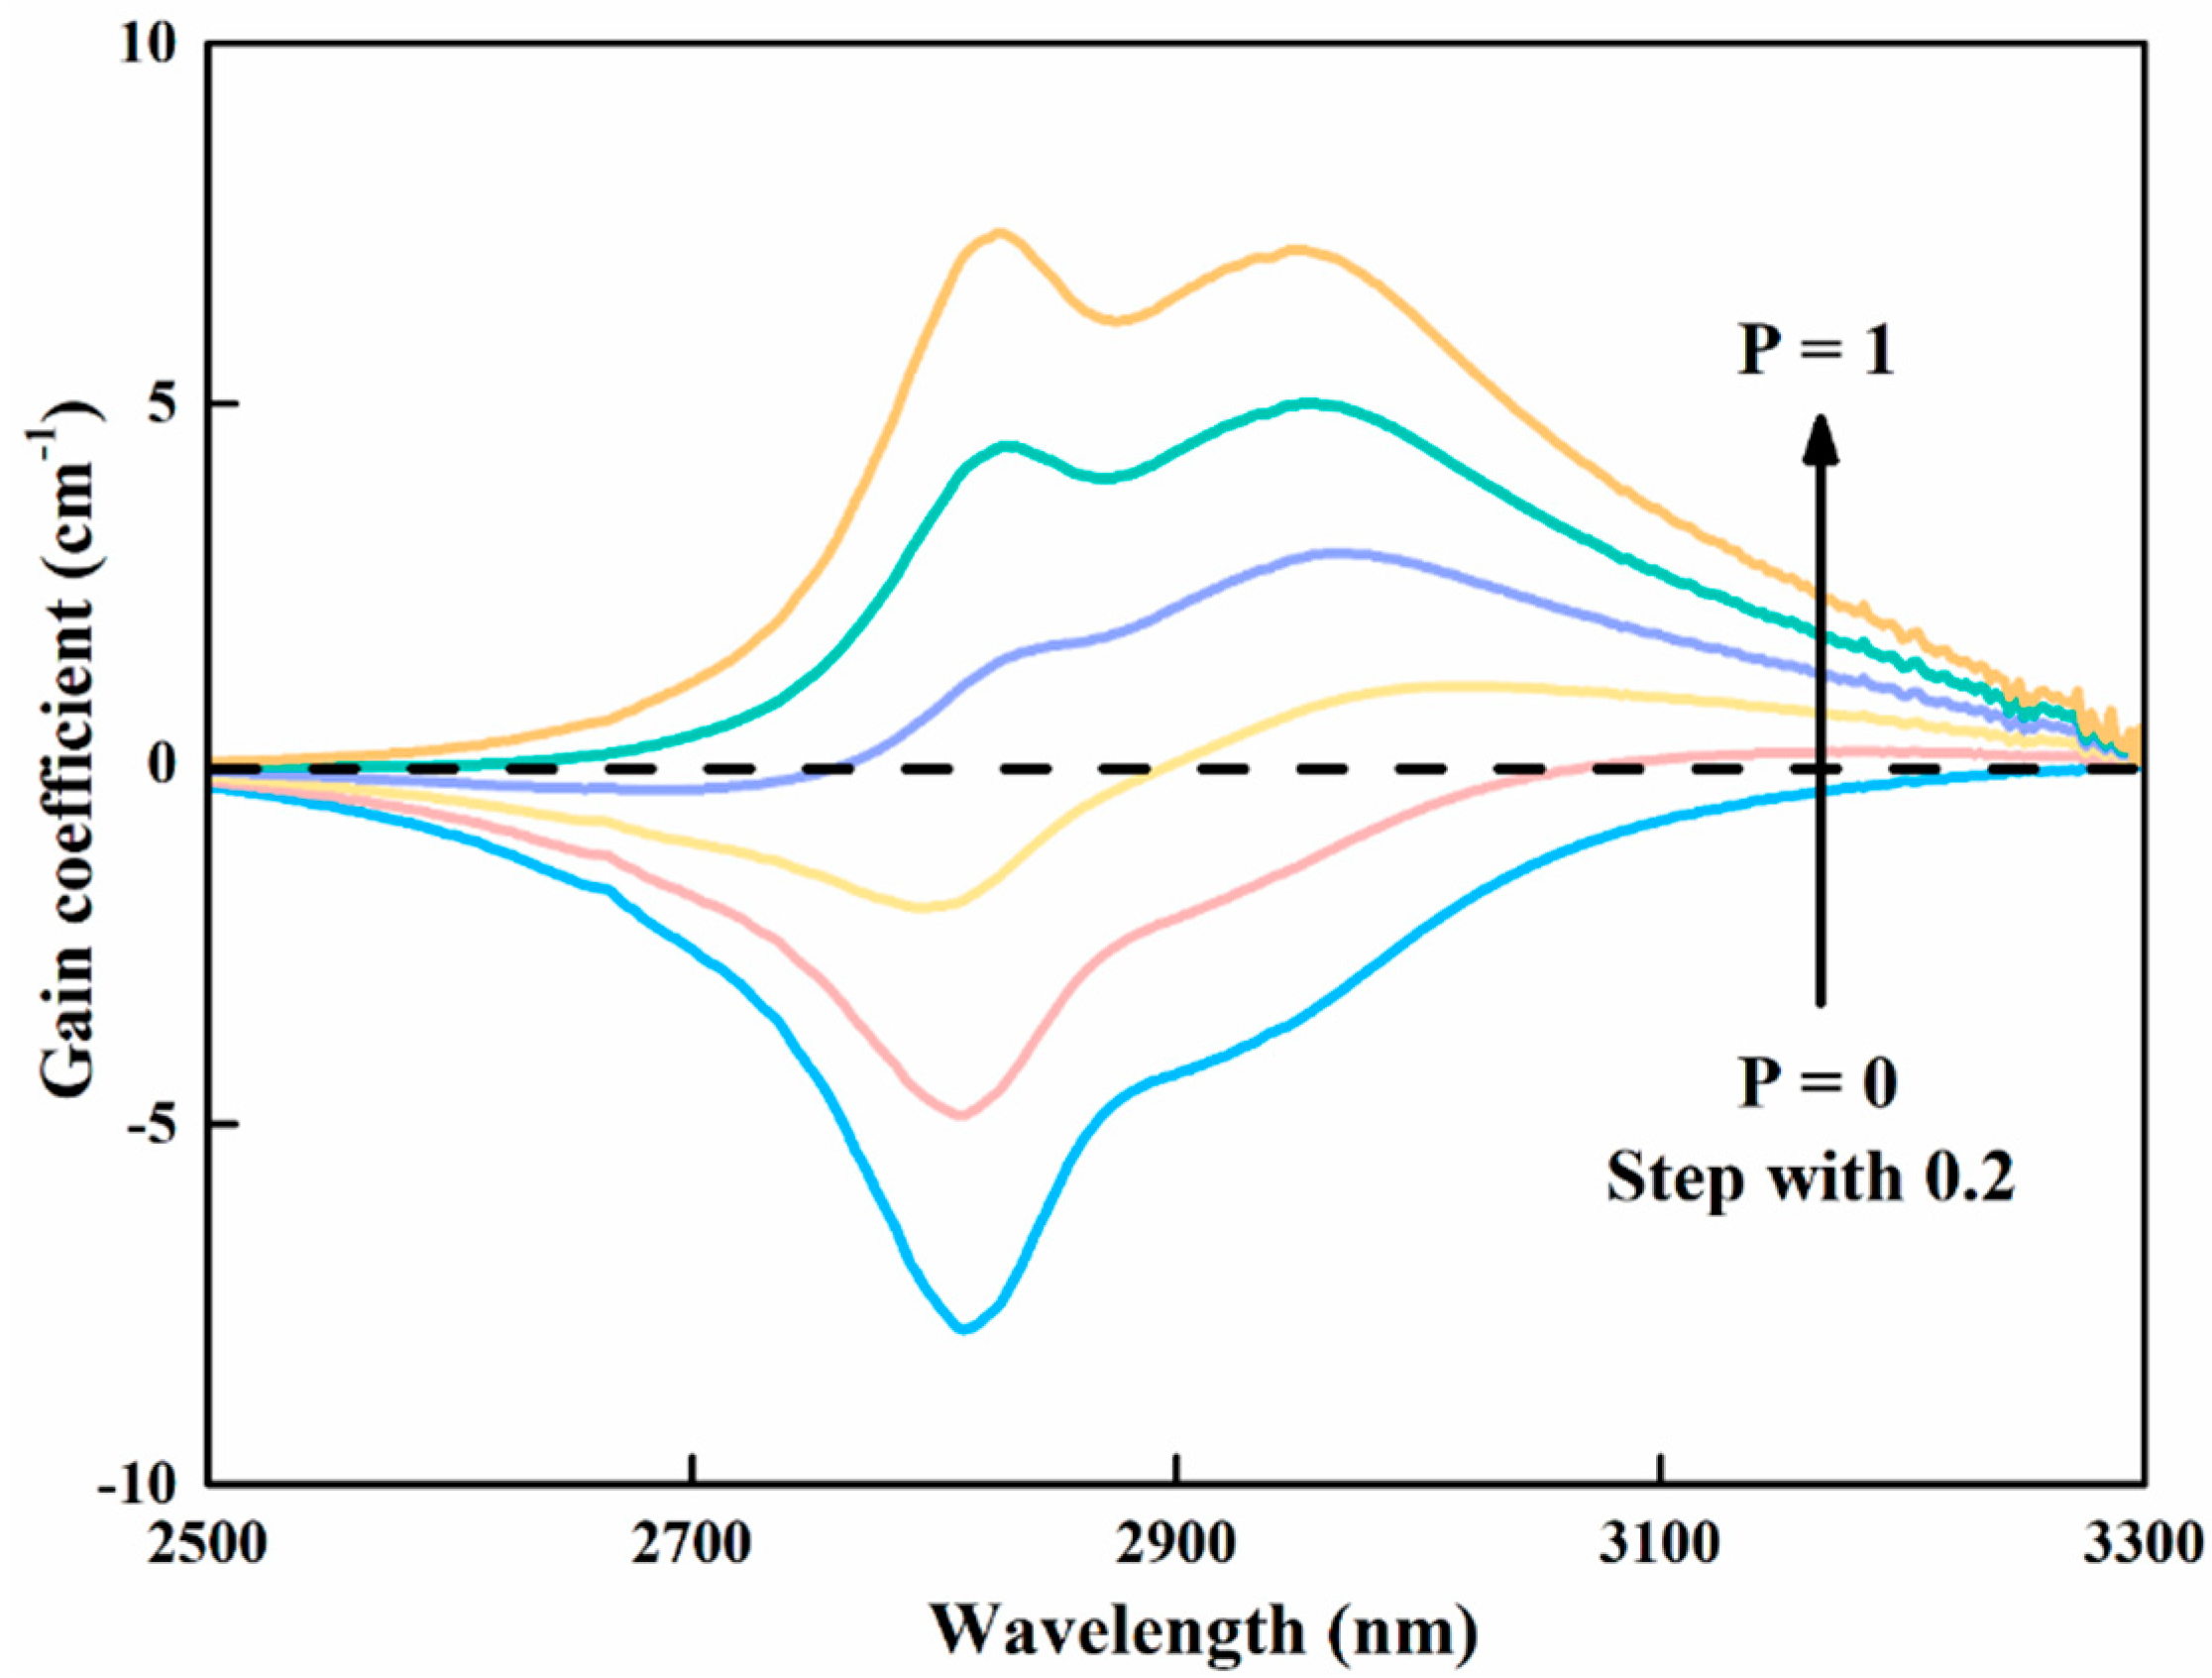
3.4. Optical Radiation and Gain Characteristic

To quantitatively analyze the energy transfer process between Er3+ and Dy3+, the absorption and emission cross-sections of Dy3+: 6H13/26H15/2 in TB3 glass are calculated, shown in Figure 7. The absorption cross-section (σabs) is estimated by [16]:
σ a b s λ = 2.303 O D λ N d
where N is the Dy3+ concentration of TB3, OD(λ) represents the optical density derived from the absorption spectrum, and d is the thickness of TB3 glass. The emission cross-section (σemi) is approximated as [33]:
σ e m i λ = λ 4 A r a d 8 π c n 2 × λ I ( λ ) λ I ( λ ) d λ
where Arad is the radiative transition probability and I(λ) represents the emission intensity. The maximum σabs and σemi reach up to 7.73 × 10⁻²¹ cm2 at 2814 nm and 7.22 × 10⁻²¹ cm2 at 2826 nm, respectively. Note that the maximum σemi of TB3 glass is larger than Nd3+/Dy3+ co-doped fluoride glass (5.22 × 10⁻²¹ cm2) [11]. The relatively larger emission cross-section is beneficial to obtain laser output, which also means TB3 glass possesses great laser gain properties. The results indicate that TB3 glass is a potential gain material for application in mid-infrared band optical fiber devices.
The gain coefficient is an essential index to measure the gain property of laser material. If the 6H15/2 and 6H13/2 energy levels are only considered, the gain coefficient of TB3 is estimated by the calculated absorption and emission cross-sections of Dy3+ [34]:
G λ = N [ P σ e λ ( 1 P ) σ a ( λ )
where, N and P are Dy3+ doping concentration and population of inversion, respectively. Figure 8 gives the gain coefficient of the Dy3+: 6H13/26H15/2 transition in TB3 glass with different wavelengths in steps of 0.2. It can be noticed that the gain coefficient gradually increases with increasing p-value and the maximum gain coefficient of TB3 is 7.37 cm−1 (at 2826 nm), and the positive gain in the 3 μm band occurs when the p-value is greater than 0.2, which reveals that the TB3 laser material can obtain a 2.85 μm laser under a low pumping threshold.

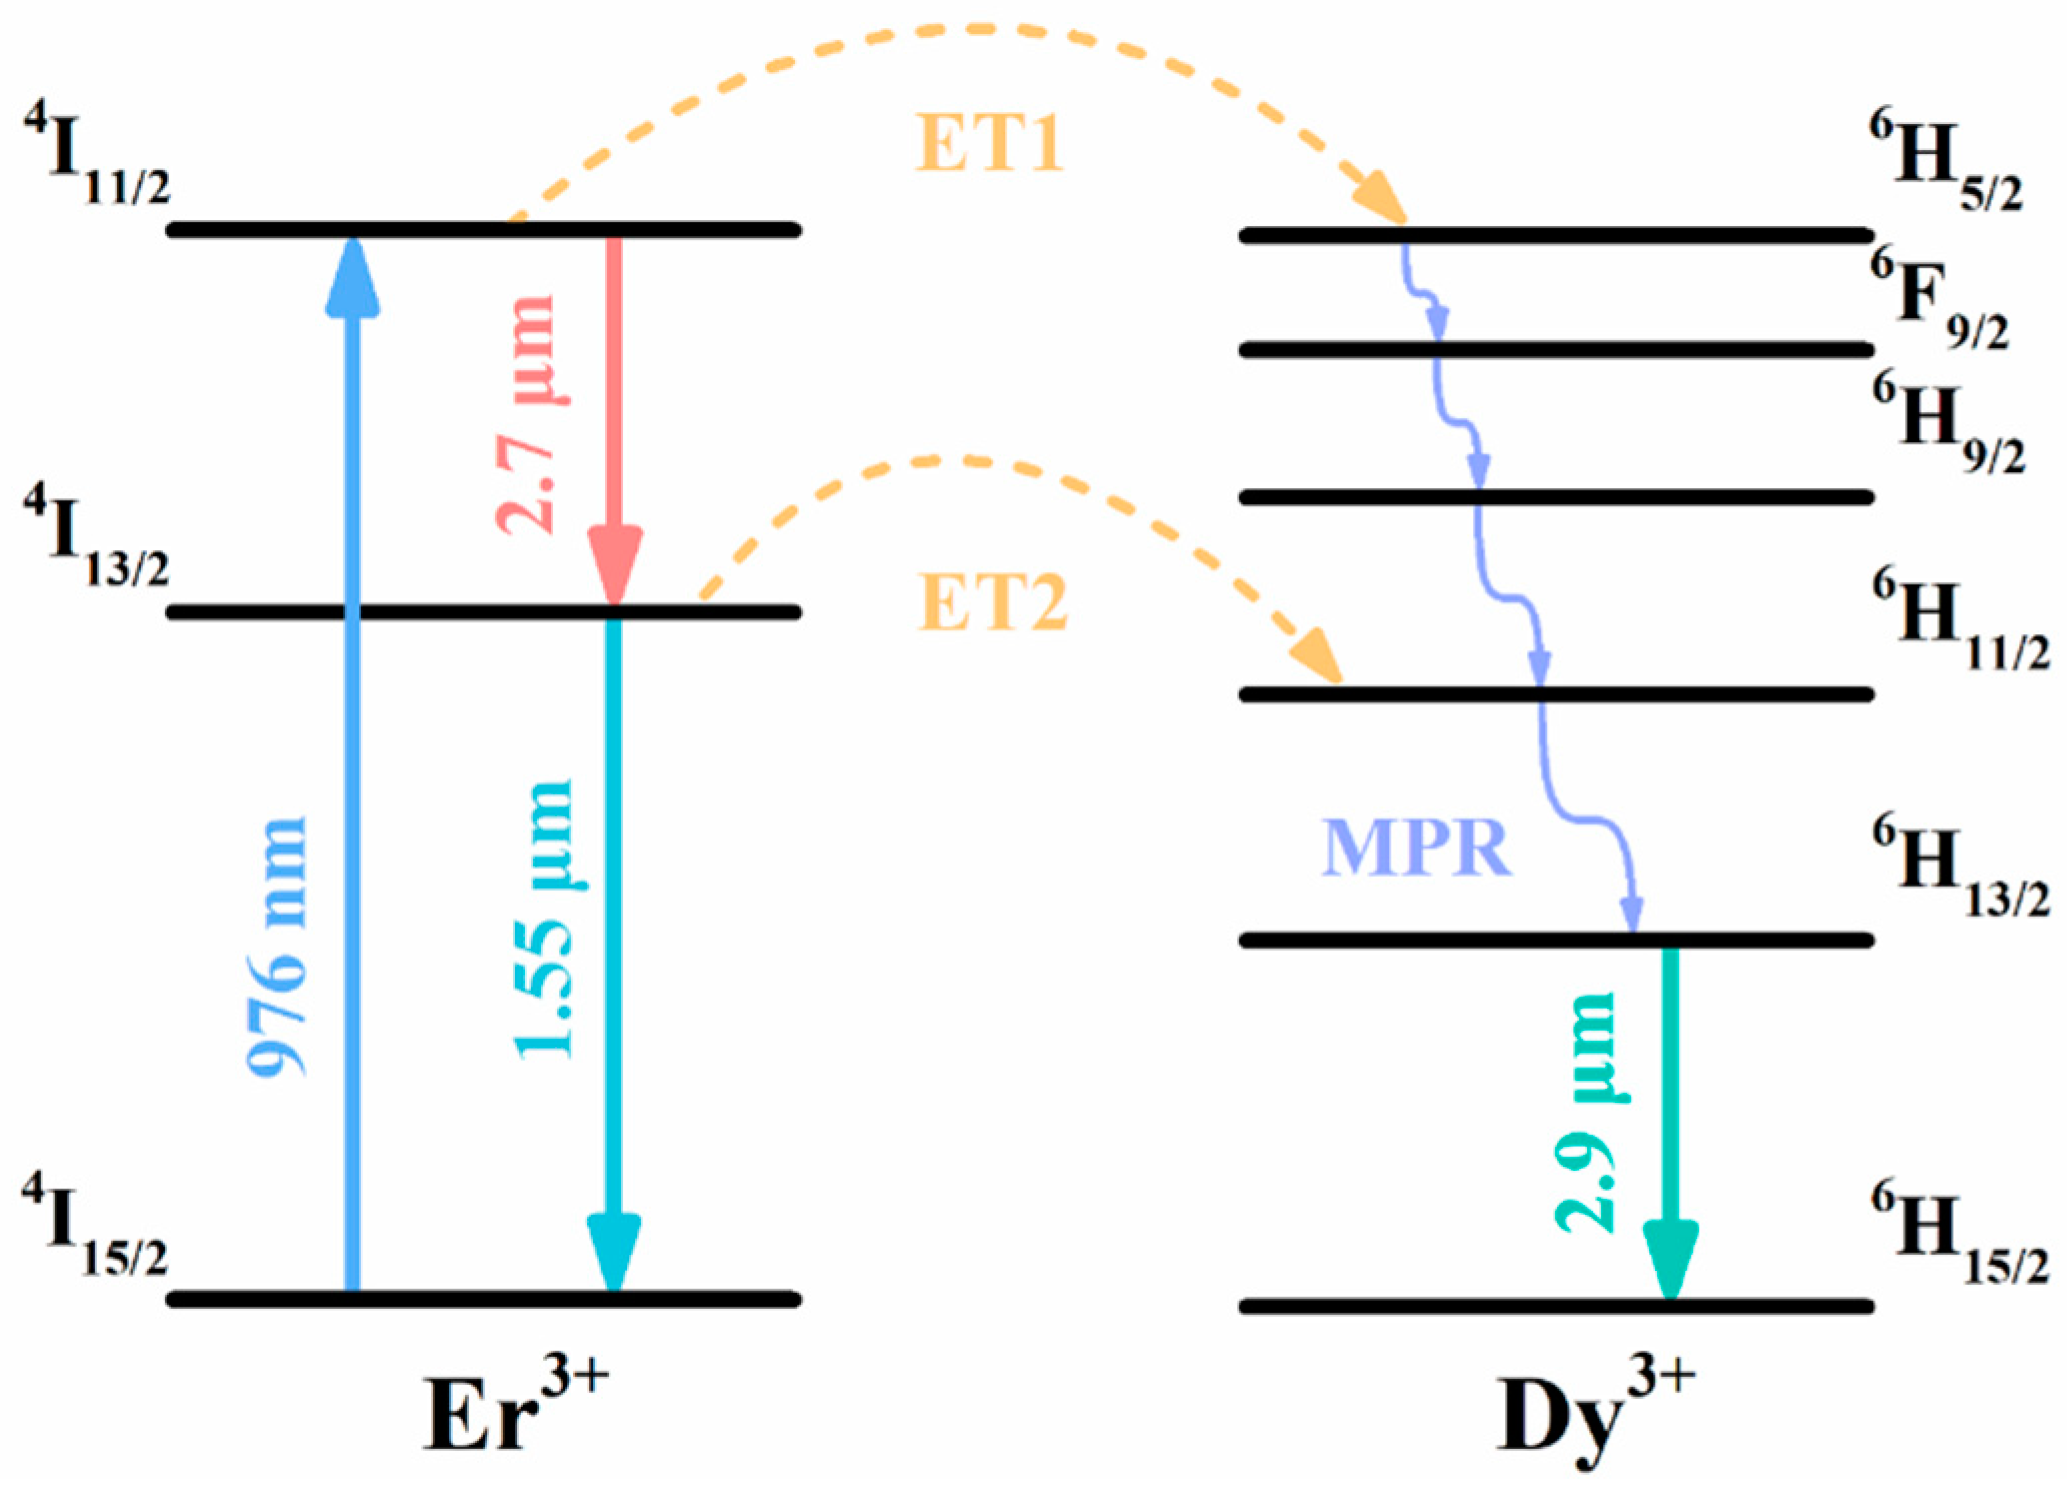
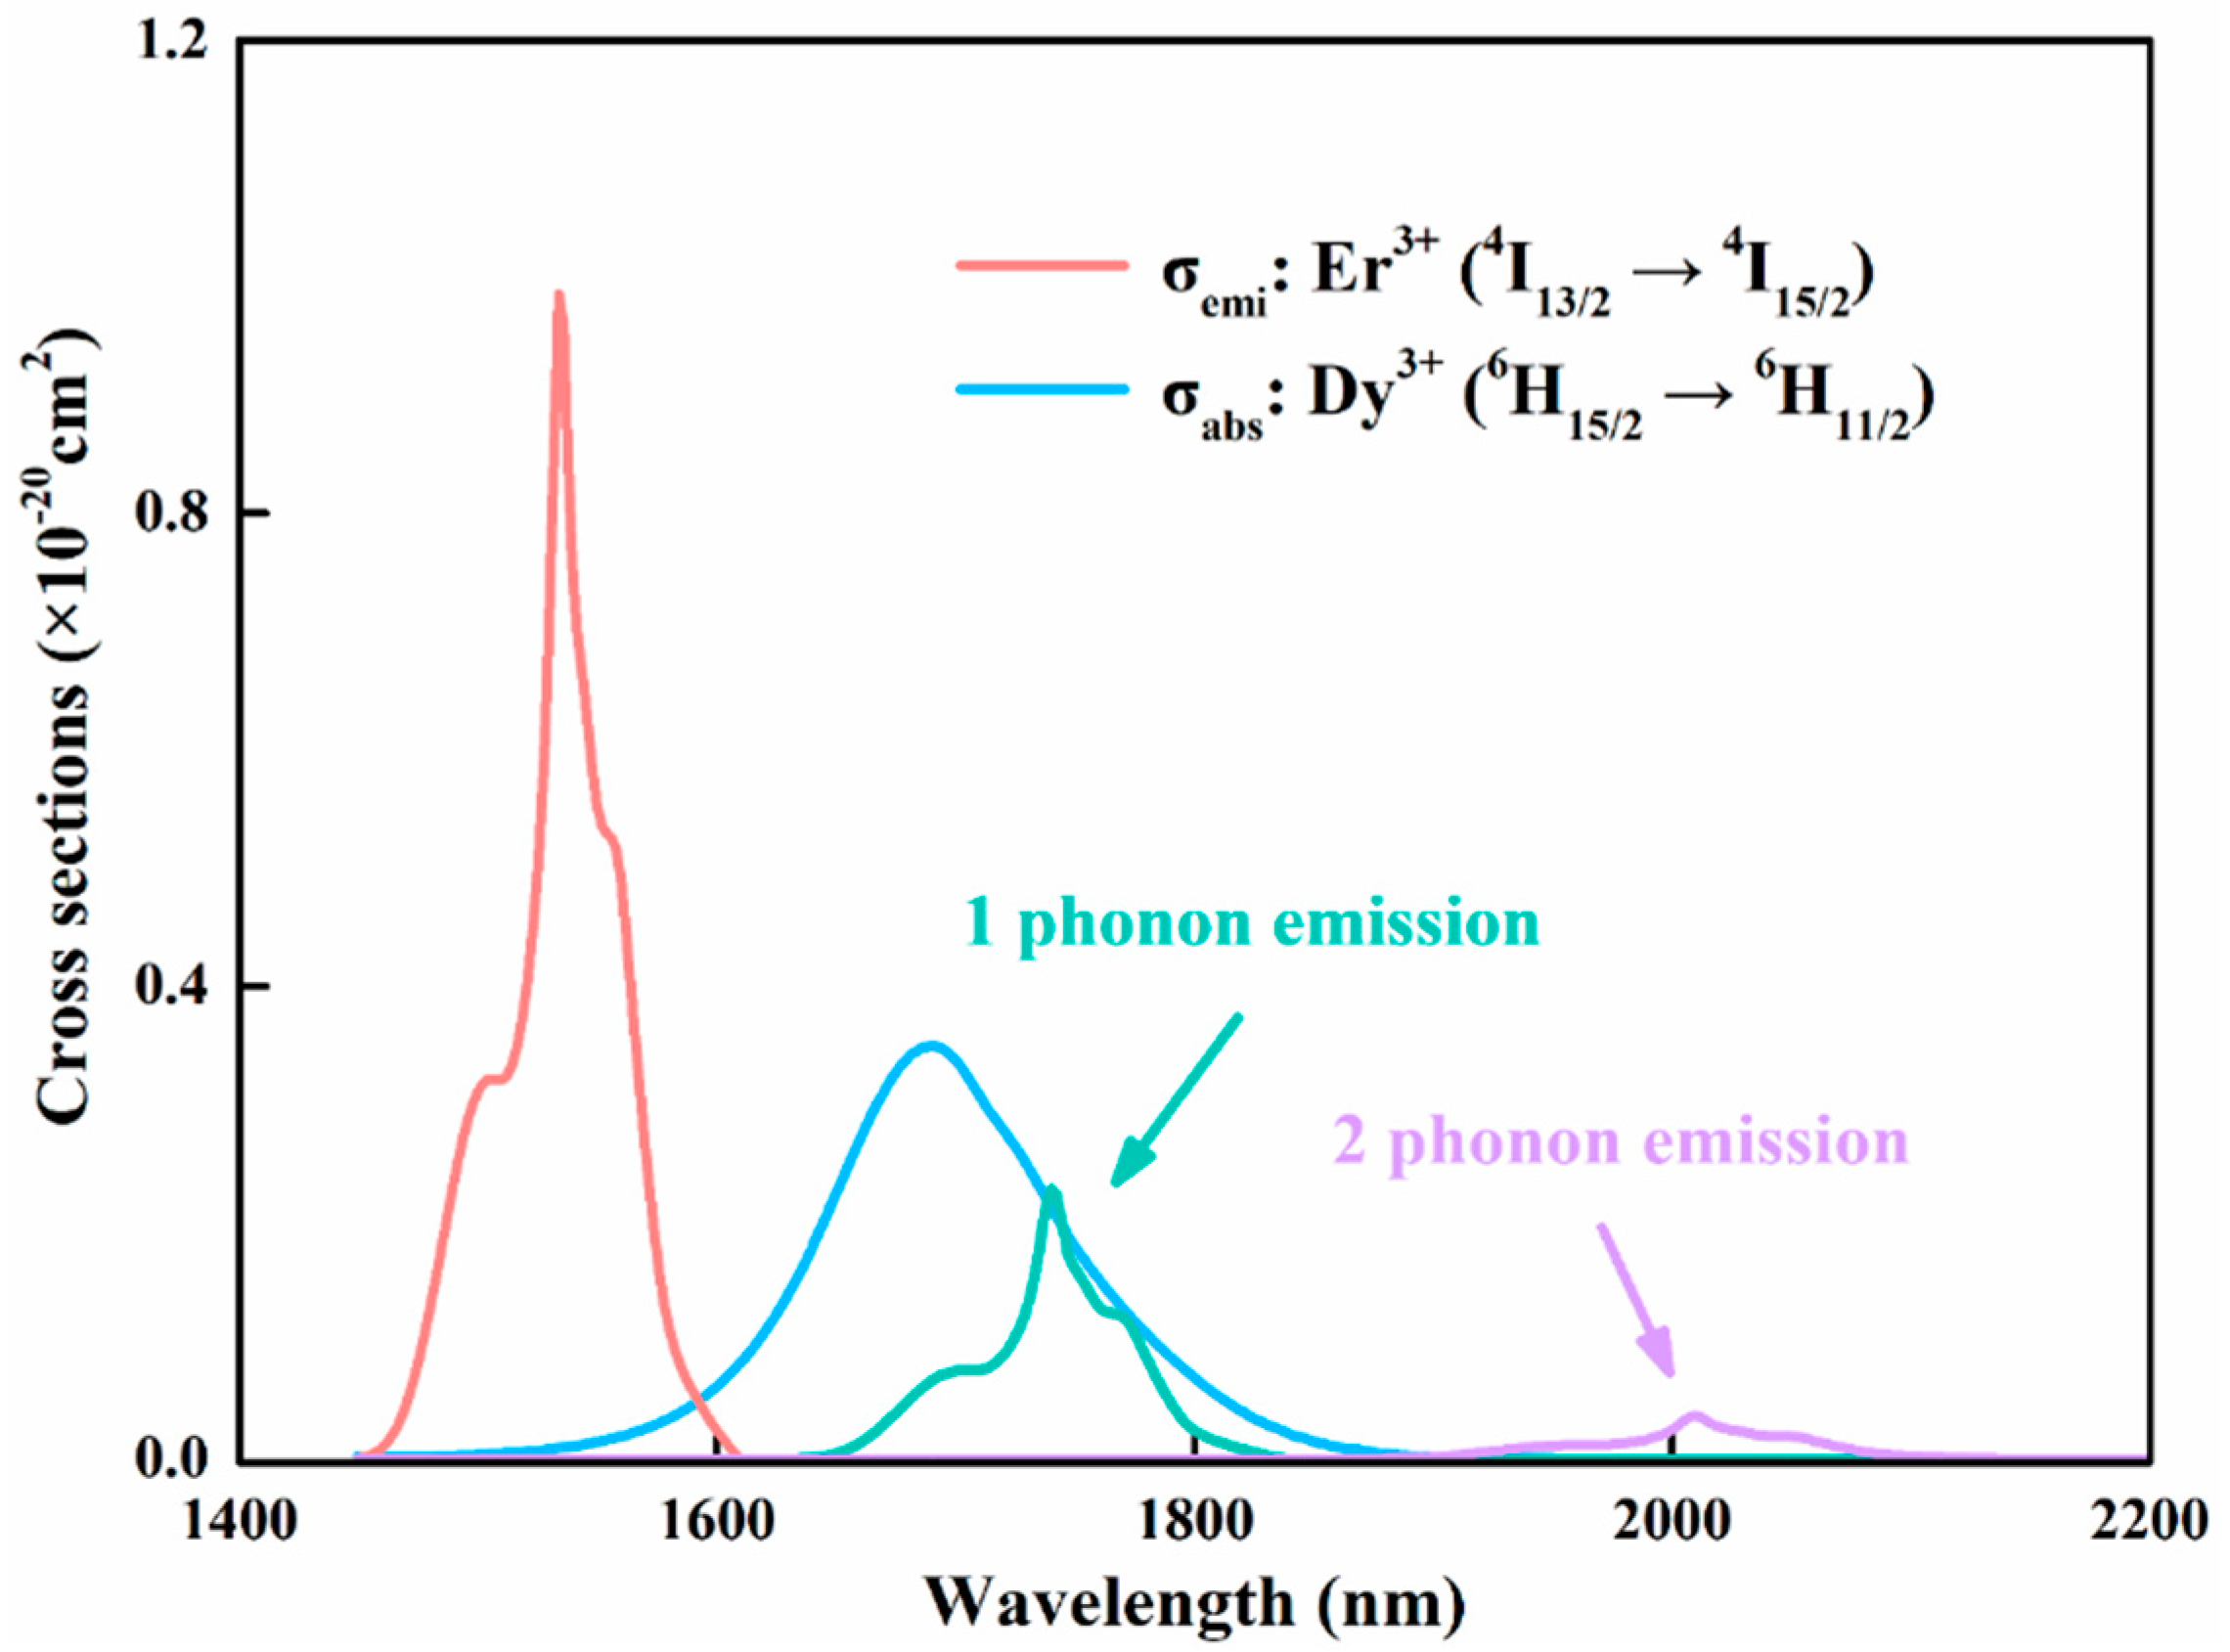
3.5. Energy Transfer Mechanism

Figure 9 displays the simplified energy level diagram of Er3+/Dy3+. Under 980 nm LD excitation, Er3+ in 4I15/2 level are excited to 4I11/2 level by ground state absorption (GSA). Since the energy gap between the Er3+: 4I11/2 energy level and the Dy3+: 6H5/2 energy level is quite small, energy transfer can be performed through phonon assistance (ET1). Subsequently, some ions on the Er3+: 4I11/2 energy level decay to the lower energy level 4I13/2 via radiation transition, producing 2.7 μm emission. A part of the ion on the Er3+: 4I13/2 energy level transfers its energy to the adjacent Dy3+: 6H11/2 energy level by the ET2 process, and the residual ions radiate to the ground state to achieve 1.55 μm emission. The ions on the Dy3+: 6H11/2 energy level reach the lower 6H13/2 energy level through multi-phonon relaxation (MPR). Once the 6H13/2 energy level is populated, the ions on it will radiate to the 6H15/2 ground state, resulting in 2.9 μm emission. The energy transfer process between Er3+ and Dy3+ can be summarized as:
Er3+: 4I15/24I11/2 (GSA) Er3+: 4I11/2→Dy3+: 6H5/2(ET1)
Er3+: 4I11/24I13/2 (2.7 μm) Er3+: 4I13/2→Dy3+: 6H11/2(ET2)
Er3+: 4I13/24I15/2 (1.55 μm) Dy3+: 6H13/26H15/2 (2.9 μm)
To clarify the mechanism of ~3 μm emission, it is essential to quantitatively analyze the transfer process from Er3+: 4I13/2 to Dy3+: 6H11/2. The microscopic parameters of energy transfer in the ET2 process in TB3 glass are quantitatively investigated by the phonon sideband theory.
The microscopic energy transfer probability between donor (D) and acceptor (A) ions can be described as:
W D A = 2 π H D A 2 S D A N
where H D A denotes the matrix element of the perturbation Hamilton between initial and final states, S D A N denotes the overlap integral between the m-phonon emission sideband of the donor and the k-phonon absorption sideband of the acceptor, and N denotes the total phonons involved in the energy transfer process. The m-phonon emission sideband σ e m i D m p h o n o n s and k-phonon absorption sideband σ a b s A k p h o n o n s can be determined by [3]:
σ e m i D m p h o n o n s = σ e m i D ( λ m + ) S 0 m e s 0 m ! n ¯ + 1 m σ e m i e x p t D ( E m ω 0 )
σ a b s A k p h o n o n s = σ a b s D ( λ k ) S 0 k e s 0 k ! n ¯ k σ a b s e x p t A ( E + k ω 0 )
where λ m + = 1 / ( 1 λ m ω 0 ) and λ k = 1 / ( 1 λ + k ω 0 ) denote the wavelength of m-phonon emission and k-phonon absorption sideband, n ¯ = 1 / ( e ω 0 K T 1 ) represents the average occupancy of the phonon mode at temperature T, S0 is the Huang-Rhys factor (0.31 in the current work [35]), and ω 0 denotes the maximum phonon energy of the host glass (770 cm−1).
Moreover, if only the m-phonon emission process is considered (N= m, k = 0) and the k-phonon absorption process is ignored, the energy transfer coefficient between Er3+ and Dy3+ can be expressed as [36]:
C D A = 6 c g l o w D 2 π 4 n 2 g u p D 0 e 2 n ¯ + 1 S 0 S 0 m m ! ( n ¯ + 1 ) m σ e m i D ( λ m + ) σ a b s A ( λ ) d λ
The absorption and emission cross-sections and multi-phonon emission sideband of the donor (Er3+) and acceptor (Dy3+) in ET2 under the N-phonon-assisted emission sideband (N = 1, 2) of the Er3+/Dy3+ co-doped system is shown in Figure 10. It is found that the energy transfer coefficient C D A in the ET2 process is 2.70 × 10−40 cm6/s, in which the contribution ratio of one-phonon assistance is 63.09%. Synchronously, the resonance energy transfer accounts for 36.91%, identifying the existence of an effective energy transfer process between Er3+ and Dy3+.

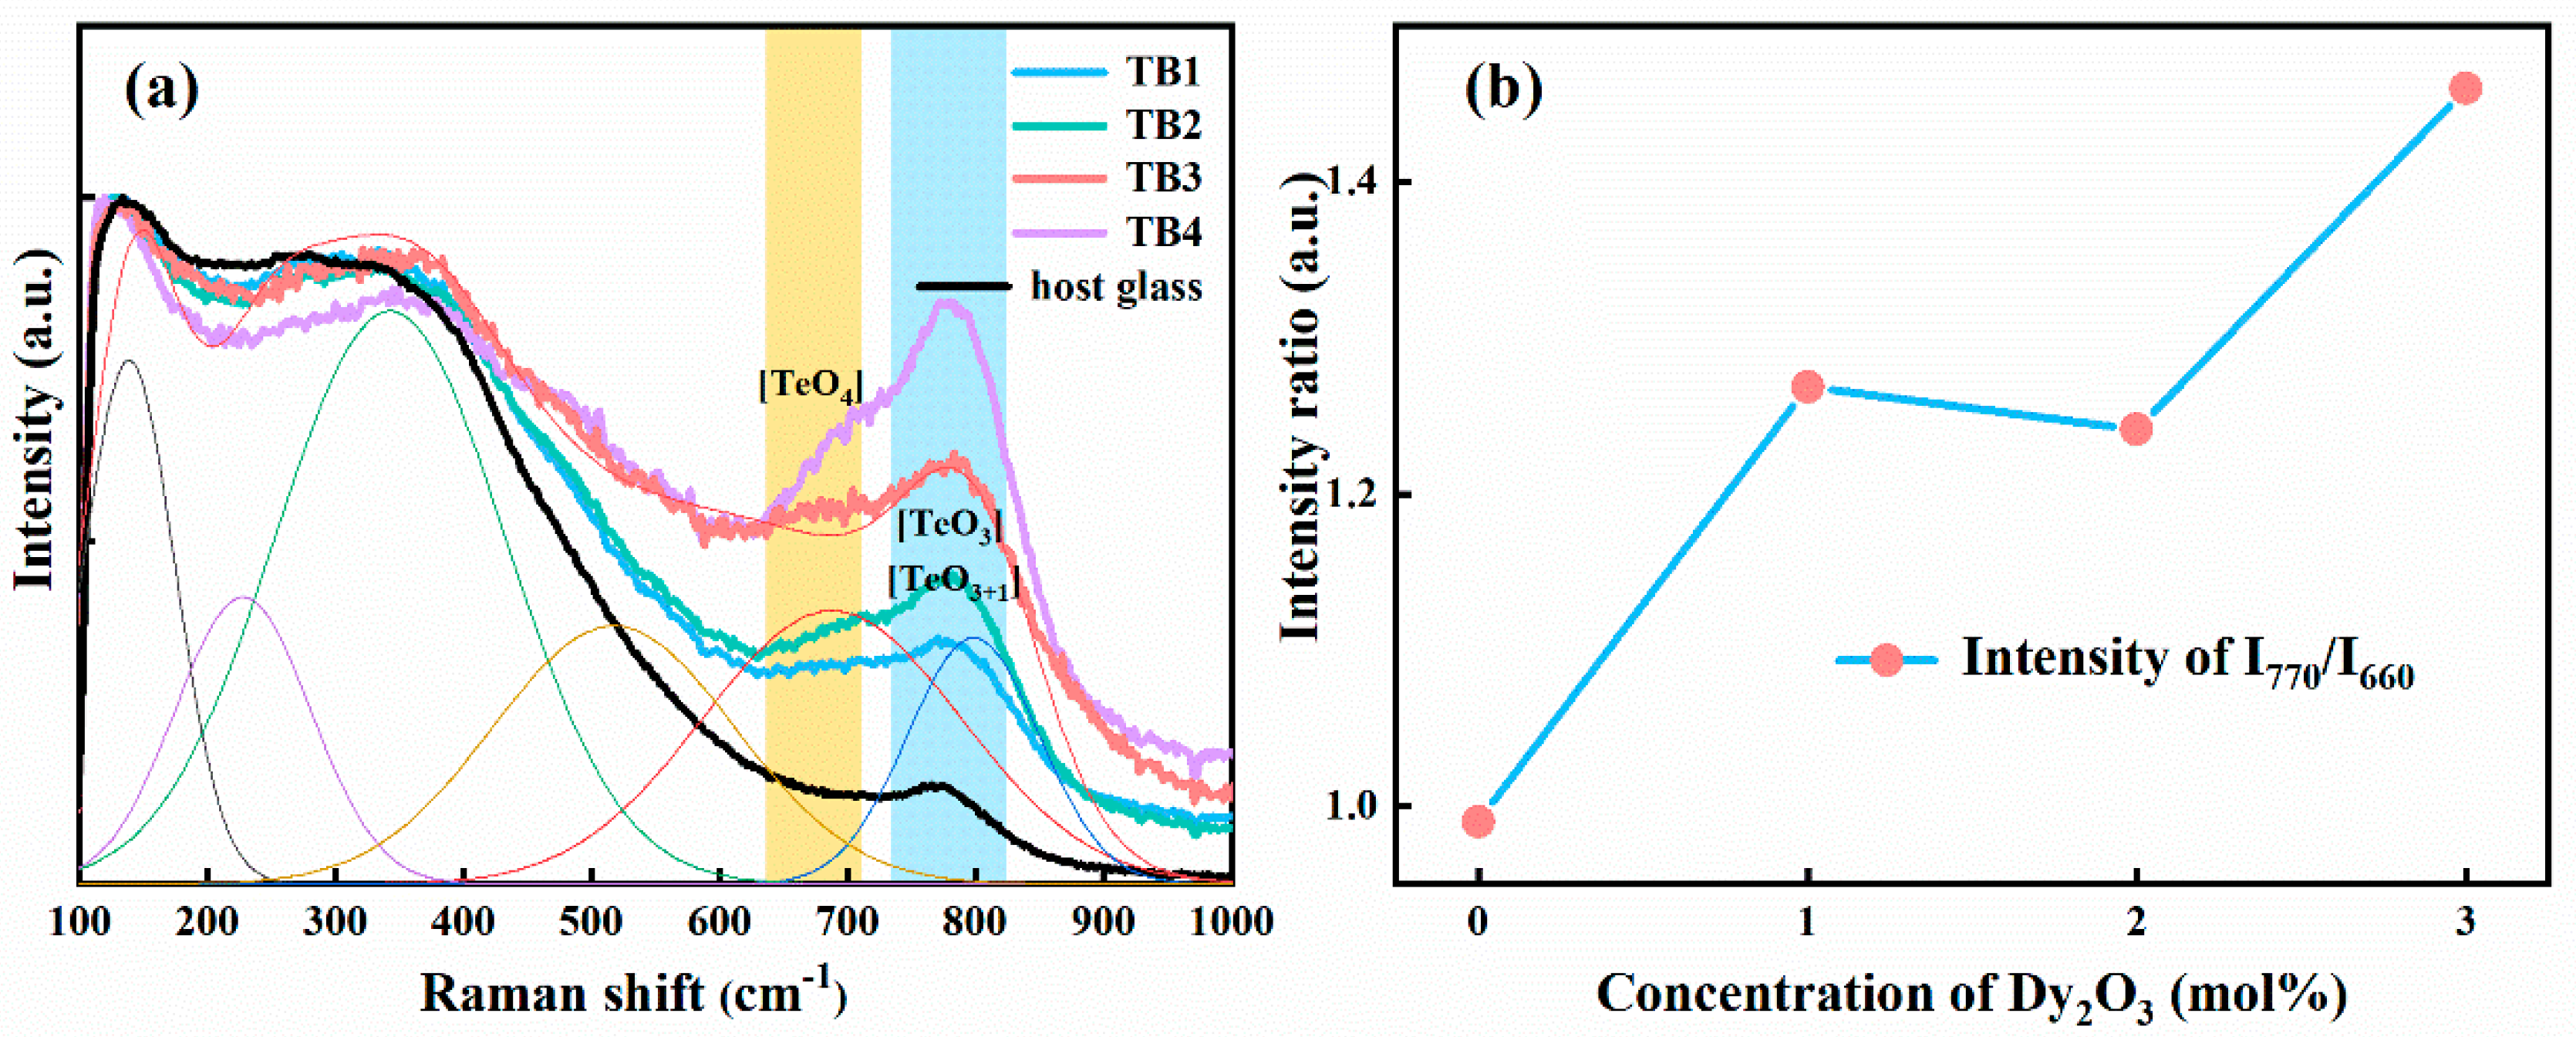
3.6. Structure Behavior Properties

The Raman spectra of TB1–4 glasses are measured and analyzed to clarify the vibratory structural units. Figure 11 displays the Raman spectra of TB1–4 glasses in the range of 100–1000 cm−1. The Raman feature near 660 cm−1 is assigned to the asymmetric stretching vibration of the Te-O-Te bond in [TeO4] trigonal bipyramid. The 770 cm−1 high-frequency band corresponds to the symmetric stretching vibration of Te=O and Te-O in [TeO3] and [TeO3+1] triangular units [21]. Note that, compared with fluorotellurite glass without Er2O3, the peaks between 600 and 800 cm−1 are varied. The intensity ratio of I770/I660 is clearly enhanced, and the Gaussian peak located at 276 cm−1 red-shifts to 366 cm−1. This phenomenon may be attributed to the increase in Er2O3 concentration, causing [TeO4] units to transform into [TeO3] units, urging the interruption and recombination of Te-O-Te linkage to reduce the bridging oxygen content in the system, changing the topology cage structure around the luminescence center of rare earth ions, enhancing the stability of the optically active center, and finally contributing to the enhancement of luminescence. Compared with traditional oxide glasses such as silicate glass (1080 cm−1) [37] and bismuth germanate glass (820 cm−1) [38], the TB1–4 glasses possess a relatively low maximum phonon energy (770 cm−1). As mentioned above, the fluorotellurite glass designed is promising to be a gain material for mid-infrared laser.

4. Conclusions

Er3+/Dy3+ co-doped fluorotellurite glasses were prepared using the melt-quenching method. The hydroxyl group absorption coefficient was reduced to 0.02 cm−1 by physical and chemical methods. The fluorescence spectra of TB1–4 glasses under 980 nm LD pumps were investigated, and the results showed that the coverage extended from 2400 nm to 3700 nm. Meanwhile, the FWHM in TB3 almost reached up to 400 nm and this rather broad tunable emission band was attributed to spectral overlap between the 2.7 μm fluorescence of the Er3+: 4I11/24I13/2 and the 2.9 μm fluorescence of the Dy3+: 6H13/26H15/2 energy level transition. However, the fluorescence peak at 2.7 μm was not observed clearly, due to the effective energy transfer process between Er3+ and Dy3+. Concurrently, a high concentration of Er2O3 doping could effectively prevent the self-terminating ’bottleneck’ effect in the 1.55 μm band, leading to the broadening of the emission band whose center peak value was located at 2.85 μm. The Raman spectra indicated that the maximum phonon energy of the prepared glass was only 770 cm−1; the relatively low phonon energy is beneficial to obtain 2.85 μm band luminescence. On account of the fairly high doping concentration of Er2O3, [TeO4] units evolved to [TeO3] units, urging the fracture and recombination of the Te-O-Te bond to reduce the bridging oxygen content in the system, changing the topology cage structure around the luminescence center of rare earth ions, enhancing the stability of the optically active center, and finally contributing to the enhancement of luminescence. Moreover, the gain property of 2.85 μm emission peak was analyzed, and the maximum σemi and gain coefficient reached up to 7.22 × 10⁻²¹ cm2 and 7.3665 cm−1, respectively, indicating that high concentration Er3+/Dy3+ co-doped fluorotellurite glass is a gain material which is able to obtain a tunable broadband 2.85 μm mid-infrared fiber laser with low pumping threshold conditions.

Author Contributions

Conceptualization, J.C.; Writing—original draft preparation, Y.B.; writing—review and editing, Y.B., Y.C. and D.Z.; visualization, Y.B. and Y.W.; funding acquisition, D.Z. All authors have read and agreed to the published version of the manuscript.

Funding

Jilin Scientific and Technological Development Program (No. 20210203046SF).

Institutional Review Board Statement

Not applicable.

Informed Consent Statement

Not applicable.

Data Availability Statement

Data are contained within the article.

Conflicts of Interest

The authors declare no conflict of interest.

References

  1. Song, C.; Zhou, D.; Xu, P.; Cong, Y.; Wu, Y.; Bai, Y.; Cao, J.; Han, K. Enhanced 3 μm luminescence in Ho3+/Yb3+ co-doped bismuth-tellurite glass by controlled structure network topology. J. Non-Cryst. Solids 2022, 597, 121919. [Google Scholar] [CrossRef]
  2. Song, X.; Han, K.; Zhou, D.; Xu, P.; Xue, X.; Zhang, P. 2 μm emission properties and energy transfer processes in Tm3+ doped Bi2O3-GeO2-Na2O glass laser material. J. Lumin. 2020, 224, 117314. [Google Scholar] [CrossRef]
  3. Song, X.; Zhou, D.; Xu, P.; Han, K.; Song, C. ∼2 μm fluorescence and energy transfer characteristics in a highly Tm3+-doped bismuthate glass based on Al2O3 adjustment. Opt. Mater. Express 2021, 11, 3755–3767. [Google Scholar] [CrossRef]
  4. Zhang, C.; Han, K.; Wu, T.; Qiang, S.; Wu, Q.; Yu, M.; Li, Q.; Wang, Y. TeO2-GeO2-BaF2-Tm2O3 glass for ∼2 μm laser materials: Analysis of luminescence features and energy transfer behavior. Ceram. Int. 2022, 48, 30546–30554. [Google Scholar] [CrossRef]
  5. Zhang, C.; Han, K.; Zhou, D.; Song, C.; Xu, P.; Wu, T.; Huang, C.; Qiang, S.; Wu, Q. High concentration Tm3+ doped TeO2-Al2O3-BaF2 glass for ~2 m fiber lasers. J. Alloys Compd. 2022, 901, 163592. [Google Scholar] [CrossRef]
  6. Song, C.; Xu, P.; Zhou, D.; Mo, H.; Qi, K.; Zhong, X.; Wu, Y.; Cao, J.; Han, K. Structure, and luminescence properties in Tm3+/Yb3+ co-doped bismuth-tellurite glass for 2 μm fiber lasers. J. Non-Cryst. Solids 2022, 593, 121784. [Google Scholar] [CrossRef]
  7. Zhou, D.; Jin, D.; Lan, Z.; Bai, X. Preparation of Er3+/Yb3+ co-doped citrate microstructure fiber of large mode field and its 3.0 μm laser performance. J. Am. Ceram. Soc. 2019, 102, 1686–1693. [Google Scholar] [CrossRef]
  8. Zhang, C.; Zhang, C.; Yun, C.; Lai, S. Intense broadband 3.1 μm emission in Er3+-doped fluoroaluminate-tellurite glass for mid-infrared laser application. Ceram. Int. 2022, 48, 29977–29981. [Google Scholar] [CrossRef]
  9. Yun, C.; Li, Z.; Ping, Y.; Miao, X.; Zhang, C. Up-conversion and 2 μm mid-infrared emission effective enhancements in Ho3+/Yb3+ co-doped tellurite glass. Optik 2021, 242, 167262. [Google Scholar] [CrossRef]
  10. Devaraja, C.; Gowda, G.J.; Eraiah, B.; Keshavamurthy, K. Optical properties of bismuth tellurite glasses doped with holmium oxide. Ceram. Int. 2021, 47, 7602–7607. [Google Scholar] [CrossRef]
  11. Qi, F.; Huang, F.; Zhou, L.; Tian, Y.; Lei, R.; Ren, G.; Zhang, J.; Zhang, L.; Xu, S. Low-hydroxy Dy3+/Nd3+ co-doped fluoride glass for broadband 2.9 µm luminescence properties. J. Lumin. 2017, 190, 392–396. [Google Scholar] [CrossRef]
  12. Wang, W.; Mao, L.; Liu, J.; Xu, S. Glass-forming regions and enhanced 2.7 μm emission by Er3+ heavily doping in TeO2–Ga2O3–R2O (or MO) glasses. J. Am. Ceram. Soc. 2020, 103, 4999–5012. [Google Scholar] [CrossRef]
  13. Ye, Y.; Xiao, Y.; Ji, Y.; Wang, W. Enhanced structural and spectroscopic properties of Er3+-doped TeO2-Ta2O5-ZnO glasses for 2.7 μm fiber lasers. J. Non-Cryst. Solids 2022, 593, 121788. [Google Scholar] [CrossRef]
  14. Hwa, L.; Chang, Y.; Chao, W. Infrared spectra of lanthanum gallogermanate glasses. Mater. Chem. Phys. 2004, 85, 158–162. [Google Scholar] [CrossRef]
  15. Hou, G.; Zhang, C.; Fu, W.; Li, G.; Xia, J.; Ping, Y. Broadband mid-infrared 2.0 μm and 4.1 μm emission in Ho3+/Yb3+ co-doped tellurite-germanate glasses. J. Lumin. 2019, 217, 116769. [Google Scholar] [CrossRef]
  16. Zhang, Y.; Xia, L.; Li, C.; Ding, J.; Li, J.; Zhou, Y. Enhanced 2.7 μm mid-infrared emission in Er3+/Ho3+ co-doped tellurite glass. Opt. Laser Technol. 2021, 138, 106913. [Google Scholar] [CrossRef]
  17. Zhang, Y.; Xia, L.; Li, C.; Ding, J.; Li, J.; Zhou, Y. Dy3+/Er3+/Tm3+ tri-doped tellurite glass with enhanced broadband mid-infrared emission. Opt. Laser Technol. 2022, 149, 107904. [Google Scholar] [CrossRef]
  18. Feng, S.; Liu, C.; Zhu, J.; Xu, Y.; Xiao, X.; Guo, H. Realizing particle population inversion of 2.7 μm emission in heavy Er3+/Pr3+ co-doped low hydroxyl fluorotellurite glass for mid-infrared laser. Ceram. Int. 2023, 49, 20372–20380. [Google Scholar] [CrossRef]
  19. Zhang, C.; Cao, L.; Yun, C. Broadband 2.9 μm and 4.1 μm mid-infrared emission and energy transfer mechanisms in Ho3+/Yb3+ co-doped tellurite glasses. J. Lumin. 2023, 257, 119764. [Google Scholar] [CrossRef]
  20. Wang, C.; Tian, Y.; Gao, X.; Liu, Q.; Huang, F.; Li, B.; Zhang, J.; Xu, S. Investigation of broadband mid-infrared emission and quantitative analysis of Dy-Er energy transfer in tellurite glasses under different excitations. Opt. Express 2017, 25, 29512. [Google Scholar] [CrossRef]
  21. Zhang, Y.; Xia, L.; Shen, X.; Li, J.; Yang, G.; Zhou, Y. Broadband mid-infrared emission in Dy3+/Er3+ co-doped tellurite glass. J. Lumin. 2021, 236, 118078. [Google Scholar] [CrossRef]
  22. Fu, W.; Zhang, C.; Hou, G.; Xia, J.; Li, G.; Ping, Y.; Li, Z. Enhancing 1.8 μm emission from ultra-broadband Tm-Bi-Er tri-doped fluorotellurite glasses for fiber amplifiers and near-infrared lasers. Ceram. Int. 2019, 45, 14691–14696. [Google Scholar] [CrossRef]
  23. Marczewska, A.; Środa, M.; Nocuń, M. Thermal and spectroscopic characterization of gallium-tellurite glasses doped BaF2 and PbO. Opt. Commun. 2017, 464, 104–114. [Google Scholar]
  24. Zhang, C.; Han, K.; Zhou, D.; Xu, P.; Cao, J.; Song, C.; Huang, C.; Qiang, S. Research on energy transfer mechanism and 1 μm broadband luminescence properties in Nd3+/Yb3+ co-doped Bi2O3–B2O3–BaF2 glass. J. Lumin. 2022, 249, 119055. [Google Scholar] [CrossRef]
  25. Xu, R.; Tian, Y.; Hu, L.; Zhang, J. Enhanced emission of 2.7 μm pumped by laser diode from Er3+/Pr3+-codoped germanate glasses. Opt. Lett. 2011, 36, 1173–1175. [Google Scholar] [CrossRef]
  26. Guo, Y.; Gao, G.; Li, M.; Hu, L.; Zhang, J. Er3+-doped fluoro-tellurite glass: A new choice for 2.7 μm lasers. Mater. Lett. 2012, 80, 56–58. [Google Scholar] [CrossRef]
  27. Wang, S.; Yao, C.; Jia, Z.; Qin, G.; Qin, W. 1887 nm lasing in Tm3+-doped TeO2-BaF2-Y2O3 glass microstructured fibers. Opt. Mater. 2017, 66, 640–643. [Google Scholar] [CrossRef]
  28. Tian, Y.; Xu, R.; Hu, L.; Zhang, J. Broadband 2.84 μm luminescence properties and Judd-Ofelt analysis in Dy3+ doped ZrF4-BaF2-LaF3-AlF3-YF3 glass. J. Lumin. 2011, 132, 128–131. [Google Scholar] [CrossRef]
  29. Shen, L.; Wang, N.; Dou, A.; Cai, Y.; Tian, Y.; Huang, F.; Xu, S.; Zhang, J. Broadband ∼3 μm mid-infrared emission in Dy3+/Yb3+ co-doped germanate glasses. Opt. Mater. 2018, 75, 274–279. [Google Scholar] [CrossRef]
  30. Wang, T.; Huang, F.; Ren, G.; Cao, W.; Tian, Y.; Lei, R.; Zhang, J.; Xu, S. Broadband 2.9 μm emission and high energy transfer efficiency in Er3+/Dy3+ co-doped fluoroaluminate glass. Opt. Mater. 2018, 75, 875–879. [Google Scholar] [CrossRef]
  31. Sandrock, T.; Diening, A.; Huber, G. Laser emission of erbium-doped fluoride bulk glasses in the spectral range from 2.7 to 2.8 μm. Opt. Lett. 1999, 24, 382–384. [Google Scholar] [CrossRef] [PubMed]
  32. Ma, Y.; Guo, Y.; Huang, F.; Hu, L.; Zhang, J. Spectroscopic properties in Er3+ doped zinc- and tungsten-modified tellurite glasses for 2.7 μm laser materials. J. Lumin. 2014, 147, 372–377. [Google Scholar] [CrossRef]
  33. He, J.; Chen, L.; Li, H.; Niu, J.; Ma, Y. Novel 3.1 µm and enhanced 2.7 µm emissions in Er3+ doped fluorotellurite glasses ceramic. J. Alloys Compd. 2022, 895, 162606. [Google Scholar] [CrossRef]
  34. Zhang, C.; Yun, C.; Zhang, C.; Zhang, X.; Lai, S. Broadband 2.9 μm mid-infrared fluorescence behavior of Dy3+/Tm3+ co-doped zirconium fluoride glasses. Infrared Phys. Technol. 2022, 126, 104330. [Google Scholar] [CrossRef]
  35. Kochanowicz, M.; Lesniak, M.; Zmojda, J.; Miluski, P.; Baranowska, A.; Ragin, T.; Kuwik, M.; Pisarski, W.A.; Pisarska, J.; Dorosz, J.; et al. Structure, luminescence and energy transfer of fluoroindate glasses co-doped with Er3+/Ho3+. Ceram. Int. 2020, 46, 26403–26409. [Google Scholar] [CrossRef]
  36. Tarelho, L.V.G.; Gomes, L.; Ranieri, I.M. Determination of microscopic parameters for nonresonant energy-transfer processes in rare-earth-doped crystals. Phys. Rev. B 1997, 56, 14344–14351. [Google Scholar] [CrossRef]
  37. Li, M.; Bai, G.; Guo, Y.; Hu, L.; Zhang, J. Investigation on Tm3+-doped silicate glass for 1.8 μm emission. J. Lumin. 2012, 132, 1830–1835. [Google Scholar] [CrossRef]
  38. Han, K.; Zhang, P.; Wang, S.; Guo, Y.; Zhou, D.; Yu, F. Optical characterization of Tm3+ doped Bi2O3-GeO2-Ga2O3 glasses in absence and presence of BaF2. Sci. Rep. 2016, 6, 31207. [Google Scholar] [CrossRef]
Figure 1. DSC curves of host glass.
Photonics 10 01261 g001
Figure 2. (a) Absorption spectra of TB1–TB4 glasses at the range of 400–3300 nm and (b) absorption spectra of the host glass sample at the range of 2 μm–6.5 μm.
Photonics 10 01261 g002
Figure 3. Refractive index of glass samples.
Photonics 10 01261 g003
Figure 4. (a) Mid-infrared fluorescence spectra of TB1-4 glass samples with different concentrations of Er2O3 at the range of 2400–3700 nm. (b) The full width at half maximum (FWHM) of the TB1–4 glass samples.
Photonics 10 01261 g004
Figure 5. Fluorescence spectra of Er3+/Dy3+ co-doped TB1–4 glass samples at 1550 nm.
Photonics 10 01261 g005
Figure 6. Fluorescence decay lifetimes of Dy3+ at around 2.85 μm in TB1–4 glass samples and fitting results.
Photonics 10 01261 g006
Figure 7. The absorption and emission cross-sections of Dy3+ in TB3 at the 3 μm band.
Photonics 10 01261 g007
Figure 8. The gain curve in TB3 corresponds to the 6H13/26H15/2 transition of Dy3+.
Photonics 10 01261 g008
Figure 9. Energy level transition process diagram between Er3+ and Dy3+.
Photonics 10 01261 g009
Figure 10. Absorption and emission cross-sections of the donor (Er3+) and acceptor (Dy3+) in the ET2 process with N-phonon-assisted emission sidebands (N = 1, 2).
Photonics 10 01261 g010
Figure 11. (a) Raman spectra of the TB glass samples. (b) The intensity ratio between the 770 cm−1 and 660 cm−1 with different concentrations of Er2O3.
Photonics 10 01261 g011
Table 1. Judd–Ofelt parameters (Ωt × 10−20cm2, t = 2, 4, 6) of various Dy3+ doped glasses.
GlassJudd-Ofelt ParametersReference
Ω2Ω4Ω6
TB18.705242.073871.85788Current work
TB28.038173.046381.31024Current work
TB39.403481.76152.96142Current work
TB48.09362.422711.50231Current work
Al2O3-YF3-BaF21.291.381.0[11]
ZrF4-BaF2-LaF3-AlF3-YF33.161.672.45[28]
Table 2. Radiative properties of Dy3+: 6H13/26H15/2 in TB1–4 glasses.
SampleArad (s−1)τrad (ms)
TB192.3011.20
TB295.6010.80
TB398.8010.12
TB496.259.82
Disclaimer/Publisher’s Note: The statements, opinions and data contained in all publications are solely those of the individual author(s) and contributor(s) and not of MDPI and/or the editor(s). MDPI and/or the editor(s) disclaim responsibility for any injury to people or property resulting from any ideas, methods, instructions or products referred to in the content.

