Abstract
Infrared polarization imaging has demonstrated significant advantages in target detection and recognition in natural environments. While there have been numerous research achievements on medium-wave/long-wave infrared polarization in a single band, there is a lack of related conclusions on the characteristics of wide spectral two-color infrared polarization imaging. To address this gap, this article employs a theoretical model in infrared polarization imaging to investigate the influence of temperature, incident angle, and refractive index on polarization degree and polarization angle. These findings have been substantiated through discussions on experimental results. We conducted a comparative analysis between intensity imaging and polarization imaging within the framework of traditional single-band infrared imaging. We then delineated the benefits of dual-color infrared polarization imaging. Finally, we harnessed image registration fusion algorithms to amalgamate multiple-band images. Our findings demonstrate that this fusion technique not only enables penetration through water mist but also enhances target visibility, providing theoretical support for all-weather target detection and identification.
1. Introduction
When electromagnetic radiation is reflected and emitted by targets on the Earth’s surface and in the atmosphere, their own properties and the basic laws of optics give rise to polarization characteristics. Different objects or states (such as refractive index, roughness, water content, physical and chemical characteristics, etc.) exhibit different polarization states, which are closely related to the wavelength and form a polarization spectrum [1,2,3,4]. Infrared polarization imaging technology combines the advantages of infrared imaging and polarization imaging, utilizing not only the intensity information from target scene radiation and reflection but also the polarization information from target scene radiation and reflection. This technology enhances the detection and identification capabilities of imaging systems in complex backgrounds and holds great potential for further development [5,6,7,8,9,10,11,12].
In 2020, Yang M. et al. developed a polarization analyzer for medium-wave infrared cameras, enabling the acquisition of degree of polarization and polarization angle images at a frame frequency of 45 fps. This technology is particularly suitable for capturing the infrared polarization characteristics [13] of objects in dynamic scenes. In 2022, Shi et al. proposed a Stokes analytical model for rough surface infrared polarization (Dop) using a shadow function based on the bidirectional reflection distribution function of surface microelements (BRDF). Experimental results confirmed the consistency between the infrared polarization characteristics of the target and the theoretical analysis results [14]. In the same year, Liu et al. introduced a fusion method based on multi-decomposition latent low-rank representation (LatLRR) and combined it with a double simplified pulse-coupled neural network (D-SPCNN) to enhance detail layer fusion. This approach effectively preserves image details and achieves superior performance [15]. In 2014, Zhang et al. conducted a detailed study on the long-wave infrared polarization characteristics of various metal targets, including aluminum plates, iron plates, and aluminum plates coated with black paint or yellow-green camouflage. They analyzed and investigated the variation patterns of long-wave infrared polarization and polarization angle with respect to measured temperature [16]. In 2021, Li et al. proposed a novel road detection and tracking scheme that combines the differences in polarization characteristics, intensity, and time information in the long-wave infrared spectrum and background. They also created a manually annotated focal plane segmentation long-wave infrared road scene dataset, known as the LWIR DoFP road scene dataset (LDDRS). Experimental results demonstrated that this method outperformed two state-of-the-art real-time semantic segmentation networks, FANet-34 and SwiftNet, with improvements of 1.4% and 2.1% in terms of IoU, respectively [17]. In recent years, significant advancements have been made in infrared polarization detection, particularly in the areas of lens technology, detector design, and polarizing devices. However, due to limitations in the research and development of broadband infrared detectors, there is currently little research on the imaging characteristics of dual-color infrared and polarization for medium wave (3–5 microns) and long wave (8–14 microns) integrated optical paths [18].
Currently, there is a wealth of research on medium/long wave infrared polarization in a single band, but there is a lack of relevant conclusions regarding the characteristics of two-color infrared polarization imaging. Building upon the theory of traditional infrared polarization imaging modeling and experimentation, this study explores the characteristics of double-color infrared polarization imaging. A comparative analysis is conducted between traditional infrared intensity imaging and polarization imaging. Furthermore, we utilized an improved SIFT (scale-invariant feature transform) algorithm for image registration and a twin convolutional neural network image fusion algorithm based on similarity learning. The effectiveness of image fusion using multiple spectra after registration is verified, demonstrating its ability to penetrate water mist and enhance target visibility. These findings provide theoretical support for all-weather photoelectric detection and recognition technology.
2. Theoretical Model
The infrared polarization of ground objects is influenced by various factors, including their intrinsic properties, external environmental conditions, and detector conditions [19]. The infrared radiation that affects the polarization characteristics of the detected target consists of two components: one is emitted by the target itself, and the other is reflected from the target in response to environmental radiation. These components can be analyzed using Kirchhoff’s radiation theory and Planck’s blackbody radiation law [20,21]. According to Fresnel’s law of reflection, the reflected/spontaneous radiation from the target exhibits different polarization characteristics, which are influenced by factors such as incident angle, detection angle, and surface physicochemical properties [22].
To quantitatively analyze the infrared polarization characteristics of objects, it is necessary to develop a modeling approach. In this modeling approach, idealized assumptions are made: it is assumed that the infrared radiation emitted by the target and its surroundings follows Planck’s blackbody radiation law; the target surface is assumed to be perfectly smooth, and the infrared reflection and thermal radiation at the interface adhere to Fresnel’s law and Kirchhoff’s law; the ambient radiation is assumed to be natural light, and the radiation reflected into the detector is described as a point light source; the detector and polaroid responses are idealized without considering the influence of the air medium. The simplified analysis model of infrared polarization characteristics is illustrated in Figure 1.
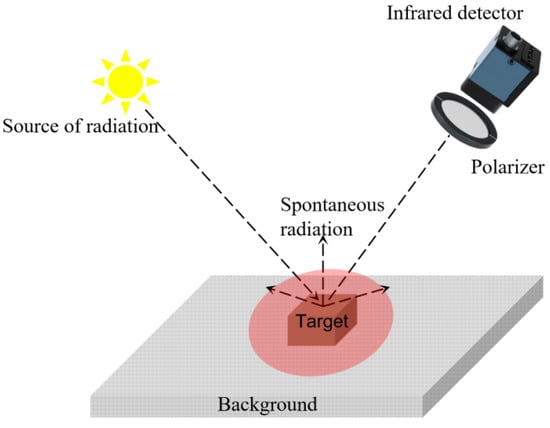
Figure 1.
Analytical model of infrared polarization characteristics.
According to Planck’s blackbody radiation law, the radiation source Mλb:
Then, the radiation amount I of a radiation source with a temperature of T is in a certain infrared band (T):
where h is the Planck constant, ; k is the Boltzmann constant, ; c is the speed of light, ; c1 is the first radiation constant, ; c2 is the second radiation constant, ; λ is the wavelength (μm), and T is the absolute temperature (K).
The thermal radiation emitted by an ideal blackbody radiation source is characterized by natural light, which can be decomposed into two mutually perpendicular polarization directions:
where Ip(T) is the amount of radiation in the horizontal direction, and Is(T) is the amount of radiation in the vertical direction.
According to Fresnel’s reflection law, the expression of reflectivity is as follows:
where Rp is the reflectance in the horizontal direction, and Rs is the reflectance in the vertical direction. θ1 represents the incidence angle, and θ2 represents the refractive angle. n1 represents the air refractive index, and n2 represents the target refractive index.
Assuming no infrared radiation passes through the target, according to Kirchhoff’s law, the emission rate of the target is equal to its absorption rate when the target is in thermal equilibrium:
where ε represents emissivity, and α represents absorption rate.
The infrared radiation emitted by the target comprises two components: infrared reflection and its inherent thermal radiation.
The calculation of the degree of polarization (Dop) and angle of polarization (Aop) is defined as follows [23]:
Among them, Es and Ep are the components of the electric field vector in the vertical and horizontal directions, respectively.
The refractive index of the air, n1 = 1, and the refractive index of the target is set to n2 = 4.56 − 28.5i. The wavelength range considered is in the medium-long wave band, from 3 to 14 µm. The ambient temperature is Te = 10 °C, and the target temperature To varies from −20 to 40 °C. Figure 2a,b illustrate the infrared polarization of the target with respect to the background temperature difference T at different incidence angles.
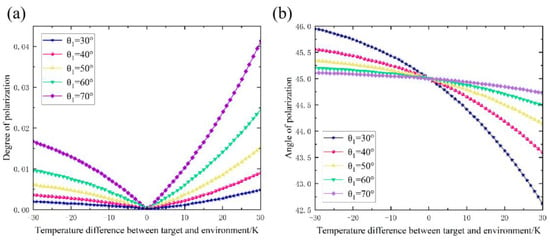
Figure 2.
Variation of degree of polarization and polarization angle with incident angle and temperature difference. (a) Dop versus incident angle and temperature difference. (b) Aop versus incident angle and temperature difference.
As shown in Figure 2a, the degree of polarization of the target increases with a greater temperature difference between the target and its surroundings. When the temperature difference is zero, the target loses its polarization. Furthermore, the degree of polarization of the target increases with a larger incident angle. However, even at a target temperature of 40 °C and an incident angle of 70°, the polarization degree of the target is only 0.04, considering the set target refractive index. At this point, we suspect the important factor affecting the polarization degree of the target to be the refractive index and will try to prove it.
Figure 2b demonstrates that the polarization angle of the target gradually decreases as the target temperature increases. Additionally, the degree of polarization angle reduction is greater with a larger incident angle. However, the variation in the polarization angle of the target is not significant, indicating that it is less influenced by temperature and incident angle.
The target temperature was set to 25 °C, and the ambient temperature was 10 °C. The incident angle, denoted as θ1, was set to 45°. The real part of the target refractive index, denoted as nr, was varied from 1 to 5, while the imaginary part, denoted as ni, was varied from 0 to 20. The target refractive index was calculated as n2 = nr − ni·i. The polarization change curve of the target with varying refractive index is shown in Figure 3a,b.

Figure 3.
Variation of Dop and Aop with target refractive index. (a) Change curve of target Dop with refractive index. (b) Change curve of target Aop with refractive index.
As depicted in Figure 3a, the degree of polarization increases as the real part of the refractive index increases when the imaginary part of the target refractive index is close to zero. When the real part of the refractive index equals 5, the degree of polarization exceeds 0.07. However, an increase in the imaginary part of the refractive index leads to a sharp decrease in the degree of polarization, becoming the primary factor influencing polarization. When the imaginary part of the refractive index reaches 20, the degree of polarization drops below 0.01. This observation also elucidates that, under identical conditions, the degree of polarization in metals is consistently lower than that in insulators. Figure 3b demonstrates that, as the imaginary part of the target refractive index approaches zero, the polarization angle gradually decreases with an increase in the real part of the refractive index. Conversely, when the imaginary part of the refractive index is greater than zero, the polarization angle increases with the imaginary part, indicating that both the real and imaginary parts of the refractive index impact the polarization angle.
3. Experiments
3.1. Long-Wave Infrared Imaging
Long-wave infrared images of three distinct targets (1.2.3) were captured at varying distances (D) and solar heights (H) to assess the contrast between the targets and the sky background. Imaging experiments were conducted during nighttime and under different visibility conditions (VIS). The detection wavelength is 8–14 μm, the resolution is 640 × 512, and NETD (Noise equivalent temperature difference) is ≤50 mk. The experimental setup and scenario are illustrated in Figure 4.

Figure 4.
Experimental setup and scene diagram: (a) target; (b) device; (c) daytime; (d) nighttime.
The radiation intensity of the brighter portion of the target and the sky background in the long-wave infrared image was extracted to calculate the contrast (c) data using the formula , where Io represents the target radiation intensity, and Ib represents the background radiation intensity, as illustrated in Figure 5.
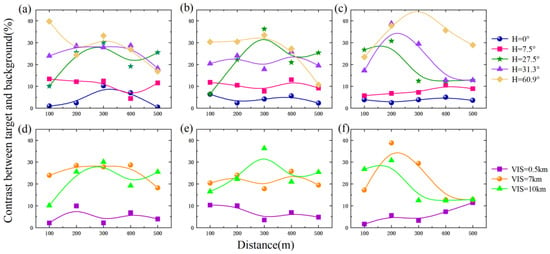
Figure 5.
Target infrared radiation contrast. (a) Contrast of target 1 under different H. (b) Contrast of target 2 under different H. (c) Contrast of target 3 under different H. (d) Contrast of target 1 under different VIS. (e) Contrast of target 2 under different VIS. (f) Contrast of target 3 under different VIS.
Figure 5a–c present the line diagram depicting the contrast of three targets at different times, corresponding to varying solar altitude angles and distances. The figure reveals that the contrast between the target and the background increases with a higher sun altitude angle. This is due to the stronger sunlight at noon, resulting in higher target temperatures and greater radiation energy. The contrast, however, remains relatively stable with increasing distance. Figure 5d–f illustrate the change in target contrast with distance at a similar solar altitude angle but different visibility conditions. It is evident from the figure that lower visibility leads to lower contrast, and the contrast does not significantly change with increasing detection distance. The mean contrast value of the three target materials shows no significant difference.
3.2. Two-Color Infrared Polarization Imaging
The distances were increased to 200–1000 m, and the bridge and lighthouse targets at sea were observed at different times (corresponding to different solar altitude angles). The bridge and lighthouse represent two different materials, metal and concrete, respectively. The experimental setup and detection targets are depicted in Figure 6a–c. The detection wavelength is 3–14 μm, the resolution is 640 × 512, and NETD is ≤40 mk. The polarizing element adopts a wide spectral band infrared gate polarizer, with an extinction ratio between 150:1 (3 µm) and 300:1 (14 µm) and an average transmittance greater than 70%. The polarizer is placed inside a high-speed rotating wheel and can achieve a rotational speed of 120°/8 ms. The two-color infrared contrast between the two targets was measured, and the results are presented in Figure 7.

Figure 6.
Experimental setup and scene diagram: (a) experimental device; (b) bridge target; (c) lighthouse target; (d) ship target.
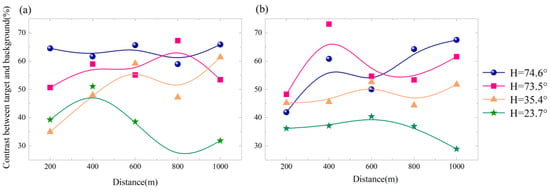
Figure 7.
Two-color infrared contrast images. (a) Detection target 1. (b) Detection target 2.
As illustrated in the figure, it can be observed that the contrast remains relatively stable as the distance increases, indicating that distance has minimal impact on the contrast. However, as the solar altitude angle increases, the contrast also increases, which aligns with the findings of previous long-wave infrared imaging experiments. This can be attributed to the fact that higher solar altitude angles result in greater light intensity and higher radiant heat from the target, leading to a larger difference in radiance between the target and the sky background and, consequently, a greater contrast between the target and the background in the image. In comparison to the previous long-wave infrared image, the two-color infrared image generally exhibits higher contrast between the target and the background. The contrast in the long-wave infrared image is concentrated below 40%, whereas the contrast in the two-color infrared image can exceed 70%. Therefore, two-color infrared imaging offers more advantages in target detection and recognition compared to single-band long-wave infrared imaging.
Infrared radiation intensity, degree of polarization, and polarization angle were measured throughout a 24 h period, encompassing both day and night. The detection target and background are shown in Figure 6d. The results are depicted in Figure 8.
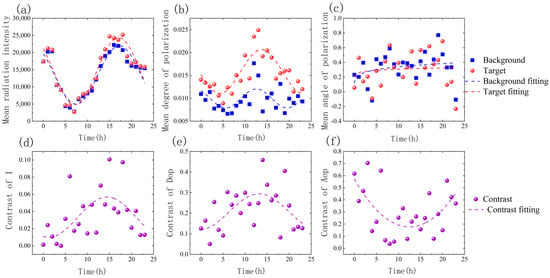
Figure 8.
Two-color infrared polarization characteristic curve of ship and sea surface background. (a) Radiation intensity. (b) Degree of polarization. (c) Angle of polarization. (d) Contrast of intensity. (e) Contrast of polarization. (f) Contrast of polarization angle.
As depicted in Figure 8a,d, the radiation intensity of the ship target surpasses that of the sea surface background. These intensity data serve as a foundation for distinguishing between the target and the background, with the temperature rise leading to an increased disparity in radiation intensity between the two. In Figure 8b,e the polarization of the ship target is significantly higher than that of the sea surface background, particularly during daylight hours, resulting in an average contrast increase from 0.035 in Figure 8d to 0.217 in Figure 8e. This heightened contrast can effectively aid in target identification. Due to the horizontal observation, as the solar altitude angle rises, so does the incident angle, leading to an increased temperature difference between the target and the background, consequently causing the degree of polarization to exhibit an upward trend. The polarization angle information, as shown in Figure 8c,f, experiences an increase due to the sensitivity of the polarization angle to external environmental interference and system noise. However, the contrast of the polarization angle between the target and the background tends to decrease with rising temperature. In order to obtain more stable and reliable polarization angle information, it is imperative to impose stricter requirements on external environmental conditions and system structural performance.
Images of distant islands under early morning sea fog were captured, revealing the target’s visible light, two-color infrared intensity, polarization degree, and polarization angle, as illustrated in Figure 9.

Figure 9.
Comparison targeting small islands (a) visible light, (b) dual band infrared intensity, (c) degree of polarization, and (d) angle of polarization.
The two-color infrared image exhibits a lower definition compared to the visible image due to the significant infrared absorption by water vapor. Nevertheless, the polarization degree and polarization angle images enhance the contrast and sharpness of the target in comparison to the original infrared image. In terms of daytime haze imaging, infrared polarization imaging serves as a valuable tool to compensate for the information deficiency in conventional infrared imaging.
As depicted in Figure 10, infrared imaging exhibits excellent detection capabilities during nighttime. The addition of polarization information in the infrared image proves particularly effective in detecting artificial targets such as buildings, windows, and metal support poles while reflecting low polarization characteristics for non-artificial targets like trees and land. In terms of nighttime imaging, infrared polarization not only enables all-weather detection and recognition but also aids in distinguishing between man-made and non-artificial objects based on their high-temperature and low-temperature signatures. Moreover, it facilitates camouflage detection and target recognition in special scenarios.

Figure 10.
Comparison between (a) visible light, (b) dual band infrared intensity, (c) degree of polarization, and (d) angle of polarization.
3.3. Multispectral Segment Fog Transmission Imaging and Fusion Processing
Utilizing the polarization properties of fog transmission, we employed a visible light polarization camera, as well as short-wave and long-wave infrared cameras, to detect vehicles under water mist conditions. Among them, visible light polarization cameras can achieve real-time acquisition of images of various polarization components within the visible light range, obtaining polarization angle and degree of polarization images for subsequent fusion work. The shortwave infrared camera achieves 9500–1700 nm imaging with a resolution of 640 × 512. To capture multi-angle and multidimensional information about the target, detection was conducted during different times of the day, specifically noon (strong light), dusk (strong light), and evening (low light), with a detection range of 50–150 m. The camera’s front water mist generation device was utilized to simulate real haze conditions. The experimental setup and the device are illustrated in Figure 11.
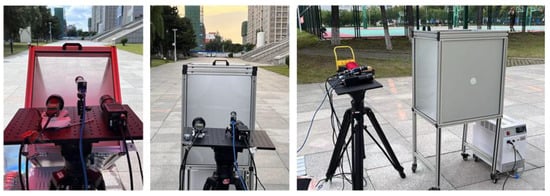
Figure 11.
Experimental setup and scene diagram.
In order to achieve registration between visible light and infrared images, it is necessary to address the disparity in perspective resulting from the use of different image acquisition equipment. To ensure spatial alignment and consistency between the two modalities, transformations such as scale, rotation, and translation are applied. For this purpose, a multimodal image registration method [24] utilizing an enhanced SIFT (scale-invariant feature transform) algorithm is employed. The registration process is depicted in Figure 12 below.
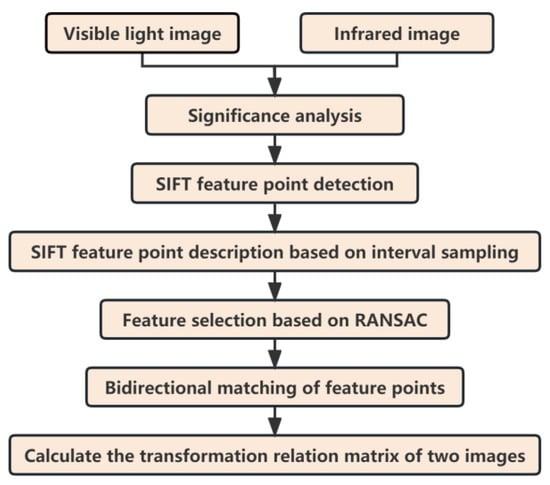
Figure 12.
Block diagram of multimodal image registration based on the improved SIFT algorithm.
Firstly, the saliency analysis technique is employed to identify crucial information within the image, resulting in the generation of a saliency map. Utilizing the saliency map, the regions of interest and non-interest are distinguished for both the visible light and infrared images. Subsequently, the SIFT detection algorithm is utilized to extract feature points from different regions of the visible light and infrared images. These extracted feature points are then described using an enhanced SIFT feature point descriptor generation method, which enhances the discriminative power of the feature points. Finally, based on the similarity of the feature point descriptors, corresponding feature points are identified on the visible light and infrared images. The RANSAC (Random Sample Consensus) is employed to refine and purify the matched feature points, ultimately yielding the matching results between the infrared and visible light images.
As depicted in Figure 13, the original image is decomposed into a low-frequency approximation image and four high-frequency detail images using a local extreme value multiscale decomposition technique. Each high-frequency image is further processed through a non-downsampled direction filter, resulting in four different direction filter detail coefficient matrices. The detail layers are then fed into a pre-trained twin network to extract deep features. The weighted normalized cross-correlation is computed between the resulting detailed feature map and the high-frequency coefficients. By combining the resulting weighted normalized intercorrelation matrix with the high-frequency coefficients, the fused high-frequency direction coefficients are obtained. Additionally, visual salience mapping is employed to fuse the low-frequency approximation images. Finally, the fused base and detail layers are subjected to a multiscale inverse transformation to generate the fusion image [25].
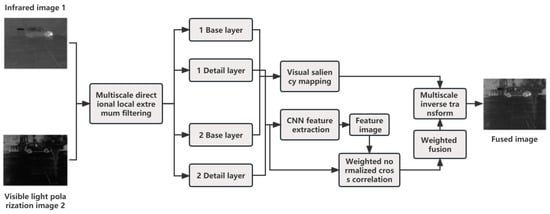
Figure 13.
Overall framework of the multispectral segment fusion enhancement algorithm.
The fusion and enhancement processed images are presented in Figure 14. Information extraction was performed on the fused image, and the mean of eight indicators of the image was obtained [26,27], as shown in Table 1.
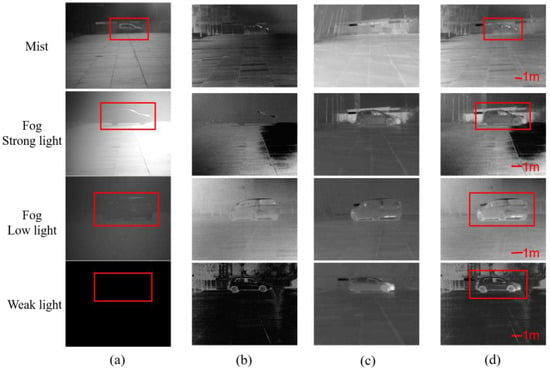
Figure 14.
Comparison of cars under different conditions (a) Visible light; (b) Polarization-enhanced image; (c) Infrared image after registration; (d) Fusion results.

Table 1.
Test data.
From the table, it is evident that larger standard deviation (SD) values and values for edge intensity (EI) and average gradient (AG) indicate a higher level of contrast and clearer details in the fused image. Furthermore, the entropy (EN) value can serve as an indicator of the information content within the fused image. Conversely, smaller values of root mean square error (RMSE) and cross-entropy (CE) signify that the fused image contains relatively minimal error and distortion. A reduced disparity between images implies greater information extraction from the source image.
In addition, higher values of peak signal-to-noise ratio (PSNR) signify a closer resemblance of the fused image to the source image, translating to a smaller amount of error introduced during fusion. Moreover, an elevated mutual information (MI) value in the fused image indicates a greater inheritance of information from the source image, resulting in an improved quality of the fused image.
The fusion image, which combines visible light, polarization, near-infrared, and long-wavelength infrared, exhibits exceptional adaptability to various environmental conditions, as corroborated by both subjective and objective evaluations. It not only excels in penetrating haze to reveal target details but also consistently delivers clear imaging under diverse lighting conditions throughout the day.
4. Discussion
In the simulation of infrared polarization characteristics, various factors such as target temperature, temperature difference between the target and the environment, incidence angle, and the real and imaginary parts of the refractive index of the target object have different degrees of influence on the degree of polarization and polarization angle. As the target temperature increases, the degree of polarization (Aop) decreases, while an increase in the temperature difference between the target and the background leads to an increase in the degree of polarization (Dop). When the incident angle (θ) increases, the degree of polarization increases, but the polarization angle decreases at a faster rate. When the imaginary part of the refractive index of the target is very small, the degree of polarization increases with the increase of the real part. In this case, the polarization angle gradually decreases with the increase of the real part of the refractive index. However, an increase in the imaginary part of the refractive index significantly reduces the degree of polarization, becoming the main factor affecting it. The polarization angle increases with the increase of the imaginary part.
In the experiment of long-wave infrared polarization imaging, the contrast between the target and the background increases as the solar altitude angle increases and decreases with decreasing visibility. By studying the multi-target imaging characteristics of long-wave infrared polarization at different times of the day, we also explore the characteristics of dual-color infrared polarization imaging. The contrast of the long-wave infrared image is less than 40%, while the contrast of the two-color infrared image can exceed 70%. Therefore, compared to single-band long-wave infrared imaging, two-color infrared imaging has more advantages in target detection and recognition. The difference in radiation intensity between the target and the background increases during the day, providing a basis for target and background identification. The average contrast in polarization information increases from 0.035 to 0.217, which can be better utilized for target identification. From the perspective of daytime haze imaging, dual-color infrared polarization imaging can compensate for the lack of information in traditional infrared imaging. From the perspective of night imaging, two-color infrared polarization can be used for all-weather detection and recognition and is more effective in distinguishing between man-made and non-man-made targets, high-temperature and low-temperature objects, as well as camouflage target detection and recognition in special scenes. This highlights the advantages of dual-color infrared polarization imaging in target detection and recognition.
Finally, an enhanced SIFT multimodal image registration method and a multispectral fusion enhancement algorithm are employed to register and fuse visible, near-infrared, long-wave infrared, and polarized images. Utilizing multiple sets of experimental data, we derived the mean values for eight image evaluation indicators. The outcomes consistently demonstrated that the fused image consistently attained optimal values across various indicator assessments. It effectively retained the original image’s information content while enhancing image contrast and enriching the details of the target. It has been demonstrated that the combination of images from multiple spectral bands can not only penetrate through water mist but also enhance the visibility of targets, thereby providing theoretical support for all-weather target detection and recognition. In the future, photoelectric detection technology will continue to evolve towards the integration of multiple spectral bands and the integration of multidimensional information.
5. Conclusions
Compared to the imaging characteristics summarized in current research findings, infrared medium wave, infrared long wave, and polarization all exhibit favorable effects. However, the imaging characteristics of wide-band infrared polarization detected simultaneously by medium wave and long wave have been less explored [28,29]. This study demonstrates its advantages in various climatic conditions, multiple time periods, diverse targets, and varying distances. The imaging characteristics of the wide-band medium and long waves are comprehensively analyzed. Due to the complexity of the experimental environment and the influence of factors such as detector response, the experimental cycle was condensed, resulting in a relatively small amount of data. In the future, we will continue to collect data under more diverse conditions, enhance the accuracy of the model, and reinforce the reliability of both the model simulation results and experimental findings.
Author Contributions
Conceptualization, Y.Z. and Q.F.; methodology, K.L.; software, J.Z.; validation, Y.Z., W.Y. and K.L.; formal analysis, W.Y.; investigation, W.Y.; resources, S.Z.; data curation, Q.F.; writing—original draft preparation, S.Z.; writing—review and editing, Y.Z.; visualization, J.Z.; supervision, H.Y.; project administration, H.S.; funding acquisition, Y.L. All authors have read and agreed to the published version of the manuscript.
Funding
Supported by the specific research fund of The Innovation Platform for Academicians of Hainan Province (YSPTZX202127); Research on Polarization Imaging Detection and Recognition Technology Based on Multispectral Segment Fusion (JCKY2023230C009); National Natural Science Foundation of China (61890960, 61890963, JJKH20220744KJ, 62127813).
Institutional Review Board Statement
Not applicable.
Informed Consent Statement
Not applicable.
Data Availability Statement
All data results have been presented in the article.
Acknowledgments
Thank you for the support of the China Natural Science Foundation and the contributions of all partners.
Conflicts of Interest
The authors declare no conflict of interest.
References
- Samson, J.C.; Olson, J.V. Some comments on the descriptions of the polarization states of waves. Geophys. J. Int. 1980, 61, 115–129. [Google Scholar]
- Esteban, J.M.; Ray, D. On the measurement of polarization. Econom. J. Econom. Soc. 1994, 62, 819–851. [Google Scholar] [CrossRef]
- Chen, W.; Wang, S.; Jin, W.; Li, J. Research of infrared polarization characteristics based on polarization micro-surface theory. J. Infrared Millim. Waves 2014, 33, 507–514. [Google Scholar]
- Wang, K.; Fu, Q.; Wang, B.; Shi, H.; Liu, J.; Wang, Q.; Wang, C. Simplified analysis and suppression of polarization aberration in planar symmetric optical systems. Opt. Express 2023, 31, 30750–30766. [Google Scholar]
- Cremer, F.; De Jong, W.; Schutte, K. Infrared polarization measurements and modeling applied to surface-laid antipersonnel landmines. Opt. Eng. 2002, 41, 1021–1032. [Google Scholar]
- Cooper, A.W.; Lentz, W.J.; Walker, P.L.; Chan, P.M. Infrared polarization measurements of ship signatures and background contrast. In Characterization and Propagation of Sources and Backgrounds; SPIE: Bellingham, WA, USA, 1994; Volume 2223, pp. 300–309. [Google Scholar]
- Nee, T.W.; Nee, S.M.F. Infrared polarization signatures for targets. In Targets and Backgrounds: Characterization and Representation; SPIE: Bellingham, WA, USA, 1995; Volume 2469, pp. 231–241. [Google Scholar]
- Sandus, O. A review of emission polarization. Appl. Opt. 1965, 4, 1634–1642. [Google Scholar] [CrossRef]
- Jordan, D.L.; Lewis, G. Measurements of the effect of surface roughness on the polarization state of thermally emitted radiation. Opt. Lett. 1994, 19, 692–694. [Google Scholar] [CrossRef]
- Sun, H.; Ma, L.; Fu, Q.; Li, Y.; Shi, H.; Liu, Z.; Liu, J.; Wang, J.; Jiang, H. Long-Wave Infrared Polarization-Based Airborne Marine Oil Spill Detection and Identification Technology. Photonics 2023, 10, 588. [Google Scholar]
- Jiang, H.; Fu, Q.; Duan, J. Research on Infrared Polarization Imaging Detection Technology and Application. Infrared Technol. 2014, 36, 345–349. [Google Scholar]
- Tao, H.; Lv, J.; Liang, J.; Zhao, B.; Chen, Y.; Zheng, K.; Zhao, Y.; Wang, W.; Qin, Y.; Liu, G.; et al. Polarization Snapshot Imaging Spectrometer for Infrared Range. Photonics 2023, 10, 566. [Google Scholar]
- Yang, M.; Xu, W.; Sun, Z.; Wu, H.; Tian, Y.; Li, L. Mid-wave infrared polarization imaging system for detecting moving scene. Opt. Lett. 2020, 45, 5884–5887. [Google Scholar] [CrossRef]
- Shi, H.; Liu, Y.; He, C.; Wang, C.; Li, Y.; Zhang, Y. Analysis of infrared polarization properties of targets with rough surfaces. Opt. Laser Technol. 2022, 151, 108069. [Google Scholar] [CrossRef]
- Liu, X.; Wang, L. Infrared polarization and intensity image fusion method based on multi-decomposition LatLRR. Infrared Phys. Technol. 2022, 123, 104129. [Google Scholar] [CrossRef]
- Zhang, Y.; Han, J.T.; Li, J.; Yang, W.P.; Gong, T. Characteristics analysis of infrared polarization for several typical artificial objects. In Image and Signal Processing for Remote Sensing XX; SPIE: Bellingham, WA, USA, 2014; Volume 9244, pp. 146–156. [Google Scholar]
- Li, N.; Zhao, Y.; Pan, Q.; Kong, S.G.; Chan, J.C.W. Illumination-invariant road detection and tracking using LWIR polarization characteristics. ISPRS J. Photogramm. Remote Sens. 2021, 180, 357–369. [Google Scholar] [CrossRef]
- Song, M.; He, C.; Ji, Y.; Zhou, Z.; Sang, X.; Li, J.; Liu, M. Simulation Technology for Medium and Long Wave Dual Color Targets and Interference. Infrared Laser Eng. 2022, 51, 20210208. [Google Scholar] [CrossRef]
- Zhang, J.; Zhang, Y.; Shi, Z. Study and modeling of infrared polarization characteristics based on sea scene in long wave band. J. Infrared Millim. Waves 2018, 37, 586–594. [Google Scholar]
- Jun, S.; Krishnamurthy, K.; Irudayaraj, J.; Demirci, A.; Pan, Z.; Atungulu, G.G. Fundamentals and theory of infrared radiation. In Infrared Heating for Food and Agricultural Processing; Pan, Z., Atungulu, G.G., Eds.; CRC Press: Boca Raton, FL, USA, 2010; pp. 1–18. [Google Scholar]
- Wang, Z.; Qiao, Y.; Hong, J.; Wang, F.; Li, W. Identification of camouflage targets using thermal infrared polarization imaging techniques. Infrared Laser Eng. 2007, 36, 853–856. [Google Scholar]
- Stegeman, G.I.; Glass, N.E.; Maradudin, A.A.; Shen, T.P.; Wallis, R.F. Fresnel relations for surface polaritons at interfaces. Opt. Lett. 1983, 8, 626–628. [Google Scholar] [CrossRef]
- Li, X.; Yao, Z.; He, T.; Li, S.; Chen, A. Research on Partially Polarized Light Decomposition. Space Electron. Technol. 2020, 17, 4. [Google Scholar] [CrossRef]
- Zhang, C. CME Image Registration Study Based on SIFT Feature Point Matchin. Master’s Thesis, Kunming University of Science and Technology, Kunming, China, 2020. [Google Scholar] [CrossRef]
- Li, H.; Wu, X.J.; Kittler, J. RFN-Nest: An end-to-end residual fusion network for infrared and visible images. Inf. Fusion 2021, 73, 72–86. [Google Scholar] [CrossRef]
- Bavirisetti, D.P.; Xiao, G.; Zhao, J.; Dhuli, R.; Liu, G. Multi-scale Guided Image and Video Fusion: A Fast and Efficient Approach. Circuits Syst. Signal Process. 2019, 38, 5576–5605. [Google Scholar] [CrossRef]
- Sun, B.; Gao, Y.; Zhuge, W.; Wang, Z. Analysis of quality evaluation indicators for visible light and infrared image fusion. J. Image Graph. China 2023, 28, 12. [Google Scholar]
- Nie, J.; Wang, Z. Overview of infrared polarization imaging detection technology. Infrared Technol. 2006, 28, 5. [Google Scholar] [CrossRef]
- Xia, Y.H.; Luo, S.J.; Bao, T.Z.; Song, P.S.; Qiao, Y.H. Research progress of infrared polarization in target detection and recognition. Laser Infrared 2016, 46, 909–915. [Google Scholar]
Disclaimer/Publisher’s Note: The statements, opinions and data contained in all publications are solely those of the individual author(s) and contributor(s) and not of MDPI and/or the editor(s). MDPI and/or the editor(s) disclaim responsibility for any injury to people or property resulting from any ideas, methods, instructions or products referred to in the content. |
© 2023 by the authors. Licensee MDPI, Basel, Switzerland. This article is an open access article distributed under the terms and conditions of the Creative Commons Attribution (CC BY) license (https://creativecommons.org/licenses/by/4.0/).